Embed Size (px)
Citation preview

Determination of PolychlorinatedDibenzo-p-dioxins (PCDD) andPolychlorinated Dibenzofurans (PCDF) in Foodstuffs and Animal Feed using the Agilent 7000 Triple QuadrupoleGC/MS System
Authors
Prof. Dr. Peter Fürst
Dr. Thorsten Bernsmann
Dominik Baumeister
Chemical and Veterinary Analytical
Institute
Münsterland-Emscher-Lippe
(Chemisches und Veterinär-
untersuchungsamt, CVUA-MEL)
Joseph-König-Str. 40
48147 Münster
Germany
Chris Sandy
Agilent Technologies UK Ltd
610 Wharfedale Road
Winnersh Triangle
Wokingham
Berkshire
RG41 5TP
UK
Application Note
Food Safety
Abstract
A method has been developed on the Agilent 7000 GC Triple Quadrupole GC/MS
system for the analysis of polychlorinated dibenzo-p-dioxins (PCDD) and polychlori-
nated dibenzofurans (PCDF) in foodstuffs and animal feed. The method was shown to
give linear response over the required concentration range, good repeatability of
response and quantitation down to low pg TEQ/g levels.

2
The maximum levels for PCDD, PCDF, and dl-PCB in certainfoodstuffs as prescribed by EU legislation are given in Table 2.
This application note describes a sensitive and reproduciblemethod that meets the requirements of EU Legislation for thescreening of PCDD and PCDF in foodstuffs using the Agilent7000 Triple Quadrupole GC/MS/MS system.
Introduction
Polychlorinated dibenzo-p-dioxins (PCDD) and polychlorinateddibenzofurans (PCDF) are highly toxic persistent organic pol-lutants (POP) with properties that are detrimental to humanhealth and have been linked to causing cancer, endocrine dis-ruption, and reproductive disorders. PCDD and PCDF are notmanufactured deliberately but are the byproducts of the com-bustion of contaminated chemical waste, chemical and pesti-cide manufacturing, pulp and paper bleaching processes andother sources. PCDD and PCDF are lipophilic chemicals thataccumulate in the fatty tissues of animals that form part ofthe human food chain. It is estimated that more than 80% ofhuman exposure to dioxins derives from food of animal origin.
There have been several incidents of dioxin contamination inthe human food chain over the past 20 years. One of the mostrecent was in December 2008 when contaminated pork andbeef products were discovered in the Republic of Ireland [1]during routine testing.
Current legislation in the United States [2] and the EuropeanUnion, [3,4] requires the confirmation and quantitation ofdioxins, furans, and dioxin-like polychlorinated biphenyls (dl-PCBs) in foodstuffs and animal feed by isotope dilution capil-lary gas chromatography/ high resolution mass spectrometry(GC/HRMS). Additionally, EU Legislation does make provi-sions for the screening of dioxins in foodstuffs and animalfeed by other mass spectrometric techniques or by bio-assays. The specific compounds covered by the EULegislation are shown in Table 1, along with the ToxicEquivalency Factors (TEF) relating the toxicity of each individ-ual analyte to 2,3,7,8 tetrachlorodibenzo-p-dioxin (2,3,7,8-TCDD), which is assigned a TEF value of 1. The individual con-centration of each dioxin, furan, and dl-PCB found in foodstuffand animal feed samples is multiplied with the respective TEFand after summation the total concentration is expressed asthe Toxic Equivalent (TEQ) in terms of pg TEQ/g fat .
Table 1. PCDD, PCDF and dl-PCB congeners specified in EU Legislationalong with the TEF values stipulated in 1998 and 2005. (WHO05changes indicated in italics)
Table 2. Maximum Levels for PCDD, PCDF and Dioxin-like PCB in Certain Foodstuffs, as Specified in EU Regulation (EC) No 1881/2006
Maximum levelsSum of Dioxins and
Sum of Dioxins dl-PCB (WHO-PCDD/ (WHO-PCDD/
Foodstuff F-TEQ) F-PCB-TEQ)
Meat and meat products (excluding edible offal) of the following animals :
Bovine animals and sheep 3.0 pg/g fat 4.5 pg/g fatPoultry 2.0 pg/g fat 4.0 pg/g fatPigs 1.0 pg/g fat 1.5 pg/g fatRaw milk and dairy products, including butter fat 3.0 pg/g fat 6.0 pg/g fatHens’ eggs and egg products 3.0 pg/g fat 6.0 pg/g fat
Compound
TEF WHO98
TEF WHO05 Compound
TEF WHO98
TEF WHO05
Chlorinated dibenzo-p-dioxins
Non-ortho substituted PCBs
2378-TCDD 1 1 PCB-77 0.0001 0.0001
12378-PeCDD 1 1 PCB-81 0.0001 0.0003
123478-HxCDD 0.1 0.1 PCB-126 0.1 0.1
123678-HxCDD 0.1 0.1 PCB-169 0.01 0.03
123789-HxCDD 0.1 0.1
1234678-HpCDD 0.01 0.01
OCDD 0.0001 0.0003
Chlorinated dibenzofurans
Mono-ortho substituted PCBs
2378-TCDF 0.1 0.1 PCB-105 0.0001 0.00003
12378-PeCDF 0.05 0.03 PCB-114 0.0005 0.00003
23478-PeCDF 0.5 0.3 PCB-118 0.0001 0.00003
123478-HxCDF 0.1 0.1 PCB-123 0.0001 0.00003
123678-HxCDF 0.1 0.1 PCB-156 0.0005 0.00003
234678-HxCDF 0.1 0.1 PCB-157 0.0005 0.00003
123789-HxCDF 0.1 0.1 PCB-167 0.00001 0.00003
1234678-HpCDF 0.01 0.01 PCB-189 0.0001 0.00003
1234789-HpCDF 0.01 0.01
OCDF 0.0001 0.0003

3
Experimental
Calibration StandardsNative PCDD and PCDF calibration mixtures and their 13C-isotope labeled internal standards were obtained fromCambridge Isotope Laboratories and Wellington LaboratoriesInc.
Sample Preparation and Analysis The most frequently used methods for the determination ofPCDD/PCDF and dl-PCB in foodstuffs and animal feed com-bine fat extraction (for example, Soxhlet or extraction withorganic solvents) with cleanup steps using different columnchromatographies, such as silica gel coated with sulphuricacid, florisil, alumina, and active carbon. The isotope labeledanalogues of all PCDD/PCDF with 2,3,7,8-chlorine substitu-tion were added at the beginning of the extraction. Theextract was collected as three fractions containing dioxins(2), mono-ortho-PCB and indicator PCB (1a), and non-orthoPCBs (1b), by eluting with various solvents. After addition of asyringe spike (13C12 -1,2,3,4-TCDD), the extracts were evapo-rated under a gentle stream of nitrogen, reconstituted withtoluene, and analyzed with GC/MS/MS. The dioxin fractionwas reconstituted with 20 µL of toluene, the non-ortho PCBfraction in 40 µL of toluene and the mono-ortho and indicatorPCB fraction in 250 µL of toluene.
A flow diagram summarizing the sample preparation steps isshown in Figure 1.
Sample extraction:Soxhlet or ASE with toluene/acetone 7/3 or hexaneAddition of 13C-isotope labeled internal standards
Sulphuric acid coated silica column: removal of fatElution of PCDD/F/PCB analytes with hexane
Florisil column: separation of PCDD/F and PCBPCB elution with hexane (1)
PCDD/F elution with toluene (2)
1. PCBcleanup and separation
with active carbon:1a.) mono-ortho PCB/ ndl PCB
with dichloromethane/cyclohexane (1/1)
1.b) non-ortho PCBs with toluene
2. PCDD/Fcleanup
with active carbon
1 2
Figure 1. Flow diagram of the sample extraction and cleanup procedures.

4
Table 3. Gas Chromatograph and Mass Spectrometer Conditions
GC ConditionsColumn (1) 2.0 m x 0.25 mm uncoated siltek deactivated
fused silicaPressure controlled tee Agilent p/n G3186B Column (2) Agilent J&W DB-5ms UI 60 m × 0.25 mm, 0.25 µm
(122-5562UI) Back Flush time 15.0 minutes after injection Back flush flow rate Column (1) - 5.0 mL/min, concurrent back flush Injection 2 µL cold pulsed splitless using CO2 cooled
Multi Mode Inlet (MMI) Inlet temperature program 100 °C (0.05 min), 600 °C/min to 300 °CInjection Pulse Pressure 30 psi until 1.0 minPurge Flow to Split Vent 40 mL/min at 1.5 min Carrier Gas Helium, Column (1) constant flow 0.9 mL/min
Helium, Column (2) constant flow 1.0 mL/min RTL Compound PCB 105, Locked RT = 34.0 minutes Oven program 130 °C (2.0 min hold), 10 °C/min to 200 °C
(16 min), 5 deg °C/min to 235 °C (7 min), 5 °C/min to 350 °C
MS Transfer line temp 300 °C
MS ConditionsTune EI Autotune Gain 100 MS1 Resolution WideMS2 Resolution WideDwell Times Natives 75 ms, Labeled compounds 25 ms Collision Energies Table 4 Collision cell gas flows Nitrogen at 1.5 mL/min, helium at 2.25 mL/minMS Temperatures Ion source 280 °C, quadrupoles 150 °C Solvent delay 25.0 minutes
CO2MMI
PCM
PurgedUtimateUnion0.9 mL/min
constant flow
G3186B
1.0 mL/minconstant flow
7000BTQ
2.0m × 0.25 mm iduncoated deactivatedfused silica
7890A
60 m × 0.25 mm, 0.25 µmAgilent J&W DB 5-ms UI(122-5662UI)
Figure 2. Schematic diagram of the GC/MS/MS hardware.
The analysis was performed on an Agilent 7000 TripleQuadrupole GC/MS system with an Agilent 7890 GC. The7890 GC was configured with a carbon dioxide cooled Multi-mode Inlet (MMI), a 2 m × 0.25 mm id uncoated deactivatedcapillary column linked to a pressure controlled tee (PCT) andan Agilent J&W DB-5ms UI 60 m × 0.25 mm, 0.25 µm capillarycolumn. The chromatographic method was retention timelocked (in direct connect mode) using PCB 105 to a retentiontime of 34.0 minutes.
The instrument conditions are listed in Table 3. A schematicdiagram of the GC/MS/MS system is shown in Figure 2. The7000 Triple Quadrupole GC/MS was operated in MS/MS-EI(electron ionization) Multiple Reaction Monitoring (MRM)mode. Each analyte and its associated 13C-Internal standardwas measured using two precursor ions and two differentproduct ions. A full list of the analyte retention times andMRM settings are given in Table 4. The MRM settings consistof five time segments, each segment monitoring the tetra,penta, hexa, hepta, and octa dioxin and furan isomers, respec-tively. Dwell times were set to 75 ms for the native analytesand to 25 ms for all internal standards.
An Agilent 7693 Automatic Liquid Sampler with the samplertray cooled to 5 °C was used to make 2-µL pulsed cold split-less injections using a 10-µL syringe.

5
Table 4. MS/MS Settings for PCDD, PCDF and 13C-Internal Standards
Segment start Peak RT Quant Qual TS time (min) number Analyte (min) precursor Product CE (V) precursor Product CE (V)
1 25.01 13C-2378-TCDF 35.43 315.9 251.9 33 317.9 253.9 332 2378-TCDF 35.47 303.9 240.9 33 305.9 242.9 333 13C-1234-TCDD 35.77 331.9 267.9 24 333.9 269.9 244 13C-2378-TCDD 36.79 331.9 267.9 24 333.9 269.9 245 2378-TCDD 36.80 319.9 256.9 24 321.9 258.9 24
2 40.06 13C-12378-PeCDF 42.55 351.9 287.9 35 349.9 285.9 357 12378-PeCDF 42.56 339.9 276.9 35 337.9 274.9 358 13C-23478-PeCDF 44.00 351.9 287.9 35 349.9 285.9 359 23478-PeCDF 44.02 339.9 276.9 35 337.9 274.9 35
10 13C-12378-PeCDD 44.45 365.9 301.9 25 367.9 303.9 2511 12378-PeCDD 44.48 355.9 292.9 25 353.9 290.9 25
3 46.012 13C-123478-HxCDF 48.04 385.8 321.9 35 387.8 323.9 3513 123478-HxCDF 48.06 373.8 310.9 35 375.8 312.9 3514 13C-123678-HxCDF 48.21 385.8 321.9 35 387.8 323.9 3515 123678-HxCDF 48.22 373.8 310.9 35 375.8 312.9 3516 13C-234678HxCDF 48.96 385.8 321.9 35 387.8 323.9 3517 234678-HxCDF 48.97 373.8 310.9 35 375.8 312.9 3518 13C-123478-HxCDD 49.17 403.8 339.8 25 401.8 337.9 2519 123478-HxCDD 49.19 389.8 326.9 25 391.8 328.8 2520 13C-123678-HxCDD 49.30 403.8 339.8 25 401.8 337.9 2521 123678-HxCDD 49.32 389.8 326.9 25 391.8 328.8 2522 13C-123789HxCDD 49.63 403.8 339.8 25 401.8 337.9 2523 123789-HxCDD 49.65 389.8 326.9 25 391.8 328.8 2524 13C-123789-HxCDF 50.04 385.8 321.9 35 387.8 323.9 3525 123789-HxCDF 50.06 373.8 310.9 35 375.8 312.9 35
4 51.026 13C-1234678-HpCDF 51.84 419.8 355.8 36 421.8 357.8 3627 1234678-HpCDF 51.86 409.8 346.8 36 407.8 344.8 3628 13C-1234678-HpCDD 53.11 437.8 373.8 25 435.8 371.8 2529 1234678-HpCDD 53.13 423.8 360.8 25 425.8 362.8 2530 13C-1234789-HpCDF 53.69 419.8 355.8 36 421.8 357.8 3631 1234789-HpCDF 53.70 407.8 344.8 36 409.8 346.8 36
5 55.032 13C-OCDD 56.23 469.7 405.8 26 471.7 407.8 2633 OCDD 56.24 457.7 394.8 26 459.7 396.8 2634 13C-OCDF 56.41 453.7 389.8 35 455.7 391.8 3535 OCDF 56.42 441.7 378.8 35 443.7 380.8 35
Capillary flow technology and backflushing have proven to beinvaluable tools in improving method robustness and chro-matographic integrity for GC/MS analysis of samples withhigh matrix content [5]. Backflushing removes high-boilingmatrix components from the system that would otherwiseremain behind from injection to injection, causing retentiontime shifts, loss of chromatographic peak shapes, and even-tual contamination of the mass spectrometer ion source.
The 2-m precolumn and pressure controlled tee (PCT) wereused to provide concurrent backflushing of the precolumnduring the chromatographic run. Concurrent backflushing is atechnique that works well in methods employing long (60 m)capillary columns that cannot be efficiently backflushed inpostrun mode using a post-column connection to the PCT.The flow rate in the precolumn is reversed once all the ana-lytes of interest have moved in to the 60-m analytical column.This is implemented by automatically reducing the pressure atthe MMI 15 minutes after the sample injection takes place,which was determined experimentally by a sequence of stan-dard injections with varying backflush times.

6
Results and Discussion
Chromatography The chromatographic separation of the native PCDD andPCDF congeners is shown in Figure 3. The peak numbers referto the entries in Table 4. The chromatographic run time foreach sample was 60 minutes.
Linearity of Response and Sensitivity
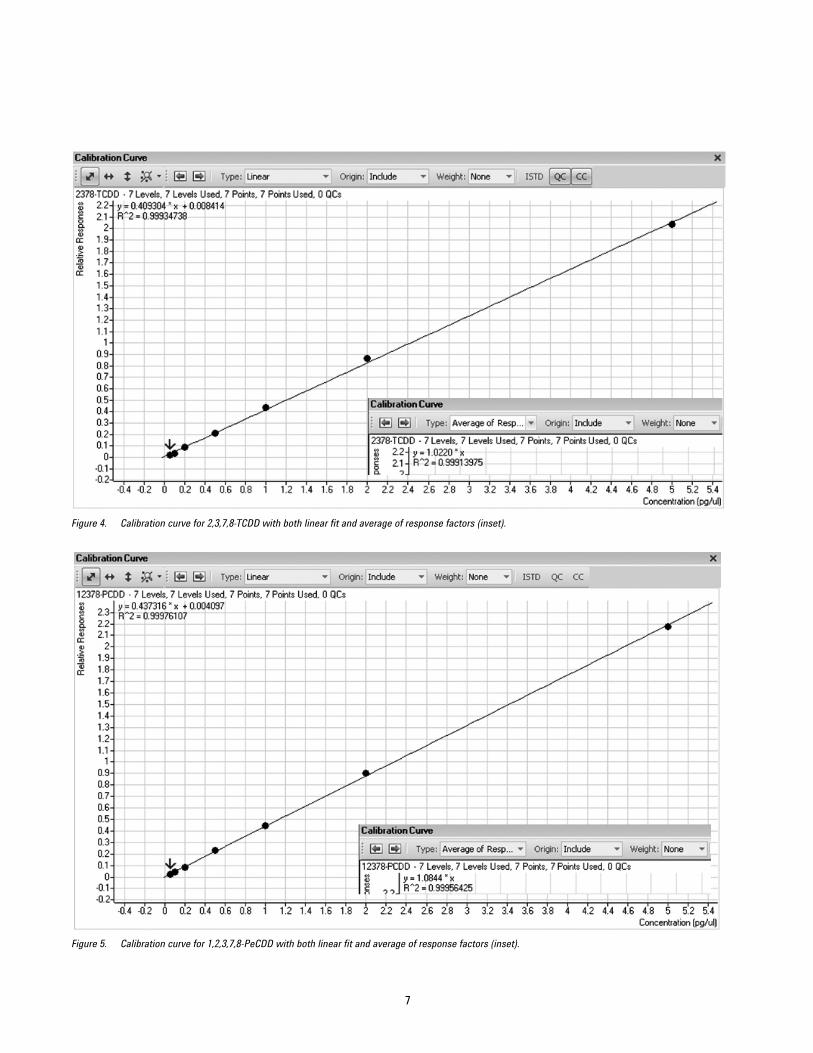
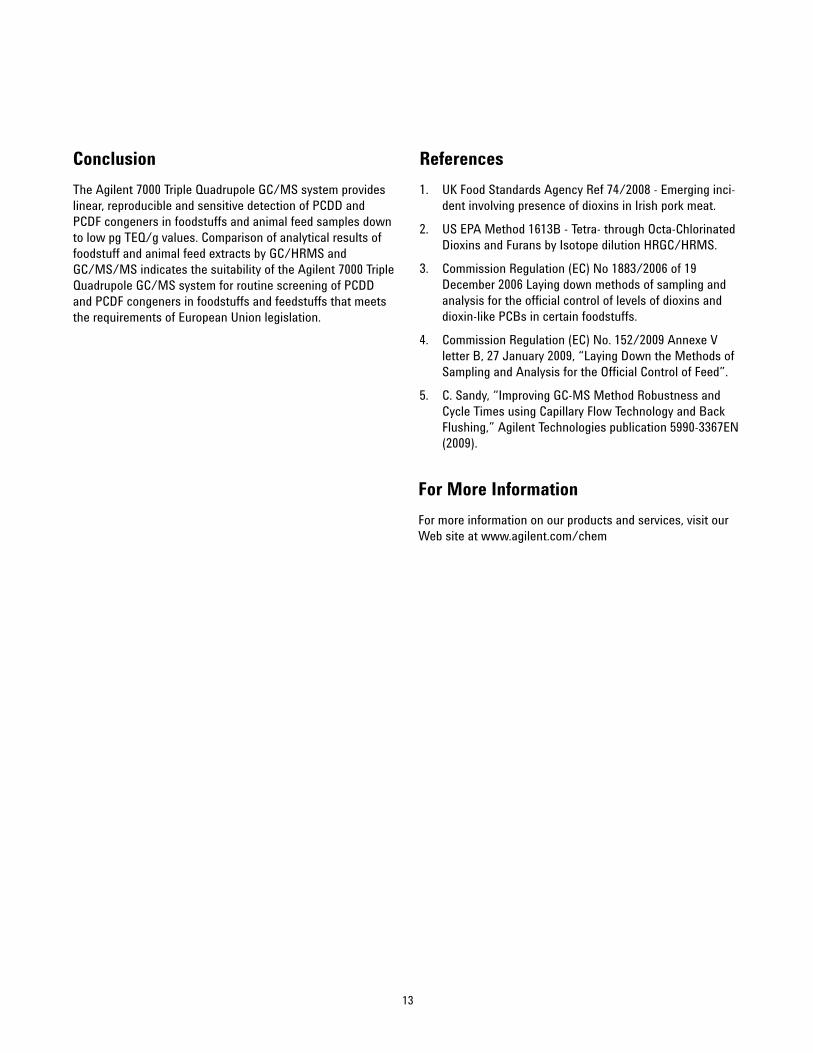
The PCDD and PCDF were measured using 13C-labeled inter-nal standard (ISTD) calibration. The seven-point ISTD calibra-tion curves for 2,3,7,8-TCDD and 1,2,3,7,8-PeCDD are shown inFigures 4 and 5, respectively. Excellent linearity is shown for 2 µL injections of the calibration standards over the concen-tration range of 0.05 pg/µL to 5 pg/µL with R2 values > 0.999.The insets in Figures 4 and 5 show the R2 values for the aver-age of response factors for these two dioxin congeners.
Figure 3. MRM chromatograms of native PCDD and PCDF congeners. (Peak numbers refer to analytes listed in Table 4).
2
5
7 9
11
1315 17 25
19 21 23
27 31
29
33
35
7
Figure 4. Calibration curve for 2,3,7,8-TCDD with both linear fit and average of response factors (inset).
Figure 5. Calibration curve for 1,2,3,7,8-PeCDD with both linear fit and average of response factors (inset).

8
The linear calibration curve fits for all 17 PCDD and PCDFcongeners are shown in Table 5.
The selected reaction monitoring (MRM) chromatograms forthe native PCDD and PCDF congeners for the lowest calibrationstandard (0.1 pg on-column) are shown in Figure 6.
Peak Area Precision and Peak Area RatioPrecision
The peak area precision (raw peak area) for the native PCDDand PCDF congeners was determined by spiking a pork fatextract with native PCDD and PCDF at a concentration of 100fg/µL and 13C-ISTD at 1pg/µL, respectively. A sequence ofreplicate 2-µL cold pulsed splitless injections (n = 15) wasmade. The %RSD values for the peak areas of native PCDD/PCDF and 13C-ISTD are shown in Figure 7. All native con-geners gave precision values less than 10% except for1,2,3,4,6,7,8-HpCDD, which gave a value of 11.9 %. Thisslightly higher result may be attributed to the somewhatlower absolute response of this particular analyte. The 13C-ISTD gave %RSD values of 5% or lower.
Table 5. Linear Correlation Coefficients for Seven-Point ISTD CalibrationCurves over the Range 100 fg – 10 pg Injected. * (OCDD 500 fg –50 pg injected)
Analyte R2 Analyte R2
2378-TCDD 0.99934 2378-TCDF 0.9998412378-PeCDD 0.99976 12378-PeCDF 0.99909123478-HxCDD 0.99994 23478-PeCDF 0.99995123678-HxCDD 0.99905 123478-HxCDF 0.99971123789-HxCDD 0.99977 123678-HxCDF 0.999831234678-HpCDD 0.99945 234678-HxCDF 0.99953OCDD* 0.99780 123789-HxCDF 0.99972
1234678-HpCDF 0.999711234789-HpCDF 0.99991OCDF 0.99907
Figure 6. MRM chromatograms of native PCDD and PCDF congeners. Lowest calibration standard, 100 fg injected on-column (OCDD 500 fg injected on-column).

9
The peak area ratio precision (analyte peak area divided by its13C-ISTD peak area) was also determined for the 15 replicateinjections. The %RSD values for the ratio of peak areas areshown in Figure 8. All analytes gave precision values lessthan 10% except for 1,2,3,4,6,7,8-HpCDD, which gave a %RSDvalue of 13.6 %.
Figure 8. Repeatability of response ratios for native PCDD and PCDF congeners (n=15).
Figure 7. Repeatability of peak areas for native PCDD and PCDF congeners and 13C-ISTD (n=15).

Samples of five different foodstuffs: liver (n=5), beef (n=4),poultry meat (n=6), hens’ eggs (n=5), and animal feed (n=31)were extracted and analyzed using a GC High ResolutionMass Spectrometer (GC/HRMS) at a resolution of R=10,000.The same sample vials were then transferred to the Agilent7000 GC/MS/MS system and reanalyzed.
Figure 11 shows the comparative sample results (upperboundvalues) of the two sets of measurements expressed as thepercentage difference between the results obtained by theGC/HRMS and GC/MS/MS analyses.
10
Sample Analysis
The MRM chromatograms for the tetra- and penta-CDF iso-mers present in a hen’s egg extract are shown in Figure 9.The concentrations of the 2,3,7,8-TCDF, 1,2,3,7,8-PeCDF, and2,3,4,7,8-PeCDF were determined as 15.5, 3.4, and 3.1 pg/gfat, respectively.
An advantage of screening for dioxins and furans in food-stuffs and animal feed by GC/MS/MS, as opposed to usingbio-assay, is that each congener is individually quantified.This allows the quantitative contribution of each PCDD andPCDF congener within the sample to be plotted. This, in turn,may provide a valuable clue as to the likely source of the con-tamination. The quantitative distribution of PCDD and PCDFcongeners in a hen’s egg extract is shown in Figure 10.
Figure 9. MRM chromatograms of tetra- and penta-CDF congeners and 13C-ISTDs from a hen’s egg extract.
12378-PeCDF 23478-PeCDF
13C-12378-PeCDF13C-23478-PeCDF
2,3,7,8-TCDF
13C-2,3,7,8-TCDF

11
0%1 2 3 4 5 20 21 22 23 24 25 26 27
10%
-10%
-20%
-30%
-40%
20%
30%
40%
31× Animal feed
TEQ values (upperbound) of all samples (n=50)
rel.
diff
eren
ce to
HR
Ms
5 × Hen’s eggs
10 × Flesh
4 × Liver
PCDD/F-TEQ pg/g
Figure 10. Quantitative distribution of PCDD and PCDF congeners in a hen’s egg extract, units are pg TEQ/g fat.
Figure 11. Comparative results (upperbound concentration values) for 50 food and feed samples analyzed by GC/HRMS and GC/MS/MS.

12
Figure 12 shows the comparative sample results (upperboundconcentration values) of the two sets of measurements forthose samples that gave values less than 3 pg TEQ/g.Additionally, Figure 12 is annotated with the Maximum Levels(ML) and Action Levels (AL) for poultry meat, hens’ eggs, andanimal feedstuff as prescribed by European Union Legislation.
Foodstuff samples that exhibited levels of total PCDD andPCDF congeners at upperbound values greater than 3 pgTEQ/g gave quantitative results by GC/MS/MS that werewithin ± 10% of the value obtained by GC/HRMS.
The agreement between the results obtained on the GC-HRMS and the GC/MS/MS for foodstuff and feedstuff sam-ples at levels between 0.5 and 3 pg/g TEQ were within therange of ± 10 to ± 20%.
Only those animal feedstuff samples with results of 0.1–0.2 pgTEQ/g (well below the EU action level of 0.5 pg TEQ/g) gaveresult differences > 20% between the GC/HRMS andGC/MS/MS. This greater differential may be attributed to theresults being expressed as the upperbound values and thelower limit of detection (LOD) achievable by the GC/HRMSsystem. In Animal Feedstuff samples, the GC/HRMS gave arange of LODs for the PCDD and PCDF congeners between0.01–0.06 pg/g, whereas the GC/MS/MS gave0.02–0.08 pg/g.
PCDD/F-TEQ pg/g
MLMLALAL
MLML
ALAL
MLMLALAL
0%0.5 1 21.5 2.5 3
10%
-10%
-20%
-30%
-40%
20%
30%
40%
31× Animal feed
TEQs of different samples
rel.
diff
eren
ce to
HR
Ms
3 × Hen’s eggs
6 × Poultry meat
Figure 12. Comparative results (upperbound concentration values) for 40 food and feed samples analyzed by GC/HRMS and GC/MS/MS that gave values lessthan ~3 pg TEQ/g. ML= EU Maximum Level, AL = EU Action Level.
13
Conclusion
The Agilent 7000 Triple Quadrupole GC/MS system provideslinear, reproducible and sensitive detection of PCDD andPCDF congeners in foodstuffs and animal feed samples downto low pg TEQ/g values. Comparison of analytical results offoodstuff and animal feed extracts by GC/HRMS andGC/MS/MS indicates the suitability of the Agilent 7000 TripleQuadrupole GC/MS system for routine screening of PCDDand PCDF congeners in foodstuffs and feedstuffs that meetsthe requirements of European Union legislation.
References
1. UK Food Standards Agency Ref 74/2008 - Emerging inci-dent involving presence of dioxins in Irish pork meat.
2. US EPA Method 1613B - Tetra- through Octa-ChlorinatedDioxins and Furans by Isotope dilution HRGC/HRMS.
3. Commission Regulation (EC) No 1883/2006 of 19December 2006 Laying down methods of sampling andanalysis for the official control of levels of dioxins anddioxin-like PCBs in certain foodstuffs.
4. Commission Regulation (EC) No. 152/2009 Annexe Vletter B, 27 January 2009, “Laying Down the Methods ofSampling and Analysis for the Official Control of Feed”.
5. C. Sandy, “Improving GC-MS Method Robustness andCycle Times using Capillary Flow Technology and BackFlushing,” Agilent Technologies publication 5990-3367EN(2009).
For More Information
For more information on our products and services, visit ourWeb site at www.agilent.com/chem

www.agilent.com/chem
Agilent shall not be liable for errors contained herein orfor incidental or consequential damages in connectionwith the furnishing, performance, or use of this material.
Information, descriptions, and specifications in this publication are subject to change without notice.
© Agilent Technologies, Inc., 2010Printed in the USANovember 15, 20105990-6594EN


![Our Mission - pcdd.org Report-2010 pictures a… · Web viewA word from PCDD. Annual Report [2010] 7. Annual Report 2010During the year 2010 PCDD consolidated its fruitful partnerships](https://img.pdfslide.net/doc/110x75/5e08e4b45659d7779a512b94/our-mission-pcdd-report-2010-pictures-a-web-viewa-word-from-pcdd-annual-report.jpg)