Embed Size (px)
Citation preview

Louisiana State UniversityLSU Digital Commons
LSU Master's Theses Graduate School
8-9-2017
Determination of Recovery Time for a SimpleLifting Task Based on Weight, Frequency, andDuration of the LiftMilad AminiLouisiana State University and Agricultural and Mechanical College, [email protected]
Follow this and additional works at: https://digitalcommons.lsu.edu/gradschool_theses
Part of the Ergonomics Commons
This Thesis is brought to you for free and open access by the Graduate School at LSU Digital Commons. It has been accepted for inclusion in LSUMaster's Theses by an authorized graduate school editor of LSU Digital Commons. For more information, please contact [email protected].
Recommended CitationAmini, Milad, "Determination of Recovery Time for a Simple Lifting Task Based on Weight, Frequency, and Duration of the Lift"(2017). LSU Master's Theses. 4305.https://digitalcommons.lsu.edu/gradschool_theses/4305
DETERMINATION OF RECOVERY TIME FOR A SIMPLE LIFTING TASK BASED ON WEIGHT, FREQUENCY, AND DURATION OF THE
LIFT
A Thesis
Submitted to the Graduate Faculty of the Louisiana State University and
Agricultural and Mechanical College in partial fulfillment of the
requirements for the degree of Master of Science in Industrial Engineering
in
The Department of Mechanical and Industrial Engineering
by Milad Amini
B.Sc. Industrial Engineering, Azad University of Shiraz, Iran, 2012December 2017

ii
ACKNOWLEDGMENTS
First and foremost, I would like to express my sincere gratitude to my advisor Dr.
Fereydoun Aghazadeh whom without his support and encouragement this thesis would not have
been possible. Dr. Aghazadeh, you have been a great mentor to me for the past two and a half
years and I have learned a lot from you.
I would like to extend my appreciation to my committee members Dr. Bhaba Sarker and
Dr. Laura Ikuma for their helpful comments and support.
I wish to thank all the undergraduate and graduate students who took their time and
participated in my experiment and wish them best of the best in their academic and life
endeavors.
Finally, I would like to thank my wonderful parents for their endless support,
encouragement, and unconditional love. This thesis would not have become a reality without
their incredible support, and I dedicate it to them.
iii
TABLE OF CONTENTS
ACKNOWLEDGMENTS …………………………………………………………………….....ii
List of TABLES ………………………………………………………………………………....v
List of FIGURES ………………………………….…………….…………….…….…………..vii
List of ABBREVIATIONS………………………………………………………...….................ix
ABSTRACT……………………………………………………………………….......................x
CHAPTER 1. INTRODUCTION ……...……….……….….…………….……...........................1
CHAPTER 2. LITERATURE REVIEW …………………...….….……………….…………….4 2.1 Three Approaches Towards Prevention of MSDs ...…………...….............................5
2.1.1 Worker Selection …………………………………….…….……………....5 2.1.2 Training Interventions ………………………………….…….....................6 2.1.3 Ergonomics ……………….…………………………………….................6 2.1.3.1 Task Factors Studies …………………….…….............................7 2.1.3.2 Work-Rest Studies ……………………………............................11
CHAPTER 3. RATIONAL ……….………..…….……….……...…...........................................21 3.1 Research Objectives……………………………………………………………….....22
CHAPTER 4. METHODS AND PROCEDURE ….……….…………........................................23 4.1 Experimental Design …………………………………………..…...…......................23 4.1.1 Dependent and Independent Variables……………….…….........................24 4.2 Tools and Equipment ………………………….………………......…........................30 4.3 Research Hypotheses………………………………………………………................35 4.4 Participants ……………………………………...………………..……….................37 4.5 Experimental Task …………………….…………..……………....………................38 4.6 Heart Rate Data Processing………………………………………………………......40
CHAPTER 5. RESULTS AND ANALYSIS…………………………….....................................42 5.1 Evaluation of Task-Factors on the HRR……………………………………………..44 5.2 Evaluation of Task-Factors on Perceived Exertion ……………………………….....51
5.3Confounding Factors Analysis………………………………………………………..52 5.4 Model Development …………..……………………………………………………..52
CHAPTER 6. DISCUSSION………………………………………………….............................58 6.1 Effect of Task Factors on the HRR ………………………………………………….58 6.2 Effect of Task-Factors On the Perceived Exertion……………………………………60 6.3 Confounding Factors Effect………………………………………………..................61 6.4 Models Interpretation…………...…………………………………………................61
6.4. 1 Further Analysis of the Rest Model …………………………....................63

iv
CHAPTER 7. CONCLUSIONS………………………………………………………………....65 7.1 Hypotheses Testing……………………………………………………….................65
7.2 Summary of Research and Conclusions…………………………………..................67 7.3 Areas of Application………………………………...……………………………....68
CHAPTER 8. LIMITATIONS AND RECOMMENDATIONS FOR FUTURE STUDIES……………………………………………………......69
BIBLIOGRAPHY ……….……….….……….……...………………...…..……...….................71
APPENDIX A LSU Institutional Review Board (IRB)
Application Forms…………………………………………………….................78 B Informed Consent Form ……………………………………..….........................79 C Borg Scale Form …...…....…..…..…..…..…..…..…..…..…..…......…………....82 D Physical Activity Rating (PA-R)……………………………….……..................83 E Demographic Data………………………………………………….................... 84 F Raw Data for Reponses……………………………………………….................85 G Data for Confounding Factors……………………………………………….......86 H Stepwise Regression…………………………………………………..................87
VITA…………………………………………………………..………………………………....88
v
LIST OF TABLES
Table 2.1: Relative frequency of source of injury ……………………………………………4
Table 2.2: MMH studies on task factors………………………….………………..................12
Table 2.3: Energy expenditure levels ………………………………………………...............15
Table 2.4: Age multipliers for Pulat’s formula ………………………………………………15
Table 2.5: Work-rest formulas…………………………………………….……….................18
Table 2.6: Work-rest comparison studies….………………………………………………….19
Table 4.1: Treatment combinations…………………………………………………...............24
Table 4.2: Experimental design layout …………………………….………………...............25
Table 4.3: Independent variables of the study (task-related) ………………………................25
Table 4.4: List of all variables………………………………………………………...............30
Table 4.5: Participant data summary………………………………………………..................37
Table 5.1: Average HRR for each treatment………………………………………..................42
Table 5.2: Mixed model ANOVA for the HRR (initial model) …………………....................44
Table 5.3: Mixed model ANOVA for the HRR (adjusted model) ……………………………46
Table 5.4: Parameter estimates of mixed model ANOVA for the HRR (adjusted model) ……………………………………….......................46
Table 5.5: Mixed model ANOVA for the HRR (reduced model with 23 Obs.) ……………………………………………………..49

vi
Table 5.6: Average Borg scores for each treatment……………………………………………..51
Table 5.7: Mixed model ANOVA for Borg………………………………………......................52
Table 5.8: ANCOVA for operator-related variables ………………………………....................53
Table 5.9: Linear regression for main factors………………………………….………………..56
Table 5.10: Stepwise Regression Summary………………………………………......................56
Table 5.11: Multiple regression for model d……………………………………………….........57
Table 6.1: Average recovery time among different levels of each factor……………………………...........................................60 Table 6.2: Average Borg score among different levels of each factor…………………………………………………….......61 Table 6.3: Predicted vs. observed rest periods based on Equation 5.5…..............................................................................................63 Table 6.4: Predicted rest periods for mock inputs based on Equation 5.5……………..............................................................................64

vii
LIST OF FIGURES
Figure 1.1: Distribution of body parts injured in all industries in 2015 ……….........................2
Figure 4.1: Snook table for lifts……………………………………………...……...................27
Figure 4.2: Heart rate in a sub-maximal physical activity……………………..........................28
Figure 4.3: Platform with adjustable shelves……………………………….…….....................31
Figure 4.4: Crate with cushioned handles……………………………...….…….……………..31
Figure 4.5: Gymboss interval timer …………………………………………….......................32
Figure 4.6: Polar H7 heart rate monitor and Polar Beat app. …………………….....................33
Figure 4.7: A sample of weights used…………………………………………….....................33
Figure 4.8: iPhone stopwatch……………………………………...………………...................34
Figure 4.9: Digital dynamometer…….……………………………………...….…...................34
Figure 4.10: Static strength measurement platform………….………………………………...35
Figure 4.11: The lifting experiment.….......................................................................................40
Figure 4.12: An example of rough graph of the heart rate …………………………….............41
Figure 4.13: An example of smoothed heart rate graph ………………………..……………...41
Figure 5.1: Bar graph for HRR…………………………………….….….….…………………43
Figure 5.2: Changes in the HRR at 5-minute duration…….………….….….…………………43
Figure 5.3: Changes in the HRR at 10-minute duration……………….……………….............44

viii
Figure 5.4: Residual plots for HRR (initial model) ………………………………....................45
Figure 5.5: Residual plots for HRR (adjusted model) ………………………………................47
Figure 5.6: Restricted likelihood distance (with 24 Obs.) …………………………..................48
Figure 5.7: Cook’s distance (with 24 Obs.) …………………………………………................48
Figure 5.8: Residual plots for HRR (with 23 Obs.) …………………………………................49
Figure 5.9: Restricted likelihood distance (with 23 Obs.) ………….………………………….50
Figure 5.10: Cook’s distance (with 23 Obs.) ………………………………………..................50
Figure 5.11: Restricted likelihood distance with
and without Obs.8………………………………………………………………............51
Figure 5.12: Effect of weight on HRR……………………………………….............................54
Figure 5.13: Effect of frequency on HRR…………………………………................................54
Figure 5.14: Effect of duration on HRR……………………………….…………………….....55

ix
LIST OF ABBREVIATIONS
HRR: Heart Rate Recovery Time
LBP: Lower Back Pain
MAWL: Maximum Acceptable Weight of Lift
MMH: Manual Material Handling
MSDs: Musculoskeletal disorders:
RWL: Recommended Weight of Lift
WMSDs: Work-related Musculoskeletal Disorders
x
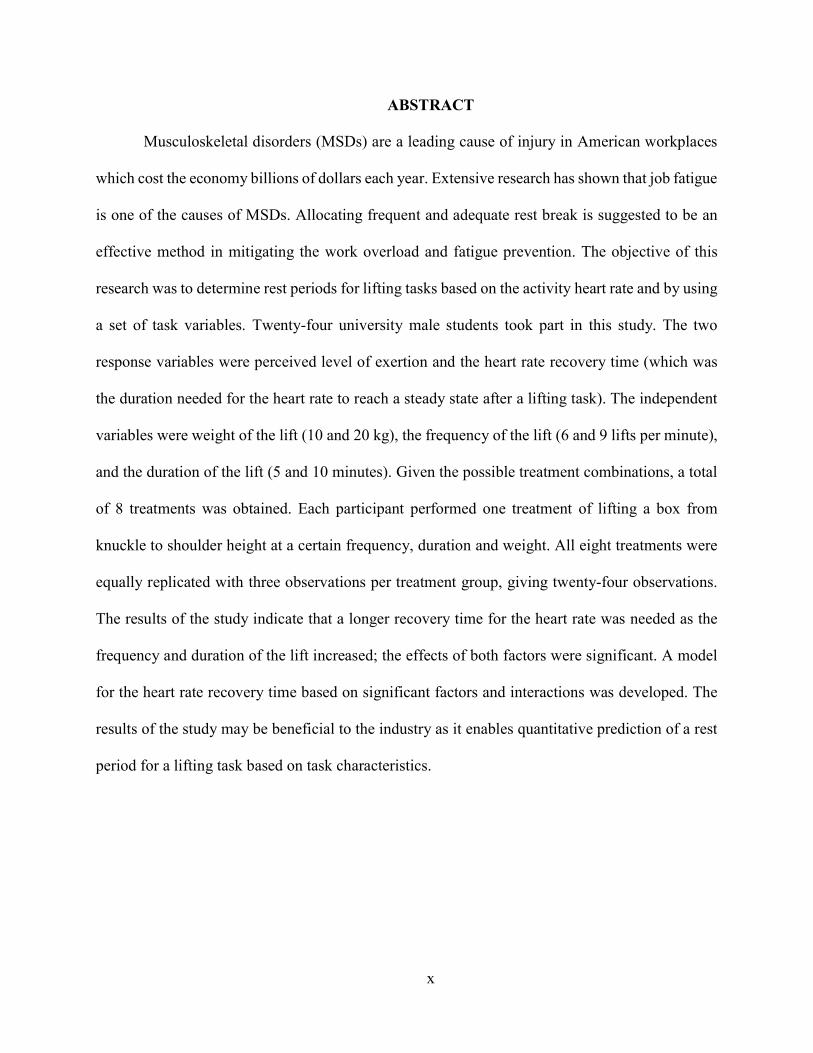
ABSTRACT
Musculoskeletal disorders (MSDs) are a leading cause of injury in American workplaces
which cost the economy billions of dollars each year. Extensive research has shown that job fatigue
is one of the causes of MSDs. Allocating frequent and adequate rest break is suggested to be an
effective method in mitigating the work overload and fatigue prevention. The objective of this
research was to determine rest periods for lifting tasks based on the activity heart rate and by using
a set of task variables. Twenty-four university male students took part in this study. The two
response variables were perceived level of exertion and the heart rate recovery time (which was
the duration needed for the heart rate to reach a steady state after a lifting task). The independent
variables were weight of the lift (10 and 20 kg), the frequency of the lift (6 and 9 lifts per minute),
and the duration of the lift (5 and 10 minutes). Given the possible treatment combinations, a total
of 8 treatments was obtained. Each participant performed one treatment of lifting a box from
knuckle to shoulder height at a certain frequency, duration and weight. All eight treatments were
equally replicated with three observations per treatment group, giving twenty-four observations.
The results of the study indicate that a longer recovery time for the heart rate was needed as the
frequency and duration of the lift increased; the effects of both factors were significant. A model
for the heart rate recovery time based on significant factors and interactions was developed. The
results of the study may be beneficial to the industry as it enables quantitative prediction of a rest
period for a lifting task based on task characteristics.
1
CHAPTER 1: INTRODUCTION
Musculoskeletal disorders (MSDs) are injuries of muscles, tendons, ligaments, joints, and
nerves which can affect almost all tissues and most often involve the arms and back (OSHA, 2000;
Gatchel & Schultz, 2014). Work-related musculoskeletal disorders (WMSDs) are conditions in
which the work environment or performance contribute to MSD (CDC, 2016). According to OSHA
(2014), WMSDs are a leading cause of pain, suffering, and disability in American workplaces. In
2014 MSDs accounted for 32% of all injury and illness cases at the workplace (BLS, 2015).
According to the same article, in 2014 there were 365,580 cases of musculoskeletal disorders with
an incident rate of 33.8 cases per 10,000 full-time workers which resulted in a median of 13 days
away from work per person.
Some professions sustain higher rates of injuries than others. For example, laborers and
freight, stock, and material movers; nursing assistants, and heavy truck and tractor-trailer drivers
incurred a higher number of MSDs in 2015 than any other profession (BLS, 2016). In addition to
causing acute and chronic health problems to workers, MSDs result to high costs. Annual costs for
MSD related workers’ compensation is estimated to be about $20 billion a year for direct costs
and $100 billion for indirect costs (OSHA, 2014). Direct costs are related to the actual cost of
treatment and clinical cost and indirect costs are related to the impact of injury, lost earnings, the
cost of time off work, and the burden on the economy (Dias et al., 2006; Sadeghniiat-Haghighi &
Yazdi, 2015). In addition to physical injuries, research shows that workers who have prolonged
absence from work as a result of MSD, are prone to suffer from psychological distress and
disorders (Loisel & Anema, 2013).
Manual material handling (MMH) tasks are inseparable parts of many industries and in
many cases, the human physical input is needed in performing such tasks. MMH can be defined
2
as moving objects from an origin to a destination by using body parts especially the hands.
Generally speaking, there are two main types of manual material handling tasks: individual tasks
and combined tasks (Iridiastadi & Aghazadeh, 2005). Examples of individual tasks are pushing,
holding, pulling, lowering and lifting, whereas combined tasks can be a mixture of two or more
individual tasks (Snook & Ciriello, 1991). Rajesh (2016) presents another classification of MMH
based on the work environment characteristics, which are: task-related variables (frequency,
duration, intensity), material related dimension (load and direction), and work system related
dimension (layout and equipment).
According to Verbeek et al. (2012), MMH tasks, especially lifting, are associated with a
high risk of lower back pain (LBP). Research shows that 70-85 % of the population experience
back pain at some point in their lives and about 2% of the US workforce are compensated for back
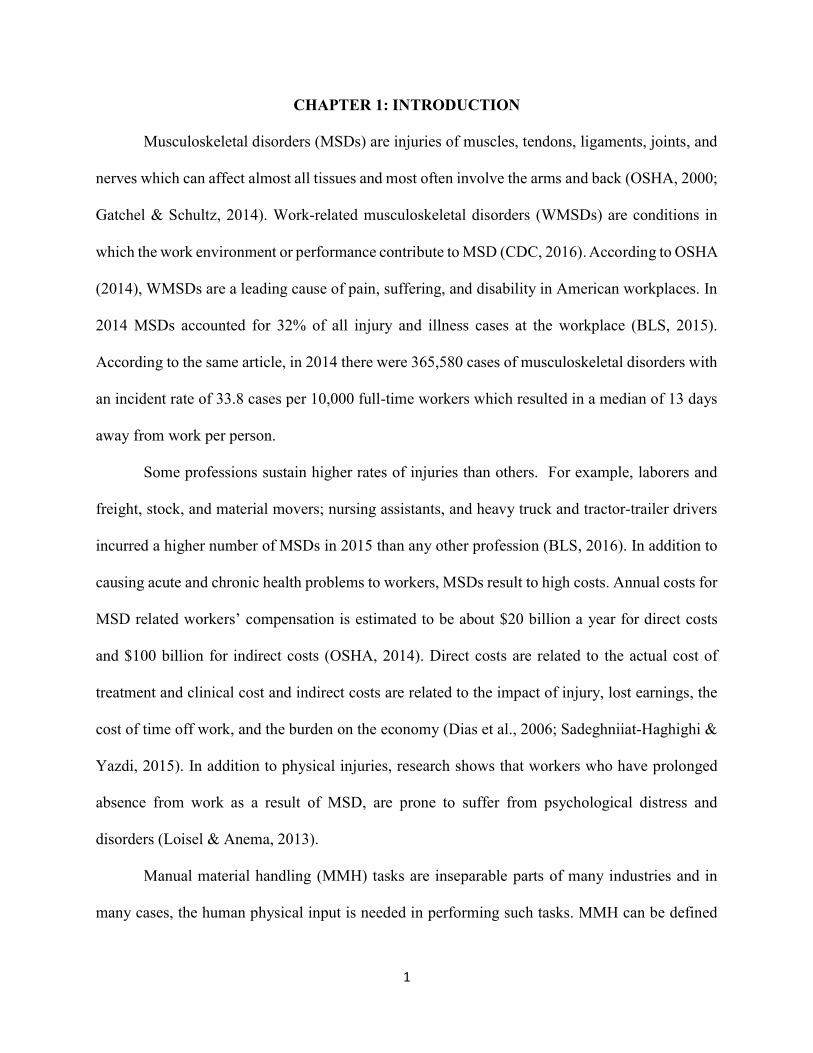
injuries each year (Andersson, 1999). Figure 1.1 shows the relative distribution of body parts
injured in 2015, in which back incidents accounted for more than a fourth of all incidents.
Figure 1.1: Distribution of body parts injured in all industries in 2015 (BLS, 2016)

3
In addition to LBP, workers who deal with MMH as a routine part of their job and are
exposed to prolonged and forceful exertions are at a risk of developing cumulative trauma disorder
(CTD) over the time. CTDs are damages to muscles, tendons, and joints of the upper extremity
(Hales & Bertsche, 1992; Pulat, 1997). Stobbe (1996) names four major risk factors of CTD as
force, frequency, duration and awkward posture.

4
CHAPTER 2: LITERATURE REVIEW
Five percent of all American workers miss at least one work day annually due to low back
pain (Andersson, 1999) and the total cost of low-back pain in the United States exceeds $100
billion per year (Katz, 2006). In a given MMH task if a worker exerts forces beyond his or her
capability, known as overexertion, the probability of getting injured increases. Table 2.1
summarizes the distribution of the injury sources in the workplace within all industries, in which
overexertion accounts for more than a third of all causes. Repetition and overexertion in a physical
activity can cause muscle fatigue and are major risk factors leading to MSD (Powell & Copping,
2016).
Table 2.1: Relative frequency of source of injury (BLS, 2016)
Fatigue is a general term which is divided into two types: mental and physical. Examples
of mental fatigue are depreciation in cognitive performance and inability to concentrate, whereas
signs of physical fatigue are a lack of energy and a state of being weary (Hardy & Studenski, 2010;
Konz, 1998). Linden et al. (2003) define mental fatigue as a change in the psychological state due
to sustained performance. From a physiological viewpoint, repeated use of muscles affects muscle
motor units and that leads to a transient decrease in the capacity to perform physical actions
(Hirshkowitz, 2013; Enoka, 2008). Physiological fatigue is also defined as a failure of the
functional organ, and a state of weakness (Shen et al., 2006; Phillips, 2015).
Event DistributionOverexertion 37.1Falls, slips, trips 30.5Contact with objects 26.7harmful substances 5.1 Other events 0.6
5
Eidelman (1980) defines fatigue from a cellular standpoint in which human brain
constantly controls status of all parts of the body and monitors the remaining energy in the tissues
and organs. Once fatigue starts to develop, the brain monitors a decreasing trend of latent capacity
of tissues and organs which is translated as a gradual resistance to continuous activity, and that is
known as fatigue. Fatigue should not be confused with sleepiness. Sleepiness is the tendency to
fall asleep, whereas fatigue is the body’s response to physical and mental exertion (Lerman et al.,
2012).
Janaro & Bechtold (1985) state that workplace fatigue, regardless of type (physical or
psychological), can affect worker’s capacity and productivity. It is a known fact that fatigue can
deteriorate productivity and work quality, increase the number of work errors and lead to
workplace injury (Katic et al., 2013; Belenky et al., 2014). Bhatia and Murrell (1969) discuss the
effectiveness of proper rest breaks on worker productivity and fatigue reduction. Considering that
there is an association between muscle fatigue and task performed (Enoka, 2008) and that
excessive fatigue at workplace can affect worker’s health, productivity and safety (Lerman et al.,
2012), serious efforts need to be made in finding proper work-rest schedules that not only ensures
workers well-beings, but also help with lowering the economic burden of MSDs on society.
2.1 Three Approaches Towards Prevention of MSDs
Snook et al. (1978) suggest three major approaches for prevention of low back injuries in
the industry, which are: training, ergonomics and worker selection. The effectiveness of each
method in preventing MSDs is discussed below.
2.1.1 Worker Selection
One idea in reducing work injuries and fatigue is that workers should be hired based on
their physiological fitness for jobs requiring them to perform straining manual tasks (Brouha,

6
1967). Chaffin (1979) states that employment screening, such as low back x-rays, does not have a
justified validity when used as the sole criterion and will discourage job seekers in applying for
certain jobs. He adds that screening should only be used for people with questionable low-back
history. In another study done by Chaffin & Park (1973), no correlation was found between
participants’ anthropometry (height and weight) and musculoskeletal injury rate. Furthermore,
choosing workers based on their physical capability for certain occupations might infringe
Americans with Disabilities Act (ADA).
2.1.2 Training Interventions
Blangsted et al. (2008) studied the effects of different physical activity (exercise)
interventions in reducing shoulder and neck symptoms, in which after a year, the duration and
severity of neck and shoulder musculoskeletal symptoms were reduced among participants. Lahiri
et al. (2016) reviewed the cost-effectiveness of a training intervention on 100 porters over a 2-year
period in a pre-post study, in which the end results show a reduction in physical and mental scores
of post-training and respectively, a huge saving in absenteeism.
Historically, the predominant culture is to design a workplace then try to fit the workers to
the job by training and worker selection, but this approach has proved to fail. Workers can not be
trained to perform tasks beyond their physical capability without risk of injury (Stobbe,1996). In
a review by Mahone (1994) on MMH injury prevention, the author argues that quick fixes, such
as the use of back belt and training should not be the primary approach, but the focus should be on
ergonomic ways and proper job design.
2.1.3 Ergonomics
Ergonomics can be defined as the design of the work, workplace, work environment, and
tools to match the physical, physiological, and mental capability of the workers to provide a safe

7
and productive workplace. Ergonomics intervention in MMH essentially work around designing
the job to fit workers and can include task elimination, changes in lifting weight, posture changes,
the use of mechanical aids, and the removal of the worker (Stobbe,1996). Ergonomic studies in
MMH can be divided into two broad topics: first, studies that investigate the relationship between
task factors and their effect on worker performance, and second, works that look at proper rest and
relaxation times for workers to recover from a demanding physical or mental task.
2.1.3.1 Task Factors Studies
There are several studies focused on determining the relationship between task factors and
their effect on workers' physiological responses and the safe limits that workers should perform a
manual task safely without straining themselves. Waters et al. (1997) name certain assessment
tools as ergonomic approaches in dealing with MMH injuries, which among those are revised
NIOSH (1991) lifting equation and Snook table (Snook, 1978; Snook & Ciriello, 1991). Each of
these tools provides a suggested and safe limit for a certain manual material handling task.
In 1981, the National Institute for Occupational Safety and Health (NIOSH) published a
lifting equation (which later was revised in 1991) that was designed to provide recommended
weight limits that healthy workers could lift over a period of eight hours without increasing the
risk of MS injuries to the lower back (Waters at al., 1994). The NIOSH equation is based on a
psychophysical, physiological, and biomechanical criterion which determines if a lift is safe for a
given task, this equation uses several task variables to calculate the recommended weight of lift
(RWL) and the lifting index (LI) as follows:
RWL= LC (51) x HM x VM x DM x AM x FM x CM
Lifting Index (LI): Weight ÷ RWL = LI
Where the task variables are:

8
LC= load constant, 23 kg or 51 lbs.
H = Horizontal location of the object relative to the body
V = Vertical location of the object relative to the floor
D = Distance the object is moved vertically
A = Asymmetry angle or twisting requirement
F = Frequency and duration of lifting activity
C = Coupling or quality of the workers’ grip on the object
RWL is the load that 90% of the population can safely lift and the LI determines the safety level
of the lift. If LI is greater than 1, administrative controls should modify the lifting task to make it
safer for workers. NIOSH equation is a well-known approach in analyzing lifts, however, it fails
to take into account tasks with large variations, individual risk assessment (e.g. weight, height,
age) and one-handed lifting among others.
Many studies have tried to develop guidelines to determine the maximum acceptable
weight of lift (MAWL) in a manual material handling task. The psychophysical method is the main
tool in determining MAWL. Aghazadeh (1974) defines psychophysical method as the
psychological study of the relationship between physical stimuli and sensory response. In this
approach, participants perform a certain MMH task twice, once with an empty or light box and
once with a heavy box. They are asked to adjust (add or remove) weights into the box while
performing the task until reaching a maximum weight, where they feel comfortable to lift for a
period of 8 hours in the real work situation. The average weight of the two trials is considered as
MAWL. In some cases, participants are told to imagine the heavier they lift, the better they get
paid.
9
In a series of research conducted by Liberty Mutual Insurance, Snook and Ciriello (1978,
1991), used psychophysical methods to outline the design goal for various manual handling tasks
(lifting, lowering, pushing, pulling, and/or carrying). Snook tables can be used as a guide to
compare a specific MMH task against the table values to determine the corresponding percent of
the population who can perform a MMH task without strain. Based on Snook tables, standard
MMH tasks should be designed for 75th percentile of the female population, which is essentially
acceptable to the 90th percentile of males. Tasks which can not be performed by 75% of the female
population, should be redesigned and revised to prevent any MS injuries.
Chaffin and park (1973) conducted a study over the period of 5 months on 135 workers
working in five electronics manufacturing companies to find the maximum acceptable weight of
the lift. Their study concluded that for lifts performed close to the body, the weight should not pass
35 lbs., and for the loads lifted 20 inches from the ankle, the maximum weight of the lift should
be 20 lbs.
In a laboratory study by Garg & Banaag (1988), the effect of symmetry angel (30, 60, and
90 degree), frequency (3, 6, and 9 lifts/min) and lifting height (floor-81 cm, 81-152cm) on MAWL,
rating of perceived exertion (RPE), static strength, and heart rate in a repetitive lifting task were
examined. The results show that heart rate and RPE increased with an increase in the symmetry
angel, while MAWL and static strength were decreased in asymmetric lifting. On the other hand,
the frequency and lifting height had no significant effects on MAWL
Gallagher (1991) studied the effect of three task variables on MAWL and physiological
responses such as heart rate and oxygen intake. The task variables included posture (stooping or
kneeling), lift distance (35 cm or 60 cm) and task symmetry (symmetric or asymmetric). Eight
male participants performed 8 treatments in a within-subject design. MAWL values were obtained

10
via psychophysical approach. The researcher concluded that heart rate was not significantly
affected by posture and that physiological responses were lower in the case of kneeling. MAWL
values were higher in asymmetric tasks and participants could lift less weight in 60 cm lift distance.
Wu (1997) studied the effect of box size and frequency on MAWL, heart rate and RPE
scale on 13 male participants. There were three box sizes (300, 450, and 600mm wide) and three
lifting frequencies (1,4, and 6 lifts/min). The data analysis shows a significant decrease in MAWL,
with an increase in box size and lifting frequency. On the other hand, RPE did not significantly
increase with an increase in the box size, however, overall RPE ratings increased significantly with
the lifting frequency. Also, the mean heart rate increased markedly with the box size and lifting
frequency.
Maiti & Bagchi (2006) examined the effect of three lifting parameters and their interactions
on the working heart rate. Factors studied were lifting frequency (1, 4, 7 and 14 lifts per minute),
vertical lifting distance (knee, waist, shoulder and maximum reach height), and load weight (5, 10
and 15 kg). Ten female construction workers were hired to perform 48 different treatments of lifts
for a period of 10 minutes. The results show that the contribution of main effects was significantly
higher than the interaction effects and among main factors frequency had the highest coefficient
of determination. The interaction effects of different lifting parameters contributed to only 10% of
the total variance of normalized working heart rate, in which 6% belonged to the interaction
between weight and frequency.
In another MMH study conducted in Columbia (Saavedra-Robinson et al., 2012), the effect
of lift factors on the maximum weight of lift was studied. The two independent factors were height
(knuckle, shoulder, and maximum reach) and frequency of the lift (2,4, and 6 lifts per minute).
Each of the 20 male participants performed all nine treatment combinations. The objective of their

11
study was to determine the maximum acceptable weight of lifting under pre-determined height and
frequency conditions and to compare the results with the current standards in MMH. The results
show that frequency had a significant effect on MAWL, in such way that the higher the frequency,
the lower the weight was lifted. The results also show that standards on MAWL in Columbia had
higher limits compared to the findings of their study and might need to be revised.
Another study investigated the effect of box size, the frequency of lifting, and height of
lifting on the heart rate of male university students in Iran (Abadi et al., 2015). The results of the
study show that the frequency of the lift and size of the box had a significant effect on the heart
rate. Meanwhile, no significant difference was observed in terms of lifting height.
There are many more studies on task factors in MMH handling. However, the ones
discussed were found to be relatively close to the area of this current research. Table 2.2
summarizes the MMH studies that investigated the effect of multi-level task factors on the
response variable (s). Most of the MMH studies discussed target the MAWL as the response
variables and test how different task factors will affect the response variable.
2.1.3.2 Work-Rest Studies
Determining a proper work-rest schedule can help workers to perform a strenuous task,
mental or physical, safer and help in preventing accidents on the job. Bedny & Seglin (2001)
suggest that the best way to evaluate the functional state of an organism (in this case human body)
is through measuring energy expenditure. Energy expenditure is usually measured in kilocalories
(kcal). According to the same article, the duration of break time should be based on an analysis of
the energy expenditure. The energy expenditure is usually measured via indirect calorimetry-
approaches. In these methods, the amount of produced CO2 or the volume of consumed O2 is
analyzed to draw the values of energy expenditure in kcal/min. In practice, measuring the energy
12
expenditure by a VO2 device during a lifting task can be cumbersome, for this reason, some studies
use heart rate as a measure of energy expenditure.
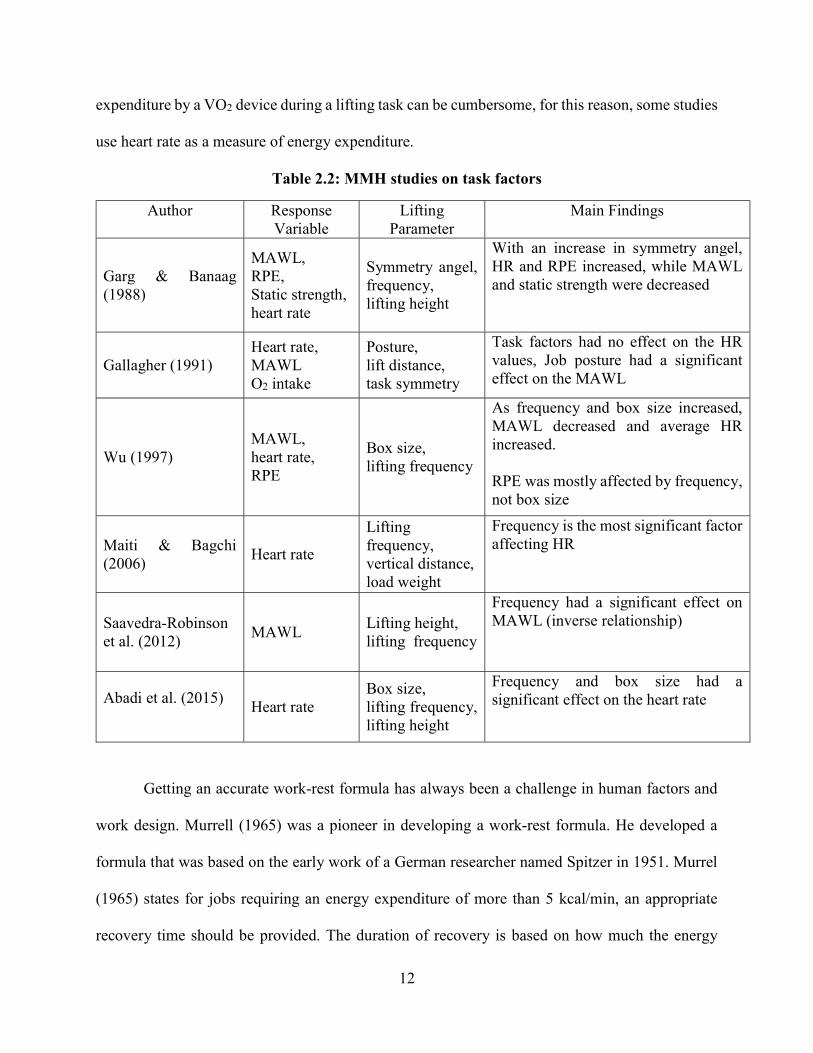
Table 2.2: MMH studies on task factors
Author Response Variable
Lifting Parameter
Main Findings
Garg & Banaag (1988)
MAWL, RPE, Static strength, heart rate
Symmetry angel, frequency, lifting height
With an increase in symmetry angel, HR and RPE increased, while MAWL and static strength were decreased
Gallagher (1991) Heart rate, MAWL O2 intake
Posture, lift distance, task symmetry
Task factors had no effect on the HR values, Job posture had a significant effect on the MAWL
Wu (1997) MAWL, heart rate, RPE
Box size, lifting frequency
As frequency and box size increased, MAWL decreased and average HR increased. RPE was mostly affected by frequency, not box size
Maiti & Bagchi (2006)
Heart rate
Lifting frequency, vertical distance, load weight
Frequency is the most significant factor affecting HR
Saavedra-Robinson et al. (2012)
MAWL Lifting height, lifting frequency
Frequency had a significant effect on MAWL (inverse relationship)
Abadi et al. (2015)
Heart rate Box size, lifting frequency, lifting height
Frequency and box size had a significant effect on the heart rate
Getting an accurate work-rest formula has always been a challenge in human factors and
work design. Murrell (1965) was a pioneer in developing a work-rest formula. He developed a
formula that was based on the early work of a German researcher named Spitzer in 1951. Murrel
(1965) states for jobs requiring an energy expenditure of more than 5 kcal/min, an appropriate
recovery time should be provided. The duration of recovery is based on how much the energy
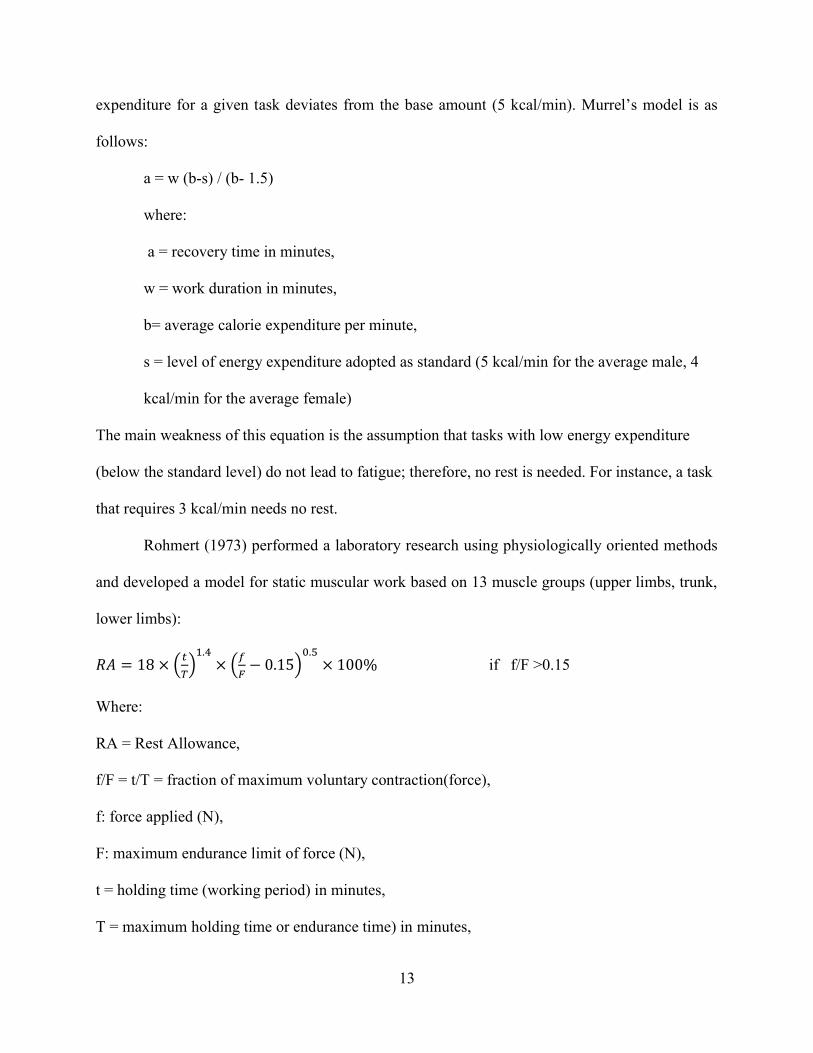
13
expenditure for a given task deviates from the base amount (5 kcal/min). Murrel’s model is as
follows:
a = w (b-s) / (b- 1.5)
where:
a = recovery time in minutes,
w = work duration in minutes,
b= average calorie expenditure per minute,
s = level of energy expenditure adopted as standard (5 kcal/min for the average male, 4
kcal/min for the average female)
The main weakness of this equation is the assumption that tasks with low energy expenditure
(below the standard level) do not lead to fatigue; therefore, no rest is needed. For instance, a task
that requires 3 kcal/min needs no rest.
Rohmert (1973) performed a laboratory research using physiologically oriented methods
and developed a model for static muscular work based on 13 muscle groups (upper limbs, trunk,
lower limbs):
𝑅𝐴 = 18 ×.
× − 0.15.
× 100% if f/F >0.15
Where:
RA = Rest Allowance,
f/F = t/T = fraction of maximum voluntary contraction(force),
f: force applied (N),
F: maximum endurance limit of force (N),
t = holding time (working period) in minutes,
T = maximum holding time or endurance time) in minutes,
14
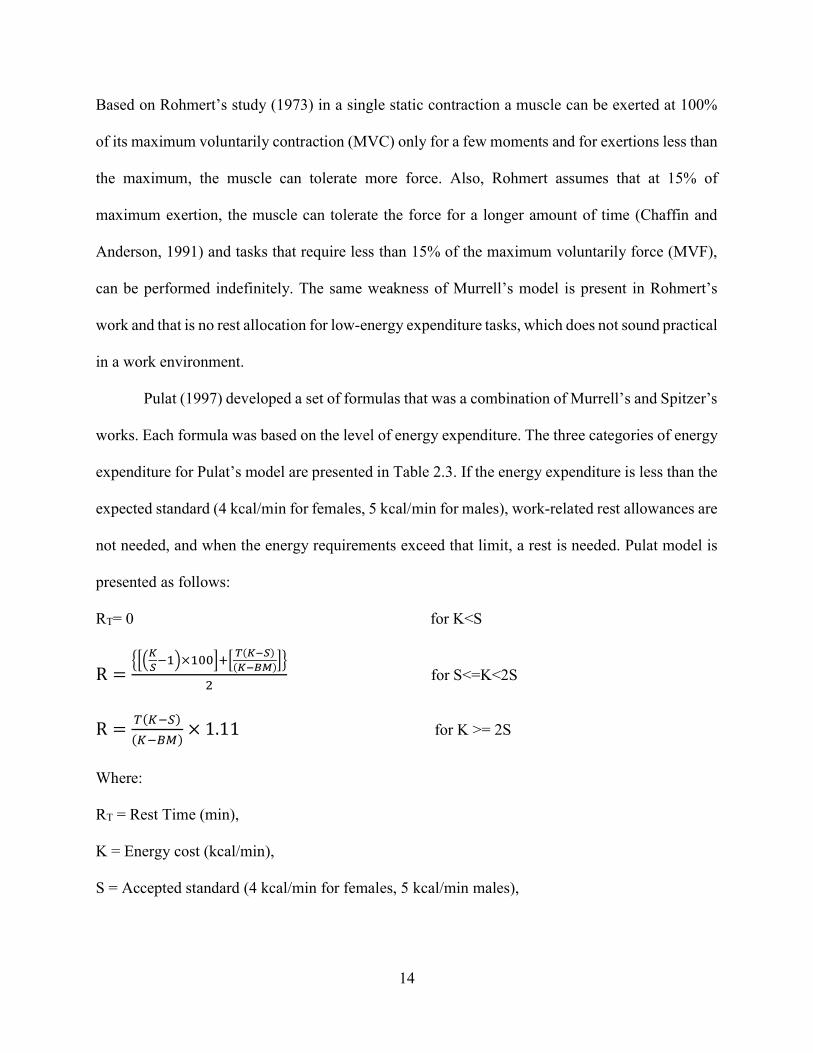
Based on Rohmert’s study (1973) in a single static contraction a muscle can be exerted at 100%
of its maximum voluntarily contraction (MVC) only for a few moments and for exertions less than
the maximum, the muscle can tolerate more force. Also, Rohmert assumes that at 15% of
maximum exertion, the muscle can tolerate the force for a longer amount of time (Chaffin and
Anderson, 1991) and tasks that require less than 15% of the maximum voluntarily force (MVF),
can be performed indefinitely. The same weakness of Murrell’s model is present in Rohmert’s
work and that is no rest allocation for low-energy expenditure tasks, which does not sound practical
in a work environment.
Pulat (1997) developed a set of formulas that was a combination of Murrell’s and Spitzer’s
works. Each formula was based on the level of energy expenditure. The three categories of energy
expenditure for Pulat’s model are presented in Table 2.3. If the energy expenditure is less than the
expected standard (4 kcal/min for females, 5 kcal/min for males), work-related rest allowances are
not needed, and when the energy requirements exceed that limit, a rest is needed. Pulat model is
presented as follows:
RT= 0 for K<S
R =×
( )
( ) for S<=K<2S
R =( )
( )× 1.11 for K >= 2S
Where:
RT = Rest Time (min),
K = Energy cost (kcal/min),
S = Accepted standard (4 kcal/min for females, 5 kcal/min males),

15
T = work time (min),
BM = Basal metabolism (kcal/min) = 1.4 for females, 1.7 for males,
Table 2.3: Energy expenditure levels
Energy (Kcal/min) Male Female
Lower energy expenditure 0 - 5 0-4
Medium energy expenditure 5-10 4-8
High energy expenditure >10 >8
Pulat also added a new component that accounts for the age of the participant in the form of a
multiplier, that number is used to adjust the RT obtained from the formula. Table 2.4 shows the
multiplier for age. According to George (2014), the weakness of Pulat’s model is in cases that
the model yields longer rest period for medium energy expenditure tasks compared to high
energy expenditure tasks under the same duration of work. For instance, a 30-year-old male
worker performing a task that requires 9 kc/min (medium energy expenditure) for 60 minutes of
work needs 56 minutes of rest. Whereas for the same duration of work for a task that requires 11
kc/min (high energy expenditure), the suggested rest period for that person is 43 minutes.
Table 2.4: Age multipliers for Pulat’s formula
Age Multiplier
20-30 1
40 1.04
50 1.1
60 1.2
65 1.25
16
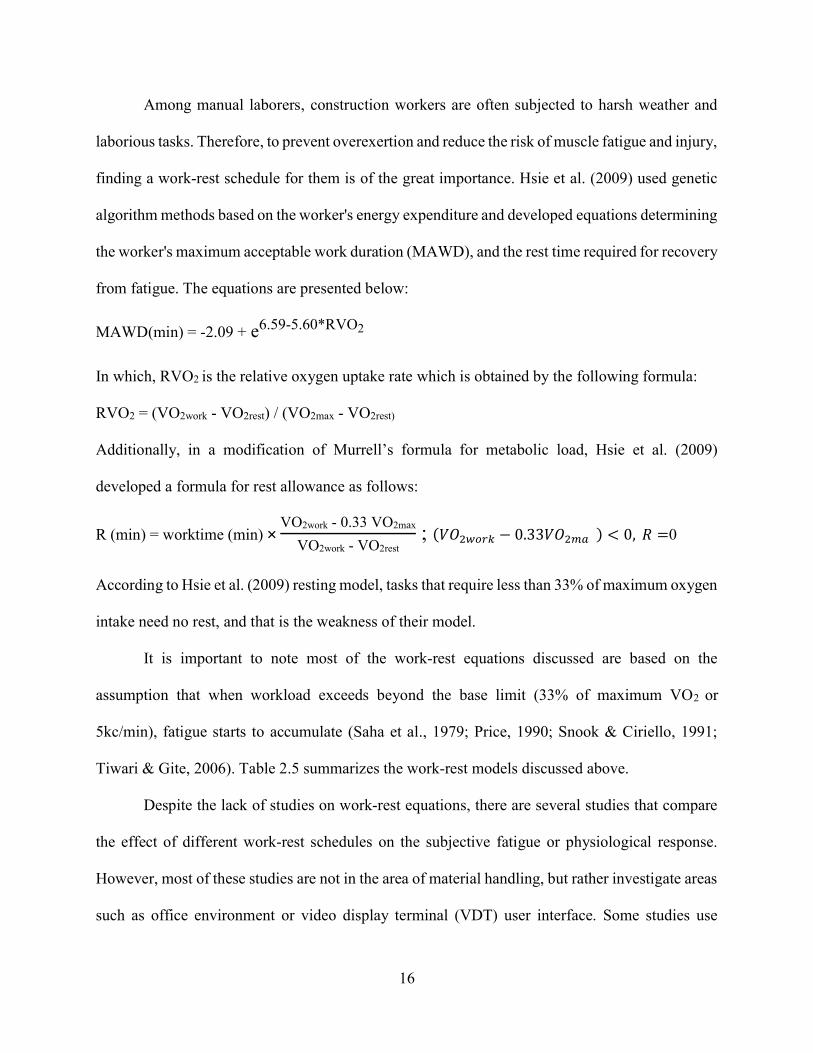
Among manual laborers, construction workers are often subjected to harsh weather and
laborious tasks. Therefore, to prevent overexertion and reduce the risk of muscle fatigue and injury,
finding a work-rest schedule for them is of the great importance. Hsie et al. (2009) used genetic
algorithm methods based on the worker's energy expenditure and developed equations determining
the worker's maximum acceptable work duration (MAWD), and the rest time required for recovery
from fatigue. The equations are presented below:
MAWD(min) = -2.09 + e6.59-5.60*RVO2
In which, RVO2 is the relative oxygen uptake rate which is obtained by the following formula:
RVO2 = (VO2work - VO2rest) / (VO2max - VO2rest)
Additionally, in a modification of Murrell’s formula for metabolic load, Hsie et al. (2009)
developed a formula for rest allowance as follows:
R (min) = worktime (min) × VO2work - 0.33 VO2max
VO2work - VO2rest ; (𝑉𝑂 − 0.33𝑉𝑂 ) < 0, 𝑅 =0
According to Hsie et al. (2009) resting model, tasks that require less than 33% of maximum oxygen
intake need no rest, and that is the weakness of their model.
It is important to note most of the work-rest equations discussed are based on the
assumption that when workload exceeds beyond the base limit (33% of maximum VO2 or
5kc/min), fatigue starts to accumulate (Saha et al., 1979; Price, 1990; Snook & Ciriello, 1991;
Tiwari & Gite, 2006). Table 2.5 summarizes the work-rest models discussed above.
Despite the lack of studies on work-rest equations, there are several studies that compare
the effect of different work-rest schedules on the subjective fatigue or physiological response.
However, most of these studies are not in the area of material handling, but rather investigate areas
such as office environment or video display terminal (VDT) user interface. Some studies use

17
measures other than physiological in determining the best work-rest schedule. Among those are
performance and error rate. Kopardekar & Mital (1994) studied the effect of three different work-
rest schedules on participants’ performance. The three treatments tested were: 5-minute break after
30 minutes of work, a 10-minute break after 60 minutes of work, and 120 minutes of work with
no break. The results show that the no-rest treatment led to a larger number of errors compared to
the first two treatments. Also, the 5-minute break after 30 minutes of work was found to have an
advantage over the 10-min break after 60 minutes of work in terms of performance and number of
errors.
In another study, Balci and Aghazadeh (2003) compared the effect of three different work-
rest schedules on the performance and perceived level of discomfort among 10 VDT users. The
three schedules were: 60-minute work / 10-minute rest, 30-minute work/ 5-minute rest, and 2-
hours work/ micro breaks. The micro breaks consisted of three breaks of 30 seconds after every
15 minutes, a longer break of 3 minutes within an hour, and a 14-minute regular break after two
hours of VDT work. The overall results show the work schedule including micro breaks was
superior to the other two for showing lower discomfort in upper extremities and better results in
terms of speed, accuracy, and performance.
Tiwari & Gite (2006) compared different work-rest schedule for workers operating a rotary
power tiller. They used heart rate as their physiological measure and a 10-point discomfort survey
as their subjective measure. Among the 4 schedules compared, the rest periods of 15 minutes were
found superior over 10 minutes’ ones, and it was concluded that work durations for power tiller
operation should not exceed 75 minutes, or they will cause discomfort.
18
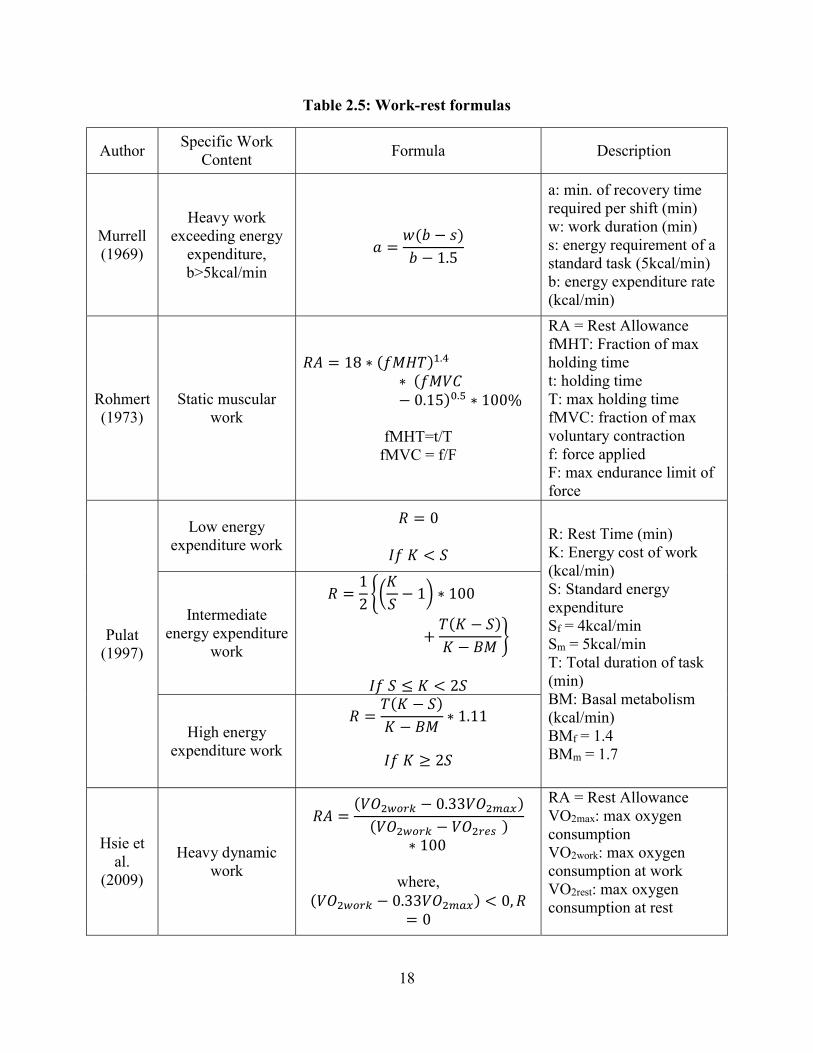
Table 2.5: Work-rest formulas
Author Specific Work
Content Formula Description
Murrell (1969)
Heavy work exceeding energy
expenditure, b>5kcal/min
𝑎 =𝑤(𝑏 − 𝑠)
𝑏 − 1.5
a: min. of recovery time required per shift (min) w: work duration (min) s: energy requirement of a standard task (5kcal/min) b: energy expenditure rate (kcal/min)
Rohmert (1973)
Static muscular work
𝑅𝐴 = 18 ∗ (𝑓𝑀𝐻𝑇) .
∗ (𝑓𝑀𝑉𝐶− 0.15) . ∗ 100%
fMHT=t/T
fMVC = f/F
RA = Rest Allowance fMHT: Fraction of max holding time t: holding time T: max holding time fMVC: fraction of max voluntary contraction f: force applied F: max endurance limit of force
Pulat (1997)
Low energy expenditure work
𝑅 = 0
𝐼𝑓 𝐾 < 𝑆 R: Rest Time (min) K: Energy cost of work (kcal/min) S: Standard energy expenditure Sf = 4kcal/min Sm = 5kcal/min T: Total duration of task (min) BM: Basal metabolism (kcal/min) BMf = 1.4 BMm = 1.7
Intermediate energy expenditure
work
𝑅 =1
2
𝐾
𝑆− 1 ∗ 100
+𝑇(𝐾 − 𝑆)
𝐾 − 𝐵𝑀
𝐼𝑓 𝑆 ≤ 𝐾 < 2𝑆
High energy expenditure work
𝑅 =𝑇(𝐾 − 𝑆)
𝐾 − 𝐵𝑀∗ 1.11
𝐼𝑓 𝐾 ≥ 2𝑆
Hsie et al.
(2009)
Heavy dynamic work
𝑅𝐴 =(𝑉𝑂 − 0.33𝑉𝑂 )
(𝑉𝑂 − 𝑉𝑂 )∗ 100
where,
(𝑉𝑂 − 0.33𝑉𝑂 ) < 0, 𝑅= 0
RA = Rest Allowance VO2max: max oxygen consumption VO2work: max oxygen consumption at work VO2rest: max oxygen consumption at rest

19
In a thesis research by Bahmani (2013), the effect of four different rest periods in a
repetitive manual material handling task was studied. The lifting task had a fixed duration of 20
minutes and the rest periods were: 5, 10, 15, and 20 minutes. Rest periods were compared with
each other with respect to heart rate elevation, perceived exertion, arm strength, and grip strength.
The overall results show that the 15-minute rest had an advantage over the rest.
Sheahan et al. (2016) compared three different standing rest-break on a group of people
who performed prolonged seated work. The treatments were as follows: 5 min of standing rest
every 30 min, 2.5 min of standing rest every 15 min, 50 seconds of standing rest every 5 min. The
self-reported LBP scores show that frequent, short rests were more helpful in reducing symptoms
of LBP; however, the EMG data of trunk muscles did not show any significant difference between
treatments.
Table 2.6 summarizes work-rest comparisons studies. As it was discussed, most of the
studies on work-rest schedule only compare some pre-designated schedules with each other and
the ones which try to develop a resting formula (Table 2.4), rely on the calories expenditure or
oxygen consumption.
Table 2.6: Work-rest comparison studies
(Table cont’d.)
Study Specific Work
Content Measures
Schedules Compared
Findings
Kopardekar & Mital (1994)
Directory assistance operator’s task with a VDT
Performance and error rate
30 min work/ 5 min break, 60 min work/ 10 in break, and 120 min work/no break
The 5-minute break was found superior

20
Table 2.6 continued: Work-rest comparison studies
Study Specific
Work Content
Measures
Schedules Compared Findings
Balci & Aghazadeh (2003)
VDT users
Discomfort in upper extremities, performance, speed, and accuracy
60 min work / 10 min rest, 30 min work/ 5 min
rest, and 2-hour work/ micro breaks (three 30 seconds break each 15
minutes + 3 minutes after an hour, and a 14-minute
break after 2 hours of work).
The 2-hour work with
micro breaks was found superior
Tiwari & Gite (2006)
Workers operating a rotary power
tiller
Heart rate and a subjective discomfort survey
Total duration of 6-Hour work broken down into
90, 60, 75, and 45 minutes sessions,
followed by either 10 min or 15 min rest in between
sessions
The 15 min rest periods were superior over 10 min ones. Work durations should not exceed 75 minutes
Bahmani (2013)
Manual material handling
Heart rate elevation, perceived exertion, and changes in arm strength and grip strength
Work duration of 20 minutes followed by four different rest periods: 5, 10, 15, and 20 minutes.
The 15-minute rest had an advantage over the rest.
Sheahan et al. (2016)
Prolonged seated work
LBP survey
5 min of standing rest every 30 min, 2.5 min of standing rest every 15 min, 50 s of standing rest every 5 min.
Frequent, short rests were more helpful

21
CHAPTER 3: RATIONALE
When the workload increases beyond the maximum oxygen capacity in a given task
(beyond 33%), the anaerobic process becomes predominant. As a result, a pressure is put on the
cardiovascular system causing the heart rate to elevate and initiating muscle fatigue (Brouha, 1967;
Saha et al, 1979). Chaffin & Park (1973) state when individuals apply exertion beyond their
physical capability, the risk of MSD increases.
Many authors claim that giving frequent and adequate breaks, even as short as few seconds,
may prevent fatigue, overload, and lower the risk of injury (Henning et al., 1997; Rosa et al., 1998;
Cal/OSHA, 2003). Lerman et al. (2012) state that taking frequent breaks may be more beneficial
in heavy physical activities than in lighter activities. Bedney and Segline (1997) studied and proved
the effectiveness of the pulse rate method in assessing physical workload and concluded that more
break time was needed when the average pulse rate exceeded 100 beats/min. Heart rate is proved
to be a useful and convenient method for measuring the physical workload and environmental
stress on the body when studying dynamic physical work (Brouha, 1967; Rohmert,1973; Bedney
& Segline, 1997; Eastman Kodak Company, 2007). Also, Rohmert & Laurig (1975) work suggests
that the pulse rate, when the load level is zero, can be used as an indicator of the stress level. As a
result, we can say the longer it takes for the pulse rate to return to inactivity rate (resting), the
higher stress must have been experienced. This finding will be used as the general guideline for
this study.
As it was discussed in the literature review section, many researchers have studied the
effect of different task variables in calculating the maximum acceptable weight of lift (MAWL) or
the heart rate values and some have reviewed the proper rest periods based on the metabolic
characteristic of workers (such as oxygen uptake or calories needed). However, there has not been

22
any studies up to this date that determines the appropriate resting breaks in a manual material
handling jobs (in this case, lifting) based on both task variables or cardiovascular response
(changes in the heart rate). This study focused on analyzing the effect of three major task
components on the heart rate recovery time
3.1 Research Objectives
In order to decrease the number of workplace injuries and workers’ sufferings, and to lessen
the burden of MSDs from the economy, many studies propose techniques and solutions for safer
manual material handling. This study investigated the effect of three task factors (duration,
frequency, and weight) on the heart rate recovery time. The objective of this research was twofold:
the first objective was to determine heart rate recovery time by conducting a series of lifting
experiment, and the secondary objective was to develop a model to predict rest periods for lifting
tasks based on the activity heart rate and by using a set of task variables. To meet these objectives,
we conducted several manual lifting tasks consisted of continuous lifting using human participants.
To meet the objectives of the study, following steps were carried out:
Find which of the main three independent variables (frequency, duration, and weight),
significantly affect the responses (recovery time and Borg scale).
Determine if the interactions between main factors, significantly affect the responses.
23
CHAPTER 4: METHODS AND PROCEDURE
This study focused on measuring the heart rate recovery time after performing various lifting
tasks to find a relationship between task factors and recovery time. It also investigated to determine
if any of covariates had any effect on the response variable. In this project, participants were lifting
a crate filled with a certain weight, for a certain duration and at a certain frequency. Several
measurements were captured before as well as after each experiment. Since this study required
human participants, a permission from LSU institutional review board (IRB) was obtained before
conducting the experiment. A copy of this permit is in Appendix A.
4.1 Experimental Design
A 23 factorial design was used for this research. Aghazadeh (1986) used this design in his
MMH study. In his work, three independent variables of height, frequency, and container type,
each at two levels, were used to predict the maximum acceptable weight of lift (MAWL). In the
current study three main factors of frequency (lifts/min), duration (min), and weight (kg), each at
two levels, were used to predict the heart rate recovery time (HRR). Each of these variables had a
high and a low level. Giving the possible treatment combinations, eight (23) treatment
combinations were obtained in the experiment and all of them were utilized. Each participant was
randomly assigned to only one treatment (between subject design). The randomization was done
by an online tool (Random.org). Table 4.1 shows the treatments. The experiment was conducted
over three days, and on each day the full set of eight treatments was used (by 8 participants).
Therefore, the design structure of the experiment is a randomized complete block design (RCBD).
Blocking was accounted for by using the variable day as a random effect in the model. No data
were disregarded in the analysis, and so all eight treatments were equally replicated with three
observations per treatment group, giving twenty-four observations.

24
Table 4.1: Treatment combinations
Table 4.2 presents the experimental layout design. As discussed, each participant only
performed one of the eight treatment combination on each day. In pilot studies, it was observed
that test participants would get disinterested when they are scheduled to perform all treatment
combinations within several days. Therefore, this experiment was designed in a way that only a
single treatment was assigned to each individual to prevent the carry-over effect and experiment
mortality over the course of the experiment.
4.1.1 Dependent and Independent Variables
Anna (2013) considers job requiring repetitive, forceful, or prolonged exertions of the hands;
frequent or heavy lifting, pushing, pulling, or carrying of heavy objects, as a major risk factor of
WMSD. According to the same author, the level of risk depends on the intensity, frequency, and
duration of the exposure to these conditions. Subsequently, frequency, duration, and the weight
of the lift were selected as the key characteristics (dependent variables) of this study and were
used to investigate how they affect a person’s recovery time and the subjective fatigue. Each task
factor had a low-end and a high-end value (Table 4.3).
Treatment #Frequency(lift/
min)Duration(m) Weight(kg)
1 6 5 102 9 5 103 6 5 204 9 5 205 6 10 106 9 10 107 6 10 208 9 10 20

25
Table 4.2: Experimental design layout
Duration
5 min `
10 min
participant
#
weight
weight
10 kg 20 kg 10 kg 20 kg Frequency Frequency Frequency Frequency 6 9 6 9 6 9 6 9 1 X 2 X 3 X 4 X 5 X 6 X 7 X 8 X
Table 4.3: Independent variables of the study (task-related)
Variable High End Low End
Frequency (lifts/min) 9 6
Weight (Kg) 20 10
Duration (min) 10 5
In this study, the values of frequency and weight of the lift were picked from Snook tables
(Snook & Ciriello, 1991). Before using Snook tables, we had to find what part of the table represent
our task the best in terms of lifting type and vertical and horizontal distance of the lift. For this
task, the first row and the second column matched our lifting task characteristics (Figure 4.1).
Based on the table, for lifts from knuckle to shoulder with a horizontal distance of 75cm and

26
vertical distance of 76cm (closest to our horizontal value of 63cm and vertical distance of 70cm),
10 kg is the weight that can be lifted by the 90th percentile of healthy male adults in the industry
when the lift is performed every 9 seconds (nearly 6 lifts per minute). As a result, 10 kg and 6 lifts
per minute were picked as the base values for weight and frequency of this experiment. In order
to have a clear distinction between the low-level and high-level, 20 kg was picked as the high level
of the weight. On the other hand, based on pilot studies conducted by the experimenter, doubling
the frequency (to use as the upper-level frequency) was not practical, and 9 lifts/ minute was found
to be the highest frequency that could be performed and was used as the high-level frequency. The
third task factor was the duration of the lift and based on pilot studies, 5-minute duration was found
to be the smallest time for a lifting task that would get the heart rate to reach a peak value and it
was picked as the lower level of the duration. Subsequently, 10-minute duration was selected as
the high-end.
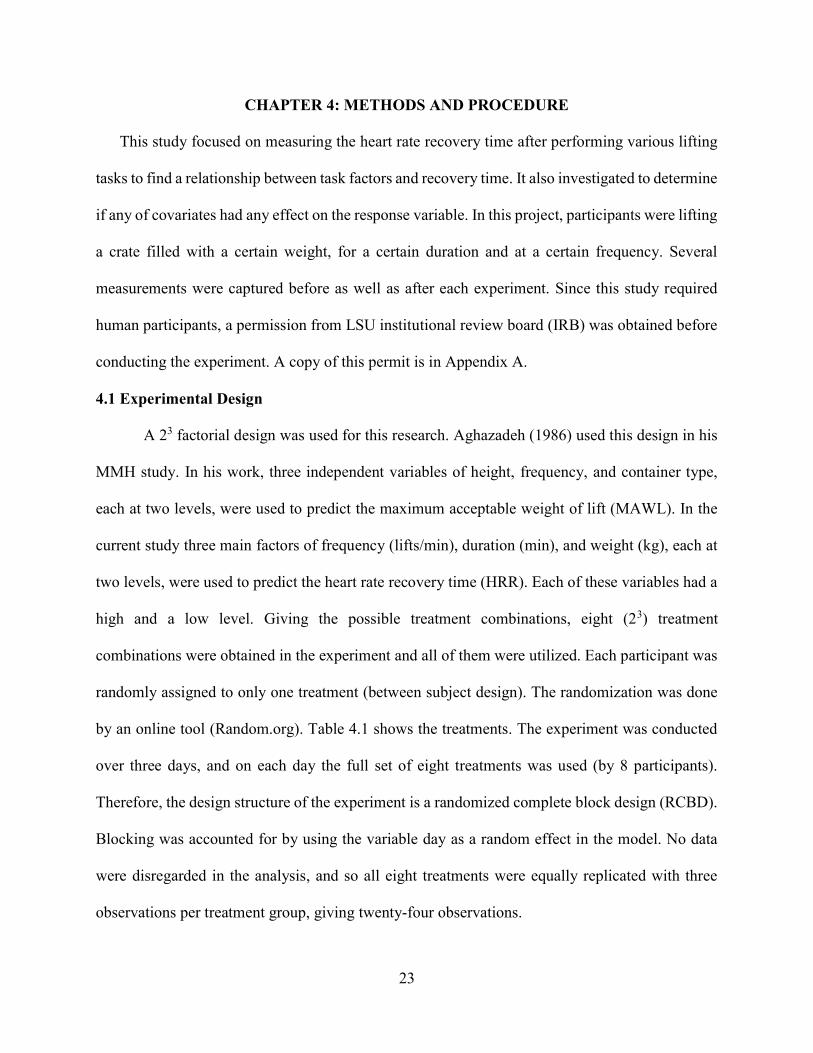
The first response variable was the heart rate recovery time. Pulat (1997) explains in a sub-
maximal physical activity, the heart rate is at a stable range before the activity and will reach to a
steady high level while the activity is in progress, and after finishing the activity it will reach to
some steady state (Figure 4.2). However, based on the nature of the task and individual
characteristics, the heart rate might not get back to the same steady state as in the pre-activity phase
and remains at a range above the resting level for some time (Brouha, 1967). Discovering the
duration before reaching a steady state was of the interest of this experiment. In this experiment,
the steady state is defined as a phase on the heartbeat graph (upon completion of the task) that the
heartbeats form a semi-horizontal line while fluctuating within a 10% range for a duration of at
least two minutes. For instance, upon completion of a given treatment (lifting task), if the heart
rate reached a phase with values between 65-75 beats per minute after 40 seconds and stayed in

27
that range for 2.4 minutes, that phase was defined as the steady state and the duration between the
end of the task to the beginning of the steady state (which in the above scenario was 40 seconds)
was recorded as the heart rate recovery time.
Figure 4.1: Snook table for lifts (Snook & Ciriello, 1991)
The secondary response variable was the perceived level of exertion. A common method
for rating the difficulty of a manual task is the use of Borg scale (Borg, 1982). The original Borg
Scale ranges from 6 to 20 points, but a modified version of Borg Scale called Borg CR10 was used
in this study, which employs a response format that ranges from a value of 0 (no exertion at all) to
10 (maximal exertion). A copy of the Borg CR10 is provided in Appendix C.
28
Figure 4.2: Heart rate in a sub-maximal physical activity (adopted from Pulat, 1997)
There were four operator-related variables captured before each experiment which were
not the main focus of this study. These confounding factors were studied to determine if they had
any significant effects on the heart rate recovery time. These variables were as follows: static arm
strength, grip strength, Body Mass Index (BMI), and the Physical Activity Rating (PA-R).
According to Ayoub (1986), using the results of static and dynamic strength tests are common
methods in determining the lifting capacity, job design, and employment placement. For instance,
measuring maximum two-handed static strength is a common method for determination of human
static strengths (Lee, 2004). Moreover, recording grip strength is a common method in pre-
employment screening and/or determining post-injury rehabilitation and job return (Ekşioğlu,
2016; Mohammadian et al., 2016).

29
The other two operator-related variables were BMI and PA-R. BMI is a measure of body fat based
on a person’s weight with respect to the stature and is calculated as body mass in kilograms divided
by the square of stature in meters. There are mixed results on how a person’s BMI might affect the
risk of developing LBP over the time as a result of performing MMH tasks (Xu et al., 2008). While
the effect of BMI on the physical strength or lower back pain are usually well described in the
literature, there are not that many studies that evaluate the effect of BMI on the heart rate recovery
time. A thorough search in the literature only found one study that evaluated the effect of BMI on
the heart rate recovery time. Lins et al. (2014) studied the effect of BMI on the heart rate recovery
time in a treadmill exercise testing. The results of their study show an inverse relationship between
a person’s BMI and the heart recovery time. The current research included BMI to test if it has any
effect on how participants’ heart rates recover following a lifting task. Since fitness of an individual
is an important factor in determining the level of physiological reaction to a physical activity
(Brouha, 1967), the subjective physical activity rating (PA-R) was taken into account to find how
the physical activity of a participant may affect the recovery time. PA-R was validated and used
by Jackson et al. (1990) in a study on NASA/Johnson Space Center employees. A copy of the PA-
R form can be found in Appendix D.
In summary, there were two dependent variables in this study: heart rate recovery time
(HRR) and Borg scale. Independent variables of this study were duration, frequency, and the
weight of the lift which were all task-related. There were also four operator-related variables such
as BMI, hand strength, static strength, and subjective PA-R which were studied as covariates.
Table 4.4 summarizes the variables of this study.

30
Table 4.4: List of all variables
Dependent Variables
HRR Heart rate recovery time in minutes: duration it takes for the HR to reach
a steady state after the lifting task.
Borg Scale Perceived difficulty of the task from 0-10
Task- Related Independent Variables
W Weight of the lift (in kg)
F Frequency of the lift (lifts/minute)
D Duration of the lift (in minutes)
Covariates
BMI Body Mass Index
SS Static Arm Strength (in kg)
HS Hand (grip) Strength (in kg)
PA-R Subjective physical activity rating
4.2 Tools and Equipment
The tools that were used in this study are as follows: a platform with adjustable shelves, a
wooden box, Gymboss timer, stopwatch, heart rate monitor, various weights, grip strength
dynamometer, and static strength platform.
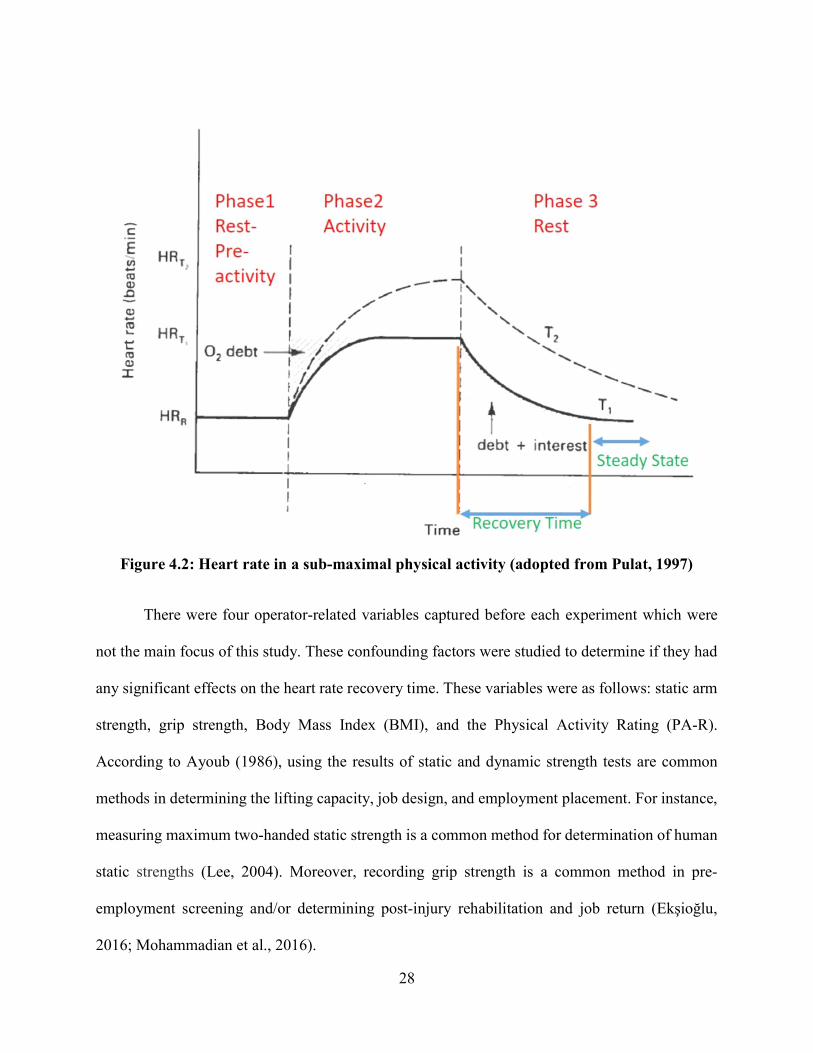
A wooden platform with adjustable shelves was used for the lifting task. The bottom shelf
was adjusted to the average knuckle height (77.8 cm) and the top shelf was adjusted to the average
shoulder height (147.6 cm) of test participants. Figure 4.3 shows the lifting platform.
31
Figure 4.3: Platform with adjustable shelves
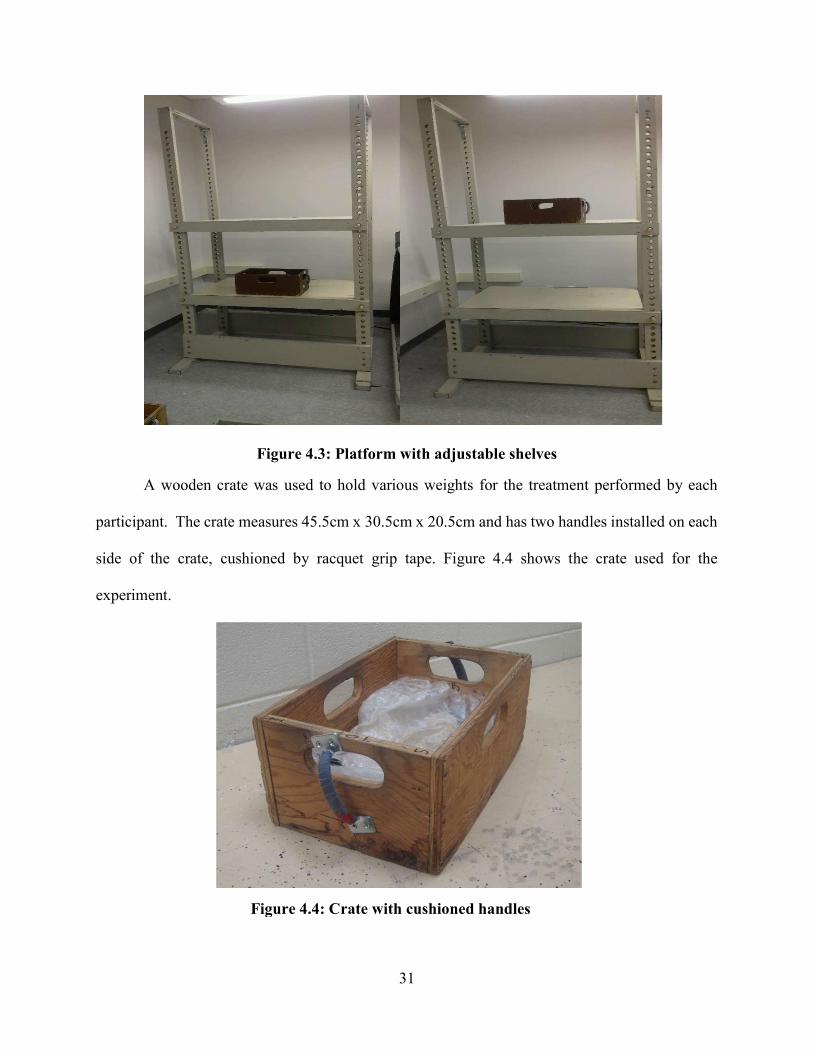
A wooden crate was used to hold various weights for the treatment performed by each
participant. The crate measures 45.5cm x 30.5cm x 20.5cm and has two handles installed on each
side of the crate, cushioned by racquet grip tape. Figure 4.4 shows the crate used for the
experiment.
Figure 4.4: Crate with cushioned handles
32
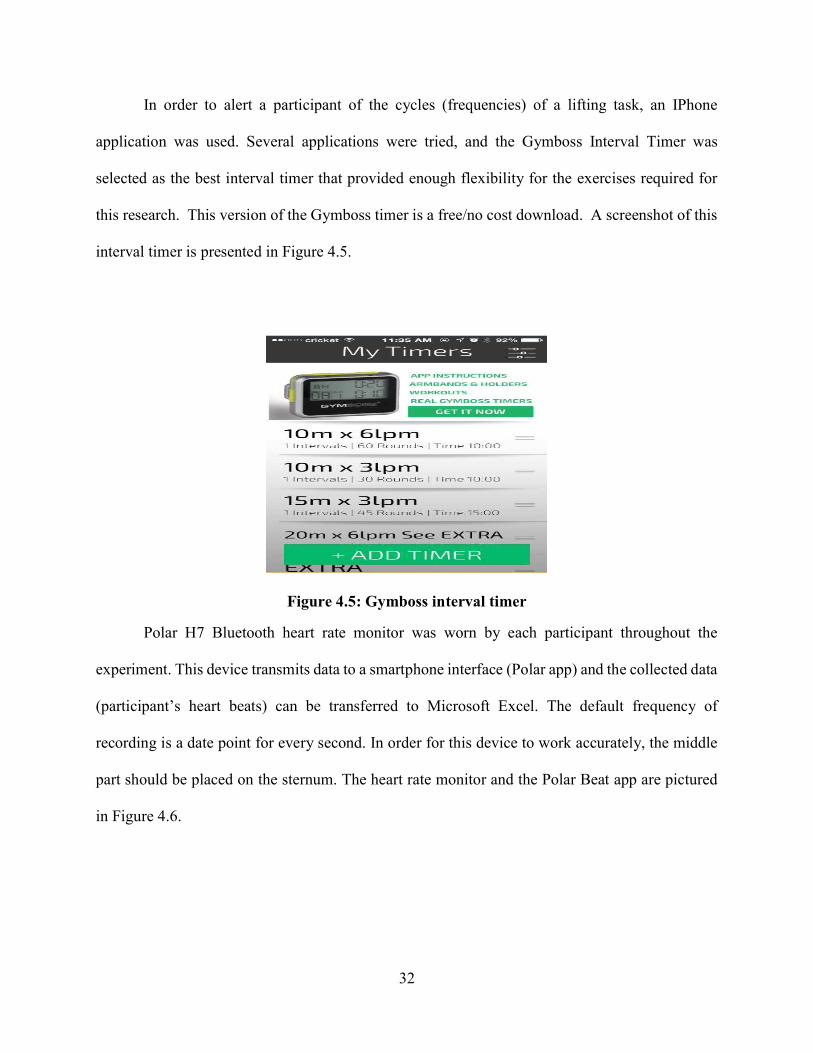
In order to alert a participant of the cycles (frequencies) of a lifting task, an IPhone
application was used. Several applications were tried, and the Gymboss Interval Timer was
selected as the best interval timer that provided enough flexibility for the exercises required for
this research. This version of the Gymboss timer is a free/no cost download. A screenshot of this
interval timer is presented in Figure 4.5.
Figure 4.5: Gymboss interval timer
Polar H7 Bluetooth heart rate monitor was worn by each participant throughout the
experiment. This device transmits data to a smartphone interface (Polar app) and the collected data
(participant’s heart beats) can be transferred to Microsoft Excel. The default frequency of
recording is a date point for every second. In order for this device to work accurately, the middle
part should be placed on the sternum. The heart rate monitor and the Polar Beat app are pictured
in Figure 4.6.

33
Figure 4.6: Polar H7 heart rate monitor and Polar Beat app.
A variety of weights were used to fill the crate as part of the experiment for each participant to
perform a lifting task with a certain weight (10 or 20 kg). A sample of some of the weights used is
presented in Figure 4.7.
Figure 4.7: A sample of weights used
The IPhone timer was used to keep a track of the duration of the tests and to inform the
participants of the end time of the experiment (Figure 4.8).

34
Figure 4.8: IPhone stopwatch
In this study, the grip strength and static arm strength of the participants were measured
before the lifting task. Both strength measurements were administrated three times and if the
coefficient of variation (μ σ) was less than 10%, the average of three trials was calculated;
otherwise, we would continue to the fourth trial. Grip strength was measured by a digital grip
dynamometer (Trailite, China) as depicted in Figure 4.9.
Figure 4.9: Digital dynamometer

35
Figure 4.10 shows the Static strength measurement platform along with the ST1 force
monitor (Dynadex Corp, Ann Arbor, MI), this platform was used to measure the static arm strength
of participants.
Figure 4.10: Static strength measurement platform
4.3 Research Hypotheses
For each dependent variable (the heart rate recovery time and Borg-ratings), the
following hypotheses were tested:
Hypothesis 1 for Frequency Main Effect
H10: The means of two levels of frequency are equal.

36
H11: The mean of one lifting frequency is significantly different from the other.
Hypothesis 2 for Weight Main Effect
H20: The means of two levels of weight are equal.
H21: The mean of one lifting weight is significantly different from the other.
Hypothesis 3 for Duration Main Effect
H30: The means of two levels of duration are equal.
H31: The mean of one lifting duration is significantly different from the other.
Hypothesis 4 for Frequency and Duration Interaction Effect
H40: There is no significant interaction between the frequency and duration effects.
H41: There is a significant interaction between the frequency and duration effects.
Hypothesis 5 for Frequency and Weight Interaction Effect
H50: There is no significant interaction between the frequency and weight effects.
H51: There is a significant interaction between the frequency and weight effects.
Hypothesis 6 for Duration and Weight Interaction Effect
H60: There is no significant interaction between the duration and weight effects.
H61: There is a significant interaction between the duration and weight effects.
Hypothesis 7 for Duration, Weight, and Frequency Interaction Effect
H70: There is no significant interaction between the duration, weight, and frequency
effects.
H71: There is a significant interaction between the duration, weight, and frequency effects.

37
4.4 Participants
In this experiment, a total of twenty-four male college students between the ages 20-37
were selected. The full demographic data for participants is presented in Appendix E. Table 4.5
shows a summary of participant data. The reason for not having any female participants is that
based on pilot studies, the general strength of female students was found to be less than their male
counterparts and as a result, the test protocol (e.g. weights lifted) needed to change for certain
treatments to accommodate females (e.g. females lifting less weight) and since one of the goals of
this study was to test heart rate elevation while lifting heavier weight, it was decided that only
male participants be used.
Table 4.5: Participant data summary
In order to screen any person with an existing health condition or medical history that might
be affected adversely by the experiment situation, a copy of consent form approved by the LSU
institutional review board (IRB) was handed to participants to read and sign prior to the
experiment. Section five of the consent form (subject inclusion) determines if a person is medically
ready to perform physical activities and checks for some health problems including the heart
condition, dizziness, chest pain, or fractures. If a selected participant answered yes to any of the
Data Average S.D Data Average S.D
Age 22.5 3.2 Shoulder Height (cm) 147.6 5.7
Height (cm) 177.9 5.8 BMI 25 3.2
Weight (kg) 79.4 12.4 Grip Strength (kg) 45 9.2
Knuckle height (cm) 77.8 4.2 Static Strength (kg) 26.7 6.8

38
questions, he would be excluded from the test. Based on the completed consent forms, all twenty-
four participants were qualified for this study, however, they were told that they are free to quit
the test at any point if they felt physical discomfort. A copy of the consent form is attached in
Appendix B.
4.5 Experimental Task
The task consisted of repetitive freestyle lifting of a box from knuckle to the shoulder height
(Figure 4.11), while no lowering was required. A helper lowered the box from the other side of the
lifting apparatus throughout the experiment. Banks and Aghazadeh (2009) describe freestyle
lifting as applying the posture that feels “most suitable” or “most natural”. Lifting was chosen due
the fact that is pervasively used in material handling despite of advancements in work
mechanization (Aghazadeh et al., 1998). Other MMH tasks such as lowering or pushing can be
tested in the future. Each person performed the lifting for a predetermined amount of weight, with
a specific frequency over a certain amount of time. Two responses were captured as a result of this
study: heart rate recovery time and Borg scale.
This experiment proceeded as follows:
1. Initiation: Upon arrival of the participant at the test place, the consent form was handed to
the participant and if no impeding medical history/condition was reported, the entire
experiment was explained to the participant. Demographic data such as height, weight, and
age, PA-R were also recorded. In addition, the grip strength and the static strength tests
were conducted.
2. Attaching the heart rate monitor: The heart rate transmitter was attached to the
participant’s chest and was worn through the experiment.
39
3. Warm up: Each participant was asked to walk on the treadmill with the speed of 3 miles
per hour (light jogging) for five minutes. This was meant to prevent any strains or injury
as a result of the lifting task.
4. The participant was asked to sit back and rest after warming up for at least fifteen minutes.
5. After the participant was well rested, the Polar Beat app was activated to capture the heart
rate activity before starting the task (for 5 minutes), throughout the experiment, as well as
after the task (for 10 minutes).
6. After 5 minutes of monitoring the heart rate, participant was then proceeded to perform the
lifting task. Each person performed one exclusive assigned task (for example, “lift 10 kg
for 10 minutes at 6 lifts per minute”). The participant began the lifting with the activation
of the interval timer. The Gymboss app would announce the start of each lift cycle with a
beep sound.
7. Exercise completion: Upon completion of each treatment, the participant was asked to rate
the difficulty of the exercise using the Borg scale. During the recovery, the participant was
asked to sit and relax with no distraction (cell phone use, eating, taking, etc.) for 10
minutes. According to London & Bhattacharya (1985), in physical tasks which are not
excessively fatiguing, the heart rate should stabilize after approximately 5 minutes. In this
experiment, all test participants rested for 10 minutes after performing the lifting task while
their heart rate was monitored.
Subsequent lifting tasks: Each participant performed one of the total 8 lifting tasks
(treatments). On day two and three, the exact procedure was repeated by other participants.

40
Figure 4.11: The lifting experiment
4.6 Heart Rate Data Processing
The heart rate activity for each test participant, regardless of the assigned treatment, was
monitored for 5 minutes before the task, during the lifting task, and 10 minutes following the task
to give us a standard protocol in finding the recovery time. The heart rate monitor used in this
study captures a reading (data point) for every second. In order to find the heart rate recovery time,
the heart rate graph (beats against time) was drawn in Excel and a smoothing algorithm was applied
to the graph. This experiment used the simple moving average method with time frames of 30
seconds. Then, the recovery duration was determined using the Excel gridlines. The technique
used was to find how long it takes for the heart rate to return to a steady state after the lifting task
was completed. The steady state was defined as a phase on the heartbeat graph (smoothed one)
that the heartbeats form a semi-horizontal line while fluctuating within a 10% range. The minimum

41
length (time) for a phase to be considered “steady”, was decided to be 2 minutes. For further
illustration of the used technique, Figure 4.12 presents the rough graph of the heart rate drawn for
a 5-minute lifting task and Figure 4.13 shows the heart rate graph for the same task after smoothing.
Figure 4.12: An example of rough graph of the heart rate
Figure 4.13: An example of smoothed heart rate graph
50
60
70
80
90
100
110
1201 52 103
154
205
256
307
358
409
460
511
562
613
664
715
766
817
868
919
970
1021
1072
1123
1174
HR
(bea
ts p
er m
inut
e)
Time (second)
HR vs. Time
50
60
70
80
90
100
110
120
30 90 150
210
270
330
390
450
510
570
630
690
750
810
870
930
990
1050
1110
1170
HR
(bea
ts p
er m
inut
e)
Time (second)
HR vs. Time
42
CHAPTER 5: RESULTS AND ANALYSIS
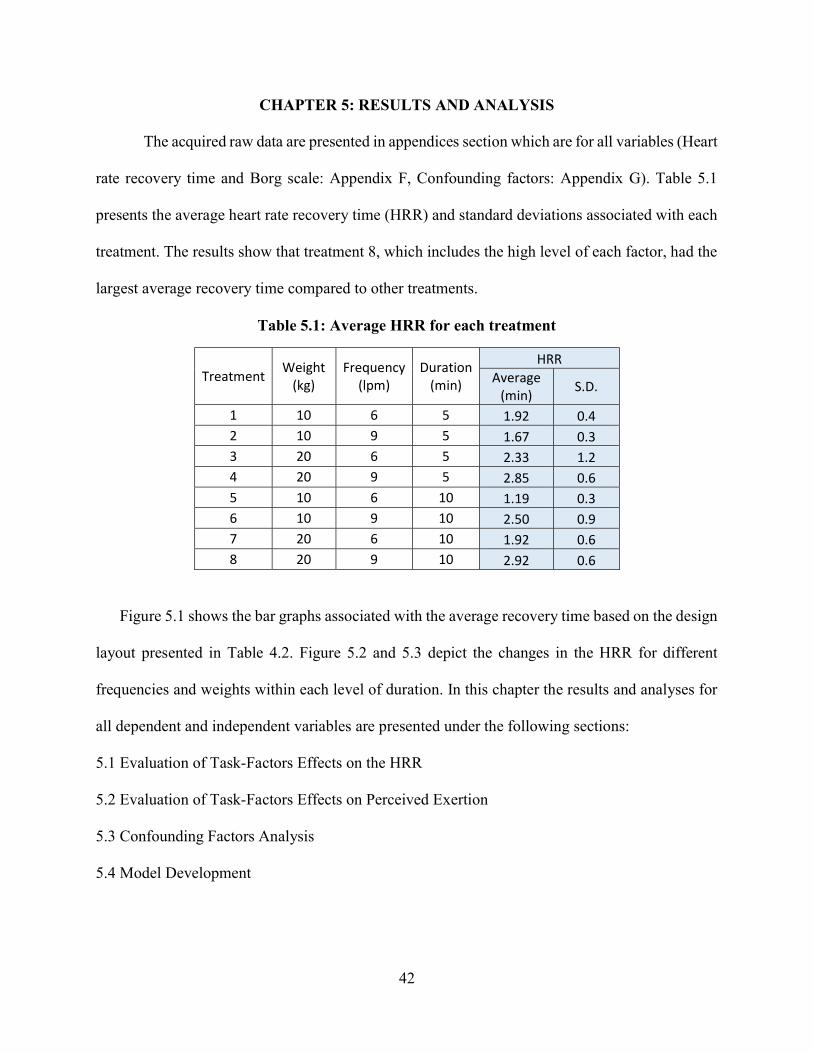
The acquired raw data are presented in appendices section which are for all variables (Heart
rate recovery time and Borg scale: Appendix F, Confounding factors: Appendix G). Table 5.1
presents the average heart rate recovery time (HRR) and standard deviations associated with each
treatment. The results show that treatment 8, which includes the high level of each factor, had the
largest average recovery time compared to other treatments.
Table 5.1: Average HRR for each treatment
Treatment Weight (kg)
Frequency (lpm)
Duration (min)
HRR Average
(min) S.D.
1 10 6 5 1.92 0.4 2 10 9 5 1.67 0.3 3 20 6 5 2.33 1.2 4 20 9 5 2.85 0.6 5 10 6 10 1.19 0.3 6 10 9 10 2.50 0.9 7 20 6 10 1.92 0.6 8 20 9 10 2.92 0.6
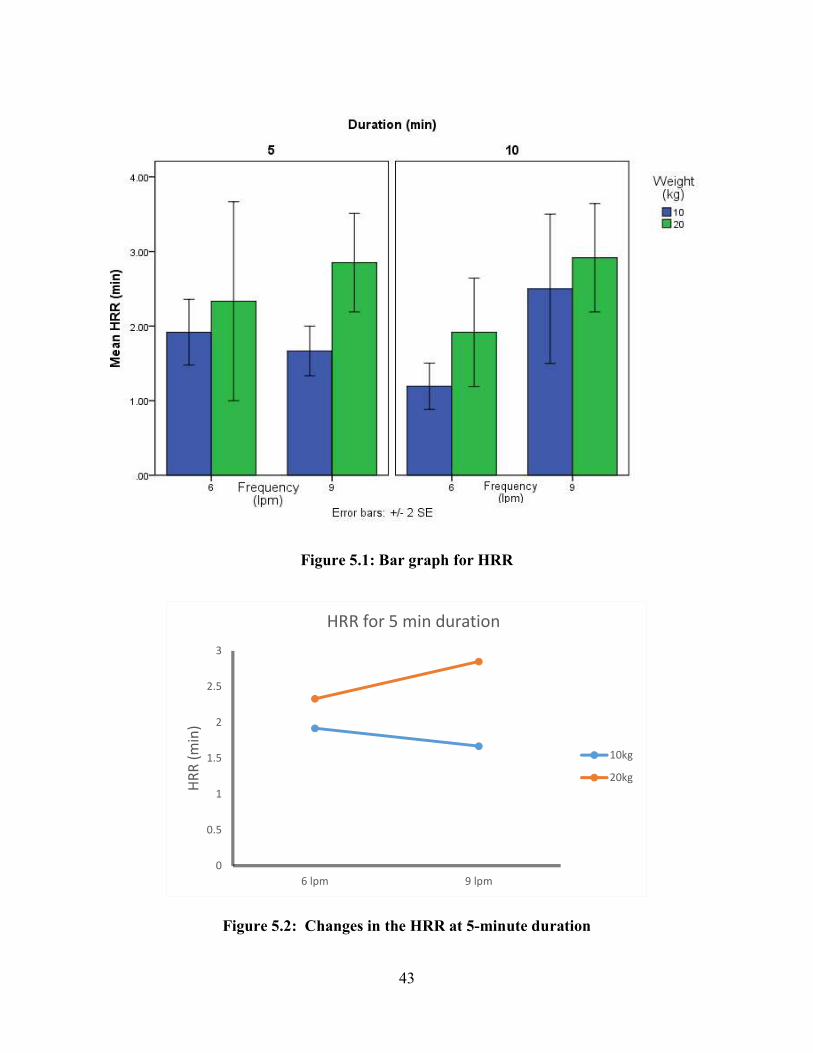
Figure 5.1 shows the bar graphs associated with the average recovery time based on the design
layout presented in Table 4.2. Figure 5.2 and 5.3 depict the changes in the HRR for different
frequencies and weights within each level of duration. In this chapter the results and analyses for
all dependent and independent variables are presented under the following sections:
5.1 Evaluation of Task-Factors Effects on the HRR
5.2 Evaluation of Task-Factors Effects on Perceived Exertion
5.3 Confounding Factors Analysis
5.4 Model Development
43
Figure 5.1: Bar graph for HRR
Figure 5.2: Changes in the HRR at 5-minute duration
0
0.5
1
1.5
2
2.5
3
6 lpm 9 lpm
HRR
(min
)
HRR for 5 min duration
10kg
20kg
44
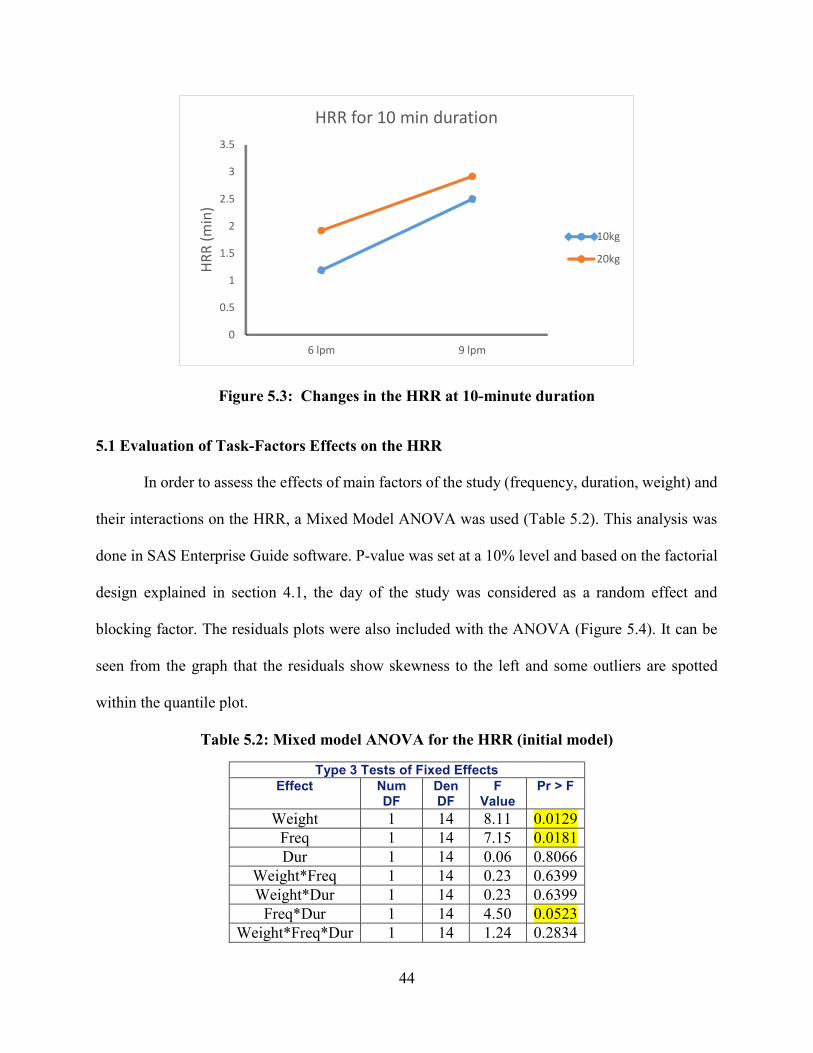
Figure 5.3: Changes in the HRR at 10-minute duration
5.1 Evaluation of Task-Factors Effects on the HRR
In order to assess the effects of main factors of the study (frequency, duration, weight) and
their interactions on the HRR, a Mixed Model ANOVA was used (Table 5.2). This analysis was
done in SAS Enterprise Guide software. P-value was set at a 10% level and based on the factorial
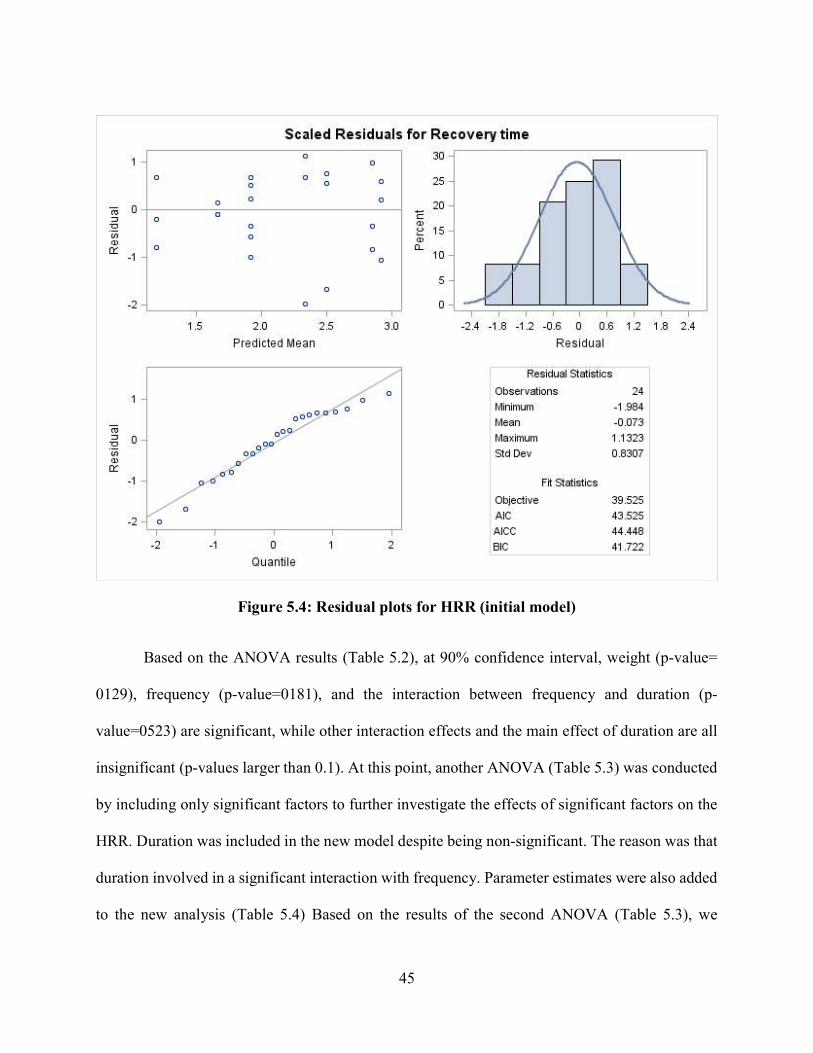
design explained in section 4.1, the day of the study was considered as a random effect and
blocking factor. The residuals plots were also included with the ANOVA (Figure 5.4). It can be
seen from the graph that the residuals show skewness to the left and some outliers are spotted
within the quantile plot.
Table 5.2: Mixed model ANOVA for the HRR (initial model)
Type 3 Tests of Fixed Effects Effect Num
DF Den DF
F Value
Pr > F
Weight 1 14 8.11 0.0129 Freq 1 14 7.15 0.0181 Dur 1 14 0.06 0.8066
Weight*Freq 1 14 0.23 0.6399 Weight*Dur 1 14 0.23 0.6399
Freq*Dur 1 14 4.50 0.0523 Weight*Freq*Dur 1 14 1.24 0.2834
0
0.5
1
1.5
2
2.5
3
3.5
6 lpm 9 lpm
HRR
(min
)
HRR for 10 min duration
10kg
20kg
45
Figure 5.4: Residual plots for HRR (initial model)
Based on the ANOVA results (Table 5.2), at 90% confidence interval, weight (p-value=
0129), frequency (p-value=0181), and the interaction between frequency and duration (p-
value=0523) are significant, while other interaction effects and the main effect of duration are all
insignificant (p-values larger than 0.1). At this point, another ANOVA (Table 5.3) was conducted
by including only significant factors to further investigate the effects of significant factors on the
HRR. Duration was included in the new model despite being non-significant. The reason was that
duration involved in a significant interaction with frequency. Parameter estimates were also added
to the new analysis (Table 5.4) Based on the results of the second ANOVA (Table 5.3), we
46
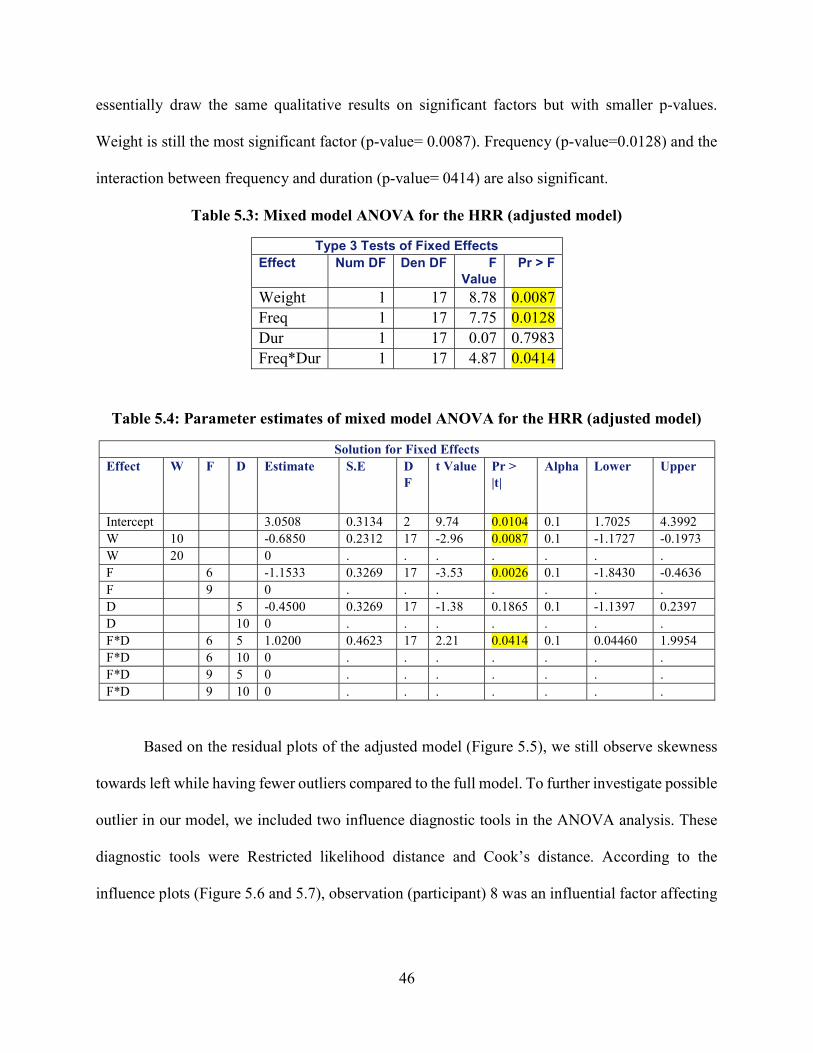
essentially draw the same qualitative results on significant factors but with smaller p-values.
Weight is still the most significant factor (p-value= 0.0087). Frequency (p-value=0.0128) and the
interaction between frequency and duration (p-value= 0414) are also significant.
Table 5.3: Mixed model ANOVA for the HRR (adjusted model)
Type 3 Tests of Fixed Effects Effect Num DF Den DF F
Value Pr > F
Weight 1 17 8.78 0.0087 Freq 1 17 7.75 0.0128 Dur 1 17 0.07 0.7983 Freq*Dur 1 17 4.87 0.0414
Table 5.4: Parameter estimates of mixed model ANOVA for the HRR (adjusted model)
Solution for Fixed Effects Effect W F D Estimate S.E D
F t Value Pr >
|t| Alpha Lower Upper
Intercept 3.0508 0.3134 2 9.74 0.0104 0.1 1.7025 4.3992 W 10 -0.6850 0.2312 17 -2.96 0.0087 0.1 -1.1727 -0.1973 W 20 0 . . . . . . . F 6 -1.1533 0.3269 17 -3.53 0.0026 0.1 -1.8430 -0.4636 F 9 0 . . . . . . . D 5 -0.4500 0.3269 17 -1.38 0.1865 0.1 -1.1397 0.2397 D 10 0 . . . . . . . F*D 6 5 1.0200 0.4623 17 2.21 0.0414 0.1 0.04460 1.9954 F*D 6 10 0 . . . . . . . F*D 9 5 0 . . . . . . . F*D 9 10 0 . . . . . . .
Based on the residual plots of the adjusted model (Figure 5.5), we still observe skewness
towards left while having fewer outliers compared to the full model. To further investigate possible
outlier in our model, we included two influence diagnostic tools in the ANOVA analysis. These
diagnostic tools were Restricted likelihood distance and Cook’s distance. According to the
influence plots (Figure 5.6 and 5.7), observation (participant) 8 was an influential factor affecting
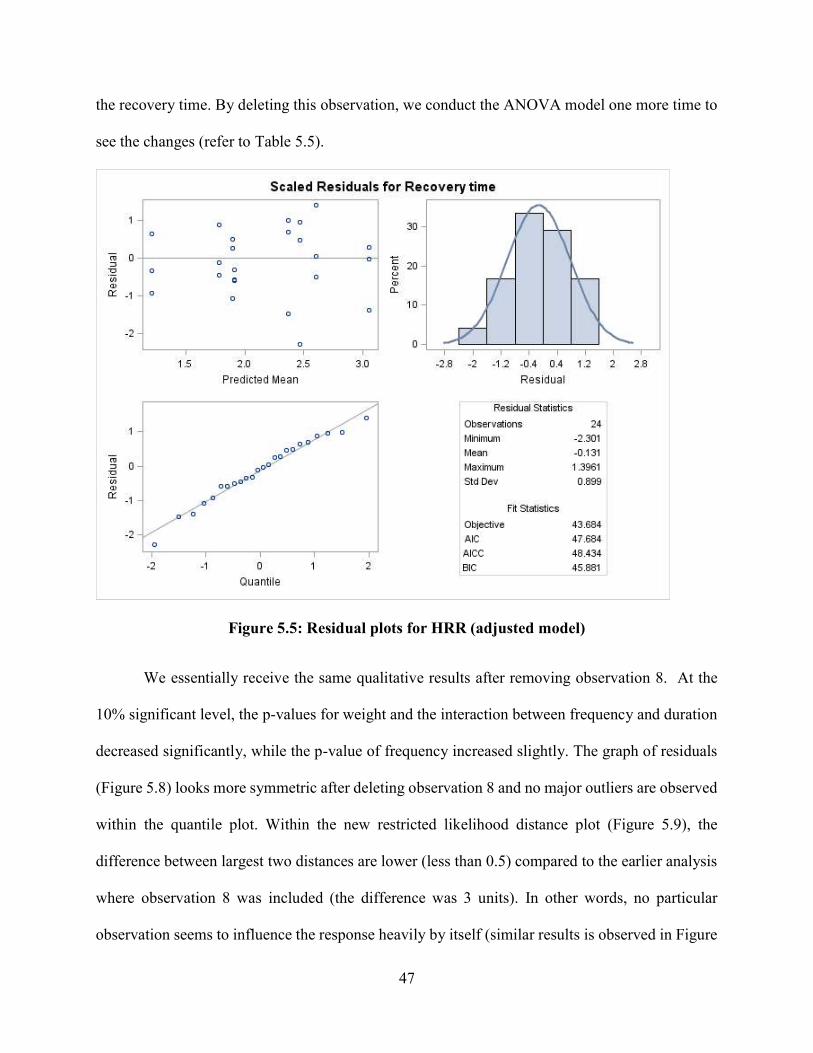
47
the recovery time. By deleting this observation, we conduct the ANOVA model one more time to
see the changes (refer to Table 5.5).
Figure 5.5: Residual plots for HRR (adjusted model)
We essentially receive the same qualitative results after removing observation 8. At the
10% significant level, the p-values for weight and the interaction between frequency and duration
decreased significantly, while the p-value of frequency increased slightly. The graph of residuals
(Figure 5.8) looks more symmetric after deleting observation 8 and no major outliers are observed
within the quantile plot. Within the new restricted likelihood distance plot (Figure 5.9), the
difference between largest two distances are lower (less than 0.5) compared to the earlier analysis
where observation 8 was included (the difference was 3 units). In other words, no particular
observation seems to influence the response heavily by itself (similar results is observed in Figure

48
5.10). Figure 5.11 depicts the plot of restricted likelihood distance with and without having
observation 8.
Figure .65 : Restricted likelihood distance (with 24 Obs.)
Figure 5.7: Cook’s distance (with 24 Obs.)
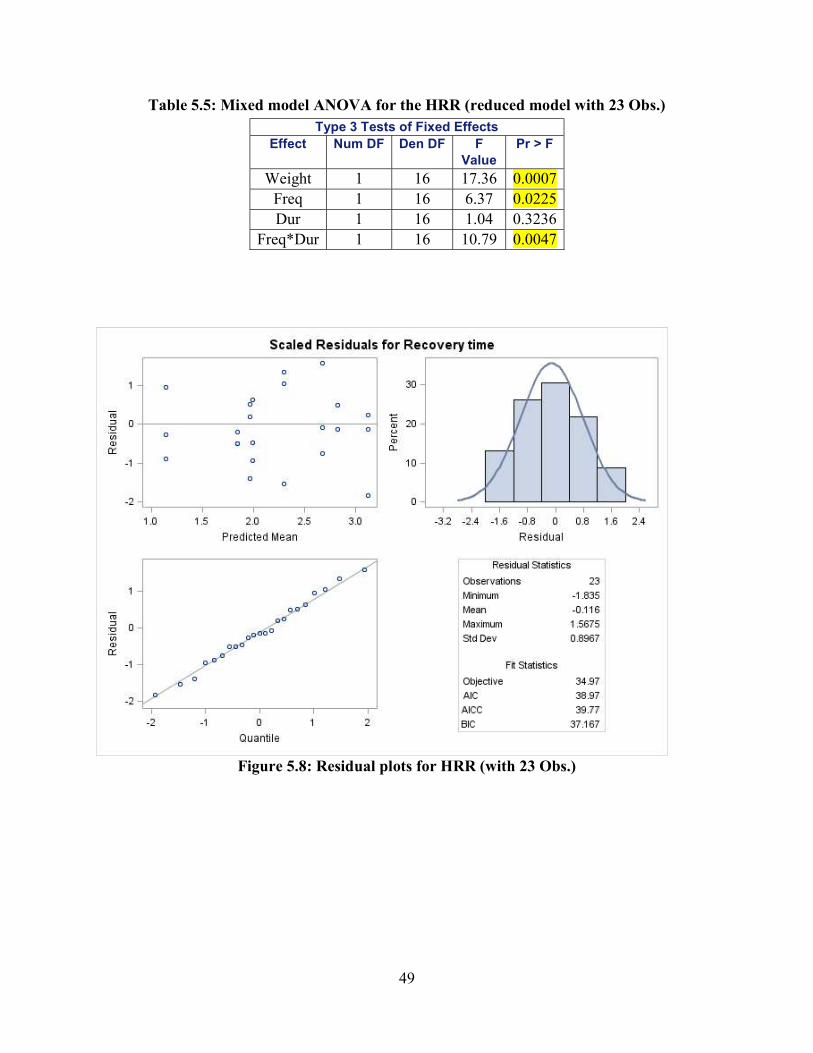
49
Table 5.5: Mixed model ANOVA for the HRR (reduced model with 23 Obs.)
Figure .85 : Residual plots for HRR (with 23 Obs.)
Type 3 Tests of Fixed Effects Effect Num DF Den DF F
Value Pr > F
Weight 1 16 17.36 0.0007 Freq 1 16 6.37 0.0225 Dur 1 16 1.04 0.3236
Freq*Dur 1 16 10.79 0.0047
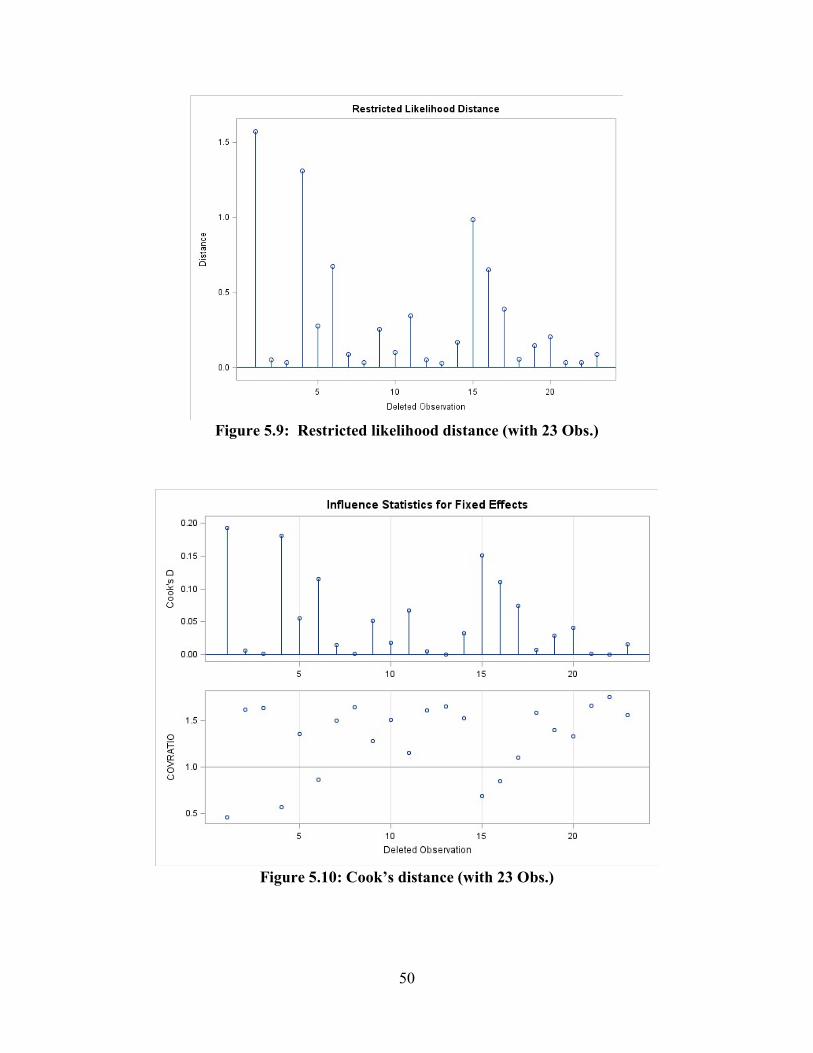
50
Figure .95 : Restricted likelihood distance (with 23 Obs.)
Figure 5.10: Cook’s distance (with 23 Obs.)

51
Figure .15 1: Restricted likelihood distance with and without Obs.8
5.2 Evaluation of Task-Factors Effects on Perceived Exertion
After the lifting session, participants were asked to rate their perceived exertions on the Borg
CR-10 scale. Table 5.6 presents the average Borg-ratings and standard deviations associated with
each treatment. Treatment 1 (lifting 10 kg for 5 minutes at 6 lifts per minute) was perceived as the
Table 5.6: Average Borg scores for each treatment
Treatment Weight (kg)
Frequency (lpm)
Duration (min)
Borg Average S.D.
1 10 6 5 5 2 2 10 9 5 6.7 0.6 3 20 6 5 7.7 0.6 4 20 9 5 6.7 0.6 5 10 6 10 5.7 0.6 6 10 9 10 6.3 1.2 7 20 6 10 7 3.6 8 20 9 10 7 1
0
0.5
1
1.5
2
2.5
3
3.5
4
4.5
1 2 3 4 5 6 7 8 9 10 11 12 13 14 15 16 17 18 19 20 21 22 23 24
DIST
ANCE
OBSERVATIONS
Restricted Likelihood Distance
Before deleting obs.8 After deleting obs.8

52
the least strenuous task (5), followed by treatments 5 (5. 7) and 6 (6. 3). The highest Borg rating
was associated with treatments 3 (lifting 20 kg for 5 minutes at 6 lifts per minute) with an average
score of 7. 7. A mixed model ANOVA was carried out for the Borg scale (Table 5.7). The results
show that at 10% significant level, only weight of the lift had a significant effect on perceived
level of exertion (p-value=0.0894).
Table 5.7: Mixed model ANOVA for Borg
Type 3 Tests of Fixed Effects Effect Num
DF Den
DF F
Value Pr > F
Weight 1 14 3.33 0.0894 Freq 1 14 0.27 0.6102 Dur 1 14 0.00 1.0000 Weight*Freq 1 14 1.70 0.2134 Weight*Dur 1 14 0.07 0.7981 Freq*Dur 1 14 0.00 1.0000 Weight*Freq*Dur 1 14 0.61 0.4472
5.3 Confounding Factors Analysis
In order to investigate if the covariates of this study (BMI, static strength, hand strength,
PA-R) had any possible effect on the HRR, an analysis of covariance was carried out in SPSS. The
results (Table5.8) show that none of the confounding factors had a significant p-value.
5.4. Model Development
All the analysis presented in this section are based on the full factorial set (24 data points)
and the methods used to develop the model are based on Maiti & Bagchi (2006) study. First, to
analyze the main effect of each lifting factor, the grand average of the heart rate recovery time with
respect to each individual lifting parameter (at two levels) was calculated and three linear graphs
were drawn. (Figure 5.12-5.14). Then, the best-fit equation for each graph was obtained (Equations
5.1-5.3).

53
Table 5.8: ANCOVA for operator-related variables
Tests of Between-Subjects Effects
Dependent Variable: Recovery time
Source Type III Sum
of Squares
df Mean
Square
F Sig.
Corrected Model 8.699a 11 .791 1.642 .203
Intercept 1.300 1 1.300 2.699 .126
Static
Strength(KG)
.277 1 .277 .574 .463
BMI .514 1 .514 1.068 .322
Grip Strength
(KG)
.783 1 .783 1.625 .226
PAR .067 1 .067 .140 .715
Weight 2.285 1 2.285 4.744 .050
Freq 2.794 1 2.794 5.801 .033
Dur 1.359E-5 1 1.359E-5 .000 .996
Weight * Freq .472 1 .472 .979 .342
Weight * Dur .083 1 .083 .172 .686
Freq * Dur 1.142 1 1.142 2.371 .150
Weight * Freq *
Dur
.011 1 .011 .024 .880
Error 5.781 12 .482
Total 126.627 24
Corrected Total 14.480 23
a. R Squared = .601 (Adjusted R Squared = .235)
The best-fit equation of graph 5.12 for the average HRR based on two levels of weight is as
follows:
HRR for weight response: y = 0.1584 Weight + 0.2623 (5.1)

54
Figure .15 2: Effect of weight on HRR
The best-fit equation of graph 5.13 for the average HRR based on two levels of frequency is as
follows:
HRR for frequency response: y = 0.1488 Frequency + 0.2768 (5.2)
Figure .15 3: Effect of frequency on HRR
y = 0.1584 W + 0.2623
0.1
0.2
0.3
0.4
0.5
0.6
0.7
10 20
HRR
(min
)
Weight (Kg)
y = 0.1488 F + 0.2768
0.1
0.2
0.3
0.4
0.5
0.6
0.7
6 9
HRR
(min
)
Frequency (lpm)
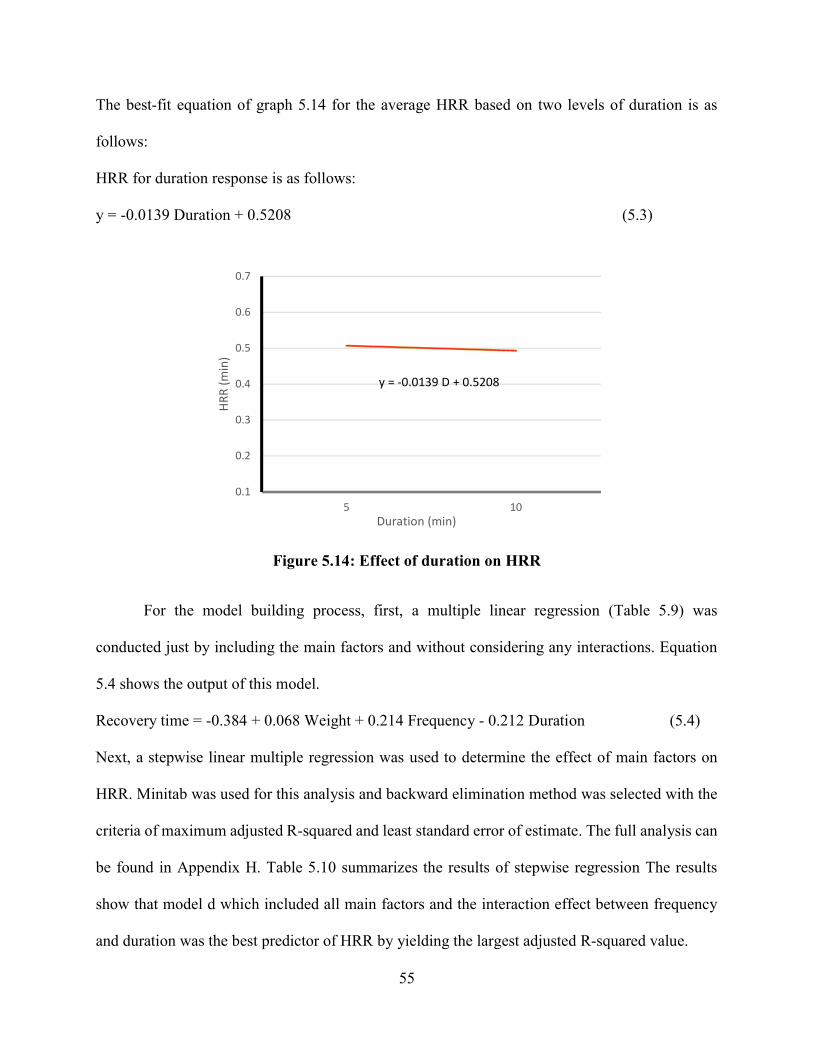
55
The best-fit equation of graph 5.14 for the average HRR based on two levels of duration is as
follows:
HRR for duration response is as follows: y = -0.0139 Duration + 0.5208 (5.3)
Figure 5.14: Effect of duration on HRR
For the model building process, first, a multiple linear regression (Table 5.9) was
conducted just by including the main factors and without considering any interactions. Equation
5.4 shows the output of this model.
Recovery time = -0.384 + 0.068 Weight + 0.214 Frequency - 0.212 Duration (5.4)
Next, a stepwise linear multiple regression was used to determine the effect of main factors on
HRR. Minitab was used for this analysis and backward elimination method was selected with the
criteria of maximum adjusted R-squared and least standard error of estimate. The full analysis can
be found in Appendix H. Table 5.10 summarizes the results of stepwise regression The results
show that model d which included all main factors and the interaction effect between frequency
and duration was the best predictor of HRR by yielding the largest adjusted R-squared value.
y = -0.0139 D + 0.5208
0.1
0.2
0.3
0.4
0.5
0.6
0.7
5 10
HRR
(min
)
Duration (min)

56
Table 5.9: Linear regression for main factors
Parameter Estimates Variable DF Parameter
Estimate Standard
Error t Value Pr > |t| Standardized
Estimate Intercept 1 -0.38417 0.91632 -0.42 0.6795 0 Weight 1 0.06850 0.02763 2.48 0.0222 0.44094 Freq 1 0.21444 0.09209 2.33 0.0305 0.41412 Dur 1 -0.01200 0.05526 -0.22 0.8303 -0.03862
R-Squared= 0.3674 (Adjusted R-Squared =0.2725)
Table 5.10: Stepwise Regression Summary
Model R R Square Adjusted R Square
Std. Error of the Estimate
a .718a .516 .304 .66183
b .697b .4862 .318 .661568
c .693c .4807 .351 .646347
d .689d .4752 .371 .632419
a Predictors: (Constant), WFD, F, D, W, WF, WD, FD, b Predictors: (Constant), F, D, W, WF, WD, FD c Predictors: (Constant), F, D, W, WD, FD d Predictors: (Constant), F, D, W, FD
A separate multiple regression analysis was carried out based on the factors identified in
model d. Table 5.11 shows this analysis. Based on the regression analysis, the heart rate recovery
equation is as follows:
Recovery time = 3.44 + 0.0685 Weight - 0.296 Frequency - 0.522 Duration (5.5)
+ 0.0680 Frequency*Duration

57
Table 5.11: Multiple regression for model d
Parameter Estimates Variable DF Parameter
Estimate Standard
Error t Value Pr > |t| Standardized
Estimate Intercept 1 3.44083 2.11727 1.63 0.1206 0 Weight 1 0.06850 0.02582 2.65 0.0157 0.44094 Freq 1 -0.29556 0.27215 -1.09 0.2911 -0.57076 Dur 1 -0.52200 0.26330 -1.98 0.0621 -1.68009 Freq*Dur 1 0.06800 0.03442 1.98 0.0629 1.94221
R-Squared= 0.4752 (Adjusted R-Squared =0.3647)
58
CHAPTER 6: DISCUSSION
In an exhaustive review of the literature, no previous study was found that attempts to
quantify the heart rate recovery time in a manual task by the use of task factors. The goal of this
study was to determine heart rate recovery time based on the collected data from a series of lifting
experiments and to further quantify the heart rate recovery time. Task factors used in this study
were frequency, duration, and weight of the lift. In addition to that, for further clarification, an
attempt was made to investigate the relationship between the heart rate recovery time and three
task factors. The discussion chapter is divided into the same order of sub-categories as in the result
section.
6.1 Effect of Task Factors on the HRR
Table 6.1 summarizes the average recovery time values based on each factor of the study.
According to this table, except for duration, the average recovery time within the higher level of
each factor is larger than the lower level. On average, for all participants, doubling the weight
(from 10 to 20 kg) led to an approximate increase of 37% in the recovery time, while increasing
frequency from 6 to 9 lifts per minute increased the recovery time by almost 35%. On the other
hand, increasing the duration from 10 minutes to 20 minutes, resulted in a 2.7% decrease in the
average recovery time.
The result of Tests of Fixed Effects” in Table 5.3 reveals that weight (F=8.780, p=0.0087),
frequency (F=7.750, p=0.0128), and the interaction between frequency and duration (F=4.870,
p=0.0414) significantly affected the recovery time, while duration as a main effect did not have a
significant effect on the HRR (F=0.07, p=0.7983). According to the Solutions for Fixed Effects in
Table 5.4, based on the lower and upper limits, we are 90% confident that the average recovery
time is anywhere between 0.1973 to 1.727 longer when larger weight (20 kg) was lifted compared
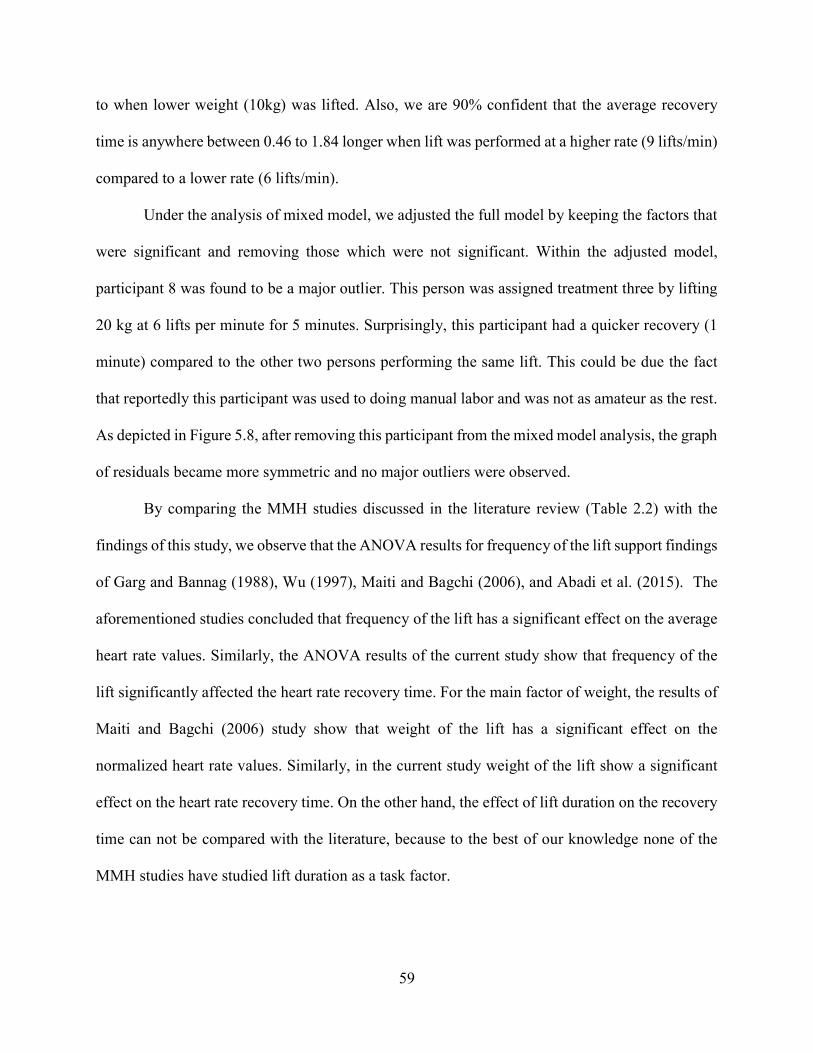
59
to when lower weight (10kg) was lifted. Also, we are 90% confident that the average recovery
time is anywhere between 0.46 to 1.84 longer when lift was performed at a higher rate (9 lifts/min)
compared to a lower rate (6 lifts/min).
Under the analysis of mixed model, we adjusted the full model by keeping the factors that
were significant and removing those which were not significant. Within the adjusted model,
participant 8 was found to be a major outlier. This person was assigned treatment three by lifting
20 kg at 6 lifts per minute for 5 minutes. Surprisingly, this participant had a quicker recovery (1
minute) compared to the other two persons performing the same lift. This could be due the fact
that reportedly this participant was used to doing manual labor and was not as amateur as the rest.
As depicted in Figure 5.8, after removing this participant from the mixed model analysis, the graph
of residuals became more symmetric and no major outliers were observed.
By comparing the MMH studies discussed in the literature review (Table 2.2) with the
findings of this study, we observe that the ANOVA results for frequency of the lift support findings
of Garg and Bannag (1988), Wu (1997), Maiti and Bagchi (2006), and Abadi et al. (2015). The
aforementioned studies concluded that frequency of the lift has a significant effect on the average
heart rate values. Similarly, the ANOVA results of the current study show that frequency of the
lift significantly affected the heart rate recovery time. For the main factor of weight, the results of
Maiti and Bagchi (2006) study show that weight of the lift has a significant effect on the
normalized heart rate values. Similarly, in the current study weight of the lift show a significant
effect on the heart rate recovery time. On the other hand, the effect of lift duration on the recovery
time can not be compared with the literature, because to the best of our knowledge none of the
MMH studies have studied lift duration as a task factor.

60
Table 6.1: Average recovery time among different levels of each factor
Factor Level HRR (min) Percentage change
Weight 10 1.82
+37.4% 20 2.50
Frequency
(lpm)
6 1.84 +34.8%
9 2.48
Duration
(min)
5 2.19 -2.7%
10 2.13
6.2 Effect of Task-Factors On the Perceived Exertion
The second independent variable of the study was Borg scale. Table 6.2 summarizes the
average Borg-rating values based on each factor of this study. According to this table, except for
the weight, there is no meaningful difference in the perceived level of exertion when we compare
the high level and low level of each task factor. In the case of weight of the lift, doubling the weight
(from 10 to 20 kg), led to a 20% increase in the average Borg scale among test participants.
Similar to the HRR, a mixed model analysis was performed for this variable based on the full
factorial model (Table 5.7). The results show that among main factors and interactions, just weight
of the lift had a significant effect on the Borg values (p-value =0.08) and none of the other main
factors or interactions had a significant effect on the perceived level of exertion. In other words,
based on the results of the subjective survey, participants experienced more exertion when the
larger weight was lifted. The insignificant p-values for the frequency of the lift did not support
findings by Garg & Banaag (1998) and Wu (1997) that frequency of the lift significantly affects
the rating of perceived exertion. Unlike to the HRR, additional ANOVA models were not
developed for Borg rating since among all factors, just weight of the lift was significant.
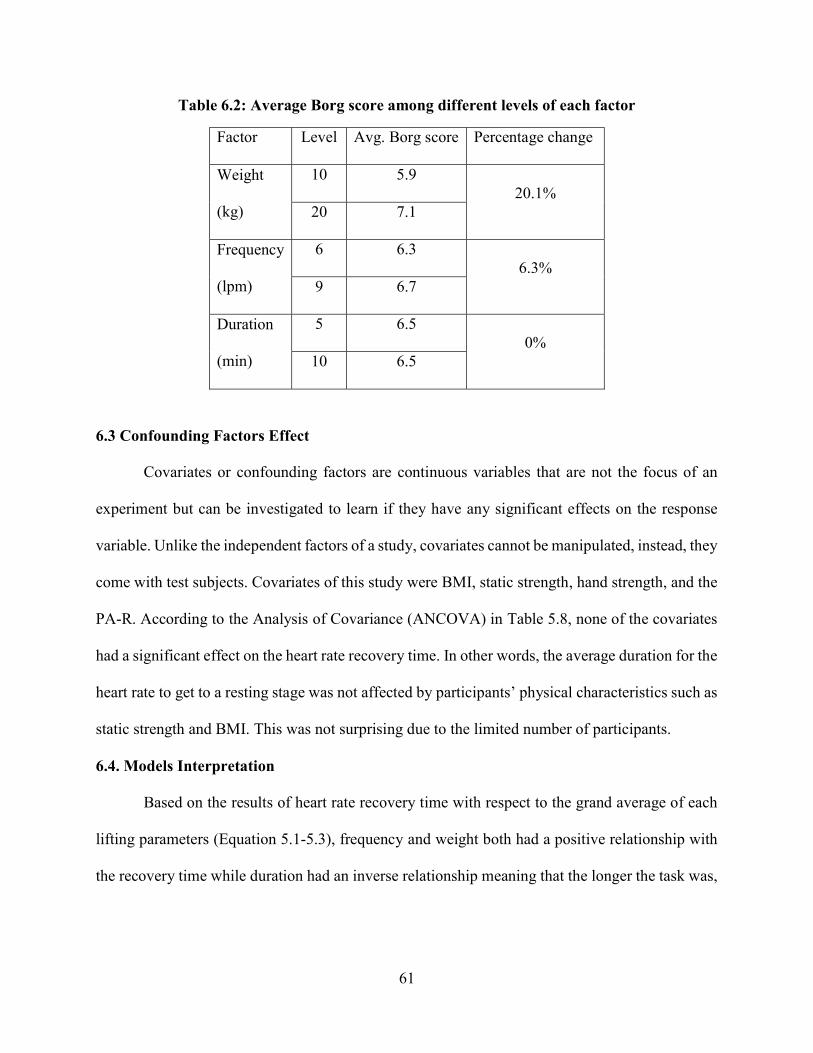
61
Table 6.2: Average Borg score among different levels of each factor
Factor Level Avg. Borg score Percentage change
Weight
(kg)
10 5.9 20.1%
20 7.1
Frequency
(lpm)
6 6.3 6.3%
9 6.7
Duration
(min)
5 6.5 0%
10 6.5
6.3 Confounding Factors Effect
Covariates or confounding factors are continuous variables that are not the focus of an
experiment but can be investigated to learn if they have any significant effects on the response
variable. Unlike the independent factors of a study, covariates cannot be manipulated, instead, they
come with test subjects. Covariates of this study were BMI, static strength, hand strength, and the
PA-R. According to the Analysis of Covariance (ANCOVA) in Table 5.8, none of the covariates
had a significant effect on the heart rate recovery time. In other words, the average duration for the
heart rate to get to a resting stage was not affected by participants’ physical characteristics such as
static strength and BMI. This was not surprising due to the limited number of participants.
6.4. Models Interpretation
Based on the results of heart rate recovery time with respect to the grand average of each
lifting parameters (Equation 5.1-5.3), frequency and weight both had a positive relationship with
the recovery time while duration had an inverse relationship meaning that the longer the task was,

62
the shorter recovery time was needed. With respect to duration, participants commented that they
were getting used to a task after a few minutes of performing it.
By comparing the R-squared values between the initial model including only the main
factors (Equation 5.4) and the final model including main factors and one interaction effect
(Equation 5.5), we observe larger values of R-squared in the second model, meaning that the
variations in the response (HRR) are better explained in the model with the interaction effect of
frequency and duration (Equation 5.5).
The results of stepwise regression (Table 5.10) support the findings of the mixed model
analysis as three main factors and the interaction between frequency and duration were factors that
stayed in the model. However, contrary to the results of ANOVA, the main effect of frequency
was not significant in the regression model (Equation 5.5), while the main effect of duration was
significant at 10% significance level. This discrepancy can be explained by the fact that the t-test
and F-test are testing different null hypotheses and their p-values may be different, especially in
this case where there was a meaningful interaction effect between frequency and duration.
Based on Equation 5.5, duration and frequency had negative coefficients while weight of
the lift had a positive coefficient. However, we can not conclude that frequency and duration have
a negative effect on the recovery time since they are involved in an interaction with each other
which has a positive coefficient. On the other hand, weight of the lift stands in the model only by
its main effect (and no interaction), therefore it can be stated that weight of the lift positively affects
the recovery time, meaning that heavier weight needs more recovery time.
Since independent variables had a different measuring unit and range, we use the
standardized beta coefficients to determine the relative importance of each factor. By examining
the absolute values of the standardized coefficient in Table 5.11, we observe that the interaction

63
between frequency and duration had the largest standardized coefficient (B=|1.94221|), meaning
that the interaction effect between frequency and duration was the most important determinant of
recovery time in model d.
6.4. 1 Further Analysis of the Rest Model
To further analyze the rest period model (Equation 5.5), we compared the predicted and
observed recovery times based on both original values from the factorial design and some new
values. Values from the factorial design were the ones discussed in section 4.1 (e.g. frequencies of
6 and 9, weights of 10 and 20, durations of 5 and 10), and new values were defined as values other
than the ones used in the factorial design (e.g. duration of 8 or 12).
First, the rest period equation was tested by using the original values of each lifting
parameter to make a comparison between predicted and observed rest periods (Table 6.3). As
observed in Table 6.3, when a 10 kg weight was lifted at a frequency of 6 lifts per minute for a
duration of 5 minutes (treatment one), the average observed recovery was 1.92 minutes, while the
predicted recovery time for the given treatment is 1.78 minutes. Similarly, for other treatments in
Table 6.3, there was a slight difference between the observed and predicted recovery time when
we inserted the original independent values of the study into Equation 5.5.
Table 6.3: Predicted vs. observed rest periods based on Equation 5.5
Treatment Weight (kg)
Frequency (lpm)
Duration (min)
Predicted HRR (min)
Average values for observed HRR(min)
1 10 6 5 1.78 1.92 2 10 9 5 1.91 1.67 3 20 6 5 2.46 2.33 4 20 9 5 2.6 2.85 5 10 6 10 1.21 1.19 6 10 9 10 2.36 2.5 7 20 6 10 1.89 1.92 8 20 9 10 3.05 2.92
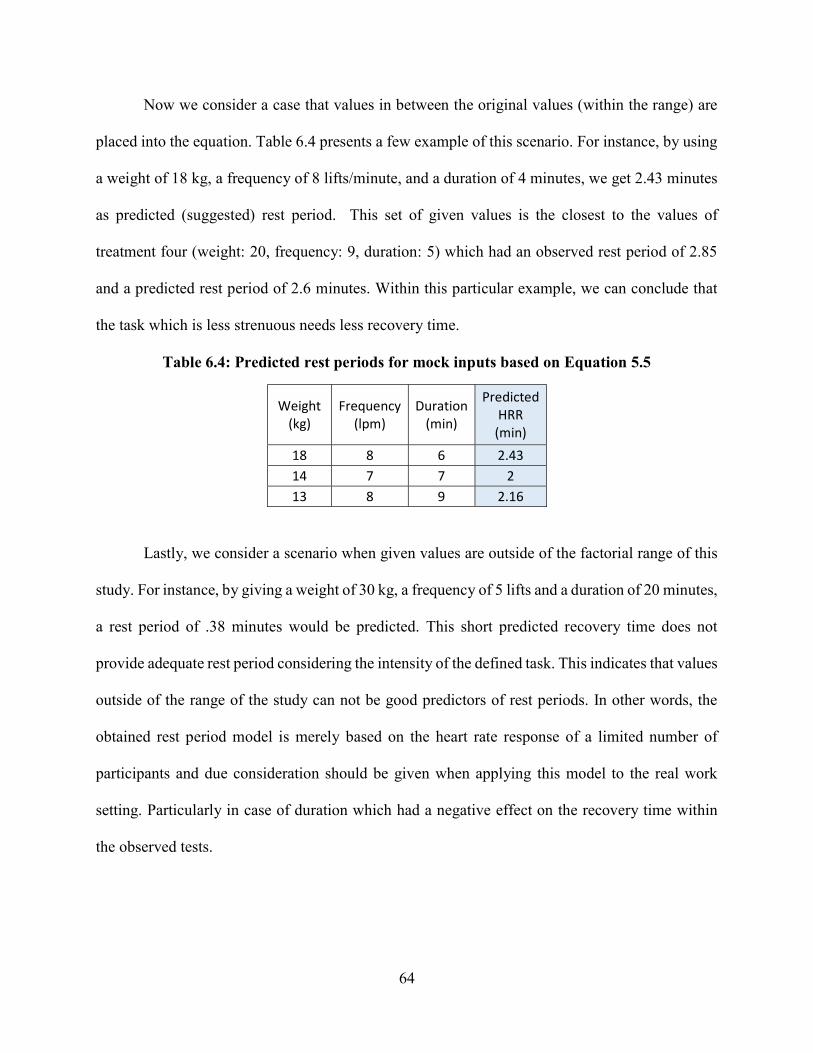
64
Now we consider a case that values in between the original values (within the range) are
placed into the equation. Table 6.4 presents a few example of this scenario. For instance, by using
a weight of 18 kg, a frequency of 8 lifts/minute, and a duration of 4 minutes, we get 2.43 minutes
as predicted (suggested) rest period. This set of given values is the closest to the values of
treatment four (weight: 20, frequency: 9, duration: 5) which had an observed rest period of 2.85
and a predicted rest period of 2.6 minutes. Within this particular example, we can conclude that
the task which is less strenuous needs less recovery time.
Table 6.4: Predicted rest periods for mock inputs based on Equation 5.5
Weight (kg)
Frequency (lpm)
Duration (min)
Predicted HRR
(min)
18 8 6 2.43 14 7 7 2 13 8 9 2.16
Lastly, we consider a scenario when given values are outside of the factorial range of this
study. For instance, by giving a weight of 30 kg, a frequency of 5 lifts and a duration of 20 minutes,
a rest period of .38 minutes would be predicted. This short predicted recovery time does not
provide adequate rest period considering the intensity of the defined task. This indicates that values
outside of the range of the study can not be good predictors of rest periods. In other words, the
obtained rest period model is merely based on the heart rate response of a limited number of
participants and due consideration should be given when applying this model to the real work
setting. Particularly in case of duration which had a negative effect on the recovery time within
the observed tests.

65
CHAPTER 7: CONCLUSIONS
A literature survey shows much evidence that suggests forceful and prolonged exertion in
manual material handling is a major risk factor for fatigue, injury, and WMSD. Giving frequent
and adequate rest breaks is suggested to be an effective method for mitigating the work overload
and fatigue prevention. A limited amount of research exists that deals with the prediction of
optimal rest periods during manual repetitive lifting tasks as related to factors associated with
increased risk of low back disorder. The main objective of this study was to determine rest periods
based on activity heart rate during a repetitive lifting task where freestyle lifting technique was
utilized. We found that on average, the heart rate took between 1.19 to 2.92 minutes to recover.
To address the secondary objective, a mathematical model for the rest period based on frequency,
duration, weight, and the interaction between frequency and duration of the lift was developed to
predict the rest times.
7.1 Hypotheses Testing
At the onset of this study, a set of seven hypotheses were asserted for each dependent
variable.
Hypothesis 1 to 3:
The first three hypotheses tested the differences of the average response values (HRR and
Borg) among two levels of each independent factor (duration, frequency and weight of the lift).
Based on the results of mixed model ANOVA for the HRR (Table 5.2-5.3), we do not observe a
significant p-value for factor duration (p-value>0.1), therefore we fail to reject hypothesis three
meaning that we do not have enough evidence to conclude there is a significant difference in
average values for recovery time within two levels of duration. Based on the p-values of frequency

66
and weight (both p-values<0.1) we reject hypotheses one and two and conclude that the average
recovery time within both levels of weight and frequency are significantly different.
By referring to the results of mixed model analysis for Borg (Table 5.7), for the main effects
of duration and frequency of the lift, no significant effect is observed between different levels of
those main factors (p-values>0.1), as a result we fail to reject hypotheses 1 and 3 for reported
Borg-rating, meaning that for frequency and duration as fixed factors, there was no significant
difference in the average recovery time within the two level of each factor. On the other hand,
based on the p-value of weight (p-values <0.1), we reject hypothesis 2 meaning that there is a
significant difference between each level of weight for the reported Borg-rating. In other words,
the weight of the lift was the only factor that significantly affected how participants felt about
fatigue.
Hypothesis 4 to 7:
The last four hypotheses tested the differences of the average response values (HRR and
Borg) among all possible interactions among independent factor (duration, frequency and weight
of the lift). Based on the results of mixed model ANOVA for the HRR (Table 5.2-5.3), we observe
insignificant p-values for the interaction between duration and weight (p-value>0.1), the
interaction between weight and frequency (p-value>0.1), and also for the three-way interaction of
the study (p-value>0.1). Therefore, we do not have enough evidence to reject hypotheses 5-7. On
the other hand, we observe a significant p-value (p-value<0.1) for hypothesis 4 (the interaction
between frequency and duration) at 90% significance level. As a result, we reject hypothesis four
meaning that the interaction between the frequency and duration significantly affected the heart
rate recovery time.

67
Based on the results of mixed model ANOVA for Borg (Table 5.7), no significant p-value
is observed for the interaction effects, meaning that all two-way interactions and the single three-
way interaction of the study had no significant effect on the perceived level of exertion.
7.2 Summary of Research and Conclusions
In order to achieve the objective of this research, a series of lifting experiments were
conducted. The methodology included recording operator-related variables (static strength
measures, activity level, and BMI) before the experiment and monitoring the heart during a
freestyle repetitive manual lifting task. The response variables were the heart rate recovery time
(which was the duration needed for the heart rate to reach a steady state after a lifting task) and
subjective Borg scale. The independent variables (task-variables) were weight of the lift (10 and
20 kg), the frequency of the lift (6 and 9 lifts per minute), and the duration of the lift (5 and 10
minutes). As a result of independent variables interaction (each at two level), a total of 8
treatments was obtained. Twenty-four male participants between the ages of 20 and 37 were
selected for the experiment. The experimental lifting task consisted of each participant
performing a single treatment by lifting a load from knuckle level (77.8 cm in height) to the
shoulder level (147.6 cm in height) by the use of a lifting platform.
The results of the experiment were analyzed using mixed model analysis of variance
technique. Where the overall effects of independent variables or their interactions were found to
be significant at the 10% level, a separate analysis of variance was conducted by including the
significant factors. Further, for obtaining the recovery equation factorial regression analysis
followed by a multiple linear regression were used. The following conclusions can be
made as a result of these analyses:

68
1. Among main factors, frequency and weight of the lift increased the time needed for heart
rate to recover after a lifting task, while their effects were also significant. On the other
hand, duration of the lift negatively impacted the recovery time; however, its effect was
insignificant. The only interaction effect that significantly affected the recovery time was
the interaction between frequency and duration of the lift.
2. The load weight was the only factor that had a significant effect on the self-reported Borg
rating and led to a 20% increase in fatigue rating when weight was doubled.
3. None of the confounding factors of the study (BMI, static strength, PA-R, grip strength)
had a significant effect on the recovery time.
7.3 Areas of Application
The results of this study may be used by government agencies and industry in job design
and employment placement to establish guidelines for manual material handling tasks. Based on
the results of this study, in manual material handling tasks requiring repetitive lifting, proper rest
breaks should be allocated with respect to the weight and frequency of the lift. The rest equation
will provide a suggested minimum amount of rest based on the task intensity.
69
CHAPTER 8: LIMITATIONS AND RECOMMENDATIONS FOR FUTURE STUDIES
One of the major limitations of this study was the relatively small sample size. In future studies,
a larger sample size which is more representative of the general population may be used to
support the findings with a higher accuracy. For instance, choosing the test participants based
on a large array of BMI can be suggested (e.g. based on 50th, 75th, and 90th percentile of U.S.
adult population BMI).
Each independent factor of this study had only two levels, if we had used three or more levels
for each factor (e.g. frequencies of 2,6, 5, and 9), we could conduct post hoc analysis and
determine which level of a certain factor was most significant compared to other levels.
In addition, having only two levels for each factor reduced the predictability power of our
lifting equations. The equations can not be extrapolated beyond their power. For example, the
model is based on lifting durations of 5 and 10 minutes, that being said inserting a duration of
30 minutes into the equation would not yield accurate results for the heart rate recovery time.
As a result, future studies may incorporate more levels of each factor so that the rest equation
yields a more accurate output.
This study investigated the effects of three task factors on the recovery time. Future studies
may incorporate more factors such as lifting height, lifting angle, and the box size. Adding
more factors will add to the value of the study.
This experiment intended to capture recovery time in a single-component task of lifting.
Knowing that multiple-component tasks are more in the workplace, future studies may
investigate the heart rate recovery time in multiple component tasks (e.g. lifting followed by
pushing).

70
Only one physiological response (heart rate recovery time) was studied. Future studies may
incorporate more response variables such as VO2 consumption or EMG. In addition, the current
study did not investigate gender effect. Adding a gender variable in the future can be suggested.
Lastly, a major limitation was using college students instead of actual workers. The results
might have been more realistic if a random sample of experienced workers were selected and
studied. Most of the limitations discussed will require more time and resources, but they are of
value to consider.
71
BIBLIOGRAPHY
Abadi, A. S. S., Mazlomi, A., Saraji, G. N., Zeraati, H., Hadian, M. R., and Jafari, A. H. (2015). Effects of box size, frequency of lifting, and height of lift on maximum acceptable weight of lift and heart rate for male university students in Iran. Electronic Physician, 7(6), 1365-1371. doi: 10.14661/2015.1365
Aghazadeh, F. (1974). Lifting capacity as a function of operator and task variables. M.S. thesis,
Texas Tech University, Lubbock, TX. Aghazadeh, F. (1986). Dynamic strength models for manual handling of different containers.
Journal of Human Ergology, 15(2), 131-138. Aghazadeh, F., Waly, S. M., and Santoso, D. S. (1998). Models for lifting load capacity of Indonesian population. Occupational Ergonomics, 1(1), 67-74 Andersson, G. B. J. (1999). Epidemiological features of chronic low-back pain. Lancet,
354(9178), 581-585. Anna Daniel, H. (2013). The Occupational Environment: Its Evaluation, Control, and
Management, 3rd edition (Vol. 2). Fairfax, VA: American Industrial Hygiene Association (AIHA).
Ayoub, M.M (1986). Human Strength as a Predictor of Lifting Capacity. Proceedings of the Human Factors and Ergonomics Society Annual Meeting, Dayton, OH, 30(10), 960- 963. Bahmani Bahman Beiglou, A. B. (2013). Effect of rest time on heart rate, perceived exertion,
and strength. M.S. thesis, Louisiana State University, Baton Rouge, LA. Balci, R., and Aghazadeh, F. (2003). The effect of work-rest schedules and type of task on the discomfort and performance of VDT users. Ergonomics, 46(5), 455-465. Banks, A., and Aghazadeh, F. (2009). Progressive Fatigue Effects on Manual Lifting Factors. Human Factors and Ergonomics in Manufacturing, 19(5), 361-377. Bedny, G. Z., and Seglin, M. H. (1997). The Use of Pulse Rate to Evaluate Physical Work Load
in Russian Ergonomics. American Industrial Hygiene Association Journal, 58(5), 375-379. doi: 10.1080/15428119791012757
Bedny, G. Z., Karwowski, W., and Seglin, M. H. (2001). A heart rate evaluation approach to
determine cost-effectiveness an ergonomics intervention. International Journal of Occupational Safety and Ergonomics: JOSE, 7(2), 121-133.

72
Belenky, G., Lamp, A., Hemp, A., and Zaslona, J. L. (2014). Fatigue in the workplace. In M. T. Bianchi and M. T. Bianchi (Eds.), Sleep deprivation and disease: Effects on the body, brain and behavior. (pp. 243-268). New York, NY, US: Springer Science + Business Media.
Bhatia, N., and Murrell, K. F. (1969). An industrial experiment in organized rest pauses. Human
Factors, 11(2), 167-174. Blangsted, A. K., Søgaard, K., Hansen, E. A., Hannerz, H., and Søgaard, G. (2008). One-year
randomized controlled trial with different physical-activity programs to reduce musculoskeletal symptoms in the neck and shoulders among office workers. Scandinavian Journal of Work, Environment & Health, 34(1), 55-65.
Borg, G. A. (1982). Psychophysical bases of perceived exertion. Medicine and Science in Sports
and Exercise, 14(5), 377-381. Brouha, L. (1967). Physiology in industry; evaluation of industrial stresses by the physiological
reactions of the worker: Oxford, New York, Pergamon Press [1967, c1960] 2d ed. Centers for Disease Control and Prevention(CDC), (2016). Work-Related Musculoskeletal Disorders (WMSDs) Evaluation Measures. Retrieved from https://www.cdc.gov/workplacehealthpromotion/health-strategies/musculoskeletal- disorders/evaluation-measures/index.html Chaffin, D. B., and Park, K. S. (1973). A Longitudinal Study of Low-Back Pain as Associated
with Occupational Weight Lifting Factors. American Industrial Hygiene Association Journal, 34(12), 513-525. doi: 10.1080/0002889738506892
Chaffin, D. B. (1979). Manual materials handling: the cause of over-exertion injury and illness in
industry. Journal of Environmental Pathology and Toxicology, 2(5), 31-66. Ciriello, V. M., and Snook, S. H. (1978). The Effects of Size, Distance, Height and Frequency on
Manual Handling Performance. Proceedings of the Human Factors Society Annual Meeting, 22(1), 318-322. doi: doi:10.1177/107118137802200184
Dias, J. J., and Garcia-Elias, M. (2006). Hand injury costs. Injury, 37, 1071-1077. doi:
10.1016/j.injury.2006.07.023 Division of Occupational Safety and Health (DOSH)-Cal/OSHA. (2003). Ergonomics in Action [Brochure]. Retrieved from http://www.dir.ca.gov/dosh/etools/08-012/08- 01202_ErgoInAction/index.html Eastman Kodak Company. Kodak's Ergonomic Design for People at Work. [electronic
resource]. (2007). Wiley [Imprint] Nov. 2007 Hoboken: John Wiley & Sons, Incorporated. 2nd ed. Retrieved from

73
https://books.google.com/books/about/Kodak_s_Ergonomic_Design_for_People_at_W.html?id=FSgcaAIoHu8C
Eidelman, D. (1980). Fatigue: towards an analysis and a unified definition. Medical Hypotheses,
6(5), 517-526. Ekşioğlu, M. (2016). Normative static grip strength of population of Turkey, effects of various
factors and a comparison with international norms. Applied Ergonomics, 52, 8-17. doi: 10.1016/j.apergo.2015.06.023.
El ahrache, K., and Imbeau, D. (2009). Comparison of rest allowance models for static muscular
work. International Journal of Industrial Ergonomics, 39(1), 73-80. doi: http://dx.doi.org/10.1016/j.ergon.2008.10.012
Enoka, R. M., and Duchateau, J. (2008). Muscle fatigue: what, why and how it influences muscle
function. Journal of Physiology (Oxford), 586(1), 11-23. Gallagher, S. (1991). Acceptable weights and physiological costs of performing combined
manual handling tasks in restricted postures. Ergonomics, 34(7), 939-952. doi: 10.1080/00140139108964836
Garg, A., and Banaag, J. (1988). Maximum acceptable weights, heart rates and RPEs for one
hour's repetitive asymmetric lifting. Ergonomics, 31(1), 77-96. doi: 10.1080/00140138808966650
Gatchel, R. J., and Schultz, I. Z. (2014). Handbook of musculoskeletal pain and disability
disorders in the workplace: New York, NY: Springer, 2014. George, N.H. (2014). A Survey and Evaluation of Physiological Based Work-Rest Formulas M.S. thesis, Louisiana State University, Baton Rouge, LA Hales, T. R., and Bertsche, P. K. (1992). Management of upper extremity cumulative trauma
disorders. AAOHN Journal: Official Journal of the American Association of Occupational Health Nurses, 40(3), 118-128.
Hardy, S. E., and Studenski, S. A. (2010). Qualities of Fatigue and Associated Chronic
Conditions Among Older Adults. Journal of Pain and Symptom Management, 39(6), 1033-1042. doi: http://dx.doi.org/10.1016/j.jpainsymman.2009.09.026
Henning, R. A., Jacques, P., Kissel, G. V., Sullivan, A. B., and Alteras-Webb, S. M. (1997).
Frequent short rest breaks from computer work: effects on productivity and well-being at two field sites. Ergonomics, 40(1), 78-91. doi: 10.1080/001401397188396
Hirshkowitz, M. (2013). Fatigue, Sleepiness, and Safety. Sleep Medicine Clinics, 8(2), 183-189.
doi: 10.1016/j.jsmc.2013.04.001

74
Hsie, M., Hsiao, W.-t., Cheng, T.-m., and Chen, H.-c. (2009). A model used in creating a work-rest schedule for laborers. Automation in Construction, 18(6), 762-769. doi: http://dx.doi.org/10.1016/j.autcon.2009.02.010
Iridiastadi, H., and Aghazadeh, F. (2005). Physiological fatigue limit of combined manual materials handling tasks. Occupational Ergonomics, 5(3), 141-148. Jackson, A. S., Blair, S. N., Mahar, M. T., Wier, L. T., Ross, R. M., and Stuteville, J. E. (1990).
Prediction of functional aerobic capacity without exercise testing. Medicine and Science in Sports and Exercise, 22(6), 863-870.
Janaro, R. E., and Bechtold, S. E. (1985). A study of the reduction of fatigue impact on
productivity through optimal rest break scheduling. Human Factors, 27(4), 459-466. Katic, I., Ivanisevic, A., Lalic, G., Tasic, N., and Penezic, N. (2013). EFFECTS OF FATIGUE TO OPERATIONAL PRODUCTIVITY WITH EMPLOYEES. Metalurgia International, 18, 170-176. Katz, J. N. (2006). Lumbar disc disorders and low-back pain: socioeconomic factors and
consequences. Journal of Bone and Joint Surgery, 88(2), 21-24. doi: 10.2106/jbjs.e.01273
Konz, S. (1998). Work/rest: Part II – The scientific basis (knowledge base) for the guide1.
International Journal of Industrial Ergonomics, 22(1–2), 73-99. doi: http://dx.doi.org/10.1016/S0169-8141(97)00069-3
Kopardekar, P., and Mital, A. (1994). The effect of different work-rest schedules on fatigue and
performance of a simulated directory assistance operator's task. Ergonomics, 37(10), 1697-1707. doi: 10.1080/00140139408964946
Lahiri, S., Tempesti, T., and Gangopadhyay, S. (2016). Is There an Economic Case for Training
Intervention in the Manual Material Handling Sector of Developing Countries? Journal of Occupational and Environmental Medicine / American College of Occupational and Environmental Medicine, 58(2), 207-214. doi: 10.1097/JOM.0000000000000603
Lee, T.-H. (2004). Static lifting strengths at different exertion heights. International Journal of
Industrial Ergonomics, 34(4), 263-269. doi: http://doi.org/10.1016/j.ergon.2004.04.006 Lerman, S. E., Eskin, E., Flower, D. J., George, E. C., Gerson, B., Hartenbaum, N., . . . Moore-
Ede, M. (2012). Fatigue risk management in the workplace. Journal of Occupational and Environmental Medicine / American College of Occupational and Environmental Medicine, 54(2), 231-258. doi: 10.1097/JOM.0b013e318247a3b0
Lins, T., Valente, L., Sobral, D., and Silva, O. (2014). Relation between heart rate recovery after exercise testing and body mass index. Revista Portuguesa De Cardiologia, 34(1), 27-33.
75
Loisel, P., and Anema, J. R. (2013). Handbook of work disability. [electronic resource]: prevention and management. New York, NY: Springer, c2013. London, M., and Bhattacharya, A. (1985). The relation between frequency of industrial lifting
and the fatigue produced. Journal of Human Ergology, 14(1), 3-13. Mahone, D. B. (1994). Manual materials handling - stop guessing and design. Industrial Engineering, 26(3), 29-31. Maiti, R., and Bagchi, T. P. (2006). Effect of different multipliers and their interactions during
manual lifting operations. International Journal of Industrial Ergonomics, 36(11), 991-1004. doi: http://dx.doi.org/10.1016/j.ergon.2006.08.00
Mark, L. S., Warm, J. S., and Huston, R. L. (2012). Ergonomics and Human Factors: Recent
Research: Springer New York. Mohammadian, M., Choobineh, A., Haghdoost, A. A., and Nejad, N. H. (2016). Investigation of
grip and pinch strengths in Iranian adults and their correlated anthropometric and demographic factors. Work, 53(2), 429-437. doi: 10.3233/WOR-152180
Murrell, K. F. H. (1965). Human Performance in Industry. New York: Reinhold Publishing
Corporation.
Occupational Safety and Health Administration [OSHA]. (2000). Ergonomics: The Study of Work. Retrieved from https://www.osha.gov/Publications/osha3125.pdf
Occupational Safety and Health Administration [OSHA]. (2014). 2014. PREVENTION OF WORK-RELATED MUSCULOSKELETAL DISORDERS [Fact sheet]. Retrieved from https://www.osha.gov/pls/oshaweb/owadisp.show_document?p_table=UNIFIED_ AGEN DA&p_id=%204481
Phillips, R. O. (2015). A review of definitions of fatigue – And a step towards a whole definition. Transportation Research: Part F, 29, 48-56. doi: 10.1016/j.trf.2015.01.003
Powell, R. I., and Copping, A. G. (2016). Measuring fatigue-related impairment in the workplace. Journal of Engineering, Design and Technology, 14(3), 507-525. doi:10.1108/JEDT-09-2014-0063
Price, A. D. F. (1990). Calculating relaxation allowances for construction operatives — Part 1:
Metabolic cost. Applied Ergonomics, 21(4), 311-317. doi: http://dx.doi.org/10.1016/0003-6870(90)90202-9

76
Price, A. D. F. (1990). Calculating relaxation allowances for construction operatives — Part 2: Local muscle fatigue. Applied Ergonomics, 21(4), 318-324. doi: http://dx.doi.org/10.1016/0003-6870(90)90203-A
Pulat, B. M. (1997). Fundamentals of industrial ergonomics. Prospect Heights, IL: Waveland Press. Rajesh, R. (2016). Manual Material Handling: A Classification Scheme. Procedia Technology,
24, 568-575. doi: 10.1016/j.protcy.2016.05.114 Rohmert, W. (1973). Problems in determining rest allowances: I. Use of modern methods to
evaluate stress and strain in static muscular work. Applied Ergonomics, 4(2), 91-95. doi: 10.1016/0003-6870(73)90082-3
Rohmert, W. (1973). Problems of determination of rest allowances Part 2: Determining rest
allowances in different human tasks. Applied Ergonomics, 4, 158-162. doi: 10.1016/0003-6870(73)90166-X
Rohmert, W., and Laurig, W. (1975). Evaluation of work requiring physical effort. Luxembourg:
Directorate-General Social Affairs, Commission of the European Communities. Retrieved from http://aei.pitt.edu/41719/1/A5901.pdf
Rosa, R. R., Bonnet, M. H., and Cole, L. L. (1998). Work schedule and task factors in upper-
extremity fatigue. Human Factors, 40(1), 150-158. Rowell, D., Connelly, L., Webber, J., Tippett, V., Thiele, D., and Schuetz, M. (2011). What are
the true costs of major trauma? The Journal of Trauma, 70(5), 1086-1095. doi: 10.1097/TA.0b013e3181ed4d29
Saavedra-Robinson, L., Quintana, L. A. J., Fortunato Leal, L. D., and Niño, M. (2012). Analysis
of the lifted weight including height and frequency factors for workers in Colombia. Work (Reading, Mass.), 41 Suppl 1, 1639-1646. doi: 10.3233/WOR-2012-0365-1639
Sadeghniiat-Haghighi, K., and Yazdi, Z. (2015). Fatigue management in the workplace.
Industrial Psychiatry Journal, Vol 24, Iss 1, Pp 12-17 (2015) (1), 12. doi: 10.4103/0972-6748.160915
Saha, P. N., Datta, S. R., Banerjee, P. K., and Narayane, G. G. (1979). An acceptable workload
for Indian workers. Ergonomics, 22(9), 1059-1071. doi: 10.1080/00140137908924680 Sheahan, P. J., Diesbourg, T. L., and Fischer, S. L. (2016). The effect of rest break schedule on
acute low back pain development in pain and non-pain developers during seated work. Applied Ergonomics, 53, 64-70. doi: 10.1016/j.apergo.2015.08.013
Shen, J., Barbera, J., and Shapiro, C. M. (2006). Distinguishing sleepiness and fatigue: focus on
definition and measurement. Sleep Medicine Reviews, 10(1), 63-76.

77
Snook, S. H. (1978). The Ergonomics Society the Society's Lecture 1978. THE design of manual handling tasks. Ergonomics, 21(12), 963. doi:10.1080/00140137808931804 Snook, S. H., Campanelli, R. A., and Hart, J. W. (1978). A study of three preventive approaches
to low back injury. Journal of Occupational Medicine.: Official Publication of the Industrial Medical Association, 20(7), 478-481.
Snook, S. H., and Ciriello, V. M. (1991). The design of manual handling tasks: revised tables of
maximum acceptable weights and forces. Ergonomics, 34(9), 1197-1213. doi: 10.1080/00140139108964855
Stobbe, T. J. (1996). Occupational ergonomics and injury prevention. Occup Med, 11(3), 531-
543. Tiwari, P. S., and Gite, L. P. (2006). Evaluation of work-rest schedules during operation of a
rotary power tiller. International Journal of Industrial Ergonomics, 36(3), 203-210. doi: http://dx.doi.org/10.1016/j.ergon.2005.11.001
U.S. Bureau of Labor Statistics (BLS), (2015, 2016), Online resources (http://www.bls.gov/) Van der Linden, D., Frese, M., and Meijman, T. F. (2003). Mental fatigue and the control of cognitive processes: effects on perseveration and planning. Acta Psychologica, 113(1), 45-65. Verbeek, J. H., Martimo, K., Kuijer, P. M., Karppinen, J., Viikari-Juntura, E., and Takala, E. (2012). Proper manual handling techniques to prevent low back pain, a Cochrane systematic review. Work (Reading, Mass.), 41 Suppl 12299-2301. doi:10.3233/WOR- 2012-0455-2299 Waters, T. R., Putz-Anderson, V., and Garg, A. (1994). Applications manual for the revised NIOSH lifting equation. Cincinnati, Ohio: U.S. Dept. of Health and Human Services, Public Health Service, Centers for Disease Control and Prevention, National Institute for Occupational Safety and Health, Division of Biomedical and Behavioral Science; Springfield, VA Waters, T. R., Putz-Anderson, V., and Baron, S. (1997). Ergonomic Tools for Evaluating
Manual Material Handling Jobs. Paper presented at the Annual International Occupational Ergonomics and Safety Conference, Washington, D. C.
Wu, S. P. (1997). Maximum acceptable weight of lift by Chinese experienced male manual
handlers. Applied Ergonomics, 28(4), 237-244. Xu, X., Mirka, G. A., and Hsiang, S. M. (2008). The effects of obesity on lifting performance. Applied Ergonomics, 3993-98. doi: 10.1016/j.apergo.2007.02.001

78
Appendix A: LSU Institutional Review Board (IRB) Application Forms
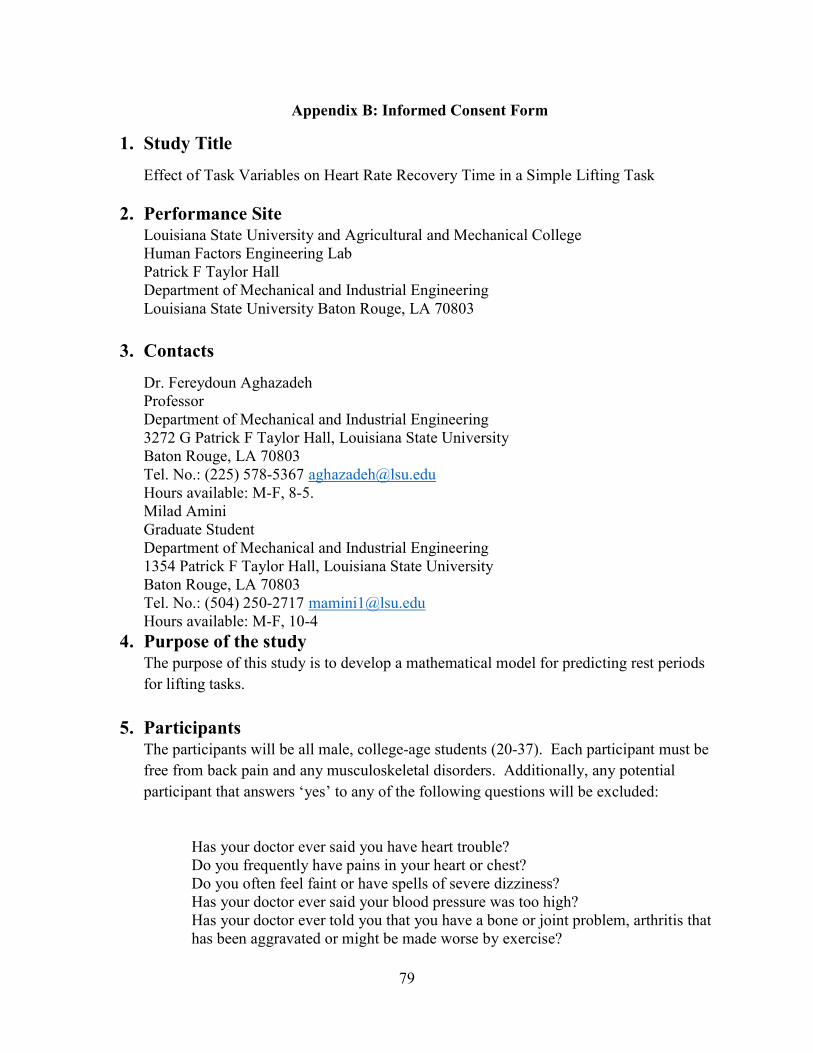
79
1. Study Title
Effect of Task Variables on Heart Rate Recovery Time in a Simple Lifting Task
2. Performance Site Louisiana State University and Agricultural and Mechanical College Human Factors Engineering Lab Patrick F Taylor Hall Department of Mechanical and Industrial Engineering Louisiana State University Baton Rouge, LA 70803
3. Contacts
Dr. Fereydoun Aghazadeh Professor Department of Mechanical and Industrial Engineering 3272 G Patrick F Taylor Hall, Louisiana State University Baton Rouge, LA 70803 Tel. No.: (225) 578-5367 [email protected] Hours available: M-F, 8-5. Milad Amini Graduate Student Department of Mechanical and Industrial Engineering 1354 Patrick F Taylor Hall, Louisiana State University Baton Rouge, LA 70803 Tel. No.: (504) 250-2717 [email protected] Hours available: M-F, 10-4
4. Purpose of the study The purpose of this study is to develop a mathematical model for predicting rest periods for lifting tasks.
5. Participants The participants will be all male, college-age students (20-37). Each participant must be free from back pain and any musculoskeletal disorders. Additionally, any potential participant that answers ‘yes’ to any of the following questions will be excluded:
Has your doctor ever said you have heart trouble? Do you frequently have pains in your heart or chest? Do you often feel faint or have spells of severe dizziness? Has your doctor ever said your blood pressure was too high? Has your doctor ever told you that you have a bone or joint problem, arthritis that has been aggravated or might be made worse by exercise?
Appendix B: Informed Consent Form
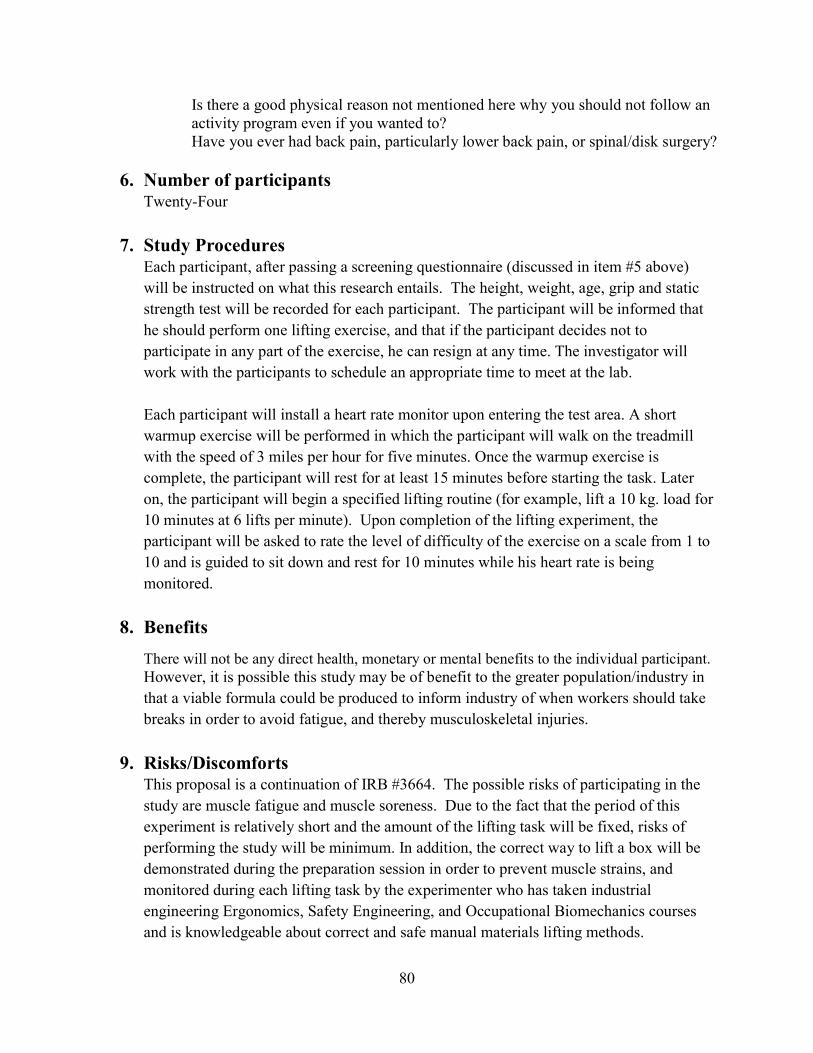
80
Is there a good physical reason not mentioned here why you should not follow an activity program even if you wanted to? Have you ever had back pain, particularly lower back pain, or spinal/disk surgery?
6. Number of participants Twenty-Four
7. Study Procedures Each participant, after passing a screening questionnaire (discussed in item #5 above) will be instructed on what this research entails. The height, weight, age, grip and static strength test will be recorded for each participant. The participant will be informed that he should perform one lifting exercise, and that if the participant decides not to participate in any part of the exercise, he can resign at any time. The investigator will work with the participants to schedule an appropriate time to meet at the lab. Each participant will install a heart rate monitor upon entering the test area. A short warmup exercise will be performed in which the participant will walk on the treadmill with the speed of 3 miles per hour for five minutes. Once the warmup exercise is complete, the participant will rest for at least 15 minutes before starting the task. Later on, the participant will begin a specified lifting routine (for example, lift a 10 kg. load for 10 minutes at 6 lifts per minute). Upon completion of the lifting experiment, the participant will be asked to rate the level of difficulty of the exercise on a scale from 1 to 10 and is guided to sit down and rest for 10 minutes while his heart rate is being monitored.
8. Benefits
There will not be any direct health, monetary or mental benefits to the individual participant. However, it is possible this study may be of benefit to the greater population/industry in that a viable formula could be produced to inform industry of when workers should take breaks in order to avoid fatigue, and thereby musculoskeletal injuries.
9. Risks/Discomforts This proposal is a continuation of IRB #3664. The possible risks of participating in the study are muscle fatigue and muscle soreness. Due to the fact that the period of this experiment is relatively short and the amount of the lifting task will be fixed, risks of performing the study will be minimum. In addition, the correct way to lift a box will be demonstrated during the preparation session in order to prevent muscle strains, and monitored during each lifting task by the experimenter who has taken industrial engineering Ergonomics, Safety Engineering, and Occupational Biomechanics courses and is knowledgeable about correct and safe manual materials lifting methods.

81
Furthermore, all of the participants who do not meet the physical requirements and answer “YES” to the health-screening questionnaire will be excluded.
10. Right to Refuse At any time during the course of this experiment, each participant may choose not to participate, especially if he feels discomfort with any part of the procedure.
11. Privacy The identity of each test participant will remain confidential unless disclosure by law is required. All data will be stored in a secure location or password-protected computer. Only first names (and if needed) last initials will be used for each participant. The screening form for any participant that is rejected will be shredded.
17. Withdrawal The only consequence of a participant withdrawing from the experiment will be that no bonus point will be given to the participant. The participant’s data will be destroyed, and another participant will be recruited.
18. Removal There are two conditions under which a participant could be removed from the study. First, if the participant proves unreliable with regard to tardiness or absence. Second, if the participant exhibits any medical signs (pain while lifting, shortness of breath), the participant will be asked if medical assistance is needed, and will be removed from the study.
Signature The study has been discussed with me and all my questions have been answered. I may direct additional questions regarding study specifics to the investigators. If I have questions about participants’ rights or other concerns, I can contact Dennis Landin, Chairman, LSU Institutional Review Board, (225) 578-8692, [email protected], www.lsu.edu/irb . I agree to participate in the study described above and acknowledge the researchers’ obligation to provide me with a copy of this consent form if signed by me. Participant Signature: ___________________________________________ Date:_______________
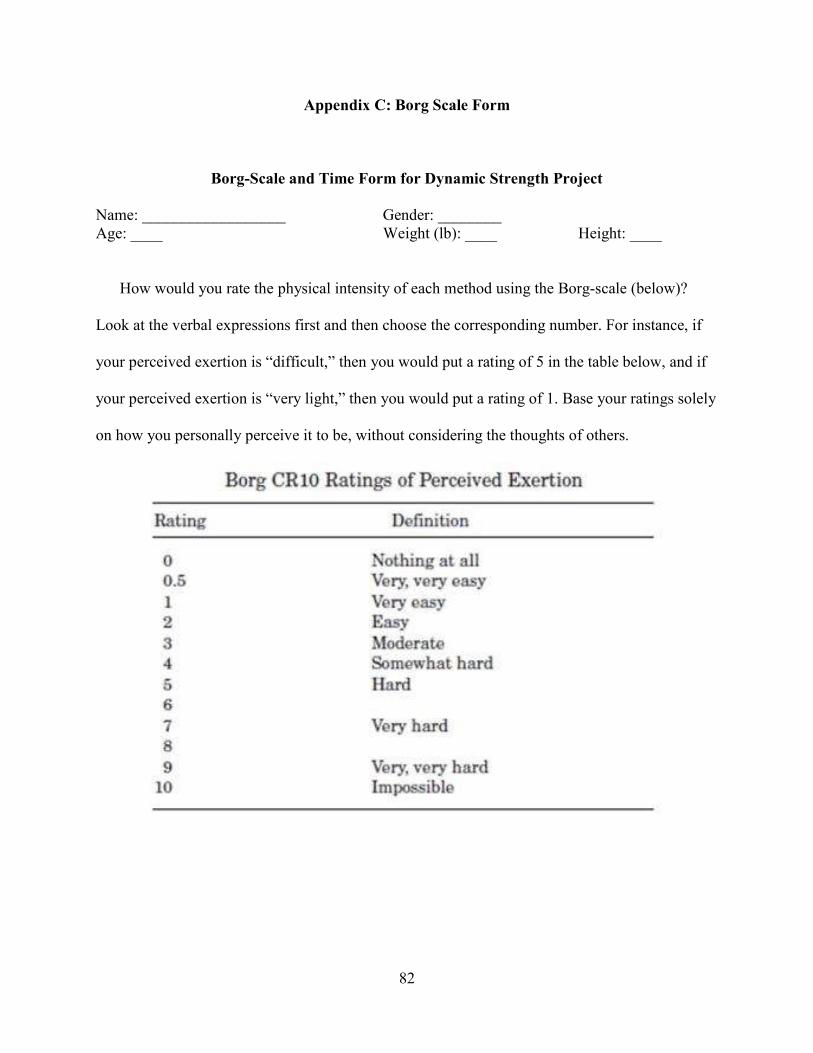
82
Appendix C: Borg Scale Form
Borg-Scale and Time Form for Dynamic Strength Project
Name: __________________ Gender: ________ Age: ____ Weight (lb): ____ Height: ____
How would you rate the physical intensity of each method using the Borg-scale (below)?
Look at the verbal expressions first and then choose the corresponding number. For instance, if
your perceived exertion is “difficult,” then you would put a rating of 5 in the table below, and if
your perceived exertion is “very light,” then you would put a rating of 1. Base your ratings solely
on how you personally perceive it to be, without considering the thoughts of others.

83
Appendix D: Physical Activity Rating (PA-R)
This questionnaire tool is for categorizing a person's level of physical activity. Your PAR score is
a value between 0 and 7. Select the number that best describes your overall level of physical
activity for the previous 6 months:
Points Sub Category General Category
0 points Avoids walking or exercise (for example, always uses elevators, drives whenever possible instead of walking).
Does not participate regularly in programed recreation, sport, or physical activity. 1 points Walks for pleasure, routinely uses stairs,
occasionally exercises sufficiently to cause heavy breathing or perspiration.
2 points 10–60 minutes per week
Participates regularly in recreation or work requiring modest physical activity (such as golf, horseback riding, calisthenics, gymnastics, table tennis, bowling, weight lifting, or yard work).
3 points Over 1 hour per week
4 points Runs less than 1 mile per week or spends less than 30 minutes per week in comparable physical activity
Participates regularly in heavy physical exercise (such as running or jogging, swimming, cycling, rowing, skipping rope, running in place) or engages in vigorous aerobic type activity (such as tennis, basketball, or handball).
5 points Runs 1–5 miles per week or spends 30–60 minutes per week in comparable physical activity.
6 points Runs 5–10 miles per week or spends 1–3 hours per week in comparable physical activity.
7 points Runs more than 10 miles per week or spends more than 3 hours per week in comparable physical activity.

84
Appendix E: Demographic Data
ID Knuckle Height (cm)
Shoulder Height (cm)
Height (cm)
Weight (kg)
Age
1 73.5 147.6 178.5 80.5 22 2 75.8 147 177.5 87.5 21 3 77.6 147 176.4 83 20 4 88.5 155 193 100.9 22 5 77 138 169 90.6 22 6 77 153 184 92.5 21 7 72.5 137.5 170 56.6 22 8 76.5 143 173 70.45 21 9 75.5 141.4 171.5 70.3 24
10 81 146 178 74.8 21 11 77.5 150.4 176.4 62 21 12 72 146 173 62 37 13 80.5 148.6 179.5 78.8 21 14 87 160.6 188.5 96 22 15 78 150.5 182.5 100 23 16 72 139.5 170.8 77.4 22 17 80 146.9 180.3 85 21 18 78.5 147.5 179.9 83 24 19 73.5 145.6 178.2 74.6 23 20 75.2 151.4 180.7 86.1 22 21 82.8 156.2 184.2 75.5 22 22 77.5 152 175 88 21 23 78.6 148.8 177.9 68 22 24 78 142.5 172.5 61.2 23

85
Appendix F: Raw Data for Reponses
ID Day Weight Frequency Duration Treatment Recovery
time(min) Borg
1 1 10 9 10 6 3 7 2 1 20 9 5 4 2.42 7 3 1 10 6 10 5 1.08 5 4 1 20 9 10 8 2.25 8 5 1 10 6 5 1 2.25 3 6 1 20 6 10 7 1.25 3 7 1 10 9 5 2 1.5 6 8 1 20 6 5 3 1 7 9 2 20 9 5 4 2.63 7
10 2 10 6 5 1 1.5 7 11 2 10 9 5 2 1.5 7 12 2 10 6 10 5 1.5 6 13 2 20 6 10 7 2 10 14 2 20 9 10 8 3 6 15 2 20 6 5 3 3 8 16 2 10 9 10 6 1.5 5 17 3 20 9 5 4 3.5 6 18 3 10 9 10 6 3 7 19 3 20 9 10 8 3.5 7 20 3 20 6 10 7 2.5 8 21 3 10 6 10 5 1 6 22 3 10 9 5 2 2 7 23 3 20 6 5 3 3 8 24 3 10 6 5 1 2 5
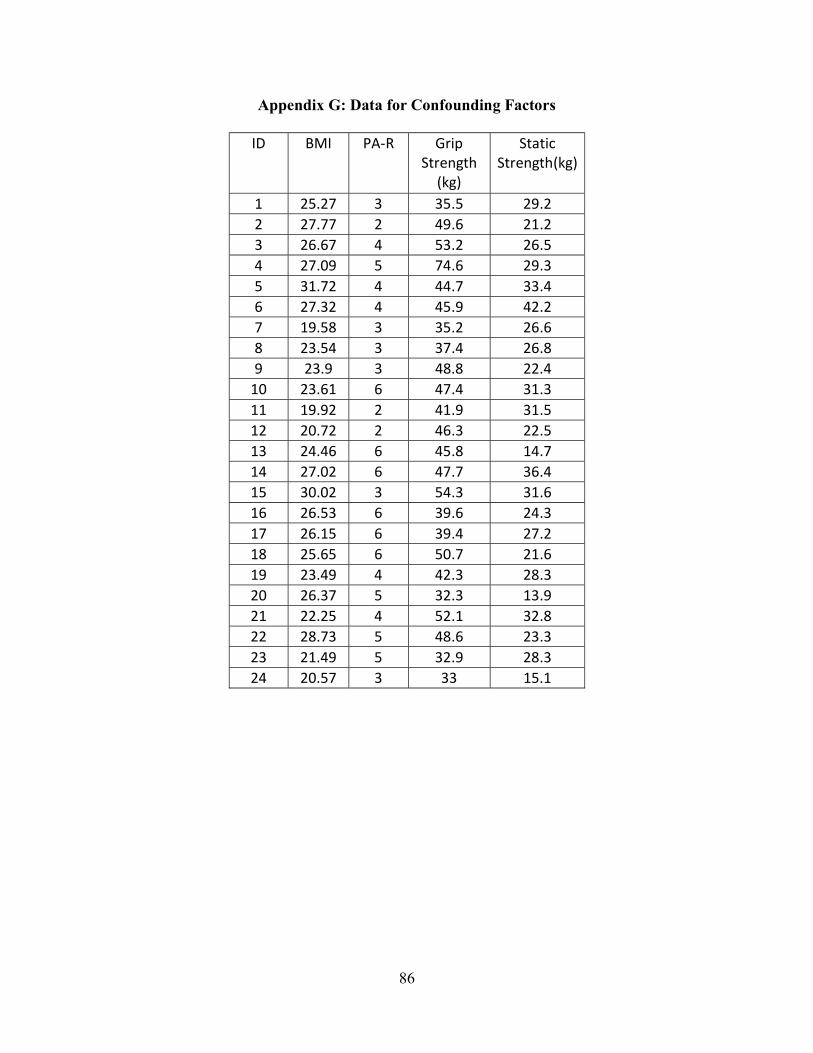
86
Appendix G: Data for Confounding Factors
ID BMI PA-R Grip Strength
(kg)
Static Strength(kg)
1 25.27 3 35.5 29.2 2 27.77 2 49.6 21.2 3 26.67 4 53.2 26.5 4 27.09 5 74.6 29.3 5 31.72 4 44.7 33.4 6 27.32 4 45.9 42.2 7 19.58 3 35.2 26.6 8 23.54 3 37.4 26.8 9 23.9 3 48.8 22.4
10 23.61 6 47.4 31.3 11 19.92 2 41.9 31.5 12 20.72 2 46.3 22.5 13 24.46 6 45.8 14.7 14 27.02 6 47.7 36.4 15 30.02 3 54.3 31.6 16 26.53 6 39.6 24.3 17 26.15 6 39.4 27.2 18 25.65 6 50.7 21.6 19 23.49 4 42.3 28.3 20 26.37 5 32.3 13.9 21 22.25 4 52.1 32.8 22 28.73 5 48.6 23.3 23 21.49 5 32.9 28.3 24 20.57 3 33 15.1

87
Appendix H: Stepwise Regression
Welcome to Minitab, press F1 for help. Results for: Sheet1 Factorial Regression: Recovery time versus Weight, Freq, Dur Backward Elimination of Terms Candidate terms: Weight, Freq, Dur, Weight*Freq, Weight*Dur, Freq*Dur, Weight*Freq*Dur Step 1--------------Step 2--------Step 3-------------Step 4---------------- Coef P Coef P Coef P Coef P Constant 2.162 2.162 2.162 2.162 Weight 0.343 0.022 0.343 0.021 0.343 0.018 0.343 0.016 Freq 0.322 0.030 0.322 0.029 0.322 0.025 0.322 0.022 Dur -0.030 0.827 -0.030 0.827 -0.030 0.823 -0.030 0.819 Weight*Freq 0.058 0.676 0.057 0.676 Weight*Dur -0.057 0.676 -0.057 0.676 -0.057 0.668 Freq*Dur 0.255 0.077 0.255 0.076 0.255 0.069 0.255 0.063 Weight*Freq*Dur -0.134 0.335 S 0.661835 0.661568 0.646347 0.632419 R-sq 51.60% 48.62% 48.07% 47.52% R-sq(adj) 30.42% 30.48% 33.64% 36.47% R-sq(pred) 0.00% 0.00% 7.68% 16.26% Mallows’ Cp 8.00 6.99 5.17 3.35 α to remove = 0.1

88
VITA
Milad Amini was born in Shiraz, Iran. Shiraz is a southern city which is well renowned for its
poetry, flowers, and wine. He grew up in Shiraz and received a Bachelor of Science degree in
Industrial Engineering from Azad University of Shiraz in 2012. He moved to the United States in
2013 and joined the Industrial Engineering Program at Louisiana State University in the Fall of
2015. At LSU he worked as a graduate teaching assistant in the department of Industrial
Engineering and was in charge of Ergonomics and Occupational Biomechanics lab.