Embed Size (px)
Citation preview

PNNL- 13975
Determination of Swimming Speeds and Energetic Demands of Upriver Migrating Fall Chinook Salmon (Oncorhynchus tshawytscha) in the Klickitat River, R.S. Brown D.R. Geist August 2002 Prepared for the Bonneville Power Administration under a Related Services Agreement with the U.S. Department of Energy Contract DE-AC06-76RLO 1830

DISCLAIMER
This report was prepared as an account of work sponsored by an agency of the United States Government. Neither the United States Government nor any agency thereof, nor Battelle Memorial Institute, nor any of their employees, makes any warranty, express or implied, or assumes any legal liability or responsibility for the accuracy, completeness, or usefulness of any information, apparatus, product, or process disclosed, or represents that its use would not infringe privately owned rights. Reference herein to any specific commercial product, process, or service by trade name, trademark, manufacturer, or otherwise does not necessarily constitute or imply its endorsement, recommendation, or favoring by the United States Government or any agency thereof, or Battelle Memorial Institute. The views and opinions of authors expressed herein do not necessarily state or reflect those of the United States Government or any agency thereof.
PACIFIC NORTHWEST NATIONAL LABORATORY operated by BATTELLE
for the
UNITED STATES DEPARTMENT OF ENERGY
under Contract DE-AC06-76RL01830
Printed in the United States of America
Available to DOE and DOE contractors from the Office of Scientific and Technical Information,
P.O. Box 62, Oak Ridge, TN 37831-0062; ph: (865) 576-8401 fax: (865) 576-5728
email: [email protected]
Available to the public from the National Technical Information Service, U.S. Department of Commerce, 5285 Port Royal Rd., Springfield, VA 22161
ph: (800) 553-6847 fax: (703) 605-6900
email: [email protected] online ordering: http://www.ntis.gov/ordering.htm

PNNL-13975
Determination of Swimming Speeds and Energetic Demands of Upriver Migrating
Fall Chinook Salmon (Oncorhynchus tshawytscha) in the Klickitat River, Washington
By Richard S. Brown and David R. Geist Pacific Northwest National Laboratory
P.O. Box 999, MS K6-58 Richland, Washington 99352
In cooperation with
Yakama Nation Toppenish, Washington
August 30, 2002
Submitted to
David Byrnes Bonneville Power Administration
Portland, Oregon
Project Number 22063 Contract 42663A


iii
Abstract
This report describes a study conducted by Pacific Northwest National Laboratory for the Bonneville Power Administration's Columbia Basin Fish and Wildlife Program during the fall of 2001. The objective was to study the migration and energy use of adult fall chinook salmon (Oncorhynchus tshawytscha) traveling up the Klickitat River to spawn. The salmon were tagged with either surgically implanted electromyogram (EMG) transmitters or gastrically implanted coded transmitters and were monitored with mobile and stationary receivers. Swim speed and aerobic and anaerobic energy use were determined for the fish as they attempted passage of three waterfalls on the lower Klickitat River and as they traversed free-flowing stretches between, below, and above the falls.
Of the 35 EMG-tagged fish released near the mouth of the Klickitat River, 40% passed the first falls, 24% passed the second falls, and 20% made it to Lyle Falls. None of the EMG-tagged fish were able to pass Lyle Falls, either over the falls or via a fishway at Lyle Falls. Mean swimming speeds ranged from as low as 52.6 centimeters per second (cm s-1) between falls to as high as 189 (cm s-1) at falls passage. Fish swam above critical swimming speeds while passing the falls more often than while swimming between the falls (58.9% versus 1.7% of the transmitter signals). However, fish expended more energy swimming the stretches between the falls than during actual falls passage (100.7 to 128.2 kilocalories [kcals] to traverse areas between or below falls versus 0.3 to 1.0 kcals to pass falls).
Relationships between sex, length, and time of day on the success of falls passage were also examined. Average swimming speeds were highest during the day in all areas except at some waterfalls. There was no apparent relationship between either fish condition or length and successful passage of waterfalls in the lower Klickitat River. Female fall chinook salmon, however, had a much lower likelihood of passing waterfalls than males.
The study also examined energy costs and swimming speeds for fish released above Lyle Falls as they migrated to upstream spawning areas. This journey averaged 15.93 days to travel a mean maximum of 37.6 km upstream at a total energy cost of approx 3,971 kcals (34% anaerobic and 66% aerobic) for a sample of five fish. A bioenergetics example was run, which estimated that fall chinook salmon would expend an estimated 1,208 kcal to pass from the mouth of the Columbia River to Bonneville Dam and874 kcals to pass Bonneville Dam and pool and the three falls on the Lower Klickitat River, plus an additional 2,770 kcals above the falls to reach the spawning grounds, leaving them with approximately 18% (1,089 kcals) of their original energy reserves for spawning. Results of the bioenergetics example suggest that a delay of 9 to 11 days along the lower Klickitat River may deplete their remaining energy reserves (at a rate of about 105 kcal d-1) resulting in death before spawning would occur.

iv

v
Executive Summary
Pacific Northwest National Laboratory undertook a field study on the Klickitat River in southwestern Washington state in September, October, and November 2001 to determine the migration behavior and energy use of fall chinook salmon (Oncorhynchus tshawytscha) swimming upstream past three waterfalls and through free-flowing stretches of the river to spawn.
The fall chinook salmon were obtained in the dip net fishery at Lyle Falls in the Klickitat River between September 11 and October 12, 2001. The fish were surgically implanted with electromyogram (EMG) transmitters. EMG-swim speed relations were examined in the laboratory for each tagged fish. Of the 41 fish implanted with EMG transmitters, a majority (35) were released near the mouth of the Klickitat River (river kilometer [rkm] 1.84) between September 14 and October 15, 2001, while the remaining fish (6) were released 5.05 km upstream of Lyle Falls (rkm 9.25) between October 11 and 15, 2001.
A separate group of 30 fall chinook salmon were gastrically implanted with coded transmitters between September 26 and October 16, 2001, and were used as a comparison to the behavior of fish implanted with EMG tags. These fish were also used to augment the amount of information gathered on fish migration upstream of Lyle Falls. Fifteen fish were implanted with coded transmitters and released near the mouth of the river (same location as EMG implanted fish) between September 26 and October 16, 2001. Fifteen more fish were implanted with coded transmitters and released upstream of Lyle Falls (same location as fish implanted with EMG tags) between September 27 and October 16, 2001.
Multiple antenna arrays were constructed to cover 3.4 km of the river in the vicinity of Lyle Falls to receive signals from the EMG and coded transmitters. In addition to fixed reception arrays, manual trackers frequently walked or drove along the river and tracked fish (every 1 to 3 days for fish tagged with EMG transmitters; once a week for fish with coded tags). The Lyle Falls fishway was also monitored by a separate array of antennas.
Of the 35 EMG-tagged fall chinook salmon released near the mouth of the river, 84% moved upstream to the first waterfall in the lower river (Falls 1), 40% passed Falls 1, 36% made it to Falls 2, 24% passed Falls 2, and 20% made it to Lyle Falls, but none of the fish passed Lyle Falls or went through the Lyle Falls fishway. Out of necessity, we captured fish which already had passed through difficult passage conditions. Thus, our study protocol may have biased our results. All of the fish used in our study were captured while trying to pass Lyle Falls, tagged, and then returned downstream where they were released. Thus, the fish tracked during this study likely had lower energy reserves and were more mature than fish that were approaching the lower river for the first time. This factor should be weighed when interpreting the results.
It took a mean of 106.6 hours (h] (median 72.1 h; range 15.4 to 329.2 h; N=19) for a fall chinook salmon to travel the 1.86 km (0.017 kilometers per hour [km h-1]) from its release point at rkm 1.84 to Falls 1 (rkm 3.7). Travel times were longer (mean 137.1 h; median 117.0 h; range 19.7 to 406.6 h; N=9) but the migration rate was similar (0.017 km h-1) for fish that traveled the 2.27 km from the release point to Falls 2 (rkm 4.1). However, fish that made it to Lyle Falls
vi
made much more direct migrations (0.031 km h-1) than the average fish traveling to the other two waterfalls. The mean time for a fish to travel the 2.36 km from the release point to Lyle Falls (rkm 4.2) was only 75 h (median 72.7 h; range 21.3 to 141.6 h; N=5).
The median swimming speeds of the fish varied among the reaches of the lower Klickitat River. In general, swimming speeds were higher at waterfalls than in reaches below or between waterfalls. The swimming speed of fish attempting to pass waterfalls varied depending on the success of the passage. The swimming speeds for successful passages were similar between waterfalls (medians of 174 centimeters per second [cm s-1] for Falls 1 and 189 cm s-1 for Falls 2). The mean swimming speeds for unsuccessful attempts were lower (153 cm s-1 for Falls 1, 136 cm s-1 for Falls 2, and 109 cm s-1 at Lyle Falls) than for successful passes. Fish passing waterfalls typically started an attempt while swimming at speeds near 100 cm s-1 and quickly attained maximum speeds over 200 cm s-1. Attempts lasted a mean of 23 s at Falls 1 and 18 s at Falls 2.
Both the rates of energy used and the total amount of energy used by fall chinook salmon differed greatly among the seven different areas of the river between and at the falls. The median rates of both aerobic and anaerobic energy use were consistently higher at waterfalls than in other areas. Although energy use rates were high at the waterfalls, the total amount of energy used at these locations was relatively small because the fish spent a relatively small amount of time actually jumping at the waterfalls. The highest amount of energy used was below Falls 1, followed by the stretch between Falls 1 and Falls 2, then between Falls 2 and Lyle Falls.
The tagging method (surgery vs. non-surgery) did not influence the migration rates of fish downstream of Lyle Falls. There was no significant difference in the amount of time it took fish with coded transmitters (mean 110 h; median 95 h; N=6) and those with EMG transmitters (mean 95 h; median 71 h; N=20) to migrate the 1.86 km from their release site to Falls 1.
Swimming activity varied by period of day. In all areas except Falls 1 and Lyle Falls, fish were more active during the day than during the night or twilight. In areas below and between waterfalls, fish were always less active at night than during the day. There was no trend among areas in differences between evening twilight and morning twilight. Although average swimming speeds were not always highest at waterfalls during the day, all but one successful passage of waterfalls (N=14) occurred during the day. One fish successfully passed Falls 1 during the evening twilight.
There did not appear to be any relationship between fish length or condition and successful passage of difficult areas in the lower Klickitat River. Female fall chinook salmon appeared to have more difficulty passing waterfalls than males.
Upstream destinations of both tag groups were similar and there was no apparent effect of surgery on the upstream migration of fish given an EMG tag. The mean maximum upstream location of fish given a gastric implant (i.e., coded transmitter) was rkm 38 (range rkm 32 to 50), which was not significantly different from the mean maximum of rkm 47 for fish given an EMG tag (range rkm 38 to 68). The combined mean maximum upstream location of fish given a coded or EMG tag was rkm 41.8 (37.6 km upstream of Lyle Falls).

vii
There was no significant difference between upstream migration rates for fish implanted with coded conventional transmitters and those implanted with EMG transmitters. The mean upstream migration rate of fish implanted with coded transmitters was 2.05 km d-1 (SE = 0.35; N=7; range 0.84 –3.16 km d-1). This compared well to the upstream migration rates for fall chinook salmon implanted with EMG tags that ultimately reached spawning areas; their mean upstream migration rate was 2.79 km d-1 (SE = 0.29; N=5; range 2.18 –3.82 km d-1). The overall mean movement rate for both groups combined was 2.36 km d-1. Given this movement rate, it would take the average fall chinook salmon 15.93 days to travel the 37.6 km from Lyle Falls (rkm 4.2) to the mean maximum upstream location (i.e., spawning area) of tagged fish (rkm 41.8).
The mean swimming speed of fall chinook salmon in the Klickitat River upstream of Lyle Falls was 99 cm s-1 (SD = 34; median 87 cm s-1). The energetic costs to migrate up the Klickitat River to spawning areas was quantified on a temporal scale (per day). It was estimated that upstream migrating fall chinook salmon used 28.8 kcal kg-1 d-1 (19.0 kcal kg-1 d-1 through aerobic pathways and 9.8 kcal kg-1 d-1 through anaerobic pathways) while migrating upstream to spawning areas. Fall chinook salmon migrating from Lyle Falls to spawning areas above the Little Klickitat River were estimated to incur an energetic cost of approximately 3,971 kcal. Energy use rates were likely higher upstream of Lyle Falls than between waterfalls because the river gradient is higher and that stretch contains more riffles and cascades.
A bioenergetics example was run, which estimated that fall chinook salmon would expend an estimated 1,208 kcal to pass from the mouth of the Columbia River to Bonneville Dam and874 kcals to pass Bonneville Dam and pool and the three falls on the Lower Klickitat River, plus an additional 2,770 kcals above the falls to reach the spawning grounds, leaving them with approximately 18% (1,089 kcals) of their original energy reserves for spawning. Results of the bioenergetics example suggest that a delay of 9 to 11 days along the lower Klickitat River may deplete their remaining energy reserves (at a rate of about 105 kcal d-1) resulting in death before spawning would occur.
Several strategies have been proposed to increase declining numbers of Pacific salmon in the Columbia Basin including increasing the amount of habitat that salmon can use for spawning and rearing by improving passage over barriers such as waterfalls. These barriers either limit the geographic range of salmon or deplete limited energy reserves making return to upstream reaches and successful spawning less likely. Improved passage at these difficult areas will likely result in an increase in the number of anadromous salmonids returning to the Columbia River Basin. This project examined not only the behavior of fish as they passed and attempted to pass difficult areas, but also the energy used during passage.
We conclude that even though fish make large, difficult leaps to pass waterfalls, the total amount of energy used at individual waterfalls is relatively small if fish have access to areas of low water velocity in which to rest and recover between jumps. This is because fall chinook salmon jumping over waterfalls were found to use burst swimming for periods of only 20 seconds at a time. In the lower Klickitat River, however, a combination of repeated waterfalls and high-velocity transition areas makes for difficult passage conditions that likely affect the fish’s ability to migrate above Lyle Falls. We also found that longer river sections of relatively high-velocity flow that do not contain areas for fish to rest may be as difficult to pass as

viii
waterfalls, and because of their length, will result in larger amounts of energy used over the course of the migration.
The results of our study suggest that providing resting refugia in the vicinity of difficult passage areas (both natural and manmade) would likely provide a survival benefit to anadromous salmonids. Constructing low-water-velocity resting areas below and within points of difficulty may minimize energy losses to migrating salmon and improve passage success.
Further research on the fine-scale swimming and holding behavior of salmon at the base of waterfalls, entrances to fishways, and long stretches of fast water would improve our understanding of factors that affect the time and energy needed to enter and successfully transition through fishways and other areas of difficult passage. Other research needs identified by this study include determining the burst swimming abilities of adult salmon and understanding how these abilities change as fish mature as the migration progresses, and examining migrational energetics within small and medium size rivers in order to understand the relationships between energy use and river gradients, and different channel types, and habitat types. An examination of swimming behavior and energy use during spawning would also provide a piece of the puzzle, bringing us closer to understanding the relationships between natural and anthropogenic factors and energy use and spawning success.

ix
Acknowledgments
This work was funded by the Bonneville Power Administration; David Byrnes was the contracting technical officer. We would like to thank Roger Begay and Bill Sharp of the Yakama Nation, Tom Burns of the Washington State Department of Fish and Wildlife, and Scott Abernethy, Jessica Carter, Traci Degerman, Karen Dunmall, Greg Guensch, Mike Gough, James Kiona, Geoff McMichael, Dan Tano, Mark Weiland, and Ian Welch of the Pacific Northwest National Laboratory for their field assistance and scientific advice. We wish to thank Matt Mesa of the U.S. Geological Survey Biological Resources Division for use of lab equipment and Ron Ballard of the Washington State Department of Fish and Wildlife for assistance and coordination at the Klickitat Hatchery. We also thank Leonard Dave for assistance in obtaining fish.

x

xi
Contents Abstract .......................................................................................................................................... iii
Executive Summary .........................................................................................................................v
Acknowledgments.......................................................................................................................... ix
Contents ......................................................................................................................................... xi
Figures.......................................................................................................................................... xiii
Tables.............................................................................................................................................xv
1.0 Introduction.............................................................................................................................1
1.1 Background....................................................................................................................1
1.2 Objectives ......................................................................................................................4
1.3 Overview of Report........................................................................................................4
2.0 Study Area ..............................................................................................................................5
3.0 Methods...................................................................................................................................9
3.1 EMG Fish.......................................................................................................................9
3.2 Coded Fish ...................................................................................................................11
3.3 Radio Receiving System..............................................................................................12
3.4 Waterfall Measurements and Passage..........................................................................14
3.5 Swimming Speed, Migration Rates, and Energy Use..................................................15
3.5.1 Swimming Speeds..........................................................................................15
3.5.2 Aerobic Energy ..............................................................................................15
3.5.3 Anaerobic Energy ..........................................................................................16
3.5.4 Calculation of Energy Use Rates and Total Energy Use in Specific Areas...16
3.6 Calculation of Migration Rates and Energy Use Upstream of Lyle Falls ...................17
3.7 Relating Passage Success to Physical Features of Fish ...............................................17
3.8 Statistics .......................................................................................................................17
xii
4.0 Results...................................................................................................................................19
4.1 Objective 1. Evaluate Difficult Passage Conditions in Vicinity of Lyle Falls ...........19
4.1.1 General Distribution.......................................................................................19
4.1.2 Migration Rates and Passage Success............................................................19
4.1.3 Swimming Speed and Energy Use.................................................................20
4.1.4 Energy Use.....................................................................................................26
4.1.5 Factors Potentially Affecting Passage Success and Activity.........................31
4.2 Objective 2. Improve Our Understanding of Fall Chinook Salmon Distribution and Migration Rates within the Klickitat River Basin........................................................33
4.2.1 General Distribution Upstream of Lyle Falls.................................................33
4.2.2 Migration Rates..............................................................................................33
4.3 Objective 3. Estimate Activity Levels of Fall Chinook Salmon Migrating Upstream through the Free-Flowing River to Reach Spawning Areas ........................................35
5.0 Discussion.............................................................................................................................37
5.1 Migration Rates and Passage Success..........................................................................37
5.2 Swimming Speeds and Energy Use .............................................................................38
5.2.1 Factors Potentially Affecting Passage Success and Activity.........................42
5.2.2 Migration Rates in the Upper River...............................................................44
5.3 Bioenergetics Model ....................................................................................................44
5.4 Management Implications and Recommendations ......................................................46
6.0 References.............................................................................................................................49
Appendix A - Data on Individual Fish Tagged and Released in the Lower and Upper Klickitat River, Fall 2001 ...........................................................................................................................A.1
xiii
Figures Figure 1. Map of the Klickitat River within the Study Area. Black circles represent landmarks.
The inset map shows locations of antenna arrays and different waterfalls studied. The Lyle Falls fishway is next to Lyle Falls. ......................................................................................... 5
Figure 2. Water Discharge in the Klickitat River during the Study Period, 2001. Data collected at USGS station 14113000. The mean historical water discharge (data from 1910 to 1988) is also shown. .......................................................................................................................... 6
Figure 3. Water Temperature in the Klickitat River during the Study Period, 2001. Measurements taken at river km 4.2 using a thermister (Hobo Temp, Onset Computer Corp.). ..................................................................................................................................... 7
Figure 4. Median Swimming Speeds in Seven Different Sections of the Lower Klickitat River, Sept. – Nov. 2001. The critical swimming speed (Ucrit) of spring chinook salmon is shown on lower panel. Boxes indicate the 25th and 75th percentile of data, while the line inside the box indicates the median of the data. Whiskers indicate the 95% confidence intervals for the data, and outliers are also shown. ................................................................................... 21
Figure 5. The Swimming Speeds of Five Different (identified by transmitter frequency) Fall Chinook Salmon in Six Different Sections of the Lower Klickitat River, Sept. – Nov. 2001. All of these fish reached Lyle Falls. Boxes indicate the 25th and 75th percentile of data, while the line inside the box indicates the median of the data. Whiskers indicate the 95% confidence intervals for the data; outliers are also shown. ................................................... 22
Figure 6. Swimming Speeds of Adult Fall Chinook Salmon for Passage Attempts at Three Waterfalls in the Lower Klickitat River, Sept. – Nov. 2001. The critical swimming speed for spring chinook salmon is also shown. Boxes indicate the 25th and 75th percentile of data, while the line inside the box indicates the median of the data. Whiskers indicate the 95% confidence intervals for the data, and outliers are also shown. ............................................ 24
Figure 7. Swimming Speeds of One Adult Fall Chinook Salmon as it Passes Falls 2. Heavy line indicates time actually passing over waterfall (23 seconds). ................................................ 25
Figure 8. An Example of the Swimming Speeds of One Adult Fall Chinook Salmon as it Passes Falls 1 and Falls 2 in the Lower Klickitat River................................................................... 26
Figure 9. Rates of Aerobic and Anaerobic Energy Use (kcal h-1) by Adult Fall Chinook Salmon in Seven Different Areas of the Lower Klickitat River, Sept. – Nov. 2001. The outlier at Falls 1 is the largest fish tagged with an EMG transmitter. Boxes indicate the 25th and 75th percentile of data, while the line inside the box indicates the median of the data. Whiskers indicate the 95% confidence intervals for the data, and outliers are also shown.................. 29
Figure 10. Aerobic and Anaerobic Energy Used by Adult Fall Chinook Salmon in Seven Different Areas of the Lower Klickitat River, Sept. – Nov. 2001. Boxes indicate the 25th

xiv
and 75th percentile of data, while the line inside the box indicates the median of the data. Whiskers indicate the 95% confidence intervals for the data, and outliers are also shown. 30
Figure 11. Map of the Klickitat River Basin Indicating the Highest Upstream Locations of Radio-Tagged Adult Fall Chinook Salmon (solid circles), Sept. – Nov. 2001. These locations are for fish tagged with an EMG or coded transmitter. Waterfalls, other landmarks, and release points of fish are also shown. .......................................................... 34

xv
Tables Table 1. Fish Tagged with EMG or Coded Transmitters in the Klickitat River, Fall 2001.......... 9
Table 2. Estimated Dimensions of the Three Waterfalls in the Lower Klickitat River. All measurements are in meters. ................................................................................................. 15
Table 3. Median Swimming Speeds of 25 Adult Fall Chinook Salmon in Seven Areas of the Lower 4.2 km of the Klickitat River, Sept. – Nov. 2001...................................................... 20
Table 4. The Mean and Mean of Maximum Swimming Speeds for Adult Fall Chinook Salmon Successful (S) and Unsuccessful (U) Attempts to Pass Three Waterfalls on the Klickitat River, Sept. – Nov. 2001. Passage length is the average length of time (+ SE) fish were logged while attempting to pass each waterfall. N is the number of fish recorded at each falls. Theoretical estimates of takeoff velocity necessary to leap a free overfall were calculated using the methods in Powers and Orsborn (1990)............................................... 25
Table 5. Median Time Present and Energy Use of All Adult Fall Chinook Salmon in Seven Areas of the Lower 4.2 km of the Klickitat River, Sept. – Nov. 2001. Since fish that do not pass waterfalls spend more time (and thus use more energy) below them than fish that pass, swimming speed and energy use are also shown for fish that successfully passed Falls 1 and Falls 2 for the areas below Falls 1 and below Falls 2. These values are more appropriate for modeling the energy needed to successfully pass through the lower Klickitat River. ......... 27
Table 6. The Median Percentage of EMG Signals Collected from Adult Fall Chinook Salmon in the Lower Klickitat (Sept. – Nov. 2001) that Were over 70%, 80% and 100% of the Critical Swimming Speed (2.06 Bl s-1) in Seven Different Areas. The percentage of EMG signals above the highest swimming speed at which fish were calibrated is also shown................. 28
Table 7. Estimated Energy Use Rates of Adult Fall Chinook Salmon in Seven Areas in the Klickitat River below and above Lyle Falls, Sept. – Nov. 2001. For comparison, energy use rates are provided that were determined from proximate analysis studies (Brett 1995). The percentages of time that fish are estimated to use aerobic metabolism and anaerobic metabolism are also presented. ............................................................................................. 28
Table 8. The Average Swimming Speeds (cm s-1) of Adult Fall Chinook Salmon during Different Diel Periods in Seven Different Areas of the Lower Klickitat River, Sept. – Nov. 2001....................................................................................................................................... 32
Table 9. The Condition Factor, Fork Length (FL), Sex, and Sex Ratio of Adult Fall Chinook Salmon that Were Released, and Migrated Successfully, to Different Areas in the Lower Klickitat River, Sept. – Nov. 2001........................................................................................ 32
Table 10. Swimming Speeds, Energy Use Rates (aerobic (A) anaerobic (AN) and total (TOT = aerobic and anaerobic combined), and Energy Used by Fall Chinook Salmon Migrating to Spawning Areas in the Klickitat River Upstream of Lyle Falls, Oct. – Nov.2001............... 35

xvi
Table 11. Estimated Energetic Costs of Different Segments of Upstream Spawning Migration for an Average Sized (6 kg) Fall Chinook Salmon. Starting energy reserves were estimated by Brett (1995) using data from Greene (1926) to be 990 kcal kg-1. Energy used to travel from the mouth of the Columbia River to Bonneville Dam was estimated using travel times reported in NMFS (2000) and energy use rates estimated by Brett (1995) using data from Greene (1926). Energy used to pass Bonneville Dam (31.2 kcal kg-1 d-1) and Bonneville reservoir (19.5 kcal kg-1 d-1) were estimated by Geist et al (2000). Other energy use values are from this study for fish that successfully passed Falls 1 and 2 (Table 5). ...................... 45

1
1.0 Introduction
This report describes a study conducted by Pacific Northwest National Laboratory (PNNL) for the Bonneville Power Administration’s Columbia Basin Fish and Wildlife Program during the fall of 2001. The objective of the study was to examine the migration and energy use of adult fall chinook salmon (Oncorhynchus tshawytscha) as they attempted to migrate up the Klickitat River past three waterfalls to spawning areas.
The study uses physiological telemetry, which has undergone recent advances in technology and has not previously been used to examine the swimming behavior or energetics of adult salmon in the Columbia River basin.
1.1 Background
As soon as they start their upstream spawning migration in freshwater, semelparous salmon are in a race against time. They discontinue feeding and rely on the energy reserves contained in their own body fat, protein, and carbohydrates to complete migration, develop gonads, and complete spawning (Brett 1995). Migrating salmon can have various and numerous obstacles in their path between the ocean and the spawning grounds such as rapids, waterfalls, and hydroelectric dams. These obstacles require energy reserves to pass and can potentially delay migration; if the energy needed to pass the obstacles or the time delayed is too great, salmon may expend their energy reserves before successfully spawning, resulting in prespawning mortality.
Due to the declining numbers of adult salmon in the Pacific Northwest, particularly wild salmon, it is critical to long-term recovery that the number of returning adults be maximized and prespawning mortality be minimized. In some areas of the Columbia River basin, the number of salmon smolts produced per spawner appears to have increased after dams were put in place (Petrosky et al. 2001). Despite this, increased returns of adult salmon to spawning grounds still translate to increased numbers of smolts and improved population sizes (estimated using data summarized by Petrosky et al. 2001).
Before even reaching spawning tributaries, mortality rates can be high. For example, in the reach of the Columbia River between Ice Harbor Dam and Lower Granite Dam, prespawning mortality of spring/summer chinook salmon has been estimated to range from 14.1 to 25.6% (Bjornn et al. 2000). In the reach from Ice Harbor Dam to spawning grounds or hatcheries, prespawning mortality has been estimated at 14.1 to 54% (Bjornn et al. 1995, Bjornn et al. 1998, Bjornn et al. 2000). Also, many prespawning mortalities are found in spawning tributaries. For example 9 to 11% of spring chinook salmon in the Yakima River died before spawning (Hockersmith et al. 1994). Reducing delay of upstream migrating fish has long been a strategy to minimize the amount of energy used during upstream migrations. However, the energetic consequences of different periods of delays and the energetic costs of passing natural and anthropogenic points of difficulty have received little attention.

2
Energy use during spawning migrations can be influenced by many factors and behaviors such as water temperatures and levels (which are affected by drought or floods) and different swimming behaviors and migration rates. (See Beamish 1978 and Brett 1995 for a review of how environmental factors such as water temperature influence swimming and energy use.) Migration rates and swimming speeds of salmon during migration have long been estimated by examining the water velocities of a river section and the time it takes adult salmon to pass through that river section. Migration rates of Pacific salmon can vary widely, from 3 to 45 km d-
1 (Bernatchez and Dodson 1987; Hockersmith et al. 1994), and migration rates can change as migrations progress (Hockersmith et al. 1994). Estimates of mean swimming speeds during migration vary from 0.67 to 2.77 body lengths per second (Bl s-1) for several species of Pacific salmon (Bernatchez and Dodson 1987).
However, there are several drawbacks to estimating swimming speed by examining travel times and water velocities in rivers. First, water velocities are highly variable within rivers, making the accuracy of these estimates questionable. Second, fish could spend long periods of time in a river section without making any upstream progress. Even though the fish are stationary, they are still likely to be swimming and are using dwindling energy reserves.
Direct examination of swimming behavior along salmon migrations was made possible by the invention of electromyogram (EMG) telemetry. Electromyograms obtained from the swimming muscle of fish were being obtained via radio telemetry as early as 1976 (Weatherley et al. 1982). This technique has been used to examine swimming speed by numerous researchers on numerous species since. Sockeye salmon (O. nerka) are the only semelparous salmonid for which published field studies using this technique have been found (Hinch et al. 1996; Hinch and Rand 1998; Rand and Hinch 1998; Hinch and Bratty 2000). Using this technique, Hinch and Rand (1998) estimated that sockeye salmon migrating up the Fraser River system in British Columbia exhibited a wide range of swimming speeds (means of ~0-150 cm s-1 in several different river reaches), which varied depending on river reach.
Hinch and Bratty (2000) also used EMG telemetry to estimate swimming speeds of sockeye salmon in the Fraser River. They found differences in the swimming speeds of sockeye salmon approaching a fishway, with successful fish swimming slower than unsuccessful entrants (1.85 Bl s-1 versus 4.23 Bl s-1). They also estimated the mean swimming speeds of salmon passing a fishway at Hells Gate to be 11.37 centimeters per second (cm s-1).
EMG telemetry is also a powerful tool for examining the energy use of semelparous salmon. Swimming speeds estimated from EMG telemetry can be related to the amount of energy used by fish while swimming at different swimming speeds (Hinch and Rand (1998); see Beamish (1978), Brett (1995) and Webb (1995) for reviews of energy used during swimming). Rand and Hinch (1998) used swimming speeds of sockeye salmon estimated using EMG radio telemetry (reported by Hinch and Rand 1998) to estimate the energetic costs of migration. They estimated that the costs of spawning migrations for sockeye salmon varied between approximately 35 and 130 kilocalories per kilogram per day (kcal kg-1 d-1) in certain river sections (converted from their estimate of ~5 to 18 Watts [W] for fish with a mean weight of 2.88 kg). Difficult areas were on the higher end of this range while other areas ranged from 35 to 72 kcal kg-1 d-1.

3
Prior to the invention of EMG telemetry, studies of the energy used by semelparous adult Pacific salmon were being conducted using different methods as early as the 1920s (Pentegoff et al. 1928; reviewed by Brett 1995). These early studies used techniques that are still commonly used today. By chemical analysis or bomb calorimetry, the amount of energy available to migrating salmon can be determined (methods reviewed by Brett 1995). In his review of salmon energetics, Brett (1995) provides estimates of energy use during spawning migrations for several species of adult Pacific salmon ranging from 16 to 44 kcal kg-1 d-1.
By capturing fish along the length of their migrations, researchers can estimate the energetic costs of different segments of the migration. However, this technique is not appropriate for examining fine-scale energy use along migrations. This is because a long migration time is required to obtain significant changes in sample composition (Brett 1995). In contrast, EMG transmitters are well suited as a tool to examine fine-scale locomotory energy use by fish (as illustrated by Rand and Hinch 1998).
Although swimming behavior and energetics of salmonids have been studied in several areas, the swimming behavior and energy use of migrating adult salmon in association with areas of difficult passage has not been widely covered. EMG technology has been used to examine difficult passage in large rivers and in and around fishways (Hinch et al. 1996, 1998; Hinch and Rand 1998; Rand and Hinch 1998; Hinch and Bratty 2000), but other types of barriers (i.e., waterfalls) have not been examined. Little direct quantitative work has been conducted that has examined the challenge provided by waterfalls to adult migrating salmon. Some of the swimming behavior and leaping strategies are briefly reviewed by Webb (1995).
Examination of burst swimming speeds like those used at waterfalls has been largely lacking. Webb (1995) states that there is no standard protocol for determining burst swimming performance and that burst speeds have not been adequately researched. Most measurements of burst swimming have been made on small or juvenile fish (Webb 1995). However, burst swimming abilities vary considerably between juvenile and adult fish. Also, there seem to be large variations among the results of various techniques used to estimate maximum swimming speeds of fish (Johnsrude and Webb 1985; Webb 1995). Many estimates have been made by electronically stimulating pieces of fish muscle.
An examination of the swimming behavior and energetics of fall chinook salmon in the Klickitat River is the focus of this study. Passage of several waterfalls has been identified as a limiting factor for chinook and coho salmon (O. kisutch) and steelhead (O. mykiss) in the Klickitat subbasin (Sharp et al. 2000). Fall chinook salmon have been observed jumping repeatedly at Lyle Falls and the Lyle Falls fishway only to fall back without passing (personal communication with D. Fast, Yakama Nation, 2001) and Lyle Falls fishway does not meet current fish passage design criteria (Sharp et al. 2000). Further, coho salmon did not spawn above Lyle Falls at the same level observed in previous years but did spawn below the falls at higher-than-normal numbers. Coho were observed stacked up below the falls during late November 2000, suggesting that the run was at least partially blocked by the degraded fishway at Lyle Falls. Fisheries managers in the Klickitat River Basin have recommended fishway improvements to reduce passage delay and reduce injury.

4
1.2 Objectives
This study was designed with the following three major objectives: 1) evaluate difficult passage conditions in the vicinity of Lyle Falls, 2) improve our understanding of fall chinook salmon distribution and migration rates within the Klickitat River Basin, and 3) estimate activity levels of fall chinook salmon migrating upstream through free-flowing rivers to reach spawning areas.
1.3 Overview of Report
Chapter 2 of this report describes the study area. Chapter 3 describes the methodology for tagging the fish, setting up the receiver array, determining swimming speed and energy usage, and calculating migration rates and energy usage rates. Chapter 4 provides results of our field study. Chapter 5 presents a discussion of findings and conclusions. Chapter 6 is references.

5
2.0 Study Area This study was conducted in the Klickitat River drainage in south central Washington
(Figure 1; 45° 41.7’ - 46° 2.7’ N, 121° 14.2’ - 121° 3.7’ W). The system originates in the Cascade Mountains and flows southerly toward the Columbia River. The confluence with the Columbia River is at river km 290.3, 54.7 km upstream of Bonneville Dam.
Figure 1. Map of the Klickitat River within the Study Area. Black circles repre-sent landmarks. The inset map shows locations of antenna arrays and different waterfalls studied. The Lyle Falls fishway is next to Lyle Falls.

6
The Klickitat valley has steep walled canyons and there are several waterfalls and cascades along the mainstem of the river. The gradient of the river ranges from 0.4% to 0.8% in the lower 70 km where most of this research was conducted (Sharp et al. 2000). The lower Klickitat River flows through a bedrock-confined gorge with walls over 30 m high in some areas. There are several waterfalls and chutes in this area. The habitats in the Klickitat River are at a much higher gradient than fish experience in the mainstem Columbia River. Upstream of the Lyle Falls, adult salmon must migrate through a variety of riffles and cascades.
Prior to 1946 there was no record of fall chinook salmon migrations in the Klickitat drainage (Sharp et al. 2000). Hatchery planting of tule stock started in 1946 and changed to upriver bright fall chinook stock in 1986. Four million smolts are released annually. Mainstem spawning occurs from river km 8.4 to 68.
The fishway at Lyle Falls was constructed in 1952 (Sharp et al. 2000). The Lyle Falls fishway is a vertical slot fishway with 14 pools (13’ long) and only one exit. The fishway also contains an off ladder trap designed to capture upstream migrating adult fish. However, this fishway does not meet current fish passage design criteria (Sharp et al. 2000).
Fall chinook salmon were radio tracked in the Klickitat River from Sept. 14, 2001, to Nov. 14, 2001. Flow was relatively stable during most of the study period, increasing only at the end of the season (Figure 2) while water temperatures decreased throughout the study period (Figure 3). Water discharge was obtained from USGS station 14113000. Water temperatures were obtained using a thermister (Hobo Temp, Onset Computer Corp.).
Figure 2. Water Discharge in the Klickitat River during the Study Period, 2001. Data collected at USGS station 14113000. The mean historical water discharge (data from 1910 to 1988) is also shown.

7
2
6
10
14
17 S
ep.
24 S
ep.
1 O
ct.
8 O
ct.
15 O
ct.
22 O
ct.
29 O
ct.
5 N
ov.
12 N
ov.
Date
Wat
er T
empe
ratu
re (C
)
Figure 3. Water Temperature in the Klickitat River during the Study Period, 2001. Measurements taken at river km 4.2 using a thermister (Hobo Temp, Onset Computer Corp.).

8

9
3.0 Methods This chapter provides descriptions of the EMG and coded fish tagging; the radio
receiving system; waterfall measurements; methods used to determine fish swimming speeds, aerobic and anaerobic energy usage, and energy use rates in specific areas of the Klickitat River; and the relation of gender and diel period to falls passage.
3.1 EMG Fish
Fall chinook salmon were obtained through the dip net fishery at Lyle Falls between Sept. 11 and Oct. 12, 2001 (Table 1, Appendix A). Fish were dip netted while leaping at Lyle Falls and raised to a platform above the edge of the waterfall. They were placed in a large rectangular tank (757 liters [L]) and transported approximately 90 minutes to the Klickitat fish hatchery. During transport, densities of fish were kept low (<6 fish per trip), bottled oxygen was used to maintain dissolved oxygen levels at >100% air-saturation, and the water was treated with polyaqua (160 parts per million [ppm]) and clove oil (ca. 10 ppm) to reduce stress. Water temperature never increased more than 2ºC during any trip.
Table 1. Fish Tagged with EMG or Coded Transmitters in the Klickitat River, Fall 2001
Tag Release # of RKM Type N Dates FL (SD) Weight (SD) Males of Release EMG 35 Sept. 14 - Oct. 15 77.9 (5.8) 5.9 (2.0) 22 1.84 EMG 6 Oct. 11 - 15 87.2 (15) 7.9 (2.9) 5 9.25
Coded 15 Sept. 26 - Oct. 16 78.6 (8.7) 6.5 (2.8) 13 1.84 Coded 15 Sept. 27 - Oct. 16 78.5 (9.1) 6.1 (1.8) 10 9.25
FL = fork length, SD = standard deviation, rkm = river kilometer
Upon arrival at the hatchery, 3 to 4 fish were randomly placed in each of three covered, indoor circular tanks receiving well water (9°C). Tanks were 1.5 m in diameter and had flow rates of about 6 to 7 L min-1. All tanks had a water depth of about 50 cm.
Shortly after arrival, all fish were surgically implanted with EMG transmitters. Each transmitter emitted signals on a unique frequency between 148 and 151 MHz. Transmitters were epoxy-coated cylinders (length = 52 mm; diameter = 16 mm; weight in air 17.3 g and weight in water 8 g; Lotek Engineering, Inc., Ontario, Canada) that had a single 25-cm antenna and two stainless steel, Teflon-coated wires (electrodes) extending from one end. Each electrode had a 7-mm-long, 1-mm-diameter 24-k gold rod attached to its end. The EMG transmitter detected electrical activity of muscles. The electrical impulses emitted by the muscles were detected and stored in a capacitor until a factory-set threshold (in µV) was reached, at which time a radio pulse was transmitted. Therefore, increasing muscle activity resulted in an increase in the pulse rate of transmitted radio signals (i.e., the time between the radio transmissions decreases; see Kaseloo et al. 1992).
Prior to EMG transmitter implantation, fish were anesthetized in 35 L of water using 50 ppm of clove oil until they reached a stage 4 to 5 of anesthetization. Fish were then placed
10
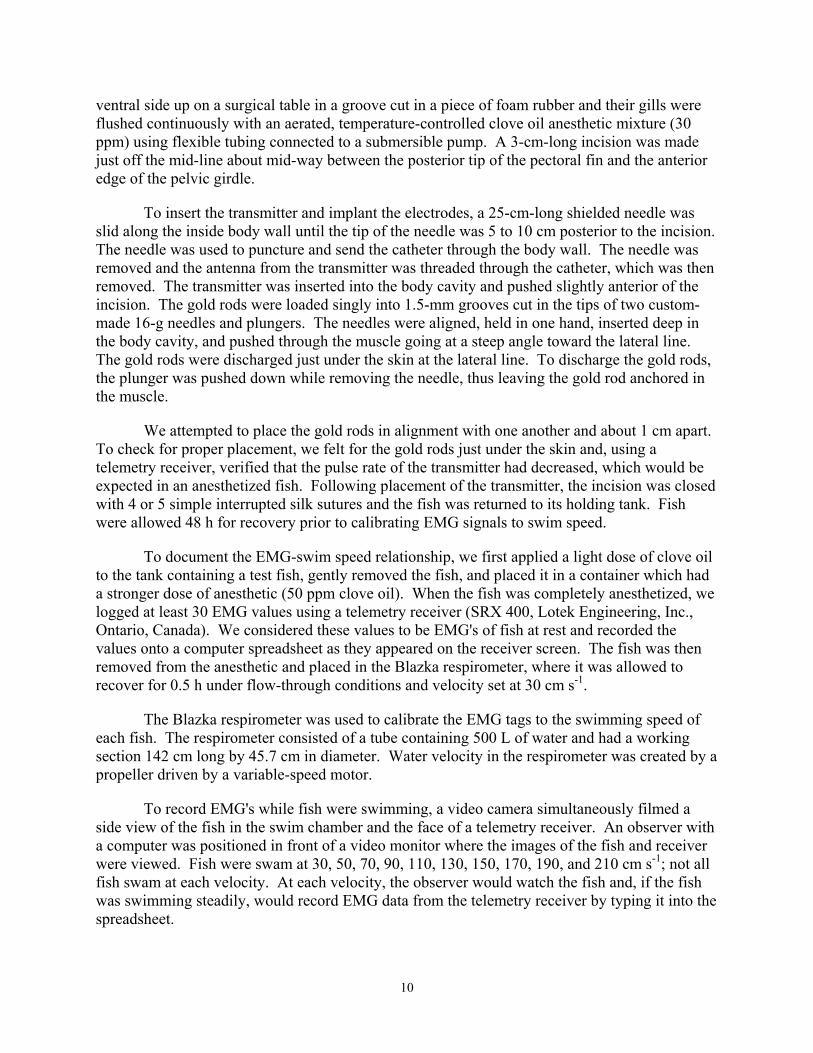
ventral side up on a surgical table in a groove cut in a piece of foam rubber and their gills were flushed continuously with an aerated, temperature-controlled clove oil anesthetic mixture (30 ppm) using flexible tubing connected to a submersible pump. A 3-cm-long incision was made just off the mid-line about mid-way between the posterior tip of the pectoral fin and the anterior edge of the pelvic girdle.
To insert the transmitter and implant the electrodes, a 25-cm-long shielded needle was slid along the inside body wall until the tip of the needle was 5 to 10 cm posterior to the incision. The needle was used to puncture and send the catheter through the body wall. The needle was removed and the antenna from the transmitter was threaded through the catheter, which was then removed. The transmitter was inserted into the body cavity and pushed slightly anterior of the incision. The gold rods were loaded singly into 1.5-mm grooves cut in the tips of two custom-made 16-g needles and plungers. The needles were aligned, held in one hand, inserted deep in the body cavity, and pushed through the muscle going at a steep angle toward the lateral line. The gold rods were discharged just under the skin at the lateral line. To discharge the gold rods, the plunger was pushed down while removing the needle, thus leaving the gold rod anchored in the muscle.
We attempted to place the gold rods in alignment with one another and about 1 cm apart. To check for proper placement, we felt for the gold rods just under the skin and, using a telemetry receiver, verified that the pulse rate of the transmitter had decreased, which would be expected in an anesthetized fish. Following placement of the transmitter, the incision was closed with 4 or 5 simple interrupted silk sutures and the fish was returned to its holding tank. Fish were allowed 48 h for recovery prior to calibrating EMG signals to swim speed.
To document the EMG-swim speed relationship, we first applied a light dose of clove oil to the tank containing a test fish, gently removed the fish, and placed it in a container which had a stronger dose of anesthetic (50 ppm clove oil). When the fish was completely anesthetized, we logged at least 30 EMG values using a telemetry receiver (SRX 400, Lotek Engineering, Inc., Ontario, Canada). We considered these values to be EMG's of fish at rest and recorded the values onto a computer spreadsheet as they appeared on the receiver screen. The fish was then removed from the anesthetic and placed in the Blazka respirometer, where it was allowed to recover for 0.5 h under flow-through conditions and velocity set at 30 cm s-1.
The Blazka respirometer was used to calibrate the EMG tags to the swimming speed of each fish. The respirometer consisted of a tube containing 500 L of water and had a working section 142 cm long by 45.7 cm in diameter. Water velocity in the respirometer was created by a propeller driven by a variable-speed motor.
To record EMG's while fish were swimming, a video camera simultaneously filmed a side view of the fish in the swim chamber and the face of a telemetry receiver. An observer with a computer was positioned in front of a video monitor where the images of the fish and receiver were viewed. Fish were swam at 30, 50, 70, 90, 110, 130, 150, 170, 190, and 210 cm s-1; not all fish swam at each velocity. At each velocity, the observer would watch the fish and, if the fish was swimming steadily, would record EMG data from the telemetry receiver by typing it into the spreadsheet.
11
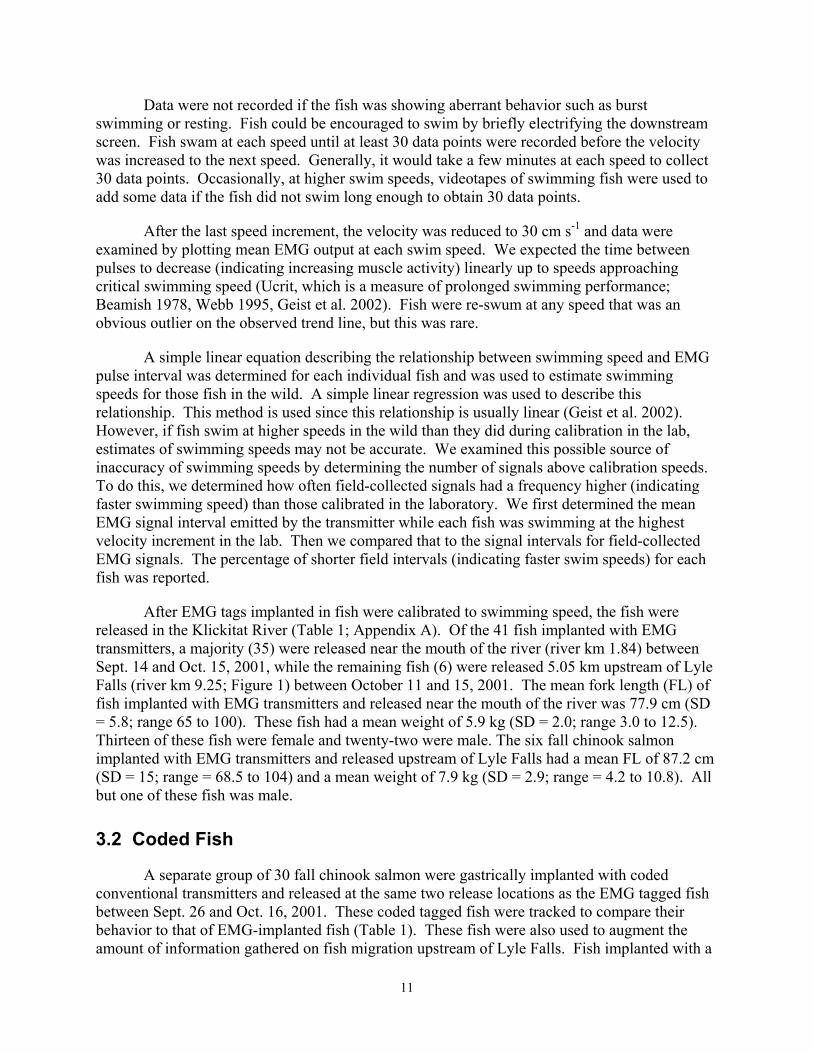
Data were not recorded if the fish was showing aberrant behavior such as burst swimming or resting. Fish could be encouraged to swim by briefly electrifying the downstream screen. Fish swam at each speed until at least 30 data points were recorded before the velocity was increased to the next speed. Generally, it would take a few minutes at each speed to collect 30 data points. Occasionally, at higher swim speeds, videotapes of swimming fish were used to add some data if the fish did not swim long enough to obtain 30 data points.
After the last speed increment, the velocity was reduced to 30 cm s-1 and data were examined by plotting mean EMG output at each swim speed. We expected the time between pulses to decrease (indicating increasing muscle activity) linearly up to speeds approaching critical swimming speed (Ucrit, which is a measure of prolonged swimming performance; Beamish 1978, Webb 1995, Geist et al. 2002). Fish were re-swum at any speed that was an obvious outlier on the observed trend line, but this was rare.
A simple linear equation describing the relationship between swimming speed and EMG pulse interval was determined for each individual fish and was used to estimate swimming speeds for those fish in the wild. A simple linear regression was used to describe this relationship. This method is used since this relationship is usually linear (Geist et al. 2002). However, if fish swim at higher speeds in the wild than they did during calibration in the lab, estimates of swimming speeds may not be accurate. We examined this possible source of inaccuracy of swimming speeds by determining the number of signals above calibration speeds. To do this, we determined how often field-collected signals had a frequency higher (indicating faster swimming speed) than those calibrated in the laboratory. We first determined the mean EMG signal interval emitted by the transmitter while each fish was swimming at the highest velocity increment in the lab. Then we compared that to the signal intervals for field-collected EMG signals. The percentage of shorter field intervals (indicating faster swim speeds) for each fish was reported.
After EMG tags implanted in fish were calibrated to swimming speed, the fish were released in the Klickitat River (Table 1; Appendix A). Of the 41 fish implanted with EMG transmitters, a majority (35) were released near the mouth of the river (river km 1.84) between Sept. 14 and Oct. 15, 2001, while the remaining fish (6) were released 5.05 km upstream of Lyle Falls (river km 9.25; Figure 1) between October 11 and 15, 2001. The mean fork length (FL) of fish implanted with EMG transmitters and released near the mouth of the river was 77.9 cm (SD = 5.8; range 65 to 100). These fish had a mean weight of 5.9 kg (SD = 2.0; range 3.0 to 12.5). Thirteen of these fish were female and twenty-two were male. The six fall chinook salmon implanted with EMG transmitters and released upstream of Lyle Falls had a mean FL of 87.2 cm (SD = 15; range = 68.5 to 104) and a mean weight of 7.9 kg (SD = 2.9; range = 4.2 to 10.8). All but one of these fish was male.
3.2 Coded Fish
A separate group of 30 fall chinook salmon were gastrically implanted with coded conventional transmitters and released at the same two release locations as the EMG tagged fish between Sept. 26 and Oct. 16, 2001. These coded tagged fish were tracked to compare their behavior to that of EMG-implanted fish (Table 1). These fish were also used to augment the amount of information gathered on fish migration upstream of Lyle Falls. Fish implanted with a

12
coded transmitter were captured in the same location and using the same technique as fish implanted with an EMG transmitter. The radio tags used were model MCFT 7A (Lotek Engineering, Inc., Ontario, Canada). These transmitters were 16 mm in diameter and 83 mm long. They weighed 29 g in air and 13 g in water and had an estimated lifetime of 1,013 days. These transmitters emitted a coded pulse that allowed multiple transmitters to be received on a single frequency while retaining the ability to identify individual transmitters. The 30 transmitters emitted signals on three separate frequencies (10 on each frequency).
After capture, fish were placed in a container containing anesthetic (~30 to 50 ppm clove oil). Once fish attained stage seven anesthesia, they were grasped by the lower jaw and a plastic tube or smooth wooden dowel was used to gently ease the transmitter into the stomach. Following implantation, fish were placed in a transport tank (same as for EMG fish) and transported a short distance (either 2.36 km downstream or 5.05 km upstream) to release sites using the same protocol as fish implanted with EMG transmitters.
Fifteen of the fish implanted with conventional transmitters were released near the mouth of the river (at the same location as the EMG implanted fish; Figure 1) between Sept. 26 and Oct. 16, 2001 (Table 1; Appendix A). The mean fork length of these fish was 78.6 cm (SD = 8.7; range 69 to 99 cm) and the mean weight was 6.5 kg (SD = 2.8; range 4.1 to 13.9 kg). Thirteen of these fish were male and two were female.
The other 15 tagged fish were released upstream of Lyle Falls (at the same location as the EMG implanted fish) between Sept. 27 and Oct. 16, 2001. The mean fork length of these fish was 78.5 cm (SD = 9.1; range 67 to 94 cm) and the mean weight was 6.1 kg (SD = 1.8; range 3.9 to 9.7 kg). Ten of these fish were male and five were female.
3.3 Radio Receiving System
Multiple antenna arrays (i.e., several antennas grouped together to receive signals emitted from transmitters within a river section) were constructed to cover over 3.4 km of river in the vicinity of Lyle Falls (Figure 1). To receive signals from the EMG transmitters, three arrays of 3-, 4-, or 6-element Yagi antennas (Model P150-4 or PLC 6, Cushcraft Corporation, Manchester, NH; Model MYA-1503, Maxrad Inc.) were affixed to the cliffs overlooking the Klickitat River. These arrays had overlapping coverage from river km 2.4 to 5.8 (Lyle Falls is at river km 4.2). Each antenna array fed signals to one or more SRX400 receivers (Lotek Engineering, Inc., Ontario, Canada).
In addition, single antennas were mounted next to the three waterfalls (at rkm 3.7, 4.1 and 4.2; Figure 1) to log signals of EMG-implanted fish as they attempted to ascend the waterfalls. Falls 1 and 2 were each monitored with single 4-element Yagi antennas, while Lyle Falls was monitored with a corner reflector antenna (Model CRF-150-B; dB Labs, Gretna, NE). The receiving gain on the waterfall receivers was set so that radio signals from the transmitters would be received only when fish were jumping at the waterfall or when they were within approximately a meter of the top or bottom of the fall.
A minimum of one receiver logged each waterfall. When available, a second receiver was used to log signals at the waterfalls. Each receiver had to scan through several separate

13
frequencies. Because of this, a fish might jump at a waterfall while the receiver was scanning another frequency, causing the signal from the jumping fish to be missed by the receiver. Thus, whenever possible, a second receiver was added to the antenna array. This receiver was programmed to receive the signals from the individual fish observed near the falls on that day.
In addition to fixed reception arrays, manual trackers frequently (every 1 to 3 days) walked or drove along the river and tracked fish. Fish tagged with an EMG transmitter were manually monitored every one to three days from the time the fish were released in the lower river until they either left the river or died. Pick-up trucks were outfitted with 3- or 4-element Yagi antennas (models mentioned above). While trackers were walking along the river, they used 3-element folding Yagi antennas (Advanced Telemetry Systems Inc., Isante, MN). Locations of fish were determined using a global positioning system (GPS) unit. Manual trackers determined which fish were present in the reception range of arrays; this information was used to program the receivers so they would monitor the minimum frequencies necessary yet still receive all signals from the fish present. This maximized the likelihood that fish passing a waterfall would be logged.
The Lyle Falls fishway was also monitored by a separate array of antennas. Antennas were placed in each of 14 steps of the fish ladder, and one antenna was placed just outside the exit. Thirteen underwater antennas and two aerial Yagi antennas were placed throughout the fishway. This enabled us to log signals from a fish as it ascended the fishway in order to isolate swimming behavior in specific sections.
Underwater antennas (balanced loop vee antennas; Model LVB-150-D; dB labs, Gretna, NE) were placed in custom-made schedule 80 PVC housings. Housings were filled with waterproofing material (Dielectric Tough Gel; Dow Corning Corp.) to waterproof all coaxial cable connections and the amplifiers, which although located in the housing were not used since reception was adequate to receive signals without amplification. A hammer drill was used to make a hole and expansion bolts were used to anchor an eye bolt to the wall of the fishway. The underwater antennas were attached to these eye bolts using metal cable and ferrules. In-line attenuators (Advanced Receiver Research Communications Products, Burlington, CT) were used to fine-tune signal input so that each antenna would only pick up the signals in the single section of the fishway in which it was placed. One receiver was set to receive all signals from the entire array at once, while another was set to sequentially scan each antenna once a transmitter’s signal was received on the array.
Separate antenna arrays were also installed to collect signals emitted from conventional coded transmitters. Separate arrays and receivers were used because EMG and coded transmitters were not compatible on the same receiver firmware. Three arrays of 3- or 4-element Yagi antennas (manufacturers noted above) were constructed for this purpose. One array was set at Falls 1 and logged fish as they approached the waterfall. This array was not constructed to determine if fish successfully passed this first waterfall, but to determine if they reached the waterfall. Due to limited resources, we were not able to determine when coded fish passed Falls 2. This precludes a comparison of travel time to this waterfall between salmon implanted with EMG and coded tags

14
Two more arrays were placed at Lyle Falls and the Lyle Falls fishway. One array was set approximately 30 m upstream of Lyle Falls to determine if fish tagged with coded conventional transmitters successfully passed Lyle Falls. Another array was set up at the exit to the Lyle Falls fishway and was designed to determine if fish successfully passed the fishway. The gain on the receivers was adjusted so that fish passing the falls would not be detected by the receiver logging the exit of the fishway, and vice versa. Fish with coded transmitters were also tracked by manual trackers using gear described above. These fish were monitored approximately once a week.
3.4 Waterfall Measurements and Passage
Waterfall passage was determined using both manual trackers with mobile telemetry gear and with fixed radio telemetry gear. The manual trackers spent long periods of time stationed next to waterfalls logging the signals and signal strength of transmitters implanted in fish both attempting to and successfully passing waterfalls. Notes were made on these behaviors and related to the signals emitted from the EMG transmitters. Using these observations, the initiation and completion of successful passages was estimated. A passage was considered to have started when swimming speeds increased from a speed < 1 m s-1 to a speed > 1 m s-1 and usually peaked over 2 m s-1. Passage completion was assumed when speeds returned to < 1 m s-1 and the fish was detected above the falls.
Manual trackers, however, were not present at every waterfall passage. They were present during four successful passages of waterfalls (by four different fish), two at Falls 1 and two at Falls 2. Thus, when an individual fish’s passage was not detected by manual tracking, its behavior had to be related to signals that were collected by the fixed telemetry receiving systems at waterfalls. The same speed characteristics described above were used to determine the start, length, and conclusion of the waterfall passage event. However, since radio receivers were often scanning more than one frequency, it is possible that a fish could pass a waterfall undetected while the receiver was scanning another frequency. Passage success was confirmed by detecting the fish at an upstream position. Thus, the last attempted passage logged by a receiver at a waterfall just prior to the individual’s confirmed presence upstream of the waterfall was assumed to be a successful passage event over the waterfall.
To relate the swimming behavior and passage success of fish to the physical attributes of different waterfalls, the characteristics of the waterfalls were examined in a manner similar to that described in Powers and Orsborn (1990). The height (h), width (w), and length (l) of the waterfalls were estimated using photographs, a GPS, a laser level, and a range finder (Table 2). The critical velocity was determined computationally by solving for the depth at the minimum specific energy for the measured width and river discharge and this was used as an estimate of the crest velocity (Henderson 1966). Table 2 also shows critical depth, which theoretically is the minimum depth that can occur as water flows over the top of an object (Gordon et al. 1992).
Theoretical estimates of the takeoff speeds necessary to leap a free overfall were calculated using methods similar to those of Powers and Orsborn (1990). The method involved applying the equation for the motion of a projectile. The projectile motion equation was solved for initial velocity given other parameters (fall height, horizontal distance, upwelling velocity, takeoff angle, and fish length). The fish were assumed to take off from the upwelling zone immediately downstream of the plunging water. An upwelling velocity of 0.61 m s-1 was used.
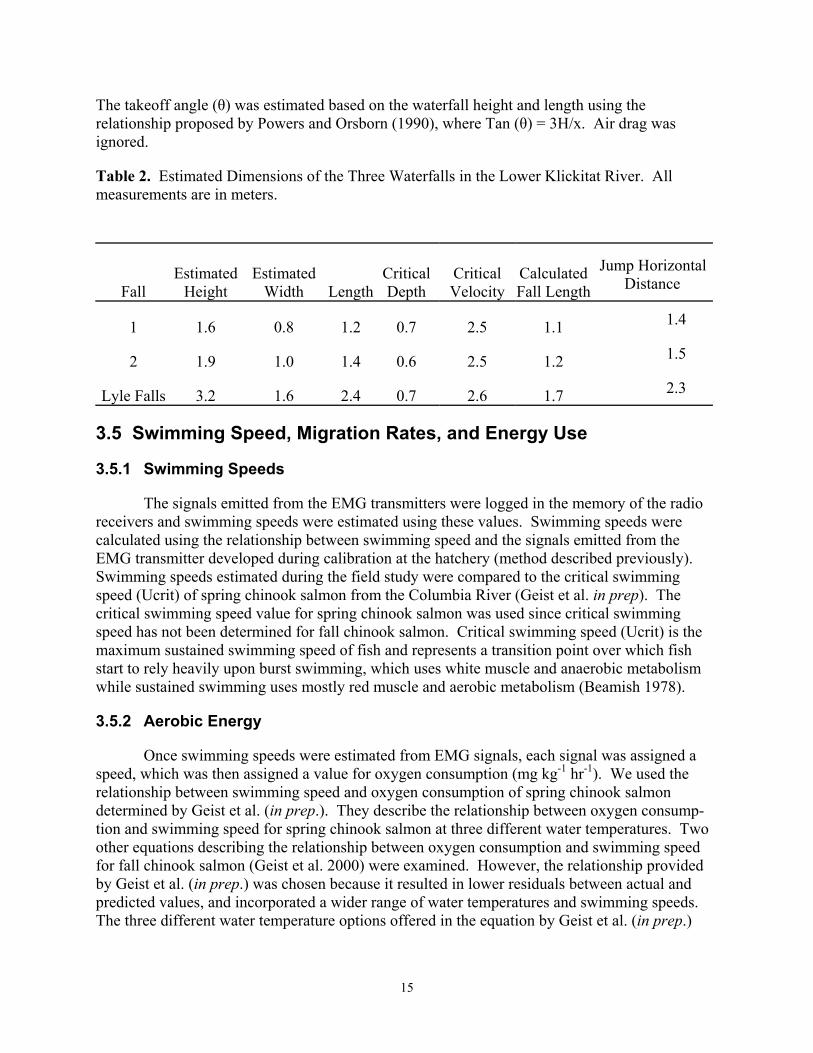
15
The takeoff angle (θ) was estimated based on the waterfall height and length using the relationship proposed by Powers and Orsborn (1990), where Tan (θ) = 3H/x. Air drag was ignored.
Table 2. Estimated Dimensions of the Three Waterfalls in the Lower Klickitat River. All measurements are in meters.
Fall Estimated
Height Estimated
Width LengthCritical Depth
Critical Velocity
Calculated Fall Length
Jump Horizontal Distance
1 1.6 0.8 1.2 0.7 2.5 1.1 1.4
2 1.9 1.0 1.4 0.6 2.5 1.2 1.5
Lyle Falls 3.2 1.6 2.4 0.7 2.6 1.7 2.3
3.5 Swimming Speed, Migration Rates, and Energy Use
3.5.1 Swimming Speeds
The signals emitted from the EMG transmitters were logged in the memory of the radio receivers and swimming speeds were estimated using these values. Swimming speeds were calculated using the relationship between swimming speed and the signals emitted from the EMG transmitter developed during calibration at the hatchery (method described previously). Swimming speeds estimated during the field study were compared to the critical swimming speed (Ucrit) of spring chinook salmon from the Columbia River (Geist et al. in prep). The critical swimming speed value for spring chinook salmon was used since critical swimming speed has not been determined for fall chinook salmon. Critical swimming speed (Ucrit) is the maximum sustained swimming speed of fish and represents a transition point over which fish start to rely heavily upon burst swimming, which uses white muscle and anaerobic metabolism while sustained swimming uses mostly red muscle and aerobic metabolism (Beamish 1978).
3.5.2 Aerobic Energy
Once swimming speeds were estimated from EMG signals, each signal was assigned a speed, which was then assigned a value for oxygen consumption (mg kg-1 hr-1). We used the relationship between swimming speed and oxygen consumption of spring chinook salmon determined by Geist et al. (in prep.). They describe the relationship between oxygen consump-tion and swimming speed for spring chinook salmon at three different water temperatures. Two other equations describing the relationship between oxygen consumption and swimming speed for fall chinook salmon (Geist et al. 2000) were examined. However, the relationship provided by Geist et al. (in prep.) was chosen because it resulted in lower residuals between actual and predicted values, and incorporated a wider range of water temperatures and swimming speeds. The three different water temperature options offered in the equation by Geist et al. (in prep.)

16
enabled us to better match the water temperatures experienced by the salmon in the Klickitat River which varied during the study period (Figure 3).
Oxygen units (mg kg-1 hr-1) were converted to energy units using the oxycalorific average of 3.25 cal mg O2 –1 (Brafield and Solomon 1972). The product was a value of kcal h-1 for aerobic metabolism. The energetic costs stated in this report are for metabolism related to locomotor activity only.
3.5.3 Anaerobic Energy
During this study, EMG transmitters were only used to monitor the activity of the red muscle of fall chinook salmon. These muscles are fueled by aerobic, not anaerobic, pathways (Brett 1995). Anaerobic energy was estimated using the results of Burgetz et al. (1998). They found that, at different percentages of their Ucrit, rainbow trout obtained different amounts of energy through anaerobic pathways producing varying levels of lactate. They then applied a calorific equivalent to allow anaerobic energy use to be estimated. Since the amount of lactate produced (representing anaerobic energy) by fish varied with swimming speed, and oxygen consumption also varies with swimming speed, Burgetz et al. (1998) expressed the anaerobic metabolism as a percentage of the rate of oxygen consumption at a given speed, or an anaerobic tax. As the swimming speed increased from 70% to 100% of the Ucrit, the anaerobic tax increased (65% at 70% Ucrit; 69.2% at 80% Ucrit; and 205.0% at 100% Ucrit). Thus, when a fish is swimming at 100% Ucrit, the anaerobic costs of swimming are more than double the aerobic costs.
We took the three anaerobic tax values of Burgetz et al. (1998) and applied them to all EMG signals that were equal to or over 70% Ucrit (using simple linear regression). Ucrit values were not available for fall chinook salmon; therefore, we based Ucrit values on those reported for spring chinook salmon from the Columbia River (Geist et al. in prep). We see no reason to think the Ucrits of fall chinook salmon would be drastically different from spring chinook salmon since the Ucrits of spring chinook salmon are similar to other Pacific salmon (Brett and Glass 1973). Values over 100% Ucrit received the same tax as those at 100% Ucrit. This tax was applied to the calorific values determined for aerobic energy to provide calorific values for anaerobic energy (in kcal).
3.5.4 Calculation of Energy Use Rates and Total Energy Use in Specific Areas
Energy use of fall chinook salmon was examined in several different sections of the lower Klickitat River. Within each section, the mean energy use by each individual fish was determined. Then, to identify a representative rate of energy use for that section, the median of the energy use rate for each individual logged in each section was determined. The energy use rate within specific areas for each fish was multiplied by the amount of time that each fish spent in that area to determine total energy use in specific river reaches.

17
3.6 Calculation of Migration Rates and Energy Use Upstream of Lyle Falls
Migration rates were calculated for fish released upstream of Lyle Falls. These rates were compared among the two groups of fish (coded or EMG transmitters). The distance that fish moved between subsequent locations was calculated. This was converted to a kilometer-per-day value for each pair of locations (km day-1 from the third location to the fourth location, for example). The mean of all of these movement rates for each individual fish was determined until it reached a general spawning area. Similar to Burger et al. (1985), we considered two or more locations without upstream movement in an area with a radius of approximately 1.6 km to be a general spawning area. The mean of each of these individual mean movement rates was determined and represents the mean movement rate for all fish tagged with a certain type of transmitter.
Fish may spawn throughout the Klickitat River upstream of Lyle Falls (personal communication with Bill Sharp, Yakama Nation, 2001); however, spawning is more likely in certain areas. The area within the Klickitat River upstream of its confluence with the Little Klickitat River was considered to have a higher likelihood of spawning than the area downstream of its confluence with the Little Klickitat River so migration rates were only calculated for fish that migrated upstream of the confluence with the Little Klickitat River.
Energy costs to migrate up the Klickitat River to spawning areas were calculated on a temporal scale (per day). The energy used on a temporal scale (per day) can be used to determine the energetic costs of the migration by multiplying the rate (kcal day-1) by the number of days it took fish to reach spawning areas (as defined above).
Energy used by five actively migrating fall chinook salmon on 12 different days was used to calculate energy used per day. This rate was extrapolated to estimate the energetic costs of migrating to spawning areas. The rate of energy used per day was multiplied by the estimated number of days it took a fish to travel the distance from Lyle Falls to spawning areas.
3.7 Relating Passage Success to Physical Features of Fish
The success of waterfall passage was related to several physical parameters of the migrating fall chinook salmon: length, sex, and condition factor. The condition factor of fish was determined using methods similar to Boivin and Power (1990). Fish weight (in kg) was multiplied by 100 and then divided by the fork length (in cm) cubed. The sex of the fish was determined either by inspecting gonad development during surgery (when fish were given EMG tags) or by external characteristics (for fish given coded tags).
3.8 Statistics
To determine if there were differences in swimming speed among areas in the lower Klickitat River, the normality of the data was examined and differences in variance were examined using an F-test. If data were normal and variances did not differ significantly (P>0.05)

18
then data were analyzed using an Analysis of Variance; otherwise, data were analyzed using a Kruskal-Wallis test.
To determine if there were differences in the time from release until reaching Falls 1 between groups of fish tagged with coded or EMG transmitters, normality of data was examined and differences in variance were examined using an F-test. If data were normal and variances did not differ significantly (P>0.05) then data were analyzed using a t-test; otherwise, data were analyzed using a Mann-Whitney U-test. The same methods were used to determine differences between migration rates and the highest upstream destination of fish upstream of Lyle Falls for fish implanted with coded or EMG transmitters.
Throughout the results, means will be provided when data are normally distributed, and medians will be presented when data are not normally distributed.

19
4.0 Results
This chapter provides the results of our field study, grouped under the study’s three main objectives 1) to determine fish behavior in difficult passage areas in the vicinity of Lyle Falls, 2) to improve our understanding of salmon migration in the Klickitat River above Lyle Falls, and 3) to determine activity levels (swim speed and energy use) for salmon moving toward spawning areas above Lyle Falls.
4.1 Objective 1. Evaluate Difficult Passage Conditions in Vicinity of Lyle Falls
This section provides results of our tracking of the EMG tagged fish and includes determinations of migration rates and passage success, swimming speeds, energy use, and factors potentially affecting passage success and activity.
4.1.1 General Distribution
Of the 35 fall chinook salmon tagged with EMG transmitters and released near the mouth of the river (rkm 1.8; Figure 1), at least two were caught in gill nets in the Columbia River near its confluence with the Klickitat River. One fish was caught by an angler just as it reached the reception range of the antenna arrays. Six additional fish (17% of releases) were never located in the Klickitat River. Data from one other fish could not be used since its frequency overlapped with those of fish carrying coded transmitters in the same area and it would occasionally pick up interference. Thus, useful EMG data were collected from 25 (71.4%) of the 35 fish released. Of these 25 fish, signals from all but one were picked up in the fixed antenna arrays (which received signals from rkm 2.4 to 5.8; Figure 1); the other was only logged by manual trackers in the lower river (downstream of rkm 2.4).
4.1.2 Migration Rates and Passage Success
Twenty-one (84%) of the 25 fish moved upstream to Falls 1 (Table 3). Ten fish (40%) passed Falls 1, nine fish (36%) made it to Falls 2, and six fish (24%) passed Falls 2. Five fish (20%) made it to Lyle Falls but none of the fish passed Lyle Falls or went through the Lyle Falls fishway.
It took a mean of 106.6 h (median 72.1; range 15.4 to 329.2; N=19) for a fall chinook to travel the 1.86 km (0.017 km h-1) from its release point to Falls 1 (rkm 3.7). Accurate travel times to Falls 1 could not be calculated for two of the fish. The travel time was longer (mean 137.1 h; median 117.0; range 19.7 to 406.6; N=9) but the migration rate was similar (0.017 km h-
1) for fish to travel the 2.27 km from the release point to Falls 2 (rkm 4.1). However, five fish that made it to Lyle Falls made much more direct migrations (0.031 km h-1) than the average fish traveling to the other two waterfalls; the mean time for a fish to travel the 2.36 km from the release point to Lyle Falls (rkm 4.2) was only 75 h (median 72.7; range 21.3 to 141.6; N=5).

20
4.1.3 Swimming Speed and Energy Use
The median swimming speeds of the fish varied among study reaches of the lower Klickitat River (Table 3). In general, swimming speeds were higher at waterfalls than in reaches below or between waterfalls (Table 3; Figure 4). The highest swimming speeds were observed at Falls 2, followed by Falls 1, and Lyle Falls (Table 3; Figure 4). However, there was no significant (P>0.05) difference in swimming speeds among waterfalls. There was also no significant (P>0.05) difference in swimming speeds among non-waterfall areas. Swimming speeds at Lyle Falls were significantly higher (P<0.05) than the area between Falls 1 and Falls 2, but did not differ from other non-waterfall areas. Swimming speeds at Falls 1 and Falls 2 were significantly (P<0.05) higher than all non-waterfall areas. Most individual fish that made it to Lyle Falls also swam fastest at Falls 2 (Figure 5).
Table 3. Median Swimming Speeds of 25 Adult Fall Chinook Salmon in Seven Areas of the Lower 4.2 km of the Klickitat River, Sept. – Nov. 2001.
Swimming Speed
Area N cm s-1 bl s-1 Below arrays 5 78.3 0.9 Below Falls 1 24 69.7 0.9 Falls 1 21 115.2 1.5 Falls 1 – Falls 2 10 52.6 0.7 Falls 2 9 158.1 2.2 Falls 2 - Lyle Falls 6 64.6 0.8 Lyle Falls 5 90.2 1.2 All fish that passed Falls1
below Falls 1 10 65.7 0.9
All fish that passed Falls 2 Falls 1 – Falls 2 6 47.0 0.6

21
Figure 4. Median Swimming Speeds in Seven Different Sections of the Lower Klickitat River, Sept. – Nov. 2001. The critical swimming speed (Ucrit) of spring chinook salmon is shown on lower panel. Boxes indicate the 25th and 75th percentile of data, while the line inside the box indicates the median of the data. Whiskers indicate the 95% confidence intervals for the data, and outliers are also shown.

22
Figure 5. The Swimming Speeds of Five Different (identified by transmitter frequency) Fall Chinook Salmon in Six Different Sections of the Lower Klickitat River, Sept. – Nov. 2001. All of these fish reached Lyle Falls. Boxes indicate the 25th and 75th percentile of data, while the line inside the box indicates the median of the data. Whiskers indicate the 95% confidence intervals for the data; outliers are also shown.

23
The above comparisons are confounded by the fact that the swimming speeds at Falls 1 and 2 include fish that successfully passed the falls, whereas none of the fish successfully passed Lyle Falls. Further, several fish attempting to pass Lyle Falls were observed to spend a long period in the churning water at the base of Lyle Falls, and although these signals were logged by the receiver, observers determined the fish were not always trying to pass the falls. For example, two of the five fish that made it to the base of Lyle Falls spent over 200 minutes in the vicinity of the falls, while the remaining three fish spent less than 3 minutes being logged by the receiver monitoring this waterfall. For comparison, the six fish that passed Falls 2 were logged a median of 1.5 minutes on the receiver monitoring that waterfall. These two fish (at Lyle Falls) affect the median swimming speed of fish at Lyle Falls; if they are removed from the analysis, the median swimming speed during attempted passage of Lyle Falls increases from 90 cm s-1 to 157 cm s-1. This speed is similar to the swim speeds observed at Falls 2 (median 158.1 cm s-1; Table 3).
The swimming speed of fish attempting to pass waterfalls varied depending on the success of the passage (Table 4; Figure 6). The swimming speeds for successful passages were similar between waterfalls (medians of 174 cm s-1 for Falls 1 and 189 cm s-1 for Falls 2; Table 4). The mean swimming speeds for unsuccessful attempts were lower (153 cm s-1 for Falls 1, 136 cm s-1 for Falls 2, and 109 cm s-1 at Lyle Falls; Table 4). Around 75% of the time spent by fish successfully passing Falls 1 and Falls 2, swimming speeds were over the critical swimming speed of chinook salmon, indicating these fish relied heavily on burst swimming to pass each of these falls (Figure 6). Conversely, about 75% of the time spent during unsuccessful attempts, swimming speeds were below the critical swimming speed.
Fish passing waterfalls typically started an attempt while swimming at speeds near 100 cm s-1 and quickly attained maximum speeds over 200 cm s-1 (Figure 7). Attempts lasted a mean of 23 s at Falls 1 and 18 s at Falls 2 (Table 4; Figure 8); there was no significant (P>0.05) difference in the time to pass these two falls.
The amount of time fish spent attempting to pass waterfalls varied depending on passage success and waterfall characteristics. At Falls 2, fish that successfully passed the waterfall did not spend a significantly different (P>0.05) amount of time (mean 1.7 min.) making attempts than those that were unsuccessful (mean 2.7 min.). However, fish that successfully passed Falls 1 spent significantly (P<0.05) more time (mean 26.5 min.) making attempts than those that did not pass Falls 1 (5 min.). Nine of the 10 fish that passed Falls 1 spent over 6 min. being logged by the receiver monitoring this waterfall. However, this longer period of time spent at the waterfall by successful fish was at least in some cases due to the specific geology of Falls 1. This waterfall had a boulder in the middle of the stream at the upper end of the waterfall. A fish that passed this fall was observed holding near the upstream end of this boulder after it had ascended the waterfall.
The amount of time spent in waterfall areas was much lower than the amount of time spent between or below waterfalls (Table 5). The highest mean amount of time (a median of 83.2 h) spent in the lower Klickitat River was between the lower end of the antenna arrays and Falls 1. The combination of the amount of time between Falls 1 and Falls 2 (median 33.5 h) and Falls 2 and Lyle Falls (median 19.3 h) was lower than the amount of time spent below Falls 1. The amount of time fish spent passing or attempting to pass waterfalls was in comparison very low (median 0.02 to 0.1 h or 1.2 to 6 min).

24
Figure 6. Swimming Speeds of Adult Fall Chinook Salmon for Passage Attempts at Three Waterfalls in the Lower Klickitat River, Sept. – Nov. 2001. The critical swimming speed for spring chinook salmon is also shown. Boxes indicate the 25th and 75th percentile of data, while the line inside the box indicates the median of the data. Whiskers indicate the 95% confidence intervals for the data, and outliers are also shown.

25
Table 4. The Mean and Mean of Maximum Swimming Speeds for Adult Fall Chinook Salmon Successful (S) and Unsuccessful (U) Attempts to Pass Three Waterfalls on the Klickitat River, Sept. – Nov. 2001. Passage length is the average length of time (+ SE) fish were logged while attempting to pass each waterfall. N is the number of fish recorded at each falls. Theoretical estimates of takeoff velocity necessary to leap a free overfall were calculated using the methods in Powers and Orsborn (1990).
Swimming Speed (cm s-1) Passage Estimated Take Off Area Passage Type Mean Mean Max. N Length (s) Velocity Needed
All falls S 181 237 14 21 combined U 143 290 33 n/a
Falls 1 S 174 241 8 23 538.4 U 153 277 21 n/a
Falls 2 S 189 231 6 18 597.8 U 136 259 7 n/a
Lyle Falls S N/A N/A N/A n/a 811.0 U 109 251 5 n/a
Figure 7. Swimming Speeds of One Adult Fall Chinook Salmon as it Passes Falls 2. Heavy line indicates time actually passing over waterfall (23 seconds).

26
Figure 8. An Example of the Swimming Speeds of One Adult Fall Chinook Salmon as it Passes Falls 1 and Falls 2 in the Lower Klickitat River
Swimming speeds equaled or exceeded the maximum sustained speed (Ucrit) of chinook salmon while they were attempting to pass the waterfalls (Figure 6), but the percentage of time that this occurred was relatively short when viewed over the entire passage through the lower river (Table 5). Similarly, few EMG signals were recorded above the calibration range when fish were in non-waterfall areas (Table 6). However, the median percentage of signals that were above the calibration range varied from 10.0 to 44.6% when fish were attempting to pass waterfalls.
4.1.4 Energy Use
Both the rates of energy use (Figure 9; Table 5 and 7) and the total amount of energy used (Figure 10; Table 5) by fall chinook salmon differed greatly among the seven sections of the lower Klickitat River. The median rates of both aerobic and anaerobic energy use were consistently higher at waterfalls than in other areas (Table 5 and 7). The highest rate of both aerobic and anaerobic energy use for fish was observed at Falls 2, although the highest rate of energy used by an individual fish was observed at Falls 1. This fish, which appears as an outlier in Figure 9, was the largest fish tagged in this study.

27
Table 5. Median Time Present and Energy Use of All Adult Fall Chinook Salmon in Seven Areas of the Lower 4.2 km of the Klickitat River, Sept. – Nov. 2001. Since fish that do not pass waterfalls spend more time (and thus use more energy) below them than fish that pass, swimming speed and energy use are also shown for fish that successfully passed Falls 1 and Falls 2 for the areas below Falls 1 and below Falls 2. These values are more appropriate for modeling the energy needed to successfully pass through the lower Klickitat River.
Aerobic Anaerobic Total
Area N Time (h) kcal/hr kcal kcal/hr kcal kcal
Below arrays 5 15.2 5.3 42.6 2.3 16.3 54.9
below Falls 1 24 83.2 4.4 315.9 2.0 116.7 384.6
Falls 1 21 0.1 6.8 0.6 5.8 0.6 1.0
Falls 1 –Falls 2 10 33.5 3.4 92.4 0.9 31.4 128.2
Falls 2 9 0.02 7.4 0.1 12.0 0.2 0.3
Falls 2 - Lyle Falls 6 19.3 3.3 67.3 1.3 33.3 100.7
Lyle Falls 5 0.04 5.4 0.2 4.0 0.2 0.4
sum 519.1 198.7 670.1
For all fish that passed Falls1
below Falls 1 10 43.8 3.76 164.7 1.43 62.6 227.3
For all fish that passed Falls 2
Falls 1 –Falls 2 6 23.4 2.9 67.9 0.9 20.6 88.5

28
Table 6. The Median Percentage of EMG Signals Collected from Adult Fall Chinook Salmon in the Lower Klickitat (Sept. – Nov. 2001) that Were over 70%, 80% and 100% of the Critical Swimming Speed (2.06 Bl s-1) in Seven Different Areas. The percentage of EMG signals above the highest swimming speed at which fish were calibrated is also shown.
Percentage of Swimming Speeds
Location > 70% Ucrit > 80% Ucrit > 100% Ucrit > Highest Calibration SpeedBelow arrays 18.5 11.2 4.9 0.7 Below Falls 1 15.2 9.9 4.3 2.5
Falls 1 55.0 35.1 22.6 19.4 Falls 1 - Falls 2 7.9 5.0 1.7 1.7
Falls 2 75.9 72.7 58.9 44.6 Falls 2 - Lyle Falls 13.8 8.3 2.2 0.6
Lyle Falls 37.4 25.5 14.0 10.0
Table 7. Estimated Energy Use Rates of Adult Fall Chinook Salmon in Seven Areas in the Klickitat River below and above Lyle Falls, Sept. – Nov. 2001. For comparison, energy use rates are provided that were determined from proximate analysis studies (Brett 1995). The percentages of time that fish are estimated to use aerobic metabolism and anaerobic metabolism are also presented.
Aerobic Anaerobic Total kcal kg-1d-1 kcal kg-1d-1 kcal kg-1d-1 % aerobic % anaerobicBelow arrays 17.1 16.0 33.1 52 48 below Falls 1 17.1 7.8 24.1 69 31 Falls 1 28.9 27.8 54.6 51 49 Falls 1 - Falls 2 13.9 4.0 17.7 78 22 Falls 2 37.9 62.6 100.5 38 62 Falls 2 - Lyle Falls 16.5 6.6 22.8 71 29 Lyle Falls 23.2 19.6 42.9 54 46 Above Lyle Falls 19.0 9.8 28.8 66 34 Other species chinook (Greene 1926) 33 chum (Pentegoff et al. 1928) 27 pink (Williams et al. 1986) 22 sockeye (Newman & Collins 1967) 27 sockeye (Gilhousen 1980) 21 - 34 sockeye (Idler & Clemens 1959) 44

29
Figure 9. Rates of Aerobic and Anaerobic Energy Use (kcal h-1) by Adult Fall Chinook Salmon in Seven Different Areas of the Lower Klickitat River, Sept. – Nov. 2001. The outlier at Falls 1 is the largest fish tagged with an EMG transmitter. Boxes indicate the 25th and 75th percentile of data, while the line inside the box indicates the median of the data. Whiskers indicate the 95% confidence intervals for the data, and outliers are also shown.

30
Figure 10. Aerobic and Anaerobic Energy Used by Adult Fall Chinook Salmon in Seven Different Areas of the Lower Klickitat River, Sept. – Nov. 2001. Boxes indicate the 25th and 75th percentile of data, while the line inside the box indicates the median of the data. Whiskers indicate the 95% confidence intervals for the data, and outliers are also shown.

31
Although energy use rates were high at waterfalls, the total amount of energy used at these locations was relatively small (Table 5; Figure 10). This was because the fish spent a relatively small amount of time actually jumping at waterfalls (Table 5). The highest amount of energy used was below Falls 1, followed by the stretch between the Falls 1 and Falls 2, then between Falls 2 and Lyle Falls (Figure 10; Table 5). However, since many fish were not capable of passing all of the waterfalls, they spent more time, and thus more energy below these falls than fish that successfully passed. Thus, the energy use figures shown in Figure 10 and Table 5 for the time below Falls 1 and Falls 2 may be inflated when considering the amount used by fish that successfully pass these falls. The fish that successfully passed Falls 1 used only 53% of the time and 59% as much energy as was recorded for all fish in the area (Table 5). The fish that successfully passed Falls 2 used only 70% of the time and 69% of the energy between Falls 1 and Falls 2 as was recorded for all fish in that area.
A comparison was made of the maximum swimming speeds of fish passing waterfalls estimated using EMG telemetry and using the model of Powers and Orsborn (1990). The speeds estimated to be needed for successful passage of Falls 1 and Falls 2 using the model of Powers and Orsborn (1990) were consistently higher (2.2 – 2.6 times higher) than those estimated using EMG telemetry (Table 4). The speeds estimated for successful passage of Lyle Falls using Powers and Orsborn (1990) were 3.2 times higher than those estimated using EMG telemetry for fish unsuccessfully attempting to pass Lyle Falls (Table 4).
4.1.5 Factors Potentially Affecting Passage Success and Activity
The tagging method (surgery vs. non-surgery) did not influence the migration rates of fish downstream of Lyle Falls. There was no significant difference (P>0.05) between the amount of time that it took fish with coded transmitters (mean 110 hours (SE 12.3); median 95 hours; N=6) and those with EMG transmitters (mean 95 h (SE 18.9); median 71 h; N=20) to migrate the 1.86 km from their release site to Falls 1.
Swimming activity varied by period of day (Table 8). In all areas except Falls 1 and Lyle Falls, fish were more active during the day than during the night or twilight. In areas below and between waterfalls, fish were always less active at night than during the day. There was no trend among areas in differences between evening twilight and morning twilight.
Although average swimming speeds were not always highest at waterfalls during the day, all but one successful passage of waterfalls (N=14) occurred during the day. One fish successfully passed Falls 1 during the evening twilight. However, the average swimming speed for those fish attempting to pass Falls 1 at night was much higher than the average swimming speed at Falls 1 during the day (Table 8). At Falls 2 the highest average swimming speed occurred during the day, while at Lyle Falls, the highest average swimming speed occurred in the evening twilight.
There did not appear to be any relationship between fish length and successful passage of difficult areas in the lower Klickitat River (Table 9). The mean fork length of fish that made it successfully past two sets of waterfalls (74.3 cm) did not differ from those which made it to Falls 1 but did not pass (78.4 cm FL).

32
Table 8. The Average Swimming Speeds (cm s-1) of Adult Fall Chinook Salmon during Different Diel Periods in Seven Different Areas of the Lower Klickitat River, Sept. – Nov. 2001
Area All Time Periods Day
Morning Twilight Evening Twilight Night
Below arrays 78.3 74.8 63.8 67.0 59.0
Below Falls 1 69.7 78.4 65.1 75.2 61.9
Falls 1 115.2 111.7 184.6 110.9 179.1
Falls 1 - Falls 2 52.6 60.8 50.9 52.3 44.5
Falls 2 158.1 158.9 122.0 N/A 84.4
Falls 2 - Lyle Falls 64.6 68.5 66.7 60.7 62.3
Lyle Falls 90.2 93.2 40.4 103.7 61.9
Table 9. The Condition Factor, Fork Length (FL), Sex, and Sex Ratio of Adult Fall Chinook Salmon that Were Released, and Migrated Successfully, to Different Areas in the Lower Klickitat River, Sept. – Nov. 2001
Males (N) Females (N) Male : Female Condition FL (cm) All fish tagged 22 13 1.7 1.21 77.9 Never logged 5 2 2.5 1.25 74.0 Made it to Falls 1 13 8 1.6 1.19 78.4 Passed Falls 1 7 3 2.3 1.19 75.7 Made it to Falls 2 7 2 3.5 1.19 76.1 Passed Falls 2 6 0 1.20 76.1 Made it to Lyle Falls 5 0 1.19 74.3 Males tagged 22 1.21 74.9 Females tagged 13 1.20 83.1
There did not appear to be any relationship between condition factor and successful passage of difficult areas in the lower Klickitat River (Table 9). The mean condition factor of fish that made it successfully past two sets of waterfalls (1.19) did not differ from those that made it to Falls 1 but did not pass (1.19). Fish that were never located after release actually had a higher average condition factor (1.3) than those that were detected at Lyle Falls (1.19).

33
Female fall chinook salmon appeared to have more difficulty passing waterfalls than males (Table 9). The male to female sex ratio of fish released was 1.7:1 which was very similar to that of the fish which approached Falls 1 (1.6:1). However, the ratio of males to females continuously increased for fish which made it over Falls 1 (2.3:1) and up to Falls 2 (3.5:1). Only males passed Falls 2 and made it to Lyle Falls.
4.2 Objective 2. Improve Our Understanding of Fall Chinook Salmon Distribution and Migration Rates within the Klickitat River Basin
4.2.1 General Distribution Upstream of Lyle Falls
Of the six adult fall chinook salmon that were implanted with EMG transmitters and released at rkm 9.25, five (83%) moved upstream of the Little Klickitat River (rkm 31.9) into areas where spawning is likely to occur. The other fish did not move upstream of rkm 21. Of the 15 fall chinook salmon that were implanted with coded transmitters and released at the same location - rkm 9.25, two (13%) moved downstream over Lyle Falls (one 2 days after its release and the other 3 days after its release), seven (47%) moved upstream of the Little Klickitat River, and six (40%) were not located upstream of the Little Klickitat River (their highest location ranged from rkm 9.35 to rkm 24.35; mean rkm 15.37).
Upstream destinations of both tag groups were similar (Figure 11) and there was no apparent effect of surgery on the upstream migration of fish given an EMG tag. The mean maximum upstream location of fish given a gastric implant (i.e., coded transmitter) and released upstream of Lyle Falls was found to be at rkm 38 (range rkm 32 to 50), which was not significantly different (P>0.05) from fish given an EMG tag (mean river km 47; range rkm 38 to 68). The combined mean maximum upstream location of fish given a coded or an EMG tag was rkm 41.8 (37.6 km upstream of Lyle Falls).
4.2.2 Migration Rates
Similar to the maximum upstream destination, there was no significant difference (P>0.05) between the upstream migration rates of fish implanted with EMG and those with coded transmitters. The mean upstream migration rate of fish implanted with coded transmitters was 2.05 km d-1 (SE = 0.35; N=7; range 0.84 to 3.16 km d-1). This compared well to the upstream migration rates for fall chinook salmon implanted with EMG tags destined for spawning areas; their mean upstream migration rate was 2.79 km d-1 (SE = 0.29; N=5; range 2.18 to 3.82 km d-1). The overall mean movement rate of fish given a coded or EMG tag was 2.36 km d-1. Given this movement rate, it would take the average fall chinook salmon 15.93 days to travel the 37.6 km from Lyle Falls (rkm 4.2) to the mean maximum upstream location (i.e., spawning area) of tagged fish (rkm 41.8).

34
Figure 11. Map of the Klickitat River Basin Indicating the Highest Upstream Locations of Radio-Tagged Adult Fall Chinook Salmon (solid circles), Sept. – Nov. 2001. These locations are for fish tagged with an EMG or coded transmitter. Waterfalls, other landmarks, and release points of fish are also shown.

35
4.3 Objective 3. Estimate Activity Levels of Fall Chinook Salmon Migrating Upstream through the Free-Flowing River to Reach Spawning Areas
Swimming speeds of fall chinook salmon in the Klickitat River upstream of Lyle Falls were estimated for a total of 12 days using five different fall chinook salmon carrying EMG tags. These fish were monitored during the day while moving upstream. The mean swimming speed during these days was 88 cm s-1 (SD = 14; median 91 cm s-1; Table 10). The weight of the five individuals is also shown. Energy used to migrate to spawning areas is calculated using the number of days it took each individual to migrate from its release point (rkm 9.25) to its spawning area. Adjusted energy use uses the mean amount of time it would take a fish to migrate from Lyle Falls (rkm 4.2) to the average spawning area for the average of all fish tracked (coded and EMG tagged fish combined).
The energetic costs to migrate up the Klickitat River to spawning areas were quantified on a temporal scale (per day). The energy used per day can be used to determine the energetic costs of the migration by multiplying it by the number of days it would take an individual to migrate to its spawning area. Also, the daily energy use rate can be applied to the values obtained from all radio-tagged fish to determine the mean energy use for a fish to swim to the mean highest upstream destination fish attained.
Table 10. Swimming Speeds, Energy Use Rates (aerobic (A) anaerobic (AN) and total (TOT = aerobic and anaerobic combined), and Energy Used by Fall Chinook Salmon Migrating to Spawning Areas in the Klickitat River Upstream of Lyle Falls, Oct. – Nov.2001.
Swimming Speed
Energy Use Rate (kcal kg-1 d-1)
Fish
Time Logged
(h) (cm s-1) (Bl s-1) A AN TOT
Fish Weight
(kg)
Time to Spawning
Area (days)
Energy to Spawning
Area (kcal)
Adjusted Energy Use
(kcal)
1 8.7 99.2 1.1 20.9 14.2 35.2 8.26 N/A N/A 4627 2 6.9 90.5 1.3 25.7 26.0 51.7 4.4 10 2274 3623 3 8.6 101.4 1.1 19.7 5.6 25.2 9.6 13 3137 3844 4 2.5 85.0 0.8 15.2 1.5 16.7 10.8 17 3071 2878 5 4.5 65.5 0.7 13.7 1.7 15.3 10.2 10 1563 2489
Mean 6.2 88.3 1.0 19.0 9.8 28.8 8.6 12.5 2511 3971
The energy used by actively migrating fall chinook salmon on 12 different days was used to calculate energy used per day. It was estimated that individual upstream migrating fall chinook salmon used a mean of 28.8 kcal kg-1 d-1 (19 kcal kg-1 d-1 through aerobic pathways and 9.8 kcal kg-1 d-1 through anaerobic pathways) while migrating upstream to spawning areas.

36
The energy use rate for each individual (which ranged from 15.3 to 35.2 kcal kg-1 day-1) was multiplied by the estimated number of days it took each individual to travel from its release point (rkm 9.25l; 5.05 km upstream of Lyle Falls) to its spawning location. One fish did not move into a likely spawning area so it is excluded from this calculation. The mean amount of energy used by four individuals was 2,511 kcal (range 1,563 – 3,137; Table 10). However, these fish were released 5.05 km upstream of Lyle Falls and likely underestimate the costs of migrating to spawning areas from Lyle Falls. To resolve this, the energy use rate for all six individuals was multiplied by the estimated number of days it should take a fall chinook salmon to travel the 37.6 km from Lyle Falls to the mean spawning location at the mean estimated movement rate of 2.36 km day-1 (15.93 days; from above). This is reported as adjusted energy use in Table 10. Thus, fall chinook salmon migrating from Lyle Falls to spawning areas above the Little Klickitat River were estimated to incur an energetic cost of approximately 3,971 kcal (range 2,489 – 4,627); most of this energy was provided through aerobic processes (66%).

37
5.0 Discussion
5.1 Migration Rates and Passage Success
The three waterfalls examined are at least partial barriers to the passage of migrating fall chinook salmon; nearly half of our fish did not complete passage past Falls 1, suggesting the impacts could be substantial. In fact, none of the fish passed Lyle Falls or used the Lyle Falls fishway. These results illustrate that there are significant barriers to fish passage in the lower Klickitat River, and at the flows present during this study, the Lyle Falls fishway did not appear to improve passage conditions for adult fall chinook salmon.
Unfortunately, because none of the fish entered the Lyle Falls fishway, behavior could not be examined as fish passed through the fishway. The specific reasons fish did not use the fishway are not known. Our assumption at the onset of this study was that once fish reached the fishway entrance, they would enter the fishway where our receiving system would have provided data on the fine-scale fish behavior as the fish ascended each step. Had this occurred, the multiple antenna arrays combined with EMG data would have been invaluable in assessing passage conditions inside the fishway. As it turned out, it appears that examining swimming behavior measured on a finer scale at the fishway entrance would have perhaps assisted us in determining why they did not successfully enter the fishway.
Future studies should incorporate finer-scale antenna arrays to determine if fish attempt to pass the falls or instead enter the fishway. These behaviors could be used to monitor fishway operations (e.g., increased attraction flow) or to evaluate performance. This type of monitoring and analysis would be a valuable complement to any post-construction analysis of improvements to, or replacement of, the Lyle Falls fishway.
Unfortunately, our study protocol may have biased our results. All of the fish were captured while trying to pass Lyle Falls, tagged, and then returned downstream where they were released. Thus, the fish tracked during this study likely had lower energy reserves and were more mature than fish that were approaching the lower river for the first time. This factor should be weighed when interpreting the results. Several researchers have found that, as the migration progresses, the swimming ability of fish decreases (Paulik and DeLacey 1958; Williams and Brett 1987). Thus the success of passage seen in this study may be lower than actual passage success. Another factor to consider is that, in general as a stock, fall chinook salmon are not as conducive to handling as fish which migrate in the spring.
Using fish without a previous passage history, a cost benefits analysis could be done to determine what benefit would result in additional fishways at Falls 1 or Falls 2. The study results suggest that fishway improvements at Lyle Falls are needed, and perhaps at other locations. For example, there was 66% passage success at Falls 2, only 48% at Falls 1, and the swimming speeds of fish that successfully passed Falls 2 were the highest observed. Thus, less-than-100% passage success and high swim speeds suggest fishway improvements at Falls 2 may be worth reviewing.

38
5.2 Swimming Speeds and Energy Use
The swimming speeds of fall chinook salmon in non-waterfall areas of the lower river (52.6 to 78.3 cm·s-1; 0.7 – 0.9 Bl s-1) were near the optimal cruising range for salmon of 1 Bl s-1 (Webb 1995) although low swimming costs typically range over a larger range of speed (50-90 cm s-1). The speeds of fall chinook salmon in non-waterfall areas were similar to those estimated for sockeye salmon migrating in coastal waters (56 to 64 cm·s-1; Brett 1995).
As would be expected, swimming speeds were higher for fish attempting to pass waterfalls than for fish between or below waterfalls. Mean swimming speeds were similar among non-waterfall areas. Burst swimming, as represented by the percent of signals above Ucrit (Table 6), was far more frequent at waterfalls (14.0 to 58.9 %) than between or below waterfalls (1.7 to 4.3%). However, the amount of anaerobic energy used was actually much higher between the falls (31.4 to 116.7 kcal versus 0.2 to 0.6 kcal at the waterfall) due to the length of time needed to travel these sections and possible areas of difficulty encountered in them.
The sampling design used did not allow us to determine at what points within these sections most of the energy was being expended in the reaches between the falls; it is also possible that the salmon used a lot of energy in the fast moving water below the falls in repeated attempts to approach the falls, but we do not have data to support this. If the lower river were to be sampled using more receiving arrays, other areas of difficult passage may be located. However, this would require either a large number of radio receivers or an EMG transmitter compatible with current radio receiving technology that allows more fish to be monitored simultaneously; the latter is in development. Manual trackers could be used to track fish constantly along some rivers, but the Klickitat River runs through a canyon that is not suitable for determining precise locations while manual tracking.
Average swimming speeds did vary among waterfalls. However, most of this variance was due to the unsuccessful attempts to pass the falls. When fish were successful at passing a waterfall (either Falls 1 or Falls 2), there was little difference between the speeds attained while passing.
The percentage of signals that were over the highest calibration speed were much higher at waterfalls than other areas. This makes it problematic to accurately estimate swimming speed from EMG signals. Few if any respirometers are capable of generating water velocities fast enough to calibrate transmitter output at swimming speeds up to 10 m s-1. The motor size necessary to create very high swimming speeds could make the respirometer difficult to transfer to field or near field locations as was done in this study. Also it is difficult to force fish to swim at very high speeds for a period long enough to calibrate a transmitter.
EMG signals collected from fish in the field, which were not within the range of data that describe the relationship between EMG signals and swimming speed, could lead to errors in estimating swim speed. However, several studies have shown that within the range that red muscle is used by fish, the relationship between EMG transmissions and swimming speeds is linear (Geist et al. 2002). Thus extrapolating past the data may, to some extent, provide fairly accurate results. At a certain swimming speed, however, fish recruit most if not all of their red

39
muscle mass and the increase in the relationship between EMG signals and swimming speed plateaus (Geist et al. in prep.). Past this range, white muscle is needed to provide propulsion. EMG transmitters in this study were not used to measure the electromyograms of white muscle (and it would be difficult to calibrate tags implanted in white muscle at high swimming speeds as discussed above). Thus, measurements of swimming speeds at waterfalls could be underestimated.
Using EMG telemetry, others have estimated that mean swimming speeds for adult sockeye salmon range from 0 to 150 cm s-1 (Hinch and Rand 1998) and 0 to 12 Bl s-1 (Hinch and Bratty 2000) in different reaches of the Fraser River in British Columbia. Hinch and Bratty (2000) examined swimming speeds of adult migrating sockeye salmon in a 150-m approach to a 130-m-long fishway, and within the fishway itself. They estimated that fish swam 4.23 Bl s-1 during unsuccessful approaches (lasting an average of 1,742 min.) but only 1.85 Bl s-1 during successful approaches to the fishway (lasting an average of 34.57 min). The average migration speed to pass through the fishway was 11.37 cm s-1 and passage took an average of 19.05 min. Sockeye salmon that successfully entered the fishway never exceeded Ucrit (2.3 Bl s-1; from Brett and Glass 1973) for more than 3 minutes. However, some unsuccessful migrants were estimated to swim at speeds exceeding Ucrit for over 270 min.
Fish passing difficult areas in the Klickitat River spent much lower amounts of time swimming over Ucrit. Attempts to pass waterfalls by fall chinook salmon in the Klickitat River only lasted a mean of 21.4 s at Falls 1 and 18.3 s at Falls 2. Similar to this, Brett (1995) states that jumps or bursts of swimming at falls or obstacles in streams probably do not exceed 20 to 30 seconds. Similarly, Webb (1995) states that burst swimming can be maintained less than about 30 seconds. More research in this area is needed.
The maximum swimming speeds of fish could be limited by the force generated by the musculo-skeletal system, the muscle power output, or the maximum tailbeat frequency and stride length (Bainbridge 1961, Wardle 1975, Johnsrude and Webb 1985). Examination of burst swimming speeds like those used at waterfalls has been largely lacking. Webb (1995) states that there is no standard protocol for determining burst swimming performance and that burst speeds have not been adequately researched. Most measurements of burst swimming have been made on small or juvenile fish (Webb 1995). However, burst swimming abilities vary considerably between juvenile and adult fish.
Also there seem to be large variations among the results of various techniques used to estimate maximum swimming speeds of fish (Johnsrude and Webb 1985, Webb 1995). Wardle (1975) noted that small fish (10 cm) can reach speeds up to 25 Bl s-1 but larger fish (100 cm) seem unable to exceed 4 Bl s-1. Smaller fish are capable of higher tail beat frequencies than larger fish (Bainbridge 1958). Using video of fish swimming Wardle (1975) determined that small salmon reached 10 Bl·s-1 or 2.5 m·s-1 but the highest speed for a 73 cm cod (similar to the length of salmon in this study) was 3.8 Bl s-1. However, Wardle (1975) predicted a 73 cm cod could reach 5.5 m·s-1 (7.5 Bl s-1) at 14°C or 6.6 m s-1 (9 Bl s-1) at 20°C.
There are also multiple views of the methods fish use to leap over high flow obstacles (Webb 1995). Some suggest that fish appear to jump from a standing start rather than building up momentum by swimming toward the surface (Gray 1968). This is suggested because
40
maintaining course at a target would be impossible in highly turbulent, turbid water. However, Webb (1995) points out that a salmon jumping from a standing start with an escape velocity of 2 m s-1 would only jump 20 cm above the water surface. By reaching maximum speed before jumping, a fish would be able to leap a much higher distance.
The data from this study do not suggest fall chinook salmon jumped from a standing start. As can be seen from an example of one fall chinook salmon passing Falls 2 (Figure 7) the fish was swimming at least 100 cm s-1 before it attempted to pass the waterfall, and may have been swimming over 200 cm s-1 when it left the water. Further research would need to be conducted to determine the accurate speeds when fish leave the water surface and during the short period preceding the jump. Using EMG telemetry, swimming speeds can be estimated, but with multiple fish leaping at waterfalls simultaneously, high-speed cameras would be needed to identify the timing of individual fish leaving the water and leaping at the falls. Webb (1995) recommends that it would be profitable to measure the tactics and success of salmon negotiating obstacles with a consideration of the effects of size. Using EMG telemetry, this type of work could be completed in a real-world field setting.
The theoretical estimates of the takeoff speeds necessary to leap the falls in the lower Klickitat River were substantially higher than those estimated using EMG tags (Table 4). This is probably because EMG tags, as mentioned previously, underestimated swim speed because they did not account for white muscle activity. As such, they cannot measure the burst speeds required for leaping. For example, the average maximum velocity measured with the EMG tags for the fish that passed Falls 2 (1.9 m high) was 231 cm s-1. Applying the conservation of energy principle of basic physics reveals that an object would have to take off at 613 cm s-1 to achieve a height of 1.9 m. However, these equations apply to free overfalls and the waterfalls measured on the Klickitat River were not entirely free overfalls since there was no observable flow separation (i.e., the flow remained in contact with the rock beneath).
The theoretical estimate properly reproduces the maximum leaping ability of fish in still water; however, it exceeds the waterfall heights that are considered passable based on observation (Powers and Orsborn 1990). The discrepancy is most likely caused by the fact that fish leaping waterfalls must take off from aerated water, which is less dense and decreases the efficiency of propulsion. Additionally, factors such as fish condition, water temperature, fish stock, and plunge pool depth may affect fish leaping ability (Powers and Orsborn 1990). Therefore, it is probably unrealistic to assume that fish can exit the water at their maximum burst speed in the aerated environment of a plunge pool. Using 75% of maximum burst speed would provide a more reasonable upper limit of waterfall passage capability. This would bring the theoretical estimates closer to the estimates of swimming speed made using EMG telemetry.
Energy use rates and amounts of energy used by fish were highly variable among areas of the lower Klickitat River. Rates of both aerobic and anaerobic energy use were higher at waterfalls than other areas within the antenna arrays. These higher rates of energy use reflect the swimming speeds at waterfalls. The most obvious difference in energy use among areas is the difference in anaerobic energy use. At Falls 2 the rate of anaerobic energy use was over 10 times that of the areas between the waterfalls.

41
Although waterfalls in the lower Klickitat River provide at least partial barriers to passage of fall chinook salmon, the energetic consequences appear to be mainly associated with the energy losses during the delay caused by the blockage instead of energy use while fish are actually leaping at the waterfalls. Fall chinook salmon used a relatively high rate of energy (9.4 to 19.4 kcal hr-1) over only a relatively short period of time (0.04 to 0.1 hours or 2.4 to 6 minutes) while actually leaping at waterfalls. This resulted in an energy expenditure of 0.3 to 1.0 kcal while leaping at waterfalls. Much larger amounts of energy were used during the extended delays in areas below these waterfalls (Table 5). Each day the fall chinook salmon were delayed below these waterfalls, the fish incurred an energetic loss of approximately 103 to 110 kcal (the hourly rate used between Falls 1 and 2, and between Falls 2 and Lyle Falls * 24 hours). Having low-water-velocity resting areas below these points of difficulty likely minimized energy losses to migrating fish. Likewise, structures that provide resting areas close to points of difficult passage (such as tailraces of dams or entrances to fishways) should reduce the total energy required for passage.
Since fall chinook salmon only used burst swimming for periods of approximately 30 seconds at a time (mean of 21.4 s at Falls 1 and 18.3 s at Falls 2), river sections of relatively high velocity flow that do not contain any areas for fish to rest may provide areas as difficult to pass as waterfalls where fish have to make large, difficult leaps. The tailraces of some hydroelectric dams may provide such challenges to passage.
The rates of energy use in some areas of the lower Klickitat River were similar to those obtained by proximate analysis studies in other rivers (reviewed by Brett 1995; Table 7). Our values for energy use include only the cost of locomotion, while those from proximate analysis studies include all metabolic costs. Because females allocate large amounts of energy to developing the gonads during migration and males complete most of their maturation at sea (Brett 1995), our results more accurately reflect the energy use of males instead of females.
The fish migrating through the lower Klickitat (at non-waterfall areas) used between 17.7 and 33.1. kcal kg-1 d-1 for locomotion. This is similar to the river migrating costs of male chum (O. keta; 27.2 kcal kg-1 d-1; Pentegoff et al. 1928), pink (O. gorbuscha; 22.3 kcal kg-1 d-1; Williams et al. 1986), and sockeye salmon (27.3 kcal kg-1 d-1; Newman and Collins 1967; 21 to 34 kcal kg-1 d-1; Gilhousen 1980, Table 7). The values from this study were lower, however, than the values Idler and Clemens (1959) estimated for male sockeye salmon (44.2 kcal kg-1 d-1). The energy used during migration upstream of Lyle Falls (28.8 kcal kg-1 d-1) was higher than the energy use for most of the areas in the lower Klickitat (excluding falls) but is within the range found by other researchers for migrating salmon. However, it should be kept in mind that annual variation in river flow can have an influence on the energetics of riverine migration (Brett 1995).
Brett (1995) interpreted the data of Greene (1926) for migrational energy expenditure of Columbia River chinook salmon and estimated the migrational costs assuming a one month migration. Energetic expenditure was estimated at 33 kcal kg-1 d-1 (Greene 1926). This is slightly higher, but similar to the amount estimated for the energy expended on locomotion by fall chinook salmon in the Klickitat River upstream of Lyle Falls (28.8 kcal kg-1 d-1). The values from Greene (1926) may be expected to be slightly higher since they include data from females, which have higher non-locomotory energetic costs than males during the freshwater phase of migration (as discussed above).

42
The rates of energy use at waterfalls (42.9 to 100.5 kcal kg-1 d-1) were much higher than those in other areas. However, as previously mentioned, the time spent attempting to pass these waterfalls was so short that the amount of energy used was rather small. The concept of energy use at waterfalls is similar to the burst swimming required to either capture or avoid prey. Puckett and Dill (1984, 1985) found that predators and prey used very large amounts of energy during burst swimming. However, they found that this had a small overall energetics effect since the bursts of energy use were very short and intermittent.
Rand and Hinch (1998) used estimated swimming speeds of sockeye salmon obtained from EMG radio telemetry (reported by Hinch and Rand 1998) to estimate the energetic costs of migration. They estimated that the costs of spawning migrations for sockeye salmon varied between approximately 35 and 130 kcal kg-1 d-1 in certain river sections (converted from their estimate of ~5-18 W for fish with a mean weight of 2.88 kg). Difficult areas were on the higher end of this range while other areas ranged from 35 to 72 kcal kg-1 d-1.
These values are somewhat higher than the rates we observed for both difficult areas (at waterfalls; 42.9– 100.5 kcal kg-1 d-1) and areas that were not as difficult (between and below waterfalls; 17.7 – 33.1 kcal kg-1 d-1; above Lyle Falls 28.8 kcal kg-1 d-1). This discrepancy could be because estimates of anaerobic energy use during our study were underestimated. The analysis using the results of Burgetz et al. (1998) did not include an estimate of anaerobic energy use above the critical swimming speed of fish. Burgetz et al. (1998) estimated the anaerobic energy use of fish at 70, 80 and 100% Ucrit; however, they did not estimate the costs of anaerobic energy use at higher swimming speeds. This tax is likely an underestimate of the amount of anaerobic energy that fish use when swimming at speeds over 100% Ucrit since more white muscle, and hence more anaerobic cost would be recruited at these high speeds (Brett 1995). However, the amount of time that fish swim at these speeds is relatively small (Tables 5 and 6), so estimates may not be highly underestimated.
It would be preferable to measure lactate levels at different swimming speeds from fall chinook salmon to estimate anaerobic metabolism. However, the Ucrit of the rainbow trout that Burgetz et al. (1998) studied (2.13 Bl s-1) is similar to that of spring chinook salmon (2.06 Bl s-1; Geist et al. in prep.). This may increase the likelihood that the fish would fatigue at similar levels and use proportionate amounts of white muscle at similar swimming speeds.
5.2.1 Factors Potentially Affecting Passage Success and Activity
Several comparisons were made among movement and migration success of fish surgically implanted with EMG transmitters and fish gastrically implanted with coded transmitters. Within the Klickitat River, the behavior of fall chinook salmon tagged with EMG transmitters did not differ from that of salmon receiving gastric implants of coded transmitters. There was no difference between the time it took the two groups to swim from the release site to Falls 1. Fish implanted with EMG transmitters were more likely to move upstream into areas of the Klickitat River where spawning was likely to occur than those implanted with conventional transmitters (83% vs. 47%). However there was no difference in the highest upstream locations between the groups (rkm 46.85 for fish with EMG tags vs. rkm 38.16 for fish given coded tags).

43
Similar results were seen with the rates of upstream movement, where fish given a coded tag migrated at a similar rate to fish implanted with an EMG tag (2.05 km d-1 vs. 2.79 km day-
1respectively). This indicates that, despite transportation to the hatchery and back to the release site, surgical implantation, and calibration of a transmitter to swimming speed, the EMG-tagged fish did not have any more negative side effects than fish submitted to rather non-intrusive gastric implantation. Thus, use of EMG telemetry appears to be just as appropriate for field research of adult salmon as the widely used technique of gastrically implanting fish with transmitters. This finding is supported by Hinch et al. (1996) who also did a comparison between fish with gastrically implanted and surgically implanted transmitters. They also found no differences in migration rates between the two groups. However, while interpreting these results, it should be kept in mind that the power of these analyses are likely low due to limited sample sizes. Also, fish were not released on exactly the same dates (see Appendix A) so fish may have experienced different river conditions.
Average swimming speeds were highest during the day in all areas except at some waterfalls. While fish were attempting to pass waterfalls, there was a less consistent pattern in diel swimming activity. At Falls 2 and Lyle Falls, swimming speeds were higher during the day than at night. At Falls 1 average swimming speeds were higher at night than during day; however, none of the fish successfully passed waterfalls during the night. This may indicate that although fish may still attempt to pass waterfalls at night, the success is dependent at least partially on visual capabilities. During passage attempts, fish were often seen swimming into the cliff wall adjacent to the waterfall. The fish may be able to navigate away from cliffs and over the falls better during the day than at night.
Gowans et al. (1999) found that relatively few migrating Atlantic salmon (Salmo salar) ascend fish ladders at dams during the night and speculated that salmon need visual cues when ascending obstacles. Similar results were also found for Atlantic salmon and brown trout (Salmo trutta) ascending waterfalls (Stuart 1962). The passage of pink salmon through fishways was higher at night when artificial light was present (Brett and MacKinnon 1954). Collins et al. (1962) also found that fish continued to move through an endless fishway 24 hours a day if artificial light was present. The pattern of lower swimming speeds at night is even seen by salmon before they enter the freshwater phase of migration. While chum salmon are migrating in coastal waters, their swim speeds are lowest between 21:00 and 03:00 and highest between 09:00 and 15:00 (Tanaka et al. 2001).
Early dawn brings a massive attempt to pass obstacles by fish below falls or obstacles in streams (MacKinnon and Brett 1953). Brett (1995) suggests that this surge should subside quickly as unsuccessful fish fatigue. A pattern of high swimming speeds during morning twilight was seen at Falls 1, but was not observed at other falls where swimming speeds were higher at other times of the day.
There was no apparent relationship between either fish condition or length and successful passage of waterfalls in the lower Klickitat River. However, sex did appear to influence the likelihood of success; females had a much lower likelihood of passing waterfalls than did males. There could be several reasons for this. One reason could be that females are carrying eggs. Also females have increased energetic costs for gonad development compared to males. Rand and Hinch (1998) suggest that these increased costs may lead to a higher risk of energy

44
exhaustion. Also, the females migrate sooner than males. Thus, the females could have been in the river longer and been in poorer condition than the males.
5.2.2 Migration Rates in the Upper River
The rates of upstream movement were much slower in the Klickitat River than have been seen in other rivers. In the Fraser River, pink salmon migrate 21 to 23 km d–1 (Brett 1995). Idler and Clemens (1959) report that sockeye and chum salmon migrate at a rate of 39 km d –1. It is interesting to note that, although fish swam at a slower rate in the Klickitat River (2.36 km d-1), the energy used was similar to other migrating salmon, which migrate faster. This indicates that the Klickitat River may provide more of an energetic challenge than the larger mainstem rivers where these other studies were conducted. This is likely due to the higher gradient of the Klickitat River and numerous riffles and cascades. Another factor that may relate to the slow migration rates of fish in the upper Klickitat is the fish’s proximity to spawning grounds. Hockersmith et al. (1994) reported that the migration rates of spring chinook salmon in the Yakima River decreased as fish moved upstream and got closer to spawning areas. The movement rates changed from 20 to 30 km d-1 to around 3 to 4 km·d-1 (similar to this study) as fish migrated higher in the drainage.
5.3 Bioenergetics Model
To provide a context for energy use at difficult areas and the delay that may be associated with them, our data on energy use in different areas of the Klickitat River were used to estimate the total energy costs of an average (6 kg ) adult chinook salmon with 5,940 kcal of stored energy (Brett 1995; Table 11). Energy estimates to pass from below Falls 1 upstream past Falls 2 were taken from fall chinook salmon that successfully passed through this area (Table 5).
Fish passing between Falls 2 and Lyle Falls used an estimated 100.7 kcal. However, energy use in this area was likely elevated due to the delay from not being able to pass Lyle Falls. Successful fish would likely use an amount similar to that between Falls 1 and Falls 2 (88.5 kcal). If a fish could successfully pass Lyle Falls or pass the Lyle Falls fishway, the energetic cost would likely be similar to that of passing Falls 1 or 2; approximately 1 kcal. Energy used to pass the lower 2.4 km of river may be similar to the energetic cost of migrating upstream of Lyle Falls (2.36 km d-1 * 28.8 kcal kg-1 d-1 for a 6 kg fish) or ~176 kcal. In an earlier section we estimated the cost of migrating from Lyle Falls to upstream spawning areas to be 3,971 kcal for fish with a mean weight of 8.6 kg, or 462 kcal kg-1. Thus the cost for a 6-kg fish would be 2,770 kcal.

45
Table 11. Estimated Energetic Costs of Different Segments of Upstream Spawning Migration for an Average Sized (6 kg) Fall Chinook Salmon. Starting energy reserves were estimated by Brett (1995) using data from Greene (1926) to be 990 kcal kg-1. Energy used to travel from the mouth of the Columbia River to Bonneville Dam was estimated using travel times reported in NMFS (2000) and energy use rates estimated by Brett (1995) using data from Greene (1926). Energy used to pass Bonneville Dam (31.2 kcal kg-1 d-1) and Bonneville reservoir (19.5 kcal kg-1 d-1) were estimated by Geist et al (2000). Other energy use values are from this study for fish that successfully passed Falls 1 and 2 (Table 5).
Energy (kcal) Used Estimated Amount of % Energy (kcal)
Area by Area Energy (kcal) Remaining Remaining Mouth of Columbia River (Brett 1995) 5,940 100 Mouth of river to Bonneville Dam 1,208 4,732 80 Bonneville Dam (Geist et al. 2000) 37 4,695 79 Bonneville Reservoir (Geist et al. 2000) 199 4,496 76 Lower 2.4 km of river 176 4,320 73 Below arrays 55 4,265 72 Below Falls 1 227 4,038 68 Falls 1 1 4,037 68 Falls 1 –Falls 2 89 3,948 66 Falls 2 0 3,948 66 Falls 2 - Lyle Falls 89 3,860 65 Lyle Falls 1 3,859 65 Upstream of Lyle Falls 2,770 1,089 18
Costs of migration from the mouth of the Columbia River to the tailrace of Bonneville Dam are difficult to estimate. There are no accurate estimates of travel time for this river section. To estimate the travel time, the travel rates of fall chinook salmon between Bonneville Dam and Lower Granite Dam were used (38.3 km d-1; NMFS 2000). At this rate, it would take 6.1 days for a fall chinook salmon to migrate the 235 km from the mouth of the Columbia River to Bonneville Dam. Using proximate analysis, Greene (1926 [interpreted by Brett (1995)] estimated that migration costs of fall chinook salmon in the free-flowing Columbia River were 33 kcal kg-1 day-1. A 6-kg fish traveling 6.1 days may thus use approximately 1,208 kcal.
Geist et al. (2000) estimated the costs for a fall chinook salmon to pass over dams and through reservoirs. They estimated it would cost 19.5 kcal kg-1 d-1 for a fish to pass through each reservoir and approximately 1.7 days to migrate through each reservoir. Since the mouth of the Klickitat River is near the upstream end of the Bonneville pool, the energy to travel from the Bonneville Dam to the mouth of the Klickitat River may be near 199 kcal (6 kg * 1.7 d * 19.5 kcal kg-1 d-1). Geist et al. (2000) also estimated it would take an additional 0.2 d to migrate through each tailrace/dam at a cost of 31.2 kcal kg-1 d-1. This would result in an additional 37 kcal to pass Bonneville Dam (6 kg * 0.2 d * 31.2 kcal kg-1 d-1).

46
Including the costs to migrate to spawning areas in the Klickitat River, this bioenergetics example would leave only about 1,089 kcal for spawning and any other energetic costs (Table 11; energy use rates are shown in Tables 5 and 7.) A delay at waterfalls of 9 to 11 days (at a daily cost of additional 103 – 110 kcal; the hourly rate used between Falls 1 and 2, and between Falls 2 and Lyle Falls * 24 hours) would result in all energy reserves being depleted before spawning could occur. Geist et al. (2000) estimated that each day a fish was delayed at a mainstem Columbia River dam would result in an extra energy expenditure of 195 kcal. A delay of only 5 to 6 days at Bonneville Dam at this cost would use up all additional energy reserves and fish may fail to spawn.
Using this example, the estimate of 1,089 kcal remaining after migrating to spawning areas only leaves a remainder of 18% of energy reserves. This leaves fish at a critically low level of energy reserves. Others (Idler and Clemens 1959) have noted that sockeye salmon that successfully reached spawning grounds seldom had less than 20% of their reserves remaining. Others have estimated that as much as 20% of a fish’s energy reserves (at the start of migration) can be expended during spawning (Gilhousen 1980). Also, when a fish’s energy reserves drop below 20%, its swimming ability may be impaired (Gilhousen 1980), making migration and spawning less likely.
The largest contribution to the bioenergetics model is the energy used during migration between Lyle Falls and spawning areas. The rates of energy use in the Klickitat River upstream of Lyle Falls were higher than in areas between waterfalls, and also higher than estimated by Geist et al. (2000) for a Columbia River reservoir. Energy use rates were likely higher upstream of Lyle Falls since fish progress is not hindered by falls, and fish spend less time resting between attempts at difficult passage. It is likely much higher in the Klickitat River than the mainstem Columbia River reservoirs, since the Columbia is impounded while the Klickitat is much higher gradient and riffle and cascade habitats are common. It is interesting to note, however, that the rates of energy use in the Klickitat River upstream of Lyle Falls (28.8 kcal kg-1 d-1) are very similar to those reported by Greene (1926; interpreted by Brett [1995]; 33 kcal kg-1 h-1) for long migrations (1,130 km) in the free-flowing Columbia River.
5.4 Management Implications and Recommendations
Several strategies have been proposed to increase declining numbers of Pacific salmon in the Columbia Basin including increasing the amount of habitat that salmon can use for spawning and rearing by improving passage over barriers such as waterfalls. These barriers either limit the geographic range of salmon or deplete limited energy reserves making return to upstream reaches and successful spawning less likely. Improved passage at these difficult areas will likely result in an increase in the number of anadromous salmonids returning to the Columbia River Basin. This project examined not only the behavior of fish as they passed and attempted to pass difficult areas, but also the energy used during passage.
We conclude that even though fish make large, difficult leaps to pass waterfalls, the total amount of energy used at individual waterfalls is relatively small if fish have access to areas of low water velocity in which to rest and recover between jumps. This is because fall chinook salmon jumping over waterfalls were found to use burst swimming for periods of only 20 seconds at a time. In the lower Klickitat River, however, a combination of repeated waterfalls

47
and high-velocity transition areas makes for difficult passage conditions that likely affect the fish’s ability to migrate above Lyle Falls. We also found that longer river sections of relatively high-velocity flow that do not contain areas for fish to rest may be as difficult to pass as waterfalls, and because of their length, will result in larger amounts of energy used over the course of the migration.
The results of our study suggest that providing resting refugia in the vicinity of difficult passage areas (both natural and manmade) would likely provide a survival benefit to anadromous salmonids. Constructing low-water-velocity resting areas below and within points of difficulty may minimize energy losses to migrating salmon and improve passage success.
Further research on the fine-scale swimming and holding behavior of salmon at the base of waterfalls, entrances to fishways, and long stretches of fast water would improve our understanding of factors that affect the time and energy needed to enter and successfully transition through fishways and other areas of difficult passage. Other research needs identified by this study include determining the burst swimming abilities of adult salmon and understanding how these abilities change as fish mature as the migration progresses, and examining migrational energetics within small and medium size rivers in order to understand the relationships between energy use and river gradients, and different channel types, and habitat types. An examination of swimming behavior and energy use during spawning would also provide a piece of the puzzle, bringing us closer to understanding the relationships between natural and anthropogenic factors and energy use and spawning success.

48

49
6.0 References
Bainbridge, R. 1958. “The Speed of Swimming Fish as Related to the Frequency and Amplitude of the Tail Beat.” J. Exp. Biol. 35:109-133.
Bainbridge, R. 1961. “Problems of Fish Locomotion.” Symp. Zool. Soc. Lond. 5:13-32.
Beamish, F.W.H. 1978. “Swimming Capacity.” Chapter 2 in W.H. Hoar and D.J. Randall, eds. Fish Physiology, Volume 7. Academic Press, New York.
Bernatchez, L., and J. J. Dodson. 1987. “Relationship between Bioenergetics and Behavior in Anadromous Fish Migrations.” Can. J. Fish. Aquat. Sci. 44(2):399-407.
Bjornn, T. C., J. P. Hunt, K. R. Tolotti, P. J. Keniry, and R. R. Ringe. 1995. Migration of Adult Chinook Salmon and Steelhead Past Dams and through Reservoirs in the Lower Snake River and into Tributaries - 1993. Technical Report 95-1 to U.S. Army Corps of Engineers, Walla Walla District, Walla Walla, Washington.
Bjornn, T. C., K. R. Tolotti, J. P. Hunt, P. J. Keniry, R. R. Ringe, and C. A. Peery. 1998. Passage of Chinook Salmon through Lower Snake River and Distribution into the Tributaries, 1991-1993. Part 1. Report to U.S. Army Corps of Engineers, Walla Walla District, Walla Walla, Washington, and Bonneville Power Administration, Portland, Oregon.
Bjornn, T. C., M. L. Keefer, and L. C. Stuehrenburg. 2000. “Behavior and Survival of Adult Chinook Salmon that Migrate Past Dams and into Tributaries in the Columbia River Drainage as Assessed with Radio Telemetry.” In Proceedings of the Fifteenth International Symposium on Biotelemetry, Juneau, Alaska, May 9-14, 1999, J.H. Eiler, D.J. Alcorn, and M.R. Neuman, editors, International Society on Biotelemetry, Wageningen, The Netherlands.
Boivin, T. G., and G. Power. 1990. “Winter Condition and Proximate Composition of Anadromous Arctic Charr (Salvelinus alpinus) in Eastern Ungava Bay, Quebec.” Can. J. Zool. 68(11):2284-2289.
Brafield, A. E., and D. J. Solomon. 1972. “Oxy-Calorific Coefficients for Animals Respiring Nitrogenous Substrates.” Comparative Biochemistry and Physiology A, Comparative Physiology 43:837-841.
Brett, J.R. 1995. “Energetics.” In Physiological Ecology of Pacific Salmon, ed. C. Groot, L. Margolis, and W. C. Clarke. pp.3-68. UBC Press, Vancouver, British Columbia.
Brett, J.R. and N.R. Glass. 1973. “Metabolic Rates and Critical Swimming Speeds of Sockeye Salmon, (Oncorhynchus nerka), in Relation to Size and Temperature.” J. Fish. Res. Brd. Can. 30:379-387.
Brett, J.R. and D. MacKinnon. 1954. “Some Aspects of Olfactory Perception in Migrating Adult Coho and Spring Salmon.” J. Fish. Res. Bd. Can. 11(3): 310-318.

50
Burger, C.V.; R.L. Wilmot, and D.B. Wangaard. 1985. “Comparison of Spawning Areas and Times for Two Runs of Chinook Salmon (Oncorhynchus tshawytscha) in the Kenai River.” Can. J. Fish. Aquat. Sci. 42:693-700.
Burgetz, I.J.; A. Rojas-Vargas; S.G. Hinch, and D.J. Randall. 1998. “Initial Recruitment of Anaerobic Metabolism during Sub-Maximal Swimming in Rainbow Trout (Oncorhynchus mykiss).” J. Exp. Biol. 201(19):2711-2721.
Collins, G.B., J.R. Gauley, and C.H. Elling. 1962. “Ability of Salmonids to Ascend High Fishways.” Trans. Am. Fish. Soc. 91: 1-7.
Geist, D.R., C.S. Abernethy, S.L. Blanton, and V.I. Cullinan. 2000. “The Use of Electromyogram Telemetry to Estimate Energy Expenditure of Adult Fall Chinook Salmon.” Transactions of the American Fisheries Society, 129:126-135.
Geist, D. R., R. S. Brown, K. Lepla, and J. Chandler. 2002. “Practical Application of Electromyogram Radiotelemetry: the Suitability of Applying Laboratory-Acquired Calibration Data to Field Data.” N. Am. J. Fish. Manage. 22:474-479.
Geist, D.R., R.S. Brown, M.G. Mesa, and S.P. VanderKooi. in prep. “The Relationship of Metabolic Rate, Electromyogram Activity of Red and White Muscle, and Swimming Performance of Adult Spring Chinook Salmon from the Columbia River,” Pacific Northwest National Laboratory, for the U.S. Army Corps of Engineers.
Gilhousen, P. 1980. “Energy Sources and Expenditures in Fraser River Sockeye Salmon during their Spawning Migration.” Int. Pac. Salmon. Fish. Comm. Bull. 23:51 p.
Gordon, N.D., T.A. McMahon, and B.L. Finlayson. 1992. Stream Hydrology: an Introduction for Ecologists. John Wiley & Sons.
Gowans, A.R.D., J.D. Armstrong, and I.G. Priede. 1999. “Movements of Adult Atlantic Salmon in Relation to a Hydroelectric Dam and Fish Ladder.” J. Fish Biol. 54: 713-726.
Gray, J. 1968. Animal Locomotion. Weidenfeld and Nocolson, London. 470 p.
Greene, C.W. 1926. “The Physiology of the Spawning Migration.” Physiological Reviews 6(2): 201-241.
Henderson, F.M. 1966. Open Channel Flow. Macmillan Publishing Co. Inc. New York.
Hinch, S.G., and J. Bratty. 2000. “Effects of Swim Speed and Activity Pattern on Success of Adult Sockeye Salmon Migration through an Area of Difficult Passage.” Transactions of the American Fisheries Society 129:598-606.
Hinch, S.G., R.E. Diewert, T.J. Lissimore, A.M. Prince, M.C. Healey, and M.A. Henderson. 1996. “Use of Electromyogram Telemetry to Assess Difficult Passage Areas for River-Migrating Adult Sockeye Salmon.” Transactions of the American Fisheries Society 125:253-260.

51
Hinch, S.G., and P.S. Rand. 1998. “Swim Speeds and Energy Use of Upriver-Migrating Sockeye Salmon (Oncorhynchus nerka): Role of Local Environment and Fish Characteristics.” Can. J. Fish. Aquat. Sci. 55: 1821-1831.
Hockersmith, E., J. Vella, L. Stuehrenberg, and G. Swan. 1994. Yakima River Radio-Telemetry Study: Spring Chinook Salmon, 1991-1992. Project Number 89-089. Prepared for Bonneville Power Administration by National Marine Fisheries Service, Seattle, Washington.
Idler, D.R. and W.A. Clemens. 1959. The Energy Expenditures of Fraser River Sockeye Salmon during the Spawning Migration to Chilko and Stuart Lakes. International Pacific Salmon Fisheries Commission, New Westminster, B.C., Canada.
Johnsrude, C.L., and P.W. Webb. 1985. “Mechanical Properties of the Myotomal Musculo-skeletal System of Rainbow Trout, Salmon gairdneri.” J. Exp. Biol. 119:71-83.
Kaseloo, P.A.; A.H. Weatherley, J. Lotimer, and M.D. Farina. 1992. “A Biotelemetry System Recording Fish Activity.” J. Fish Biol. 40:165-179.
MacKinnon, D., and J.R. Brett. 1953. “Fluctuations in the Hourly Rate of Migration of Adult Coho and Spring Salmon up the Stamp Falls Fish Ladder.” Fish. Res. Brd. Can. Prog. Rep. Pac. Coast Stn. 95:53-55.
National Marine Fisheries Service (NMFS). 2000. “Passage of Juvenile and Adult Salmonids Past Columbia and Snake River Dams.” Prepared by National Marine Fisheries Service, Seattle, Washington. (Available from Northwest Fisheries Science Center, 2725 Montlake Blvd. E., Seattle, WA98112-2097.) Internet webpage: http://www.nwfsc.noaa.gov/pubs/white/passage.pdf
Newman, H.W. and G.B. Collins. 1967. Energy Consumption of Adult Salmon at Dams. Bureau of Commercial Fisheries, Biological Laboratory, Seattle.
Paulik, G.J., and A.C. DeLacey. 1958. Changes in the Swimming Ability of Columbia River Sockeye Salmon during Upstream Migration. Tech. Rept. 46, College of Fisheries, University of Washington, Seattle, Washington.
Pentegoff, B.P., U.N. Menthoff, and E.F. Kurnaeff. 1928. “Physiochemical Characteristic of Breeding Migration Fast of Keta Salmon.” Izv. Tikhookean. Nauchno-Promyslovoi Stn. (Bull. Pac. Sci. Fish. Res. Stn.) 2(1):64p. (In Russian, with English summary).
Petrosky, C.E., H.A. Schaller, and P. Budy. 2001. “Productivity and Survival Rate Trends in the Freshwater Spawning and Rearing Stage of Snake River Chinook Salmon (Oncorhynchus Tshawytscha).” Can. J. Fish. Aquat. Sci. 58(6):1196-1207.
Powers, P.D. and J.F. Orsborn. 1990. Analysis of Barriers to Upstream Fish Migration - an Investigation of the Physical and Biological Conditions Affecting Fish Passage Success at Culverts and Waterfalls. Final Project Report Part 4 of 4, BPA Report DOE/BP-36523-1, Bonneville Power Administration, Portland, Oregon.

52
Puckett, K.J. and L.M. Dill. 1984. “Cost of Sustained and Burst Swimming of Juvenile Coho Salmon (Oncorhynchus kisutch).” Can. J. Fish. Aquat. Sci. 41:1546-1551.
Puckett, K.J. and L.M. Dill. 1985. “The Energetics of Feeding Territoriality in Juvenile Coho Salmon (Oncorhynchus kisutch).” Behaviour 92:97-111.
Rand, P.S, and S.G. Hinch. 1998. “Swim Speeds and Energy Use of UpriverMigrating Sockeye Salmon (Oncorhynchus nerka): Simulating Metabolic Power and Assessing Risk of Energy Depletion.” Can. J. Fish. Aquat. Sci. 55: 1832-1841.
Sharp, B., D. Anderson, G. King, J. Feen, S. McCorquodale, J. Byrne, D. Johnson, T. Strong, J. Hubble, B. Watson, and W. Conley. . 2000. Klickitat Subbasin Summary. Prepared by Yakama Nation for Northwest power Planning Council. http://www.cbfwa.org/files/province/gorge/subsums/Klickitat.PDF
Stuart, T.A. 1962. “The Leaping Behavior of Salmon and Trout at Falls and Obstructions.” Scot. Dep. Agric. Fish. Freshwater Salmon Fish. Res. 28:46 p.
Tanaka, H., Y. Takagi, and Y. Naito. 2001. “Swimming Speeds and Buoyancy Compensation of Migrating Adult Chum Salmon Oncorhynchus keta Revealed by Speed/Depth/Acceleration Data Logger.” J. Exp. Biol. 204:3895-3904.
Wardle, C.S. 1975. “Limit of Fish Swimming Speed.” Nature 25:725-727.
Weatherly, A.H., S.C. Rogers, D.G. Pincock, and J.R. Patch. 1982. “Oxygen Consumption of Active Trout, Salmo gairdneri R., Derived from Electromyograms Obtained from Radiotelemetry.” Journal of Fish Biology 20:479-489.
Webb, P. W. 1995. “Locomotion.” In Physiological Ecology of Pacific Salmon, ed. C.Groot, L. Margolis, and W.C. Clarke. pp. 79-99. UBC Press, Vancouver, British Columbia.
Williams, I.V. and J.R. Brett. 1987. “Critical Swimming Speed of Fraser and Thompson River Pink Salmon (Oncorhynchus gorbuscha).” Can. J. Fish. Aquat. Sci. 44: 348-356.
Williams, I.V., J.R. Brett, G.R. Bell, G.S. Traxler, J. Bagshaw, J.R. McBride, U.H.M. Fagerlund, H.M. Dye, J.P. Sumpter, E.M. Donaldson, E. Bilinski, H. Tsuyuki, M.D. Peters, E.M. Choromanski, J.H.Y. Cheng, and W.L. Coleridge. 1986. “The 1983 Early Run Fraser and Thompson River Pink Salmon; Morphology, Energetics and Fish Health.” Int. Pac. Salmon Fish. Comm. Bull. 23:55p.
A.1
Appendix A
Data on Individual Fish Tagged and Released in the Lower and Upper Klickitat River, Fall 2001

A.2

A.3
Table A.1. Date of Capture and Release, and the Length, Weight, Sex and Release Site of Spring Chinook Salmon Implanted with EMG Radio Transmitters in the Lower Klickitat River, Fall 2001
Tag Date of Release
Area Type Capture Release Frequency Code FL (cm) Weight (kg) Sex (rkm)
EMG 11 Sep. 14 Sep. 150.365 76.0 4.72 Male 1.84 EMG 11 Sep. 14 Sep. 150.487 65.0 3.5 Male 1.84 EMG 19 Sep. 21 Sep. 150.305 88.3 7.86 Female 1.84 EMG 19 Sep. 22 Sep. 150.885 76.0 4.72 Male 1.84 EMG 20 Sep. 22 Sep. 150.586 70.0 4.06 Male 1.84 EMG 20 Sep. 22 Sep. 150.646 70.0 4.52 Male 1.84 EMG 20 Sep. 22 Sep. 150.985 69.2 4.16 Male 1.84 EMG 26 Sep. 28 Sep. 150.346 72.6 4.94 Male 1.84 EMG 26 Sep. 28 Sep. 150.446 73.4 4.74 Male 1.84 EMG 26 Sep. 28 Sep. 150.626 79.0 6.6 Male 1.84 EMG 26 Sep. 29 Sep. 150.326 90.0 6.46 Female 1.84 EMG 26 Sep. 29 Sep. 150.665 80.0 6.06 Male 1.84 EMG 2 Oct. 4 Oct. 150.406 75.0 4.74 Male 1.84 EMG 2 Oct. 4 Oct. 150.427 88.0 7.58 Male 1.84 EMG 2 Oct. 5 Oct. 150.386 73.8 4.32 Male 1.84 EMG 2 Oct. 5 Oct. 150.506 80.3 5.94 Male 1.84 EMG 2 Oct. 5 Oct. 150.726 65.0 3.02 Male 1.84 EMG 2 Oct. 5 Oct. 150.985 72 4.4 Male 1.84 EMG 3 Oct. 6 Oct. 150.545 76.0 5.46 Male 1.84 EMG 3 Oct. 6 Oct. 150.563 73.1 5.72 Male 1.84 EMG 3 Oct. 6 Oct. 150.686 66.0 3.98 Male 1.84 EMG 9 Oct. 11 Oct. 150.025 70.0 5.02 Female 1.84 EMG 9 Oct. 12 Oct. 150.145 79.2 7.72 Female 1.84 EMG 9 Oct. 12 Oct. 150.706 75.0 6.14 Male 1.84 EMG 9 Oct. 12 Oct. 150.824 94.0 9.18 Male 1.84 EMG 11 Oct. 14 Oct. 150.006 87.0 6.58 Female 1.84 EMG 11 Oct. 14 Oct. 150.045 100.0 12.5 Female 1.84 EMG 11 Oct. 14 Oct. 150.066 89.0 9.28 Female 1.84 EMG 11 Oct. 14 Oct. 150.085 74.2 4.62 Female 1.84 EMG 11 Oct. 14 Oct. 150.165 72.0 4.44 Female 1.84 EMG 12 Oct. 15 Oct. 148.225 78.0 6.38 Female 1.84 EMG 12 Oct. 15 Oct. 148.465 78.0 5.66 Female 1.84 EMG 12 Oct. 15 Oct. 148.645 94.0 9.94 Female 1.84 EMG 12 Oct. 15 Oct. 148.665 81.0 5 Female 1.84 EMG 12 Oct. 15 Oct. 150.676 78.0 4.86 Male 1.84

A.4
Table A.2. Date of Capture and Release, and the Length, Weight, Sex and Release Site of Spring Chinook Salmon Implanted with Coded Radio Transmitters in the Lower Klickitat River, Fall 2001
Tag Date of Release
Area Type Capture Release Frequency Code FL (cm) Weight (kg) Sex (rkm)
Coded 26 Sep. 26 Sep. 150.860 19 69 4.34 Female 1.84 Coded 27 Sep. 27 Sep. 150.860 13 78 6 Female 1.84 Coded 27 Sep. 27 Sep. 150.860 10 99 13.9 Male 1.84 Coded 27 Sep. 27 Sep. 150.860 14 84 8.02 Male 1.84 Coded 27 Sep. 27 Sep. 150.860 18 70 4.14 Male 1.84 Coded 16 Oct. 16 Oct. 150.820 10 74 4.72 Male 1.84 Coded 16 Oct. 16 Oct. 150.820 11 79 5.54 Male 1.84 Coded 16 Oct. 16 Oct. 150.860 11 76 5.58 Male 1.84 Coded 16 Oct. 16 Oct. 150.820 12 75 4.62 Male 1.84 Coded 16 Oct. 16 Oct. 150.820 13 73 7.08 Male 1.84 Coded 16 Oct. 16 Oct. 150.820 14 74 4.5 Male 1.84 Coded 16 Oct. 16 Oct. 150.820 16 72 4.88 Male 1.84 Coded 16 Oct. 16 Oct. 150.820 17 94 11.04 Male 1.84 Coded 16 Oct. 16 Oct. 150.820 18 87 8.1 Male 1.84 Coded 16 Oct. 16 Oct. 150.820 19 75 4.92 Male 1.84

A.5
Table 3. Date of Capture and Release, and the Length, Weight, Sex and Release Site of Spring Chinook Salmon Radio Tagged in the Klickitat River Upstream of Lyle Falls, Fall 2001
Tag Date of Release AreaType Capture Release Frequency Code FL (cm) Weight (kg) Sex (rkm)
Coded 27 Sep. 27 Sep. 150.860 12 73 4.64 Male 9.25 Coded 27 Sep. 27 Sep. 150.860 15 70 6.24 Male 9.25 Coded 3 Oct. 3 Oct. 150.860 11 78 5.2 Female 9.25 Coded 3 Oct. 3 Oct. 150.860 16 69 4.8 Female 9.25 Coded 3 Oct. 3 Oct. 150.860 17 94 9.7 Female 9.25 Coded 3 Oct. 3 Oct. 150.840 19 89 7.36 Female 9.25 Coded 16 Oct. 16 Oct. 150.840 13 74 4 Female 9.25 Coded 16 Oct. 16 Oct. 150.840 10 84 6 Male 9.25 Coded 16 Oct. 16 Oct. 150.840 11 69 4 Male 9.25 Coded 16 Oct. 16 Oct. 150.840 12 78 8 Male 9.25 Coded 16 Oct. 16 Oct. 150.840 14 83 7 Male 9.25 Coded 16 Oct. 16 Oct. 150.840 15 87 9 Male 9.25 Coded 16 Oct. 16 Oct. 150.840 16 67 4 Male 9.25 Coded 16 Oct. 16 Oct. 150.840 17 92 8 Male 9.25 Coded 16 Oct. 16 Oct. 150.840 18 70 4 Male 9.25 EMG 9 Oct. 11 Oct. 150.746 98.0 10.2 Male 9.25 EMG 9 Oct. 11 Oct. 150.125 69.0 4.4 Male 9.25 EMG 9 Oct. 11 Oct. 150.286 68.5 4.15 Male 9.25 EMG 9 Oct. 12 Oct. 150.185 94.0 9.56 Female 9.25 EMG 9 Oct. 12 Oct. 150.605 104.0 10.82 Male 9.25 EMG 12 Oct. 15 Oct. 148.725 89.6 8.26 Male 9.25

A.6