Embed Size (px)
Citation preview
Faraday DiscussionsCite this: Faraday Discuss., 2015, 180, 331
PAPER
Publ
ishe
d on
16
Janu
ary
2015
. Dow
nloa
ded
by U
nive
rsity
of
Wes
tern
Ont
ario
on
22/0
3/20
16 2
0:49
:13.
View Article OnlineView Journal | View Issue
Determination of the local corrosion rateof magnesium alloys using a shear forcemounted scanning microcapillary method†
Philippe Dauphin-Ducharme,a W. Jeffrey Binns,b Michael E. Snowden,a
David W. Shoesmithb and Janine Mauzeroll*a
Received 23rd December 2014, Accepted 16th January 2015
DOI: 10.1039/c4fd00276h
The successful development of scanning probe techniques to characterize corrosion in
situ using multifunctional probes is intrinsically tied to surface topography signal
decoupling from the measured electrochemical fluxes. One viable strategy is the shear
force controlled scanning microcapillary method. Using this method, pulled quartz
micropipettes with an aperture of 500 nm diameter were used to resolve small and
large variations in topography in order to quantify the local corrosion rate of
microgalvanically and galvanically corroded Mg alloys. To achieve topography
monitoring of corroded surfaces, shear force feedback was employed to position the
micropipette at a reproducible working height above the substrate. We present proof of
concept measurements over a galvanic couple of a magnesium alloy (AE44) and mild
steel along with a microgalvanically corroded ZEK100 Mg alloy, which illustrates the
ability of shear force to track small (1.4 mm) and large (700 mm) topographic variations
from high aspect ratio features. Furthermore, we demonstrate the robustness of the
technique by acquiring topographic data for 4 mm along the magnesium–steel galvanic
couple sample and a 250 � 30 mm topography map over the ZEK100 Mg alloy. All
topography results were benchmarked using standard optical microscopies
(profilometry and confocal laser scanning microscopy).
1 Introduction
Scanning probe techniques (SPTs) have found extensive applications in corrosionscience as tools for quantitative and qualitative analyses that can tackle key issuesincluding: the identication of the corrosion initiation sites, predicting thepropagation of corrosion, the effectiveness of smart inhibition coatings andlifetime predictions.1
aDepartment of Chemistry, McGill University, 801 Sherbrooke St W., Montreal, Quebec, H3A 0B8, Canada.
E-mail: [email protected]; Fax: +1 514 398-6999; Tel: +1 514 398-3898bDepartment of Chemistry and Surface Science Western, Western University, London, Ontario, N6A 5B7,
Canada
† Electronic supplementary information (ESI) available. See DOI: 10.1039/c4fd00276h
This journal is © The Royal Society of Chemistry 2015 Faraday Discuss., 2015, 180, 331–345 | 331
Faraday Discussions PaperPu
blis
hed
on 1
6 Ja
nuar
y 20
15. D
ownl
oade
d by
Uni
vers
ity o
f W
este
rn O
ntar
io o
n 22
/03/
2016
20:
49:1
3.
View Article Online
Specically, scanning electrochemical microscopy (SECM) is a highly relevantelectroanalytical method to quantify local chemical uxes in situ and to map theheterogeneous electrochemical activity of corroding surfaces.1–3 A normal SECMsetup uses a microelectrode (ME) sensor, included in a four electrode congu-ration controlled by a bipotentiostat, attached to a 3-axis translator positioningsystem. The four electrodes required are two working electrodes: ME andsubstrate/sample, a counter electrode: CE, and a reference electrode: REF. Incorrosion studies, SECM offers an arsenal of modes for the direct detection ofionic/molecular uxes produced at the corroding interface,3 to probe corrosionmechanisms,4 coatings5,6 and surface modications.7 Recently, the potentio-metric,8,9 feedback,10,11 and generation–collection modes10,12–14 of SECM have beenapplied to study the corrosion of Mg alloys which, given their light-weight prop-erties and low cost, are of interest for automotive applications.15
An important challenge when performing such SECM measurements is theability to decouple and resolve variations in topography in order to quantify localcorrosion rates. In comparison to the detection of electrochemical uxes,topography sensing is less sensitive but can still provide local corrosion rates thatmust be in agreement with the chemical uxes measured at the ME. Simulta-neous topography tracking therefore offers an internal data validation. Severalstrategies have been developed to decouple topography from surface reactivity.16
Lee et. al.17 attached a tuning fork to a gold ring disk ME, and monitored themechanical oscillations of this assembly with a pulsed laser. Tuning fork controlloops have been successfully applied to complex biological samples18,19 withtopographical variations in the order of 15 mm. Combined atomic force micros-copy (AFM)-SECM probes have also been fabricated to assess surface topographyalong with electrochemical reactivity.20–22 A maximal depth of 2 mmwas measuredin these studies. Another strategy involves alternating current scanning electro-chemical microscopy (AC-SECM) that relies on impedance measurements tomonitor the tip-to-substrate separation.4 Using AC-SECM, hard substrates, suchas corroding copper,23 Al alloys,24 stainless steel4 and substrates with easilydeformed features, e.g. cells,25 of less than 20 mmhave been imaged. Finally, shearforce (SF) control loops are also available and were originally implemented as amethod to maintain a constant tip-to-substrate separation during a SECM scan26
using optical detection.27 Nowadays, two piezoelectric elements are attached tothe sha of a SECM probe.28,29 An alternating potential is applied to the piezofurthest from the ME tip (stimulation piezo) which induces a mechanical oscil-lation of the ME. The piezo element closest to the ME tip (receiver piezo) monitorsthe displacement of the ME as an alternating voltage having a characteristicamplitude and phase.30,31 When the tip-to-substrate distance is less than a fewhundred nanometers, the oscillation of the ME is damped by shear forcesbetween the ME tip, solution and substrate surface. The resulting amplitudedamping and phase shis of the receiver piezo are used in a feedback loop inorder to maintain a constant tip-to-substrate separation. The overall geometry ofthe ME signicantly affects the SF response,32 thus requiring the use of a repro-ducible ME fabrication procedure to ensure comparable SF signals.29,33 Optimi-zation of the SF conditions has recently allowed height differences of 200–250 mmto be measured whilst simultaneously recording electrochemical data.34
To track the extensive depth proles and accurately quantify bulk and localcorrosion rates observed at corroded Mg materials, topography tracking
332 | Faraday Discuss., 2015, 180, 331–345 This journal is © The Royal Society of Chemistry 2015
Paper Faraday DiscussionsPu
blis
hed
on 1
6 Ja
nuar
y 20
15. D
ownl
oade
d by
Uni
vers
ity o
f W
este
rn O
ntar
io o
n 22
/03/
2016
20:
49:1
3.
View Article Online
methodologies with an extended range must be developed for SECM applications.In the specic case of pure Mg and its alloys that have standard electrochemicalpotentials well below �1.5 V vs. SCE,35 severe corrosion rates are expected (in theorder of �10–1000 mm per year36 when galvanically coupled (depending on theother material) and <10 mm per year12as a standalone material), which impedesSECM studies. Weight loss37,38 and H2 collection39 have been employed tomeasurebulk corrosion rates. They provide absolute amounts of corroded material butlack the ability to produce spatially resolved height proles of the corrodedsubstrate required in SECM. Microscopy techniques, such as confocal laserscanning microscopy40 (CLSM) and laser-based prolometry,41 have also beenused to track local corrosion damage but would be difficult to interface withSECM, suffer from diffraction artifacts when a signicant amount of corrosionproduct is present, and have a limited temporal resolution given their stop-gostyle experiments. Other alternatives include the scanning vibrating electrodetechnique (SVET), which measures local current densities in situ and approximatelocal corrosion rates using Faraday's law41 and the scanning droplet cell method(SDC)42 where the local corrosion rate measurement uses Tafel extrapolation ofpotentiodynamic polarization curves (PDPs).
We have prioritized the development of shear force (SF) probes because: (i)they have demonstrated excellent topographic performance in several media43
and over a range of different samples;19,44,45 (ii) the method is easily adaptable to arange of SECM sensors and (iii) it is capable of tracking the full range of topo-graphic variations expected for corroding Mg materials. Herein, we presentevidence that the SF methodology can accurately track topographical featuresrelevant to the study of Mg material corrosion. In our current conguration, wecan readily accommodate vertical features as small as 1 nm up to 40 mm. The SFmethodology, illustrated here by ex situ measurements, can readily be appliedduring SECM measurements to produce both in situ reactivity and topographicaldata. We demonstrate a large working height range of 700 mm using SF on aseverely corroded magnesium alloy-mild steel galvanic couple along with thetopography of a microgalvanically corroded ZEK100 Mg alloy presenting micro-scopic scale features of less than 1.4 mm. The SF topography is benchmarkedagainst conventional imaging techniques (prolometry and CLSM).
2 Experimental2.1 Fabrication of micropipettes for constant distance imaging
Quartz capillaries of 0.3 mm internal diameter (ID) and 1 mm outer diameter(Sutter Instrument, Novato, CA) were washed in 0.1 M HNO3 (Caledon Labora-tories Ltd., Georgetown, Ont) for 2 hours, and dried overnight in an oven (95 �C). AP-2000 CO2 laser puller (Sutter Instrument) was used to pull patch pipettes withan aperture of 500 nm diameter and taper length of 2.0 mm (measured along thepipette sha from the tip to where ID ¼ 0.15 mm).8
2.2 Mg alloys selected
Ingots of mild steel (MS), AE44 (composition: 91.6% ¼ Mg, 4% ¼ Al, 4% ¼ rareearths elements, 0.4% other impurities) and ZEK100 (composition: 98% ¼ Mg,1% ¼ Zn, <0.5% ¼ rare earths elements, <0.5% ¼ Zr) were received from General
This journal is © The Royal Society of Chemistry 2015 Faraday Discuss., 2015, 180, 331–345 | 333
Faraday Discussions PaperPu
blis
hed
on 1
6 Ja
nuar
y 20
15. D
ownl
oade
d by
Uni
vers
ity o
f W
este
rn O
ntar
io o
n 22
/03/
2016
20:
49:1
3.
View Article Online
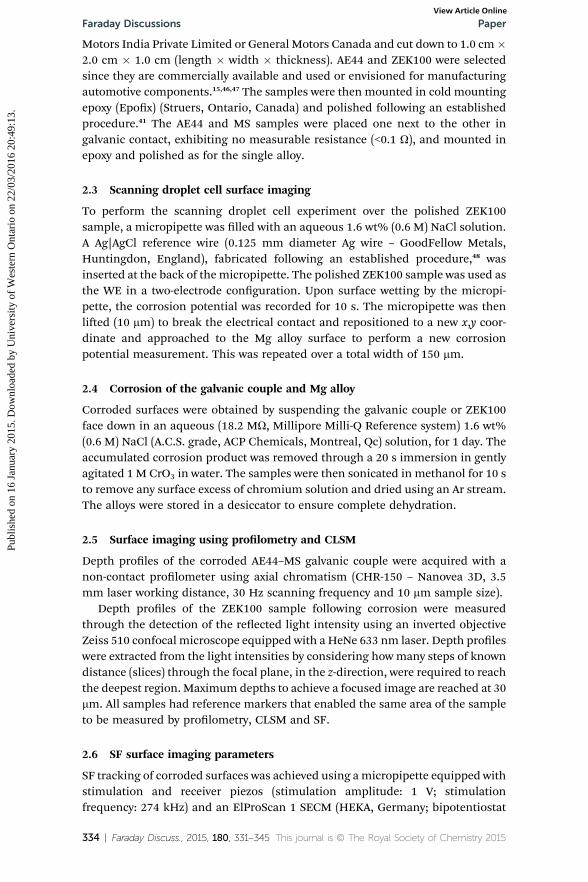
Motors India Private Limited or General Motors Canada and cut down to 1.0 cm�2.0 cm � 1.0 cm (length � width � thickness). AE44 and ZEK100 were selectedsince they are commercially available and used or envisioned for manufacturingautomotive components.15,46,47 The samples were then mounted in cold mountingepoxy (Epox) (Struers, Ontario, Canada) and polished following an establishedprocedure.41 The AE44 and MS samples were placed one next to the other ingalvanic contact, exhibiting no measurable resistance (<0.1 U), and mounted inepoxy and polished as for the single alloy.
2.3 Scanning droplet cell surface imaging
To perform the scanning droplet cell experiment over the polished ZEK100sample, a micropipette was lled with an aqueous 1.6 wt% (0.6 M) NaCl solution.A Ag|AgCl reference wire (0.125 mm diameter Ag wire – GoodFellow Metals,Huntingdon, England), fabricated following an established procedure,48 wasinserted at the back of the micropipette. The polished ZEK100 sample was used asthe WE in a two-electrode conguration. Upon surface wetting by the micropi-pette, the corrosion potential was recorded for 10 s. The micropipette was thenlied (10 mm) to break the electrical contact and repositioned to a new x,y coor-dinate and approached to the Mg alloy surface to perform a new corrosionpotential measurement. This was repeated over a total width of 150 mm.
2.4 Corrosion of the galvanic couple and Mg alloy
Corroded surfaces were obtained by suspending the galvanic couple or ZEK100face down in an aqueous (18.2 MU, Millipore Milli-Q Reference system) 1.6 wt%(0.6 M) NaCl (A.C.S. grade, ACP Chemicals, Montreal, Qc) solution, for 1 day. Theaccumulated corrosion product was removed through a 20 s immersion in gentlyagitated 1 M CrO3 in water. The samples were then sonicated in methanol for 10 sto remove any surface excess of chromium solution and dried using an Ar stream.The alloys were stored in a desiccator to ensure complete dehydration.
2.5 Surface imaging using prolometry and CLSM
Depth proles of the corroded AE44–MS galvanic couple were acquired with anon-contact prolometer using axial chromatism (CHR-150 – Nanovea 3D, 3.5mm laser working distance, 30 Hz scanning frequency and 10 mm sample size).
Depth proles of the ZEK100 sample following corrosion were measuredthrough the detection of the reected light intensity using an inverted objectiveZeiss 510 confocal microscope equipped with a HeNe 633 nm laser. Depth proleswere extracted from the light intensities by considering howmany steps of knowndistance (slices) through the focal plane, in the z-direction, were required to reachthe deepest region. Maximum depths to achieve a focused image are reached at 30mm. All samples had reference markers that enabled the same area of the sampleto be measured by prolometry, CLSM and SF.
2.6 SF surface imaging parameters
SF tracking of corroded surfaces was achieved using amicropipette equipped withstimulation and receiver piezos (stimulation amplitude: 1 V; stimulationfrequency: 274 kHz) and an ElProScan 1 SECM (HEKA, Germany; bipotentiostat
334 | Faraday Discuss., 2015, 180, 331–345 This journal is © The Royal Society of Chemistry 2015
Paper Faraday DiscussionsPu
blis
hed
on 1
6 Ja
nuar
y 20
15. D
ownl
oade
d by
Uni
vers
ity o
f W
este
rn O
ntar
io o
n 22
/03/
2016
20:
49:1
3.
View Article Online
model PG340). The optimal stimulation frequency was identied by recording afrequency spectra with a tip-to-substrate separation greater than 500 nm abovethe substrate and with the tip in contact with the substrate (vide infra). To topo-graphically image the corroded surfaces, the z approach was stopped when the SFamplitude decreased to 45% of the SF amplitude measured above the substrate atan approach speed of 10 nm s�1. The height of both the stepper and z piezo wererecorded and the tip was retracted 4 mm, before being repositioned to a new x,ycoordinate.
3 Results and discussion3.1 Monitoring microgalvanic corrosion of ZEK100 using a scanning dropletcell
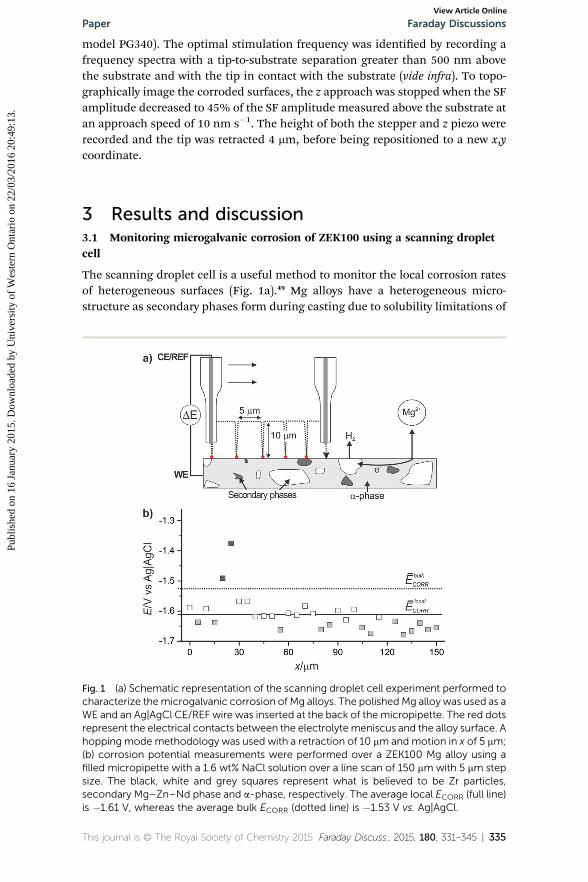
The scanning droplet cell is a useful method to monitor the local corrosion ratesof heterogeneous surfaces (Fig. 1a).49 Mg alloys have a heterogeneous micro-structure as secondary phases form during casting due to solubility limitations of
Fig. 1 (a) Schematic representation of the scanning droplet cell experiment performed tocharacterize themicrogalvanic corrosion of Mg alloys. The polishedMg alloy was used as aWE and an Ag|AgCl CE/REF wire was inserted at the back of the micropipette. The red dotsrepresent the electrical contacts between the electrolyte meniscus and the alloy surface. Ahoppingmode methodology was used with a retraction of 10 mm and motion in x of 5 mm;(b) corrosion potential measurements were performed over a ZEK100 Mg alloy using afilled micropipette with a 1.6 wt% NaCl solution over a line scan of 150 mm with 5 mm stepsize. The black, white and grey squares represent what is believed to be Zr particles,secondary Mg–Zn–Nd phase and a-phase, respectively. The average local ECORR (full line)is �1.61 V, whereas the average bulk ECORR (dotted line) is �1.53 V vs. Ag|AgCl.
This journal is © The Royal Society of Chemistry 2015 Faraday Discuss., 2015, 180, 331–345 | 335

Faraday Discussions PaperPu
blis
hed
on 1
6 Ja
nuar
y 20
15. D
ownl
oade
d by
Uni
vers
ity o
f W
este
rn O
ntar
io o
n 22
/03/
2016
20:
49:1
3.
View Article Online
the alloying elements in the Mg solid solution. The overall corrosion reaction ofMg materials can be simply described by the reactions,
Mg(s) / Mg2+(aq) + 2e� (1)
2H2O(aq) + 2e� $ 2OH�(aq) + H2(g) (2)
Mg2+(aq) + 2OH�(aq) $ Mg(OH)2(s) (3)
In the case of ZEK100 Mg alloy, the microstructure comprises an a-Mg richphase, a secondary Mg–Zn–Nd phase and Zr particles randomly distributed acrossits surface.47 Some Zr particles have previously shown Fe enrichment, makingthem preferred cathodes and the location for water reduction (eqn (2)),12 thereforedriving the microgalvanic corrosion of ZEK100. As for the a-Mg matrix, due to itshigh Mg content, this phase is believed to dissolve producing Mg2+ ions (eqn (1)).
To highlight the microstructural heterogeneity of the polished ZEK100 Mgalloy, a scanning droplet cell experiment was performed to measure the localcorrosion potential (ECORR) using a micropipette lled with an aqueous 1.6 wt%NaCl solution, Fig. 1a. The measuring cycle entailed bringing the micro dropletinto contact with the polished Mg alloy surface and measuring ECORR vs. theAg|AgCl CE/REF for 10 s to obtain an average value, before the contact was brokenby retracting the pipette of 10 mm. The micropipette was subsequently displacedlaterally by 5 mm to the next location and themeasuring cycle was repeated, until atotal displacement of 150 mm was reached. The results obtained are presented inFig. 1b and showed a large variability in the measured ECORR, with an averagevalue of �1.61 V vs. Ag|AgCl (full line), which is lower than the reported macro-scopic value of �1.53 V vs. Ag|AgCl (dotted line).47 This variation of the measuredlocal ECORR (represented as black, grey and white squares in Fig. 1b) is consistentwith an heterogeneous distribution of phases across the ZEK100 Mg alloysurface.47 Interestingly, the ECORR value of�1.38 V vs. Ag|AgCl, that was measuredat x ¼ 25 mm, is believed to be associated with a Zr particle. The size of themicropipette (500 nm aperture) used to perform this measurement is smallerthen the size of these cathodic particles (<5 mm), thus isolating them for a localECORR measurement. These results are in agreement with previous resultsobtained by SKPFM, where Zr particles were shown to exhibit a Volta potentialdifference with the a-Mg-matrix of �180–250 mV.50,51 The lower ECORR, whitesquares, are believed to be associated with the secondary Mg–Zn–Nd phase whilethe grey squares, with the most negative ECORR, are believed to be associated withthe a-Mg matrix.
Given the restricted solvent window of the corroding solution, it is evident thatthe SDC methodology is useful in tracking the local ECORR of a heterogeneous Mgalloy but lacks the capability to quantify local electrochemical uxes generated bythe ZEK100 microstructure. To track the Mg2+ release or molecular H2 uxes,micropotentiometric and microamperometric sensors, routinely used in SECM,are required. Currently, quantitative SECM studies of Mg materials are oenrestricted to corrosion initiation events where variations in topography are in theorder of a few microns. This restriction is due to an inability to correlate the
336 | Faraday Discuss., 2015, 180, 331–345 This journal is © The Royal Society of Chemistry 2015
Paper Faraday DiscussionsPu
blis
hed
on 1
6 Ja
nuar
y 20
15. D
ownl
oade
d by
Uni
vers
ity o
f W
este
rn O
ntar
io o
n 22
/03/
2016
20:
49:1
3.
View Article Online
material ux measured by the electrochemical probes with the observed localcorrosion rates due to the lack of associated topographical information.
This situation is clearly unsatisfactory, so to quantify local corrosion ratesoccurring during microgalvanic corrosion and for galvanically coupled materials,a SF controlled SECM methodology was developed. This methodology can beeasily adapted to a number of SECM uni- or multi-functional probes includingamperometric MEs or potentiometric sensors.
3.2 SF controlled scanning micropipette method: positioning and calibration
SF sensitive frequencies are tip-to-substrate distance sensitive, making themideal to probe surface topography and regulate the tip-to-substrate separation.The identication of these SF sensitive frequencies can be divided in threesteps.16,29
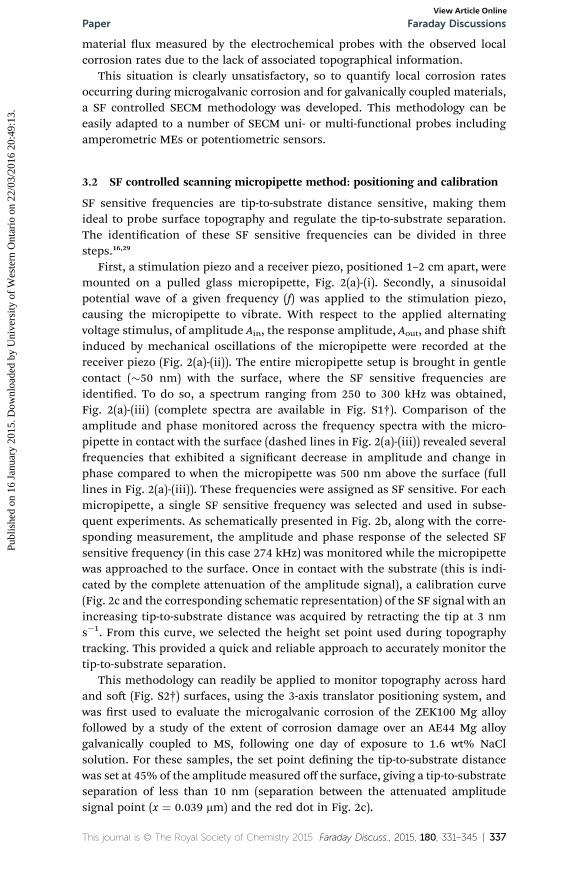
First, a stimulation piezo and a receiver piezo, positioned 1–2 cm apart, weremounted on a pulled glass micropipette, Fig. 2(a)-(i). Secondly, a sinusoidalpotential wave of a given frequency (f) was applied to the stimulation piezo,causing the micropipette to vibrate. With respect to the applied alternatingvoltage stimulus, of amplitude Ain, the response amplitude, Aout, and phase shiinduced by mechanical oscillations of the micropipette were recorded at thereceiver piezo (Fig. 2(a)-(ii)). The entire micropipette setup is brought in gentlecontact (�50 nm) with the surface, where the SF sensitive frequencies areidentied. To do so, a spectrum ranging from 250 to 300 kHz was obtained,Fig. 2(a)-(iii) (complete spectra are available in Fig. S1†). Comparison of theamplitude and phase monitored across the frequency spectra with the micro-pipette in contact with the surface (dashed lines in Fig. 2(a)-(iii)) revealed severalfrequencies that exhibited a signicant decrease in amplitude and change inphase compared to when the micropipette was 500 nm above the surface (fulllines in Fig. 2(a)-(iii)). These frequencies were assigned as SF sensitive. For eachmicropipette, a single SF sensitive frequency was selected and used in subse-quent experiments. As schematically presented in Fig. 2b, along with the corre-sponding measurement, the amplitude and phase response of the selected SFsensitive frequency (in this case 274 kHz) was monitored while the micropipettewas approached to the surface. Once in contact with the substrate (this is indi-cated by the complete attenuation of the amplitude signal), a calibration curve(Fig. 2c and the corresponding schematic representation) of the SF signal with anincreasing tip-to-substrate distance was acquired by retracting the tip at 3 nms�1. From this curve, we selected the height set point used during topographytracking. This provided a quick and reliable approach to accurately monitor thetip-to-substrate separation.
This methodology can readily be applied to monitor topography across hardand so (Fig. S2†) surfaces, using the 3-axis translator positioning system, andwas rst used to evaluate the microgalvanic corrosion of the ZEK100 Mg alloyfollowed by a study of the extent of corrosion damage over an AE44 Mg alloygalvanically coupled to MS, following one day of exposure to 1.6 wt% NaClsolution. For these samples, the set point dening the tip-to-substrate distancewas set at 45% of the amplitude measured off the surface, giving a tip-to-substrateseparation of less than 10 nm (separation between the attenuated amplitudesignal point (x ¼ 0.039 mm) and the red dot in Fig. 2c).
This journal is © The Royal Society of Chemistry 2015 Faraday Discuss., 2015, 180, 331–345 | 337
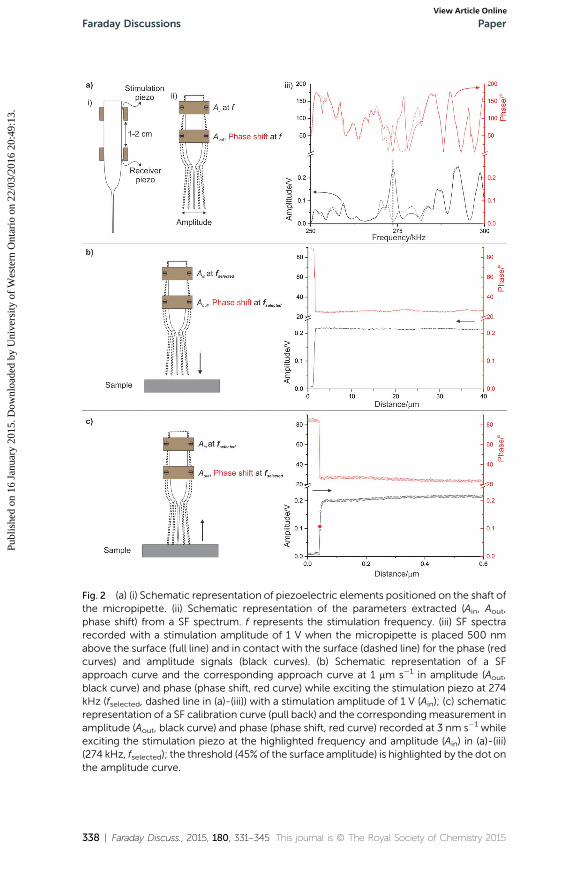
Fig. 2 (a) (i) Schematic representation of piezoelectric elements positioned on the shaft ofthe micropipette. (ii) Schematic representation of the parameters extracted (Ain, Aout,phase shift) from a SF spectrum. f represents the stimulation frequency. (iii) SF spectrarecorded with a stimulation amplitude of 1 V when the micropipette is placed 500 nmabove the surface (full line) and in contact with the surface (dashed line) for the phase (redcurves) and amplitude signals (black curves). (b) Schematic representation of a SFapproach curve and the corresponding approach curve at 1 mm s�1 in amplitude (Aout,black curve) and phase (phase shift, red curve) while exciting the stimulation piezo at 274kHz (fselected, dashed line in (a)-(iii)) with a stimulation amplitude of 1 V (Ain); (c) schematicrepresentation of a SF calibration curve (pull back) and the correspondingmeasurement inamplitude (Aout, black curve) and phase (phase shift, red curve) recorded at 3 nm s�1 whileexciting the stimulation piezo at the highlighted frequency and amplitude (Ain) in (a)-(iii)(274 kHz, fselected); the threshold (45% of the surface amplitude) is highlighted by the dot onthe amplitude curve.
Faraday Discussions Paper
338 | Faraday Discuss., 2015, 180, 331–345 This journal is © The Royal Society of Chemistry 2015
Publ
ishe
d on
16
Janu
ary
2015
. Dow
nloa
ded
by U
nive
rsity
of
Wes
tern
Ont
ario
on
22/0
3/20
16 2
0:49
:13.
View Article Online
Paper Faraday DiscussionsPu
blis
hed
on 1
6 Ja
nuar
y 20
15. D
ownl
oade
d by
Uni
vers
ity o
f W
este
rn O
ntar
io o
n 22
/03/
2016
20:
49:1
3.
View Article Online
3.3 Tracking ZEK100 microgalvanic corrosion depths using the SF constantdistance mode
Mg and its alloys not only corrode when galvanically coupled but also as stand-alone materials. Although the severity of corrosion is far less when micro-galvanically corroding, (�10–1000 mm per year36 when galvanically coupled vs.�<10 mm per year12), it is mandatory that the SF methodology, in order to remaina competitive ex situ alternative, is able to track subtle microscopic features. Toverify if SF has the capability of tracking microgalvanic corrosion features, aZEK100 Mg alloy was corroded for a day and the corresponding SF results werebenchmarked to standard CLSM.
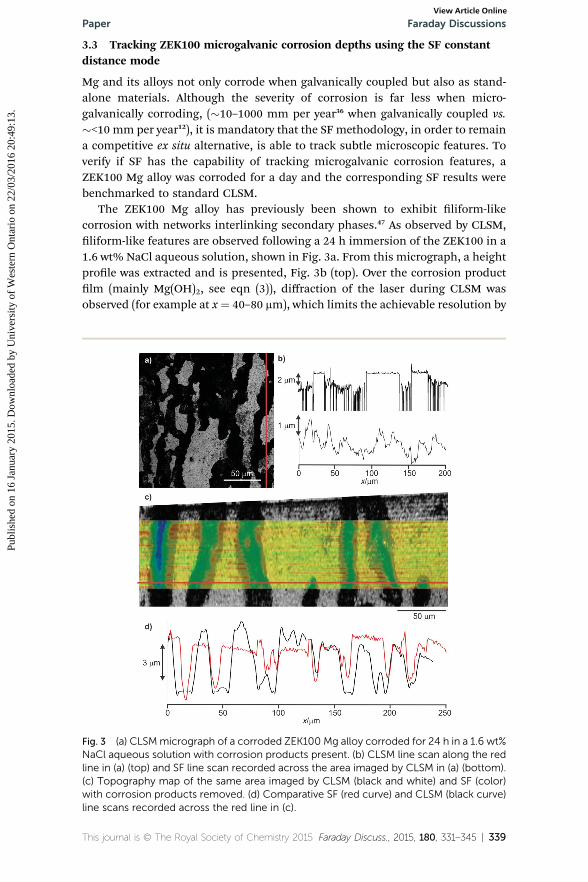
The ZEK100 Mg alloy has previously been shown to exhibit liform-likecorrosion with networks interlinking secondary phases.47 As observed by CLSM,liform-like features are observed following a 24 h immersion of the ZEK100 in a1.6 wt% NaCl aqueous solution, shown in Fig. 3a. From this micrograph, a heightprole was extracted and is presented, Fig. 3b (top). Over the corrosion productlm (mainly Mg(OH)2, see eqn (3)), diffraction of the laser during CLSM wasobserved (for example at x¼ 40–80 mm), which limits the achievable resolution by
Fig. 3 (a) CLSMmicrograph of a corroded ZEK100 Mg alloy corroded for 24 h in a 1.6 wt%NaCl aqueous solution with corrosion products present. (b) CLSM line scan along the redline in (a) (top) and SF line scan recorded across the area imaged by CLSM in (a) (bottom).(c) Topography map of the same area imaged by CLSM (black and white) and SF (color)with corrosion products removed. (d) Comparative SF (red curve) and CLSM (black curve)line scans recorded across the red line in (c).
This journal is © The Royal Society of Chemistry 2015 Faraday Discuss., 2015, 180, 331–345 | 339
Faraday Discussions PaperPu
blis
hed
on 1
6 Ja
nuar
y 20
15. D
ownl
oade
d by
Uni
vers
ity o
f W
este
rn O
ntar
io o
n 22
/03/
2016
20:
49:1
3.
View Article Online
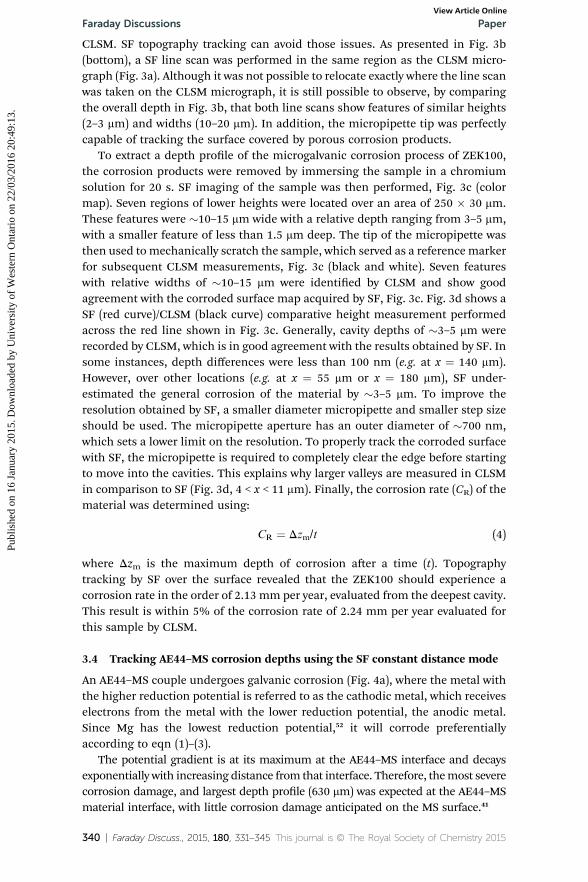
CLSM. SF topography tracking can avoid those issues. As presented in Fig. 3b(bottom), a SF line scan was performed in the same region as the CLSM micro-graph (Fig. 3a). Although it was not possible to relocate exactly where the line scanwas taken on the CLSM micrograph, it is still possible to observe, by comparingthe overall depth in Fig. 3b, that both line scans show features of similar heights(2–3 mm) and widths (10–20 mm). In addition, the micropipette tip was perfectlycapable of tracking the surface covered by porous corrosion products.
To extract a depth prole of the microgalvanic corrosion process of ZEK100,the corrosion products were removed by immersing the sample in a chromiumsolution for 20 s. SF imaging of the sample was then performed, Fig. 3c (colormap). Seven regions of lower heights were located over an area of 250 � 30 mm.These features were �10–15 mm wide with a relative depth ranging from 3–5 mm,with a smaller feature of less than 1.5 mm deep. The tip of the micropipette wasthen used to mechanically scratch the sample, which served as a reference markerfor subsequent CLSM measurements, Fig. 3c (black and white). Seven featureswith relative widths of �10–15 mm were identied by CLSM and show goodagreement with the corroded surface map acquired by SF, Fig. 3c. Fig. 3d shows aSF (red curve)/CLSM (black curve) comparative height measurement performedacross the red line shown in Fig. 3c. Generally, cavity depths of �3–5 mm wererecorded by CLSM, which is in good agreement with the results obtained by SF. Insome instances, depth differences were less than 100 nm (e.g. at x ¼ 140 mm).However, over other locations (e.g. at x ¼ 55 mm or x ¼ 180 mm), SF under-estimated the general corrosion of the material by �3–5 mm. To improve theresolution obtained by SF, a smaller diameter micropipette and smaller step sizeshould be used. The micropipette aperture has an outer diameter of �700 nm,which sets a lower limit on the resolution. To properly track the corroded surfacewith SF, the micropipette is required to completely clear the edge before startingto move into the cavities. This explains why larger valleys are measured in CLSMin comparison to SF (Fig. 3d, 4 < x < 11 mm). Finally, the corrosion rate (CR) of thematerial was determined using:
CR ¼ Dzm/t (4)
where Dzm is the maximum depth of corrosion aer a time (t). Topographytracking by SF over the surface revealed that the ZEK100 should experience acorrosion rate in the order of 2.13 mm per year, evaluated from the deepest cavity.This result is within 5% of the corrosion rate of 2.24 mm per year evaluated forthis sample by CLSM.
3.4 Tracking AE44–MS corrosion depths using the SF constant distance mode
An AE44–MS couple undergoes galvanic corrosion (Fig. 4a), where the metal withthe higher reduction potential is referred to as the cathodic metal, which receiveselectrons from the metal with the lower reduction potential, the anodic metal.Since Mg has the lowest reduction potential,52 it will corrode preferentiallyaccording to eqn (1)–(3).
The potential gradient is at its maximum at the AE44–MS interface and decaysexponentially with increasing distance from that interface. Therefore, themost severecorrosion damage, and largest depth prole (630 mm) was expected at the AE44–MSmaterial interface, with little corrosion damage anticipated on the MS surface.41
340 | Faraday Discuss., 2015, 180, 331–345 This journal is © The Royal Society of Chemistry 2015

Fig. 4 (a) Schematic representation of an AE44–MS galvanic couple immersed in a 1.6 wt% NaCl solution generating Mg2+ at the anode and H2 at the cathode; (b) stepper (s) andpiezo (p) motor position schematic representation (not to scale), as the micropipette isscanned over the mixed material interface; (c) depth profile of a corroded 10–10 mmAE44–MS galvanic couple immersed in a 1.6 wt% NaCl solution for 24 hours, imaged usingprofilometry; the dashed line represents the interface between AE44 and MS; (d) line scanin SF (black line) and profilometry (red line) selected at y ¼ 1.95 mm (highlighted full lineshown in (c)). The negative distances represent the AE44 alloy while positive distancesrepresent MS.
Paper Faraday DiscussionsPu
blis
hed
on 1
6 Ja
nuar
y 20
15. D
ownl
oade
d by
Uni
vers
ity o
f W
este
rn O
ntar
io o
n 22
/03/
2016
20:
49:1
3.
View Article Online
First, the topography was mapped by SF by scanning the micropipette from theMS towards the Mg alloy, using a frequency of 274 kHz and a stimulationamplitude of 1 V, as determined by the calibration measurement (Fig. 2c). Asschematically represented in Fig. 4b, SF measurements were performed using ahopping mode methodology, where the micropipette was lowered at 10 nm s�1
towards the substrate and the approach stopped when the oscillation amplitudemeasured at the receiver piezo decreased from 0.2 V to 0.11 V. The height wasrecorded, before the micropipette was retracted 4 mm and moved to the next x,ycoordinate. To achieve the large z travel distance suitable for measuring the steepedge due to galvanic coupling, translation of the probe was performed by thecombination of the close looped z stepper motor and z piezo motion, providing amaximum z working distance of 40 mm. Here, the piezo motor had a maximumtravel distance of 50 mm in the z direction. The approach was primarily performedusing the piezo motor, however when it reached its maximal travel distance, the zstepper motor was used to reposition the micropipette at a suitable height for a zpiezo approach. In this way changes in topography, which exceed the range of thepiezo motor alone, can be accurately tracked (see piezo and stepper motor posi-tions in Fig. 4b).
3.5 Evaluating the corrosion rate of galvanically coupled AE44
The extent of corrosion damage was rst measured by prolometry using axialchromatism (Fig. 4c). In the presented case, a 10 mm sampling size was used to
This journal is © The Royal Society of Chemistry 2015 Faraday Discuss., 2015, 180, 331–345 | 341

Faraday Discussions PaperPu
blis
hed
on 1
6 Ja
nuar
y 20
15. D
ownl
oade
d by
Uni
vers
ity o
f W
este
rn O
ntar
io o
n 22
/03/
2016
20:
49:1
3.
View Article Online
obtain a large scan area. A maximum corrosion depth of 840 mm was observedalong the AE44–MS interface (x ¼ 0), which is in excellent agreement withprevious studies performed under the same conditions.36 The corrosion depthdecreased with increasing distance from the interface until x ¼ �9 mm where anincrease in corrosion rate, consistent with an edge effect, was observed.41 As withthe CLSM experiments, diffraction effects were also observed during the prol-ometry experiment. The black areas observed in Fig. 4c represent spots where thenon-contact prolometer suffered from diffraction artifacts.
Fig. 4d shows line scans acquired by SF (black line) and prolometry (red line)at the same location on the AE44–MS and showed excellent agreement. Nosignicant topographical variations were observed between the techniques overtheMS surface (0 < x < 4mm). Amaximal depth of 721 mmat the galvanic interface(0 < x <�1 mm) is obtained by SF and is within a 5% error of what is measured onthe same sample by prolometry. As the tip moves away from the interface (�1 < x< �4 mm), the corrosion depth decreased due to the diminishing potentialgradient.
In order to achieve a resolution similar to prolometry using SF, it has beenreported by Etienne and co-workers that conical electrodes offer better tracking oftiny details present on a rough surface.33 Following the same strategy, we used a500 nm internal diameter aperture micropipette, which yielded more details ofthe scanned surface compared to prolometry, quantitatively providing a 2.7times improved aspect ratio (3600 for SF vs. 1360 for prolometry).
The corrosion rate of AE44 was calculated from the prolometry and SF linescans in Fig. 4d, using eqn (4), for t ¼ 24 h.36 The comparatively large corrosionrate of 263 mm year�1 has been attributed to the large corrosion potentialdifference (DECORR) between AE44 and MS (�1 V), creating a polarized galvaniccouple.36 These data are in agreement with the previously reported corrosion rateof 243 mm year�1.36
4 Conclusion
We have demonstrated that the SF methodology can accurately track millimeterandmicroscale topographical features over corroded samples. A micropipette waspositioned at a constant distance above galvanically and microgalvanicallycorroded Mg alloys. Using a SF control set point to regulate the piezoelectricmotors and by combining a long range stepper motor with the ne control of thepiezoelectric motor, small (ca. 1.4 mm height over 250 mm lateral translation) andlarge depth proles (ca. 0.72 mm height over 4 mm lateral translation) have beenrecorded. Importantly, this methodology was successful in tracking high aspectratio features of a severely corroded AE44–MS galvanic couple. The resultingcorrosion rate and depth proles are consistent within 5% with ex situ prol-ometry and previous literature results. Similar agreement is obtained whencomparing the corrosion rate of a ZEK100 Mg alloy, corroded for 24 h in the samesolution and obtained by SF topography tracking, with that obtained by CLSM.The SF methodology was shown to be capable of acquiring the overall surfacetopography of a large area (250 � 30 mm) with excellent spatial resolution,showing the robustness of the technique.
The SF methodology presented can be readily applied during a SECMmeasurement to produce both in situ reactivity and topographical data. Moreover,
342 | Faraday Discuss., 2015, 180, 331–345 This journal is © The Royal Society of Chemistry 2015
Paper Faraday DiscussionsPu
blis
hed
on 1
6 Ja
nuar
y 20
15. D
ownl
oade
d by
Uni
vers
ity o
f W
este
rn O
ntar
io o
n 22
/03/
2016
20:
49:1
3.
View Article Online
by using the SF methodology and dual probes, already envisioned for corrosioncharacterization, it will be possible to measure simultaneously several electro-chemical uxes while concomitantly tracking the surface topography. Thisconcomitant knowledge is a prerequisite to the successful development of futureSECM predictive numerical models.
Acknowledgements
This work was supported in part by the Natural Sciences and EngineeringResearch Council of Canada (NSERC) and General Motors of Canada. We thankSteen B. Schougaard for fruitful discussions. We thank Jon Carter and JustinGammage fromGeneral Motors for providing the samples and helpful discussion.Luis Calzado, Monique Vasseur and Pellumb Jakupi are acknowledged for theirtechnical expertise in prolometry and/or CLSM.
References
1 D. E. Tallman and M. B. Jensen, in Scanning Electrochemical Microscopy, CRCPress, 2nd edn, 2012, pp. 451–488.
2 L. Niu, Y. Yin, W. Guo, M. Lu, R. Qin and S. Chen, J. Mater. Sci., 2009, 44, 4511–4521.
3 M. V. Mirkin, W. Nogala, J. Velmurugan and Y. Wang, Phys. Chem. Chem. Phys.,2011, 13, 21196–21212.
4 K. Eckhard, M. Etienne, A. Schulte andW. Schuhmann, Electrochem. Commun.,2007, 9, 1793–1797.
5 M. Pahler, J. J. Santana, W. Schuhmann and R. M. Souto, Chem.–Eur. J., 2011,17, 905–911.
6 J. J. Santana, M. Pahler, W. Schuhmann and R. M. Souto, ChemPlusChem, 2012,77, 707–712.
7 H. Krawiec, V. Vignal, O. Heintz, P. Ponthiaux and F. Wenger, J. Electrochem.Soc., 2008, 155, C127–C130.
8 P. Dauphin-Ducharme, R. M. Asmussen, D. W. Shoesmith and J. Mauzeroll, J.Electroanal. Chem., 2015, 736, 61–68.
9 J. Izquierdo, A. Kiss, J. J. Santana, L. Nagy, I. Bitter, H. S. Isaacs, G. Nagy andR. M. Souto, J. Electrochem. Soc., 2013, 160, C451–C459.
10 S. S. Jamali, S. E. Moulton, D. E. Tallman, M. Forsyth, J. Weber andG. G. Wallace, Corros. Sci., 2014, 86, 93–100.
11 W. Liu, F. Cao, Y. Xia, L. Chang and J. Zhang, Electrochim. Acta, 2014, 132, 377–388.
12 P. Dauphin-Ducharme, R. Matthew Asmussen, U. M. Tefashe, M. Danaie,W. Jeffrey Binns, P. Jakupi, G. A. Botton, D. W. Shoesmith and J. Mauzeroll,J. Electrochem. Soc., 2014, 161, C557–C564.
13 U. M. Tefashe, M. E. Snowden, P. Dauphin-Ducharme, M. Danaie, G. A. Bottonand J. Mauzeroll, J. Electroanal. Chem., 2014, 720–721, 121–127.
14 S. S. Jamali, S. E. Moulton, D. E. Tallman, M. Forsyth, J. Weber andG. G. Wallace, Electrochim. Acta, 2015, 152, 294–301.
15 United States Automotive Materials Partnership, Magnesium Vision 2020, ANorth American Automotive Strategic Vision for Magnesium, Department ofEnergy National Energy Technology Laboratory, USA, 2004.
This journal is © The Royal Society of Chemistry 2015 Faraday Discuss., 2015, 180, 331–345 | 343

Faraday Discussions PaperPu
blis
hed
on 1
6 Ja
nuar
y 20
15. D
ownl
oade
d by
Uni
vers
ity o
f W
este
rn O
ntar
io o
n 22
/03/
2016
20:
49:1
3.
View Article Online
16 C. Cougnon, K. Bauer-Espindola, D. S. Fabre and J. Mauzeroll, Anal. Chem.,2009, 81, 3654–3659.
17 Y. Lee, Z. Ding and A. J. Bard, Anal. Chem., 2002, 74, 3634–3643.18 H. Yamada, H. Fukumoto, T. Yokoyama and T. Koike, Anal. Chem., 2005, 77,
1785–1790.19 Y. Takahashi, H. Shiku, T. Murata, T. Yasukawa and T. Matsue, Anal. Chem.,
2009, 81, 9674–9681.20 A. Kueng, C. Kranz, A. Lugstein, E. Bertagnolli and B. Mizaikoff, Angew. Chem.,
Int. Ed., 2003, 42, 3238–3240.21 A. Davoodi, J. Pan, C. Leygraf and S. Norgren, Electrochim. Acta, 2007, 52, 7697–
7705.22 A. Davoodi, J. Pan, C. Leygraf and S. Norgren, J. Electrochem. Soc., 2008, 155,
C211–C218.23 D. Ruhlig and W. Schuhmann, Electroanalysis, 2007, 19, 191–199.24 J. Izquierdo, S. Gonzalez and R. M. Souto, Int. J. Electrochem. Sci., 2012, 7,
11377–11388.25 P. M. Diakowski and Z. Ding, Electrochem. Commun., 2007, 9, 2617–2621.26 K. Borgwarth, D. Ebling and J. Heinze, Electrochim. Acta, 1995, 40, 1455–1460.27 M. Ludwig, C. Kranz, W. Schuhmann and H. E. Gaub, Rev. Sci. Instrum., 1995,
66, 2857–2860.28 A. Hengstenberg, C. Kranz and W. Schuhmann, Chem.–Eur. J., 2000, 6, 1547–
1554.29 L. Danis, M. E. Snowden, U. M. Tefashe, C. N. Heinemann and J. Mauzeroll,
Electrochim. Acta, 2014, 136, 121–129.30 B. Ballesteros Katemann, A. Schulte and W. Schuhmann, Chem.–Eur. J., 2003,
9, 2025–2033.31 B. Ballesteros Katemann, A. Schulte andW. Schuhmann, Electroanalysis, 2004,
16, 60–65.32 M. Etienne, S. Lhenry, R. Cornut and C. Lefrou, Electrochim. Acta, 2013, 88,
877–884.33 M. Etienne, J.-P. Moulin and S. Gourhand, Electrochim. Acta, 2013, 110, 16–21.34 M. Etienne, B. Layoussi, T. Giornelli and D. Jacquet, Electrochem. Commun.,
2012, 15, 70–73.35 T. Cain, L. G. Bland, N. Birbilis and J. R. Scully, Corrosion, 2014, 70, 1043–1051.36 K. B. Deshpande, Corros. Sci., 2010, 52, 3514–3522.37 A. D. Sudholz, K. Gusieva, X. B. Chen, B. C. Muddle, M. A. Gibson and
N. Birbilis, Corros. Sci., 2011, 53, 2277–2282.38 R. Matthew Asmussen, W. Jeffrey Binns, P. Jakupi and D. Shoesmith, J.
Electrochem. Soc., 2014, 161, C501–C508.39 A. D. King, N. Birbilis and J. R. Scully, Electrochim. Acta, 2014, 121, 394–406.40 R. M. Asmussen, P. Jakupi, M. Danaie, G. A. Botton and D. W. Shoesmith,
Corros. Sci., 2013, 75, 114–122.41 D. Trinh, P. Dauphin Ducharme, U. Mengesha Tefashe, J. R. Kish and
J. Mauzeroll, Anal. Chem., 2012, 84, 9899–9906.42 H. Bohni, T. Suter and A. Schreyer, Electrochim. Acta, 1995, 40, 1361–1368.43 A. P. Sommer and R. P. Franke, Micron, 2002, 33, 227–231.44 M. Etienne, E. C. Anderson, S. R. Evans, W. Schuhmann and I. Fritsch, Anal.
Chem., 2006, 78, 7317–7324.
344 | Faraday Discuss., 2015, 180, 331–345 This journal is © The Royal Society of Chemistry 2015
Paper Faraday DiscussionsPu
blis
hed
on 1
6 Ja
nuar
y 20
15. D
ownl
oade
d by
Uni
vers
ity o
f W
este
rn O
ntar
io o
n 22
/03/
2016
20:
49:1
3.
View Article Online
45 M. Etienne, A. Schulte, S. Mann, G. Jordan, I. D. Dietzel and W. Schuhmann,Anal. Chem., 2004, 76, 3682–3688.
46 J. Min, L. Hector Jr, J. Lin and J. Carter, J. Mater. Eng. Perform., 2013, 22, 3324–3336.
47 R. M. Asmussen, W. J. Binns, P. Jakupi and D. Shoesmith, Corrosion, 2015, 71,242–254.
48 T. J. Smith and K. J. Stevenson, inHandbook of Electrochemistry, ed. C. G. Zoski,Elsevier, Amsterdam, 2007, pp. 73–110.
49 H. Krawiec, S. Stanek, V. Vignal, J. Lelito and J. S. Suchy, Corros. Sci., 2011, 53,3108–3113.
50 M. F. Hurley, C. M. Efaw, P. H. Davis, J. R. Croteau, E. Graugnard andN. Birbilis, Corrosion, 2015, 71, 160–170.
51 A. E. Coy, F. Viejo, P. Skeldon and G. E. Thompson, Corros. Sci., 2010, 52, 3896–3906.
52 A. S. G82–98, Annual Book of ASTM Standards, Development and Use of aGalvanic Series for Predicting Galvanic Corrosion Performance, ASTMInternational, Philadelphia, 2003.
This journal is © The Royal Society of Chemistry 2015 Faraday Discuss., 2015, 180, 331–345 | 345