Embed Size (px)
Citation preview
Molecules 2012, 17, 10000-10013; doi:10.3390/molecules170910000
molecules ISSN 1420-3049
www.mdpi.com/journal/molecules
Article
Determination of the Optical GAP in Thin Films of Amorphous Dilithium Phthalocyanine Using the Tauc and Cody Models
María Elena Sánchez-Vergara 1,*, Juan Carlos Alonso-Huitron 2, Arturo Rodriguez-Gómez 2
and Jerry N. Reider-Burstin 1
1 Faculty of Engineering, Anahuac University-Mexico North, Huixquilucan, Estado de México 52786,
Mexico; E-Mail: [email protected] 2 Institute of Materials Research, National Autonomous University in Mexico, México D.F. 04510,
Mexico; E-Mails: [email protected] (J.C.A.-H.); [email protected] (A.R.-G.)
* Author to whom correspondence should be addressed; E-Mail: [email protected];
Tel.: +52-55-5627-0210 (ext. 8188); Fax: +52-55-5328-8067.
Received: 1 April 2012; in revised form: 4 August 2012 / Accepted: 5 August 2012 /
Published: 24 August 2012
Abstract: Semiconducting thin films were grown on quartz substrates and crystalline silicon
wafers, using dilithium phthalocyanine and the organic ligands 2,6-dihydroxyanthraquinone
and 2,6-diaminoanthraquinone as the starting compounds. The films, thus obtained, were
characterized by Fourier Transform infrared (FTIR), fast atomic bombardment (FAB+)
mass and ultraviolet-visible (UV-Vis) spectroscopies. The surface morphology of these
films was analyzed by means of atomic force microscopy (AFM) and scanning electron
microscopy (SEM). It was found that the temperature-dependent electric current in all
cases showed a semiconductor behavior with conductivities on the order of 10−6·S cm−1,
whereas the highest value corresponded to the thin film based upon the bidentate amine.
The Tauc and Cody optical band gap values of thin films were calculated from the
absorption coefficients and were found to be around 1.5 eV, with another strong band
between 2.3 and 2.43 eV, arising from non-direct transitions. The curvature in the Tauc
plot influencing the determination of the optical gap, the Tauc optical gap corresponding to
the thicker film is smaller. The dependence of the Cody optical gap on the film thickness
was negligible.
Keywords: thin films; organic semiconductors; optical properties
OPEN ACCESS
Molecules 2012, 17 10001
1. Introduction
Optical absorption in amorphous semiconductors continues to be the focus of considerable study. In
a defect-free crystalline semiconductor, the absorption spectrum abruptly terminates at the energy gap.
In contrast, in an amorphous semiconductor, a tail in the absorption spectrum encroaches into the gap
region [1]. This tail in the optical absorption spectrum, arising as a consequence of the disorder which
characterizes these semiconductors, makes the absorption edge of an amorphous semiconductor
difficult to define experimentally. As a result, several models have been developed to describe the
electronic transition parameters such as the band gap and the peak transition energy [2]. For many
years, the Tauc model has served as the standard empirical model whereby the optical gap of an
amorphous semiconductor may be determined. The Tauc model has been applied to amorphous
phthalocyanines films, as well. However, few studies have been made to check their validity in the case
of two central metal atoms. It is worthwhile noting that these kinds of studies have attracted interest in
recent works due to their unique properties, such as semiconductivity and chemical stability [3,4].
The high thermal stability of metallophtalocyanines enables the deposition of thin films through
high-vacuum vaporization, as this method does not lead to the breakdown of the synthesized materials.
Metallophthalocyanines usually present a given crystalline form in thin films or end up being
amorphous, depending mainly upon the molecular self-stacking ability of the derivative, but also on
the thin film fabrication procedure [5]. Metallophtalocyanine thin films have been proposed for gas
sensing applications [6], solar cells, organic field-effect transistors and OLEDs [7]. These developments
have been instrumental in stimulating renewed interest regarding the electrical properties of a wide
range of phthalocyanine thin films and in their structural features, as well [6]. The phthalocyanine
ligands have rich coordination chemistries and can give rise to complexes with most metal elements [8].
The coordination of phthalocyanine ligands with lithium atoms forms monometallo- or dimetallo-
phthalocyanines. The oxidation of dilithium phthalocyanine (Li2Pc) generates monolithium phthalo-
cyanine (LiPc) which possesses a relatively high electric conductivity and has been recognized as an
intrinsic molecular semiconductor [9].
A simple method has been developed to synthesize an amorphous molecular semiconductor from
the chemical reaction of dilithium phthalocyanine and bidentate ligands like 2,6-dihydroxyanthraquinone
(anthraflavic acid) and 2,6-diaminoanthraquinone (compounds Li2PcL1 y Li2PcL2, respectively),
followed by a thermal evaporation. The film characterization was performed by using SEM and AFM
techniques and the electrical conductivity was measured at different temperatures in order to evaluate
the conductivity behavior of these films. In addition, the determination of some important optical
parameters, related to the principal optical transitions in the UV-Vis region, is reported as well.
Application of Tauc and Cody models was made to the deduction of a band gap. The optical gap
dependence upon the thickness of these thin films was evaluated. The application of the Tauc and the
Cody model enabled us to establish some important correlations between film structure and optical
absorption properties.
Molecules 2012, 17 10002
2. Results and Discussion
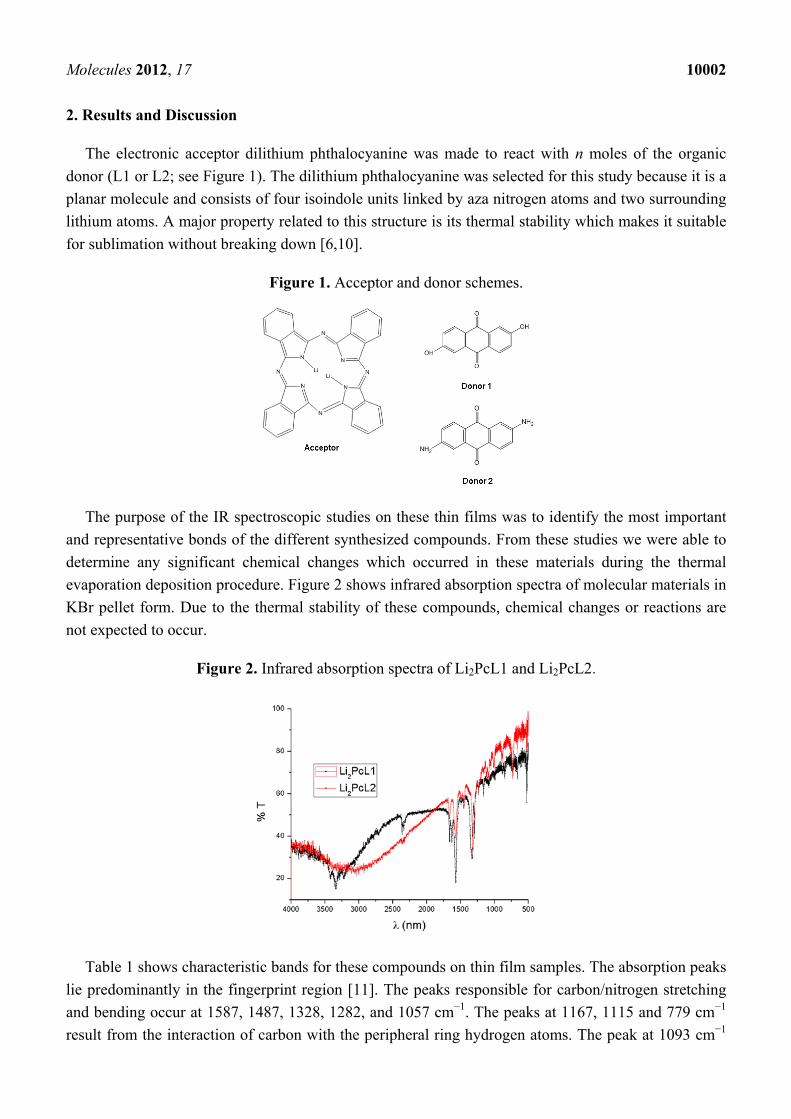
The electronic acceptor dilithium phthalocyanine was made to react with n moles of the organic
donor (L1 or L2; see Figure 1). The dilithium phthalocyanine was selected for this study because it is a
planar molecule and consists of four isoindole units linked by aza nitrogen atoms and two surrounding
lithium atoms. A major property related to this structure is its thermal stability which makes it suitable
for sublimation without breaking down [6,10].
Figure 1. Acceptor and donor schemes.
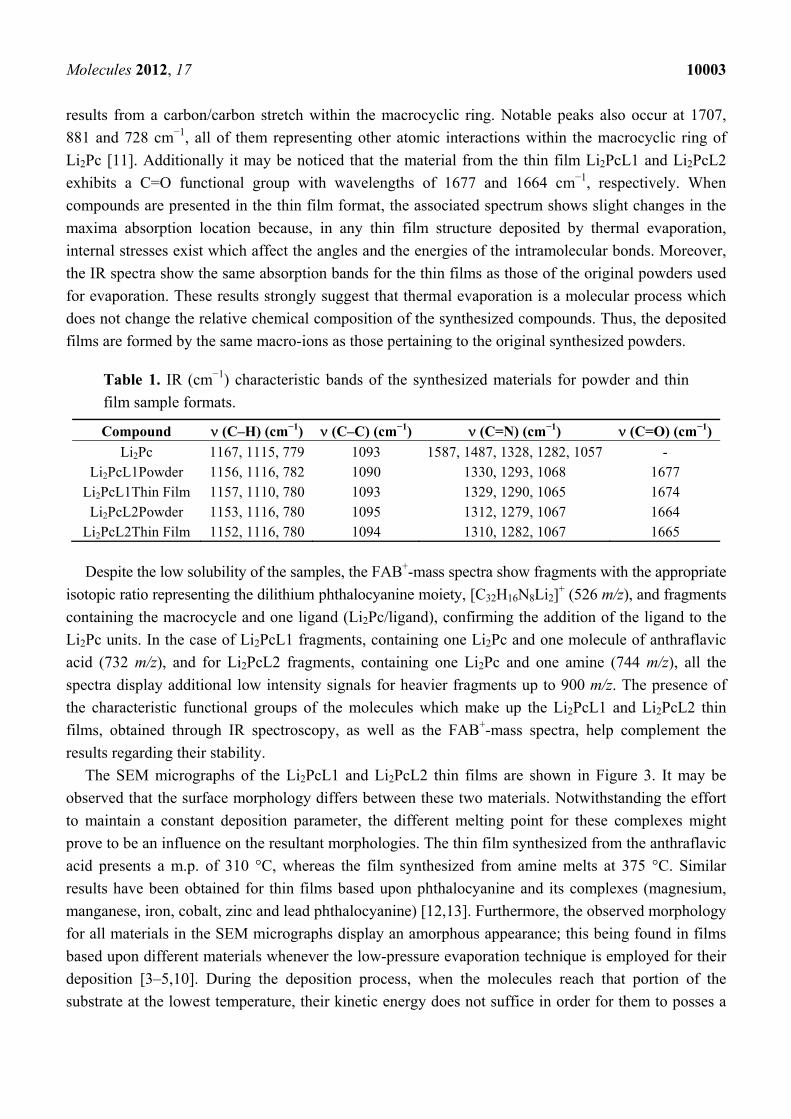
The purpose of the IR spectroscopic studies on these thin films was to identify the most important
and representative bonds of the different synthesized compounds. From these studies we were able to
determine any significant chemical changes which occurred in these materials during the thermal
evaporation deposition procedure. Figure 2 shows infrared absorption spectra of molecular materials in
KBr pellet form. Due to the thermal stability of these compounds, chemical changes or reactions are
not expected to occur.
Figure 2. Infrared absorption spectra of Li2PcL1 and Li2PcL2.
Table 1 shows characteristic bands for these compounds on thin film samples. The absorption peaks
lie predominantly in the fingerprint region [11]. The peaks responsible for carbon/nitrogen stretching
and bending occur at 1587, 1487, 1328, 1282, and 1057 cm−1. The peaks at 1167, 1115 and 779 cm−1
result from the interaction of carbon with the peripheral ring hydrogen atoms. The peak at 1093 cm−1
Molecules 2012, 17 10003
results from a carbon/carbon stretch within the macrocyclic ring. Notable peaks also occur at 1707,
881 and 728 cm−1, all of them representing other atomic interactions within the macrocyclic ring of
Li2Pc [11]. Additionally it may be noticed that the material from the thin film Li2PcL1 and Li2PcL2
exhibits a C=O functional group with wavelengths of 1677 and 1664 cm−1, respectively. When
compounds are presented in the thin film format, the associated spectrum shows slight changes in the
maxima absorption location because, in any thin film structure deposited by thermal evaporation,
internal stresses exist which affect the angles and the energies of the intramolecular bonds. Moreover,
the IR spectra show the same absorption bands for the thin films as those of the original powders used
for evaporation. These results strongly suggest that thermal evaporation is a molecular process which
does not change the relative chemical composition of the synthesized compounds. Thus, the deposited
films are formed by the same macro-ions as those pertaining to the original synthesized powders.
Table 1. IR (cm−1) characteristic bands of the synthesized materials for powder and thin
film sample formats.
Compound (C–H) (cm−1) (C–C) (cm−1) (C=N) (cm−1) (C=O) (cm−1)
Li2Pc 1167, 1115, 779 1093 1587, 1487, 1328, 1282, 1057 - Li2PcL1Powder 1156, 1116, 782 1090 1330, 1293, 1068 1677
Li2PcL1Thin Film 1157, 1110, 780 1093 1329, 1290, 1065 1674 Li2PcL2Powder 1153, 1116, 780 1095 1312, 1279, 1067 1664
Li2PcL2Thin Film 1152, 1116, 780 1094 1310, 1282, 1067 1665
Despite the low solubility of the samples, the FAB+-mass spectra show fragments with the appropriate
isotopic ratio representing the dilithium phthalocyanine moiety, [C32H16N8Li2]+ (526 m/z), and fragments
containing the macrocycle and one ligand (Li2Pc/ligand), confirming the addition of the ligand to the
Li2Pc units. In the case of Li2PcL1 fragments, containing one Li2Pc and one molecule of anthraflavic
acid (732 m/z), and for Li2PcL2 fragments, containing one Li2Pc and one amine (744 m/z), all the
spectra display additional low intensity signals for heavier fragments up to 900 m/z. The presence of
the characteristic functional groups of the molecules which make up the Li2PcL1 and Li2PcL2 thin
films, obtained through IR spectroscopy, as well as the FAB+-mass spectra, help complement the
results regarding their stability.
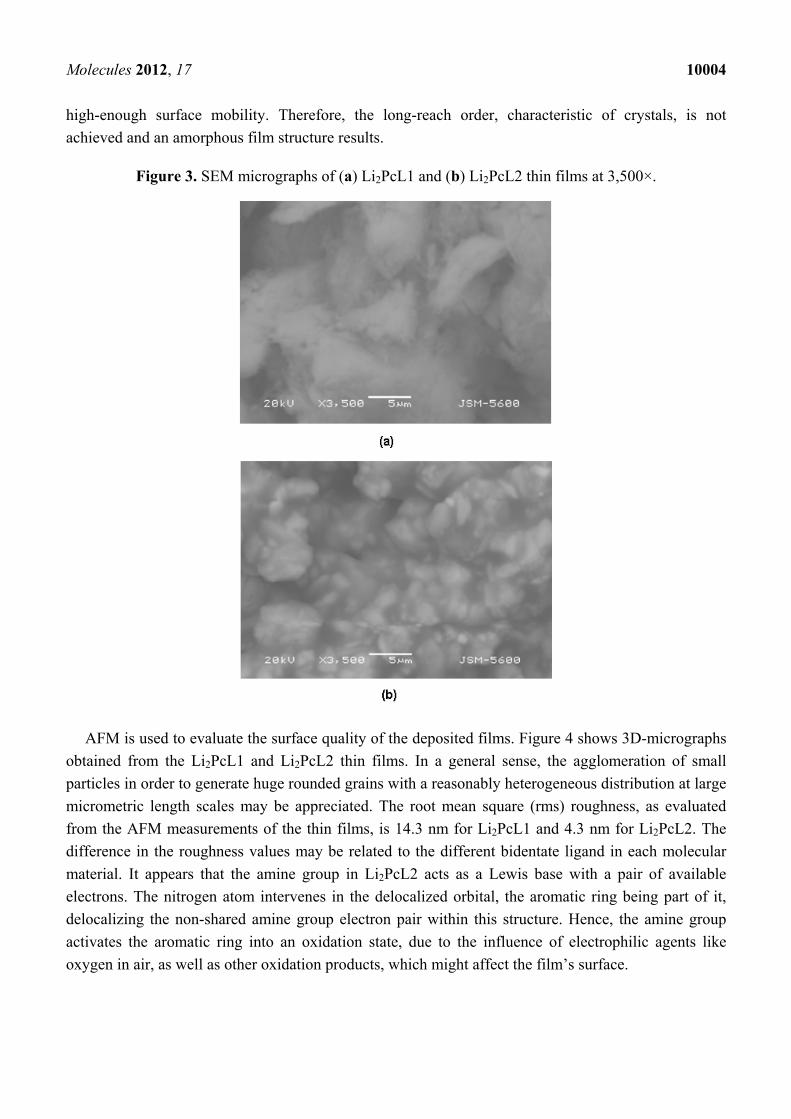
The SEM micrographs of the Li2PcL1 and Li2PcL2 thin films are shown in Figure 3. It may be
observed that the surface morphology differs between these two materials. Notwithstanding the effort
to maintain a constant deposition parameter, the different melting point for these complexes might
prove to be an influence on the resultant morphologies. The thin film synthesized from the anthraflavic
acid presents a m.p. of 310 °C, whereas the film synthesized from amine melts at 375 °C. Similar
results have been obtained for thin films based upon phthalocyanine and its complexes (magnesium,
manganese, iron, cobalt, zinc and lead phthalocyanine) [12,13]. Furthermore, the observed morphology
for all materials in the SEM micrographs display an amorphous appearance; this being found in films
based upon different materials whenever the low-pressure evaporation technique is employed for their
deposition [3–5,10]. During the deposition process, when the molecules reach that portion of the
substrate at the lowest temperature, their kinetic energy does not suffice in order for them to posses a
Molecules 2012, 17 10004
high-enough surface mobility. Therefore, the long-reach order, characteristic of crystals, is not
achieved and an amorphous film structure results.
Figure 3. SEM micrographs of (a) Li2PcL1 and (b) Li2PcL2 thin films at 3,500×.
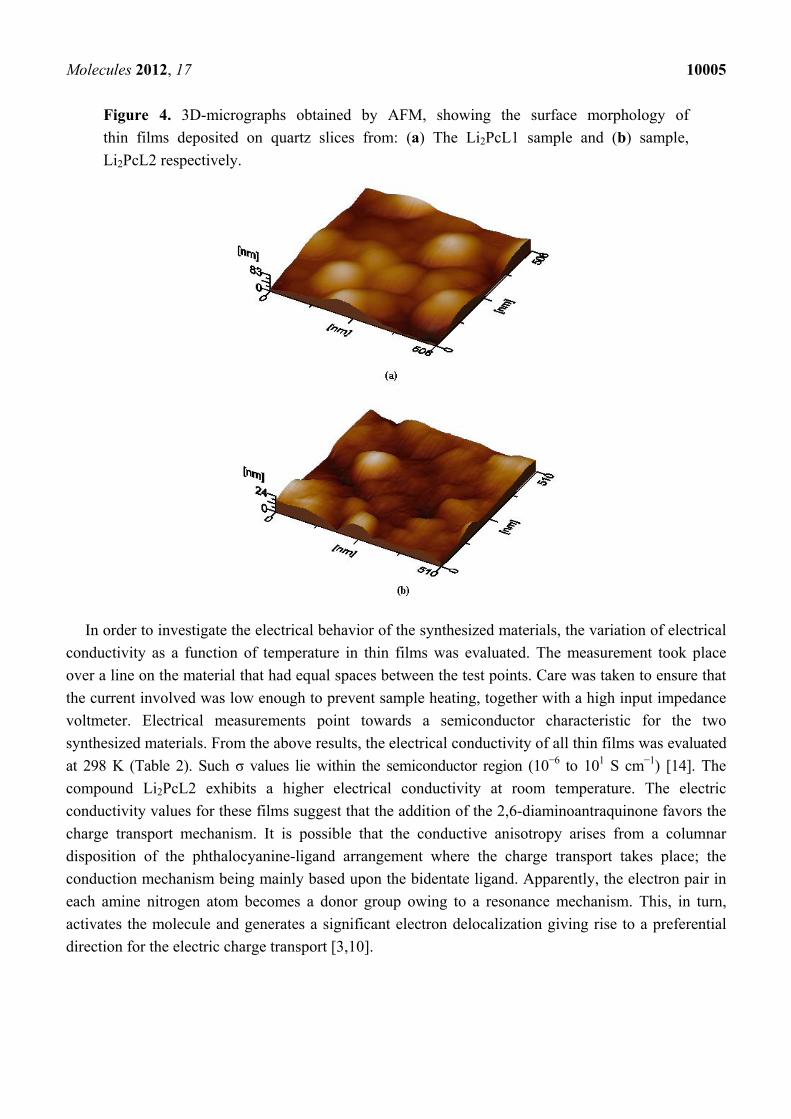
AFM is used to evaluate the surface quality of the deposited films. Figure 4 shows 3D-micrographs
obtained from the Li2PcL1 and Li2PcL2 thin films. In a general sense, the agglomeration of small
particles in order to generate huge rounded grains with a reasonably heterogeneous distribution at large
micrometric length scales may be appreciated. The root mean square (rms) roughness, as evaluated
from the AFM measurements of the thin films, is 14.3 nm for Li2PcL1 and 4.3 nm for Li2PcL2. The
difference in the roughness values may be related to the different bidentate ligand in each molecular
material. It appears that the amine group in Li2PcL2 acts as a Lewis base with a pair of available
electrons. The nitrogen atom intervenes in the delocalized orbital, the aromatic ring being part of it,
delocalizing the non-shared amine group electron pair within this structure. Hence, the amine group
activates the aromatic ring into an oxidation state, due to the influence of electrophilic agents like
oxygen in air, as well as other oxidation products, which might affect the film’s surface.
Molecules 2012, 17 10005
Figure 4. 3D-micrographs obtained by AFM, showing the surface morphology of
thin films deposited on quartz slices from: (a) The Li2PcL1 sample and (b) sample,
Li2PcL2 respectively.
In order to investigate the electrical behavior of the synthesized materials, the variation of electrical
conductivity as a function of temperature in thin films was evaluated. The measurement took place
over a line on the material that had equal spaces between the test points. Care was taken to ensure that
the current involved was low enough to prevent sample heating, together with a high input impedance
voltmeter. Electrical measurements point towards a semiconductor characteristic for the two
synthesized materials. From the above results, the electrical conductivity of all thin films was evaluated
at 298 K (Table 2). Such σ values lie within the semiconductor region (10−6 to 101 S cm−1) [14]. The
compound Li2PcL2 exhibits a higher electrical conductivity at room temperature. The electric
conductivity values for these films suggest that the addition of the 2,6-diaminoantraquinone favors the
charge transport mechanism. It is possible that the conductive anisotropy arises from a columnar
disposition of the phthalocyanine-ligand arrangement where the charge transport takes place; the
conduction mechanism being mainly based upon the bidentate ligand. Apparently, the electron pair in
each amine nitrogen atom becomes a donor group owing to a resonance mechanism. This, in turn,
activates the molecule and generates a significant electron delocalization giving rise to a preferential
direction for the electric charge transport [3,10].
Molecules 2012, 17 10006
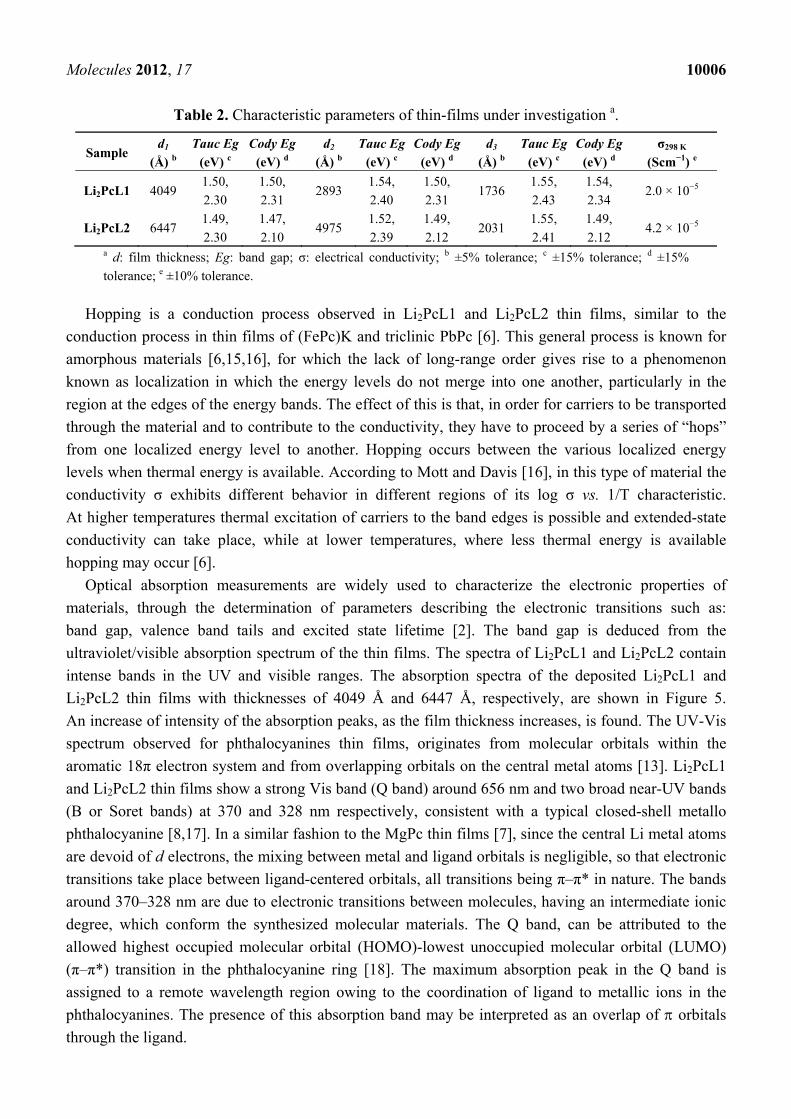
Table 2. Characteristic parameters of thin-films under investigation a.
Sample d1
(Å) b
Tauc Eg
(eV) c
Cody Eg
(eV) d
d2
(Å) b
Tauc Eg
(eV) c
Cody Eg
(eV) d
d3
(Å) b
Tauc Eg
(eV) c
Cody Eg
(eV) d
σ298 K
(Scm−1) e
Li2PcL1 4049 1.50,
2.30
1.50,
2.31 2893
1.54,
2.40
1.50,
2.31 1736
1.55,
2.43
1.54,
2.34 2.0 × 10⁻⁵
Li2PcL2 6447 1.49,
2.30
1.47,
2.10 4975
1.52,
2.39
1.49,
2.12 2031
1.55,
2.41
1.49,
2.12 4.2 × 10⁻⁵
a d: film thickness; Eg: band gap; σ: electrical conductivity; b ±5% tolerance; c ±15% tolerance; d ±15%
tolerance; e ±10% tolerance.
Hopping is a conduction process observed in Li2PcL1 and Li2PcL2 thin films, similar to the
conduction process in thin films of (FePc)K and triclinic PbPc [6]. This general process is known for
amorphous materials [6,15,16], for which the lack of long-range order gives rise to a phenomenon
known as localization in which the energy levels do not merge into one another, particularly in the
region at the edges of the energy bands. The effect of this is that, in order for carriers to be transported
through the material and to contribute to the conductivity, they have to proceed by a series of “hops”
from one localized energy level to another. Hopping occurs between the various localized energy
levels when thermal energy is available. According to Mott and Davis [16], in this type of material the
conductivity σ exhibits different behavior in different regions of its log σ vs. 1/T characteristic.
At higher temperatures thermal excitation of carriers to the band edges is possible and extended-state
conductivity can take place, while at lower temperatures, where less thermal energy is available
hopping may occur [6].
Optical absorption measurements are widely used to characterize the electronic properties of
materials, through the determination of parameters describing the electronic transitions such as:
band gap, valence band tails and excited state lifetime [2]. The band gap is deduced from the
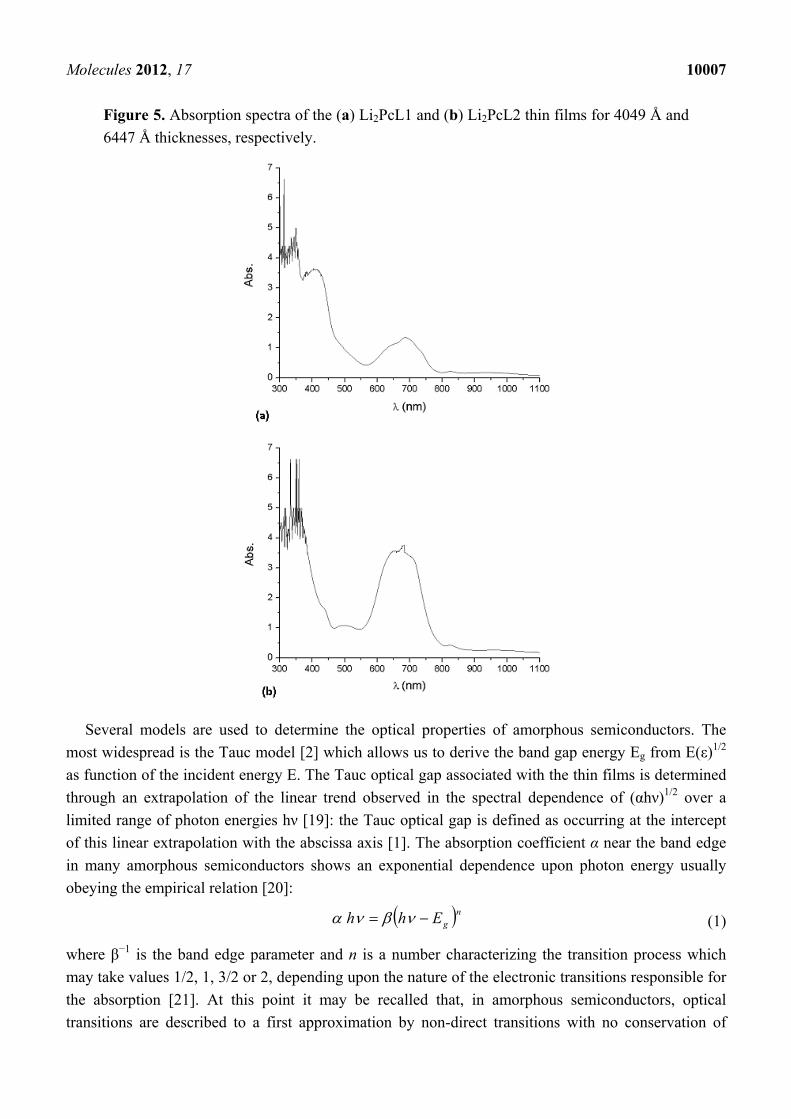
ultraviolet/visible absorption spectrum of the thin films. The spectra of Li2PcL1 and Li2PcL2 contain
intense bands in the UV and visible ranges. The absorption spectra of the deposited Li2PcL1 and
Li2PcL2 thin films with thicknesses of 4049 Å and 6447 Å, respectively, are shown in Figure 5.
An increase of intensity of the absorption peaks, as the film thickness increases, is found. The UV-Vis
spectrum observed for phthalocyanines thin films, originates from molecular orbitals within the
aromatic 18π electron system and from overlapping orbitals on the central metal atoms [13]. Li2PcL1
and Li2PcL2 thin films show a strong Vis band (Q band) around 656 nm and two broad near-UV bands
(B or Soret bands) at 370 and 328 nm respectively, consistent with a typical closed-shell metallo
phthalocyanine [8,17]. In a similar fashion to the MgPc thin films [7], since the central Li metal atoms
are devoid of d electrons, the mixing between metal and ligand orbitals is negligible, so that electronic
transitions take place between ligand-centered orbitals, all transitions being π–π* in nature. The bands
around 370–328 nm are due to electronic transitions between molecules, having an intermediate ionic
degree, which conform the synthesized molecular materials. The Q band, can be attributed to the
allowed highest occupied molecular orbital (HOMO)-lowest unoccupied molecular orbital (LUMO)
(π–π*) transition in the phthalocyanine ring [18]. The maximum absorption peak in the Q band is
assigned to a remote wavelength region owing to the coordination of ligand to metallic ions in the
phthalocyanines. The presence of this absorption band may be interpreted as an overlap of orbitals
through the ligand.
Molecules 2012, 17 10007
Figure 5. Absorption spectra of the (a) Li2PcL1 and (b) Li2PcL2 thin films for 4049 Å and
6447 Å thicknesses, respectively.
Several models are used to determine the optical properties of amorphous semiconductors. The
most widespread is the Tauc model [2] which allows us to derive the band gap energy Eg from E(ε)1/2
as function of the incident energy E. The Tauc optical gap associated with the thin films is determined
through an extrapolation of the linear trend observed in the spectral dependence of (αhν)1/2 over a
limited range of photon energies hν [19]: the Tauc optical gap is defined as occurring at the intercept
of this linear extrapolation with the abscissa axis [1]. The absorption coefficient α near the band edge
in many amorphous semiconductors shows an exponential dependence upon photon energy usually
obeying the empirical relation [20]:
ngEhh (1)
where β−1 is the band edge parameter and n is a number characterizing the transition process which
may take values 1/2, 1, 3/2 or 2, depending upon the nature of the electronic transitions responsible for
the absorption [21]. At this point it may be recalled that, in amorphous semiconductors, optical
transitions are described to a first approximation by non-direct transitions with no conservation of
Molecules 2012, 17 10008
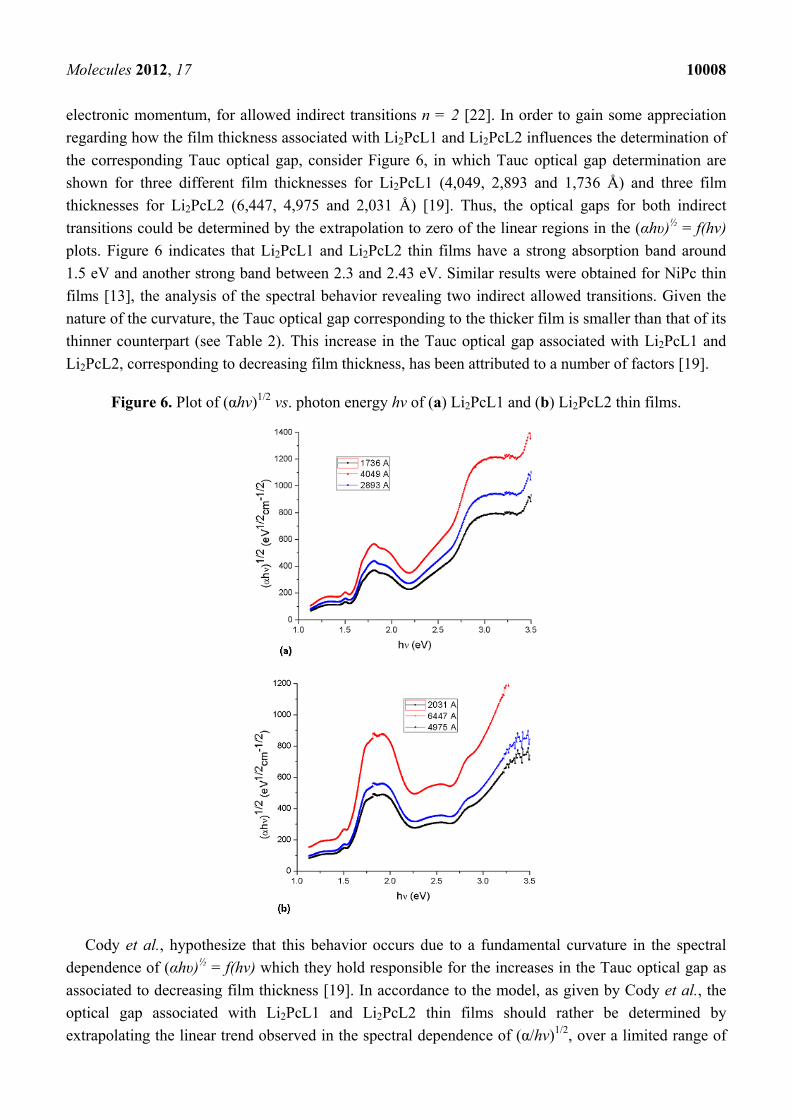
electronic momentum, for allowed indirect transitions n = 2 [22]. In order to gain some appreciation
regarding how the film thickness associated with Li2PcL1 and Li2PcL2 influences the determination of
the corresponding Tauc optical gap, consider Figure 6, in which Tauc optical gap determination are
shown for three different film thicknesses for Li2PcL1 (4,049, 2,893 and 1,736 Å) and three film
thicknesses for Li2PcL2 (6,447, 4,975 and 2,031 Å) [19]. Thus, the optical gaps for both indirect
transitions could be determined by the extrapolation to zero of the linear regions in the (αhυ)½ = f(hν)
plots. Figure 6 indicates that Li2PcL1 and Li2PcL2 thin films have a strong absorption band around
1.5 eV and another strong band between 2.3 and 2.43 eV. Similar results were obtained for NiPc thin
films [13], the analysis of the spectral behavior revealing two indirect allowed transitions. Given the
nature of the curvature, the Tauc optical gap corresponding to the thicker film is smaller than that of its
thinner counterpart (see Table 2). This increase in the Tauc optical gap associated with Li2PcL1 and
Li2PcL2, corresponding to decreasing film thickness, has been attributed to a number of factors [19].
Figure 6. Plot of (αhν)1/2 vs. photon energy hν of (a) Li2PcL1 and (b) Li2PcL2 thin films.
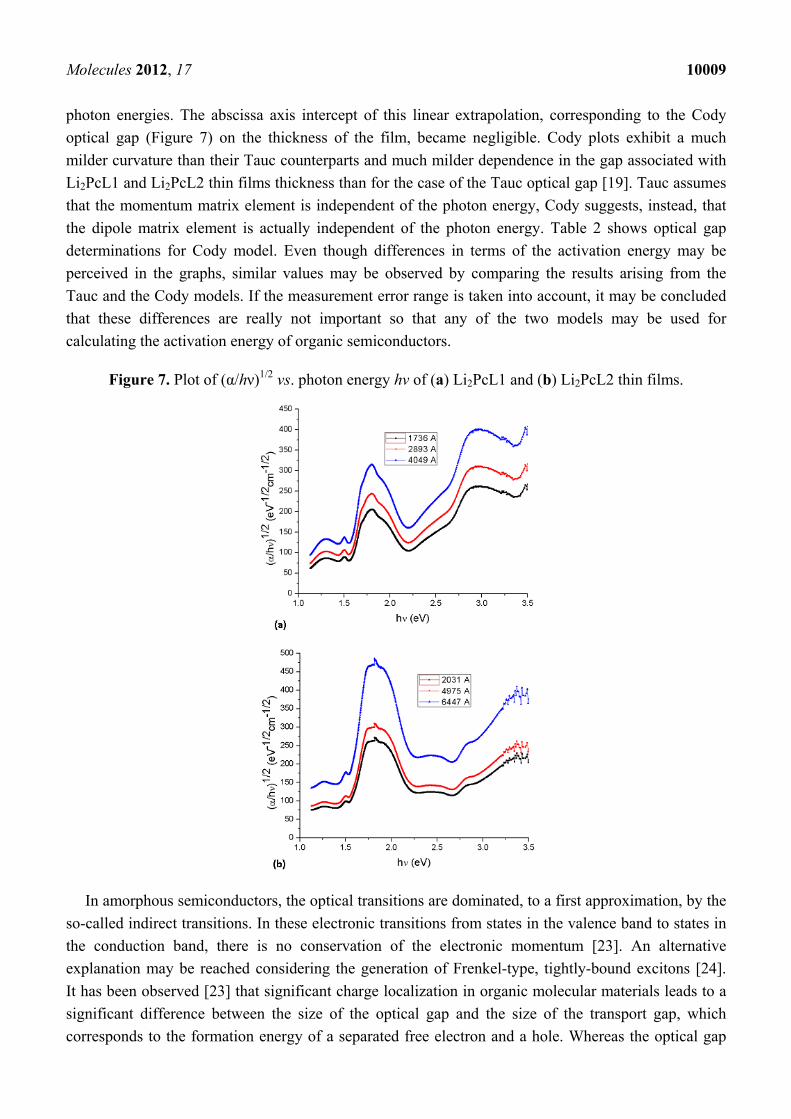
Cody et al., hypothesize that this behavior occurs due to a fundamental curvature in the spectral
dependence of (αhυ)½ = f(hν) which they hold responsible for the increases in the Tauc optical gap as
associated to decreasing film thickness [19]. In accordance to the model, as given by Cody et al., the
optical gap associated with Li2PcL1 and Li2PcL2 thin films should rather be determined by
extrapolating the linear trend observed in the spectral dependence of (α/hν)1/2, over a limited range of
Molecules 2012, 17 10009
photon energies. The abscissa axis intercept of this linear extrapolation, corresponding to the Cody
optical gap (Figure 7) on the thickness of the film, became negligible. Cody plots exhibit a much
milder curvature than their Tauc counterparts and much milder dependence in the gap associated with
Li2PcL1 and Li2PcL2 thin films thickness than for the case of the Tauc optical gap [19]. Tauc assumes
that the momentum matrix element is independent of the photon energy, Cody suggests, instead, that
the dipole matrix element is actually independent of the photon energy. Table 2 shows optical gap
determinations for Cody model. Even though differences in terms of the activation energy may be
perceived in the graphs, similar values may be observed by comparing the results arising from the
Tauc and the Cody models. If the measurement error range is taken into account, it may be concluded
that these differences are really not important so that any of the two models may be used for
calculating the activation energy of organic semiconductors.
Figure 7. Plot of (α/hν)1/2 vs. photon energy hν of (a) Li2PcL1 and (b) Li2PcL2 thin films.
In amorphous semiconductors, the optical transitions are dominated, to a first approximation, by the
so-called indirect transitions. In these electronic transitions from states in the valence band to states in
the conduction band, there is no conservation of the electronic momentum [23]. An alternative
explanation may be reached considering the generation of Frenkel-type, tightly-bound excitons [24].
It has been observed [23] that significant charge localization in organic molecular materials leads to a
significant difference between the size of the optical gap and the size of the transport gap, which
corresponds to the formation energy of a separated free electron and a hole. Whereas the optical gap
Molecules 2012, 17 10010
can be measured by optical absorption spectroscopy, the transport gap can be measured by ultraviolet
or inverse photoemission spectroscopy, the latter one being larger than the former by a quantity equal
to the binding energy of the Frenkel exciton.
3. Experimental
3.1. Starting Materials and Chemicals
All chemicals were reagent-grade from commercial suppliers. In this case, 2,6-diaminoanthraquinone
and 2,6-dihydroxyanthraquinone anthraquinone (anthraflavic acid) were used in order to generate a
double substitution between the organic compound and the dilithium phthalocyanine. Vibrational
spectra (4000–400 cm−1) were acquired with a Perkin-Elmer model Tensor 27 IR spectrophotometer.
The materials intended for the samples were hand-ground in an agate mortar and later pre-mixed
with KBr (spec pure). The resulting substances were then pressed into clear pellets. Mass spectra
(FAB+) were measured on a 3-nitrobenzyl alcohol support in the positive ion mode on a Jeol
JMS-SX102A instrument (Mexico City, México).
Synthesis of Li2PcL1: anthraflavic acid (0.12 g, 0.50 mmol) is dissolved in methanol (20 mL) for
two hours. Then dilithium phthalocyanine (0.12 g, 0.23 mmol) is added and the mixture refluxed for
72 h, then cooled to room temperature, filtered and washed with methanol. The resulting blue powder
was dried under high vacuum, to give a 73% yield of product, which was recrystallized from a 1:1
methanol–water mixture. MS (FAB+, DMSO/EtOH) m/z: 526 [C32H16N8Li2]+, 700 [C46H22N8Li2]
+, 732
[C46H22N8O2Li2]+.
Synthesis of Li2PcL2: following a similar procedure as for Li2PcL1, but using
2,6-diaminoanthraquinone (0.12 g, 0.50 mmol) and dilithium phthalocyanine (0.13 g, 0.25 mmol) a
75% yield of prodyt was obtained, which was recrystallized from a 1:1 methanol-water mixture.
MS (FAB+, DMSO/EtOH) m/z: 526 [C32H16N8Li2]+, 712 [C46H34N8Li2]
+, 744 [C46H34N8O2Li2]+.
3.2. Film Deposition
In order to achieve a high purity for these thin films, a vacuum chamber was used with a diffusion
pump and a special molybdenum crucible with a double-grid cover. Quartz fiber was added inside the
crucible to avoid the ejection of grains towards the substrate at a temperature of 553 K. The pure
material was deposited over quartz and (100) single-crystalline silicon (c-Si), 200 Ω-cm wafers. The
quartz substrates were ultrasonically degreased in warm methanol and dried under a nitrogen
atmosphere. The substrates underwent chemical etching with a p solution (10 mL HF, 15 mL HNO3
and 300 mL H2O) in order to remove the native oxide from the c-Si surface. The substrates were kept
at 298 K. The evaporation temperature in the boat was 553 K, which is lower than the decomposition
temperature of the materials synthesized for this study. This value was measured by means of a
chromel-alumel K-type thermocouple. All samples were obtained using the same deposition system,
with the crucible and substrates arranged in the same geometry. The base pressure in the deposition
chamber before thin-film deposition and the amount of matter inside the crucible were the same in all
cases. In spite of these similarities, significant differences in the thickness of the deposited films were
detected. According to the data in Table 1, the thin film synthesized from anthraflavic acid and
Molecules 2012, 17 10011
dilithium phtalocyanine ended up being thicker as compared to the film prepared with the
2,6-diaminoanthraquinone bidentate ligand [10]. The substitution of the OH group for NH2 in the
ligand causes a higher evaporation temperature for this compound.
3.3. Thin Film Characterization
Fourier Transform infrared spectra (FTIR) for thin films were recorded with a Nicolet 5-Mx FT-IR
spectrophotometer with a resolution of 4 cm−1. The surface characterization was made by scanning
electron microscopy (SEM) in a Leica Cambridge, Stereoscan 440 model (Mexico City, México).
A focal distance of 25 mm and a 20 kV potential were used for all the samples. The surface
morphology of films was analyzed by Atomic Force Microscopy (AFM) with a Jeol JSPM-4210 in
contact mode with tapping and non-contact silicon cantilevers (NSCIS). The thickness of films
was determined by ellipsometry using a Gaetner L117 variable-angle manual ellipsometer with a
helium-neon laser as a light source operating at 630 nm. The incidence angle was 70°. The infrared and
ellipsometric measurements were carried out in the film deposited onto c-Si substrates. Ultraviolet-
visible (UV-Vis) transmission and absorption spectra for films deposited onto naked quartz substrates
were obtained with a Shimadzu 260 double-beam spectrophotometer. Electric current as a function of
temperature was measured with an applied voltage of 100 V in the ohmic regime, using a Keithley
model 230 programmable voltage source and a Keithley model 485 peak-ammeter coupled to an
HP3421 data collector.
4. Conclusions
New semiconductor materials (Li2PcL1 and Li2PcL2) were synthesized from dilithium
phthalocyanine, 2,6-dihydroxianthraquinone and 2,6-diaminoanthraquinone and deposited by vacuum
thermal evaporation. Although the deposited material is amorphous in nature, it is formed by the same
chemical unit as that present in synthesized powder. From the electric current values, it is clear that all
the molecular thin films show a semiconductor-like behavior after evaporation, with conductivities in
the order of 10−6–10−1 S·cm−1 at room temperature. The UV-Vis optical transmission spectra were
analyzed in the edge strong absorption region. Li2PcL1 and Li2PcL2 presented two absorption bands,
namely the Q band in the visible region (around 650 nm) and two broad near-UV bands (B bands)
at 370 and 328 nm. Using the Tauc and Cody models, the optical gaps associated with thin films was
determined. The thickness in the thin films plays an important role in determining the Tauc optical
gap; the gap is larger for smaller film thickness. Although the Cody optical gap is less dependent upon
film thickness, both models estimate similar results regarding the activation energy. Finally, the value
of the calculated optical gaps, the order of magnitude of the electrical conductivities and the possibility
to prepare thin films from these materials suggest that it may be possible to apply them for preparing
electronic devices.
Acknowledgments
The authors wish to thank the technical assistance of Verónica García (IQ-UNAM) and M. Rivera
(IF-UNAM). Authors are grateful to Carlos Flores, from the atomic force microscopy laboratory at the
Molecules 2012, 17 10012
Instituto de Investigaciones en Materiales (UNAM), for his technical support and valuable comments.
One of the authors (M.E. Sánchez-Vergara) gratefully acknowledges the financial support of the
SEP-CONACYT-México, under project number 153751.
References
1. O’Learly, S.K.; Lim, P.K. On determining the optical GAP associated with an amorphous
semiconductor: A generalization of the tauc model. Solid State Commun. 1997, 104, 17–21.
2. Laidani, N.; Bartali, R.; Gottardi, G.; Anderle, M.; Cheyssac, P. Optical absorption parameters of
amorphous carbon films from forouhi-bloomer and tauc-lorentz models: A comparative study.
J. Phys. Condens. Matter. 2008, 20, doi:10.1088/0953-8984/20/01/015216.
3. Sánchez Vergara, M.E.; Ortiz Rebollo, A.; Alvarez, J.R.; Rivera, M. Molecular materials derived
from MPc (M = Fe, Pb, Co) and 1,8-Dihydroxiantraquinone thin films: Formation, electrical and
optical properties. J. Phys. Chem. Solids 2008, 69, 1–7.
4. Kumar, G.A.; Jose, G.; Thomas, V.; Unnikrishnan, N.V.; Nampoori, V.P.N. NIR to UV
absorption spectra and the optical constants of phthalocyanines in glassy medium. Spectrochim.
Acta A 2003, 59, 1–11.
5. Del Caño, T.; Parra, V.; Rodríguez Méndez, M.L.; Aroca, R.F.; de Saja, J.A. Characterization of
evaporated trivalent and tetravalent phthalocyanines thin films: Different degree of organization.
Appl. Surf. Sci. 2005, 246, 327–333.
6. Gould, R.D. Structure and electrical conduction properties o phthalocyanine thin films.
Coord. Chem. Rev. 1996, 156, 237–274.
7. Wojdyla, M.; Bala, W.; Derkowska, B.; Rebarz, M.; Korcala, A. The temperature dependence of
photoluminescence and absorption spectra of vacuum-sublimed magnesium phthalocyanine thin
films. Opt. Mater. 2008, 30, 734–739.
8. Liu, X.; Xu, L.C.; He, T.J.; Chen, D.M.; Liu, F.C. Density functional theory investigations of
geometries and electronic spectra of lithium phthalocyanines. Chem. Phys. Lett. 2003, 379, 517–525.
9. Kimura, T.; Sumimoto, M.; Sakaki, S.; Fujimoto, H.; Hashimoto, Y.; Matsuzaki, S. Electronic
structure of lithium phthalocyanine studied by ultraviolet photoemission spectroscopy.
Chem. Phys. 2000, 253, 125–131.
10. Morales-Saavedra, O.G.; Sánchez-Vergara, M.E.; Ortiz-Rebollo, A.; Ortega-Martínez, R. Electrical
and optical properties of Jäger-Nickel (II)-Based molecular-material thin films prepared by the
vacuum thermal evaporation technique. J. Phys. Chem. Solids 2007, 68, 1571–1582.
11. Hart, M.M. Cationic Exchange Reactions Involving Dilithium Phthalocyanine. M.Sc. Thesis,
Wright State University Dayton, Dayton, OH, USA, 11 December 2009.
12. Gorgoi, M.; Zahn, D.R.T. Density of occupied and unoccupied states monitored during metal
deposition onto phthalocyanine layers. J. Phys. IV 2006, 132, 337–340.
13. El-Nahass, M.M.; Farag, A.M.; Abd El-Rahmann, K.F.; Darwish, A.A.A. Dispersion studies and
electronic transitions in nickel phthalocyanine thin films. Opt. Laser Technol. 2005, 37, 513–523.
14. Kumnar Mahapatro, A.; Ghosh, S. Charge carrier transport in metal phthalocyanine based
disordered thin films. J. Appl. Phys. 2007, 101, 034318:1–034318:5.
15. Mott, N.F. Metal-Insulator Transitions, 2nd ed.; Taylor and Francis: London, UK, 1990; p. 277.
Molecules 2012, 17 10013
16. Mott, N.F.; Davis, E.A. Electronic Processes in Non-crystalline Materials, 2nd ed.; Oxford
University Press: Oxford, UK, 1979; p. 582.
17. Tokumaru, K. Photochemical and photophysical behavior of porphyrins and phthalocyanines
irradiated with violet or ultraviolet light. J. Porphyr. Phthalocyanines 2001, 5, 77–86.
18. De la Torre, G.; Vázquez, P.; Agullo-López, F.; Torres, T. Role of structural factors in the
nonlinear optical properties of phthalocyanines and related compounds. Chem. Rev. 2004, 104,
3723–3750.
19. Mok, T.M.; O’Leary, S.K. The dependence of the Tauc and Cody optical gaps associated with
hydrogenated amorphous silicon on the film thickness: αl Experimental limitations and the impact
of curvature in the Tauc and Cody plots. J. Appl. Phys. 2007, 102, 113525:1–113525:9.
20. Urbach, F. The long-wavelength edge of photographic sensitivity and of the electronic absorption
of solids. Phys. Rev. 1953, 92, 1324.
21. Adachi, S. Optical Properties of Crystalline and Amorphous Semiconductors: Materials and
Fundamental Principles, 1st ed.; Kluwer Academic Publishers: Boston, MA, USA, 1999;
pp. 207–208.
22. Cody, G.D. Hydrogenated Amorphous Silicon, Part B: Optical Properties, Semiconductors and
Semimetals, 1st ed.; Pankove, J.I., Ed.; Academic Press: Orlando, FL, USA, 1984; Volume 21.
23. Hill, I.G.; Kahn, A.; Soos, Z.G.; Pascal, R.A., Jr. Charge-separation energy in films of
π-conjugated organic molecules. Chem. Phys. Lett. 2000, 327, 181–188.
24. Burns, G. Solid State Physics; Academic Press, Inc.: San Diego, CA, USA, 1990.
Sample Availability: Samples of the compounds Li2PcL1 and Li2PcL2 are available from the authors.
© 2012 by the authors; licensee MDPI, Basel, Switzerland. This article is an open access article
distributed under the terms and conditions of the Creative Commons Attribution license
(http://creativecommons.org/licenses/by/3.0/).