Embed Size (px)
Citation preview
UNLV Retrospective Theses & Dissertations
1-1-2003
Determination of the physiological responses of female fire Determination of the physiological responses of female fire
fighters while working in the heat fighters while working in the heat
Paulette Marisa Michie Yamada University of Nevada, Las Vegas
Follow this and additional works at: https://digitalscholarship.unlv.edu/rtds
Repository Citation Repository Citation Yamada, Paulette Marisa Michie, "Determination of the physiological responses of female fire fighters while working in the heat" (2003). UNLV Retrospective Theses & Dissertations. 1522. http://dx.doi.org/10.25669/z6xp-yo35
This Thesis is protected by copyright and/or related rights. It has been brought to you by Digital Scholarship@UNLV with permission from the rights-holder(s). You are free to use this Thesis in any way that is permitted by the copyright and related rights legislation that applies to your use. For other uses you need to obtain permission from the rights-holder(s) directly, unless additional rights are indicated by a Creative Commons license in the record and/or on the work itself. This Thesis has been accepted for inclusion in UNLV Retrospective Theses & Dissertations by an authorized administrator of Digital Scholarship@UNLV. For more information, please contact [email protected].
DETERMINATION OF THE PHYSIOLOGICAL RESPONSES OF FEMALE
FIRE FIGHTERS WHILE WORKING IN THE HEAT
by
Paulette Marisa Michie Yamada, B.A.
Bachelor of Arts University of Northern Colorado, Greeley
December 2000
A thesis submitted in partial fulfillment of the requirements for the
Master of Science Degree Department of Kinesiology College of Health Science
Graduate College University of Nevada, Las Vegas
May 2003
Reproduced with permission of the copyright owner. Further reproduction prohibited without permission.
UMI Number: 1414563
Copyright 2003 by
Yamada, Paulette Marisa Michie
All rights reserved.
UMIUMI Microform 1414563
Copyright 2003 by ProQuest Information and Learning Company.
All rights reserved. This microform edition is protected against
unauthorized copying under Title 17, United States Code.
ProQuest Information and Learning Company 300 North Zeeb Road
P.O. Box 1346 Ann Arbor, Ml 48106-1346
Reproduced with permission of the copyright owner. Further reproduction prohibited without permission.
IJNTV Thesis ApprovalThe Graduate College University of Nevada, Las Vegas
March 06 ,20 03
The Thesis prepared by
Paulette Marisa M. Yamada
E n titled
Determination of the Physiological Responses of Female Fire
Fighters to Work in the Heat
is approved in partial fulfillment of the requirements for the degree of
M a s te r o f S c ie n c e in E x e r c i s e P h y s io lo g y
E ^ v m a t io n CawnüteësM em ber
Examm a tio n Committee M ember
Graduate College Faculty Representative
Examination Committee Chair
Dean o f the Graduate College
1017-53 11
Reproduced with permission of the copyright owner. Further reproduction prohibited without permission.
ABSTRACT
Determination of Physiological Responses of Female Fire Fighters While Working in the Heat
by
Paulette Marisa M. Yamada, B.A.
Lawrence A. Golding, Ph.D., Examination Committee Chair Professor of Exercise Physiology University of Nevada, Las Vegas
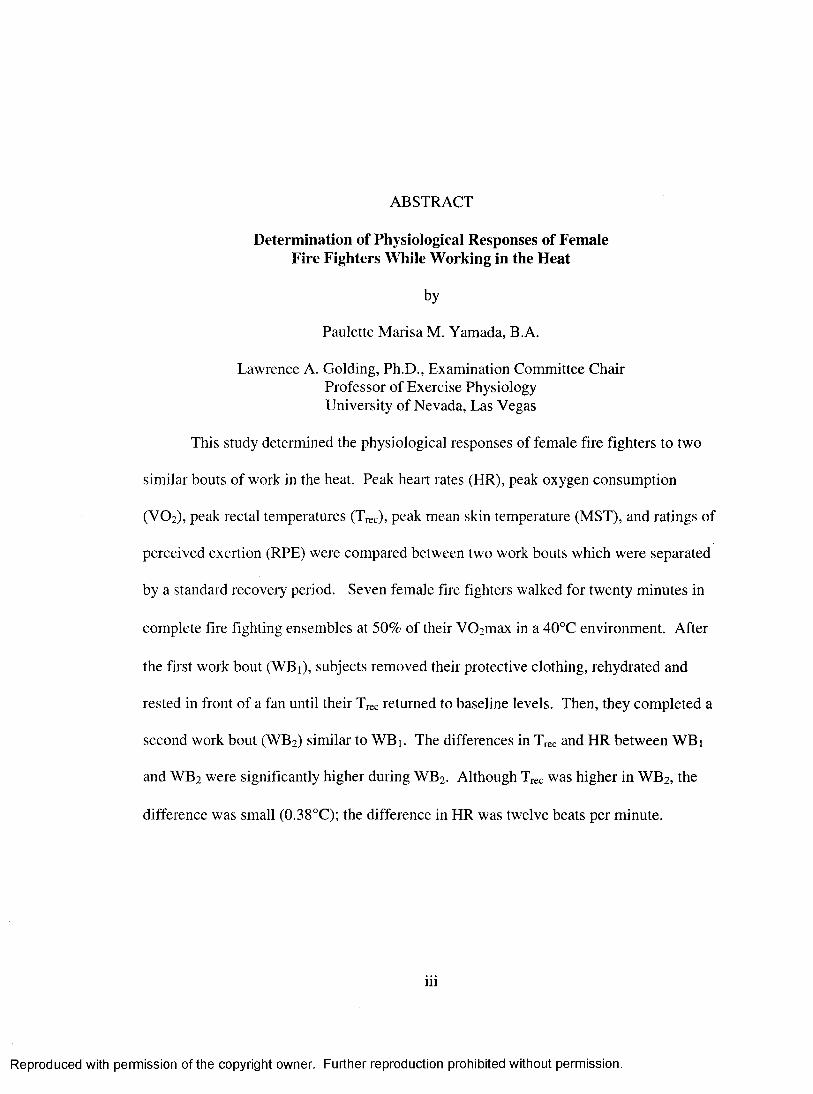
This study determined the physiological responses of female fire fighters to two
similar bouts of work in the heat. Peak heart rates (HR), peak oxygen consumption
(VO2), peak rectal temperatures (Tree), peak mean skin temperature (MST), and ratings of
perceived exertion (RPE) were compared between two work bouts which were separated
by a standard recovery period. Seven female fire fighters walked for twenty minutes in
complete fire fighting ensembles at 50% of their VOzmax in a 40°C environment. After
the first work bout (WBi), subjects removed their protective clothing, rehydrated and
rested in front of a fan until their Tree returned to baseline levels. Then, they completed a
second work bout (WB2) similar to WBi. The differences in Tree and HR between WB%
and WB2 were significantly higher during WBz. Although Tree was higher in WBz, the
difference was small (0.38°C); the difference in HR was twelve beats per minute.
Ill
Reproduced with permission of the copyright owner. Further reproduction prohibited without permission.
TABLE OE CONTENTS
ABSTRACT.................................................................................................................................. iii
LIST OE TABLES...................................................................................................................... vii
LIST OEEIGURES...................................................................................................................viii
ACKNOWLEDGEMENTS........................................................................................................ ix
CHAPTER 1 INTRODUCTION................................................................................................1Need for the Study................................... 3Purpose........................................................................................................................................4Limitations................................................................................................................................. 4Definitions...................................................................................................................................6
CHAPTER 2 LITERATURE REVIEW ..................................................................................11Introduction.............................................................................................................................. 11Heat Illness................................................................................................................................11Gender Differences................................................................................................................. 14
Physiological Responses to Work in the H eat............................................................14Rate of Core Cooling..................................................................................................... 15Thermoregulatory Effects of the Menstrual C ycle.................................................... 16Gender Differences in Sweat R ates............................................................................. 17
Factors Affecting Work Tolerance in the Heat....................................................................19Physical Fitness Level.................................................................................................... 19Heat Acclimatization.....................................................................................................23Cardiovascular Drift....................................................................................................... 26Cognitive Function......................................................................................................... 27
Effect of Heat on Oxygen Consumption..............................................................................28Submaximal W ork......................................................................................................... 28Maximal W ork................................................................................................................29
Sweat and Fluid Replacement............................................................................................... 29Sweat Composition........................................................................................................ 29Hematocrit........................................................................................................................31Fluid Replacement................. 31Hypohydration................... 32Gastric Em ptying............................................................................................................34
Summary...................................................................................................................................35
IV
Reproduced with permission of the copyright owner. Further reproduction prohibited without permission.
CHAPTERS METHODS......................................................................................................... 36Prior to Testing....................................................................................................................... 36Instrumentation....................................................................................................................... 37
Temperature Data Logger and Thermistors................................................................37Metabolic System........................................................................................................... 37Hematocrit Centrifuge...................................................................................................37
Participants............................................................................................................................... 38Day O ne................................................................................................................................... 38Day Two................................................................................................................................... 40Day Three................................................................................................................................. 43Statistical Analyses.................................................................................................................46
CHAPTER 4 RESULTS & DISCUSSION............................................................................48Oxygen U ptake....................................................................................................................... 48
Oxygen Consumption Between Work Bouts..............................................................49Heart R ate ................................................................................................................................ 52
Rehydration..................................................................................................................... 55Rectal Temperature.................................................................................................................61Mean Skin Temperature......................................................................................................... 64R P E ........................................................................................................................................... 66Population................................................................................................................................ 68Recovery Duration.................................................................................................................. 69Recovery Heart R ates.............................................................................................................72
CHAPTER 5 SUMMARY, CONCLUSIONS AND RECOMMENDATIONS...............74Summary...................................................................................................................................74Conclusions.............................................................................................................................. 75Recommendations for Future Research............................................................................... 76
APPENDIX A HUMAN SUBJECTS PROTOCOL AND APPROVAL............................79
APPENDIX B INFORMED CONSENT AND SUBJECT CLEARANCE FORMS 85
APPENDIX C DIET ANALYSES........................................................................................... 89
APPENDIX D METABOLIC SYSTEM CALIBRATION M ETHODS............................97
APPENDIX E RAW DATA.................................................................................................... 101Subject 1.................................................................................................................................. 102Subject 2 .................................................................................................................................. 107Subject 3.................................................................................................................................. 114Subject 4 .................................................................................................................................. 120Subject 5 .................................................................................................................................. 127Subject 6.................................................................................................................................. 134Subject 7 .................................................................................................................................. 141
Reproduced with permission of the copyright owner. Further reproduction prohibited without permission.
BIBLIOGRAPHY..................................................................................................................... 148
VITA........................................................................................................................................... 171
VI
Reproduced with permission of the copyright owner. Further reproduction prohibited without permission.
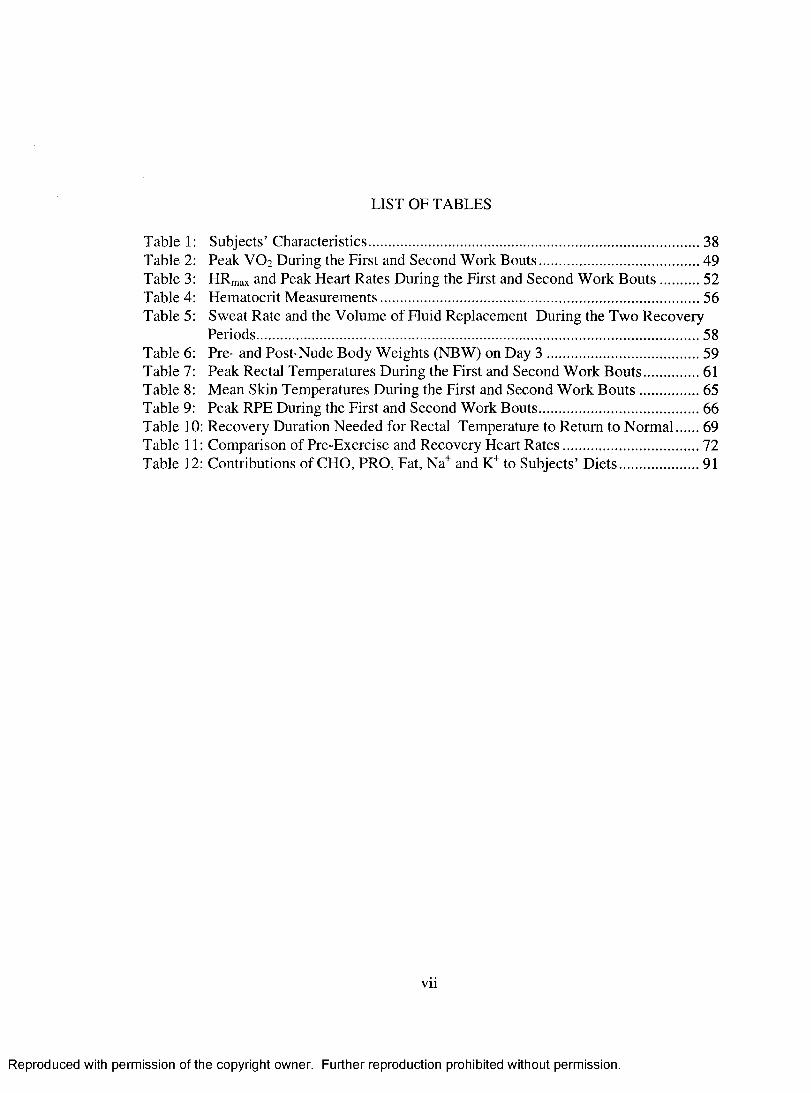
LIST OF TABLES
Table 1 Table 2 Table 3 Table 4 Table 5
Table 6 Table 7 Table 8 Table 9 Table 10 Table 11 Table 12
Subjects’ Characteristics........................................................................................... 38Peak VO2 During the First and Second Work Bouts............................................ 49HRmax and Peak Heart Rates During the First and Second Work B outs 52Hematocrit Measurements........................................................................................56Sweat Rate and the Volume of Fluid Replacement During the Two RecoveryPeriods..........................................................................................................................58Pre- and Post-Nude Body Weights (NBW) on Day 3 .......................................... 59Peak Rectal Temperatures During the First and Second Work Bouts................61Mean Skin Temperatures During the First and Second Work B ou ts.................65Peak RPE During the First and Second Work Bouts............................................ 66Recovery Duration Needed for Rectal Temperature to Return to Norm al 69Comparison of Pre-Exercise and Recovery Heart R ates......................................72Contributions of CHO, PRO, Eat, Na" and to Subjects’ D iets...................... 91
V ll
Reproduced with permission of the copyright owner. Further reproduction prohibited without permission.
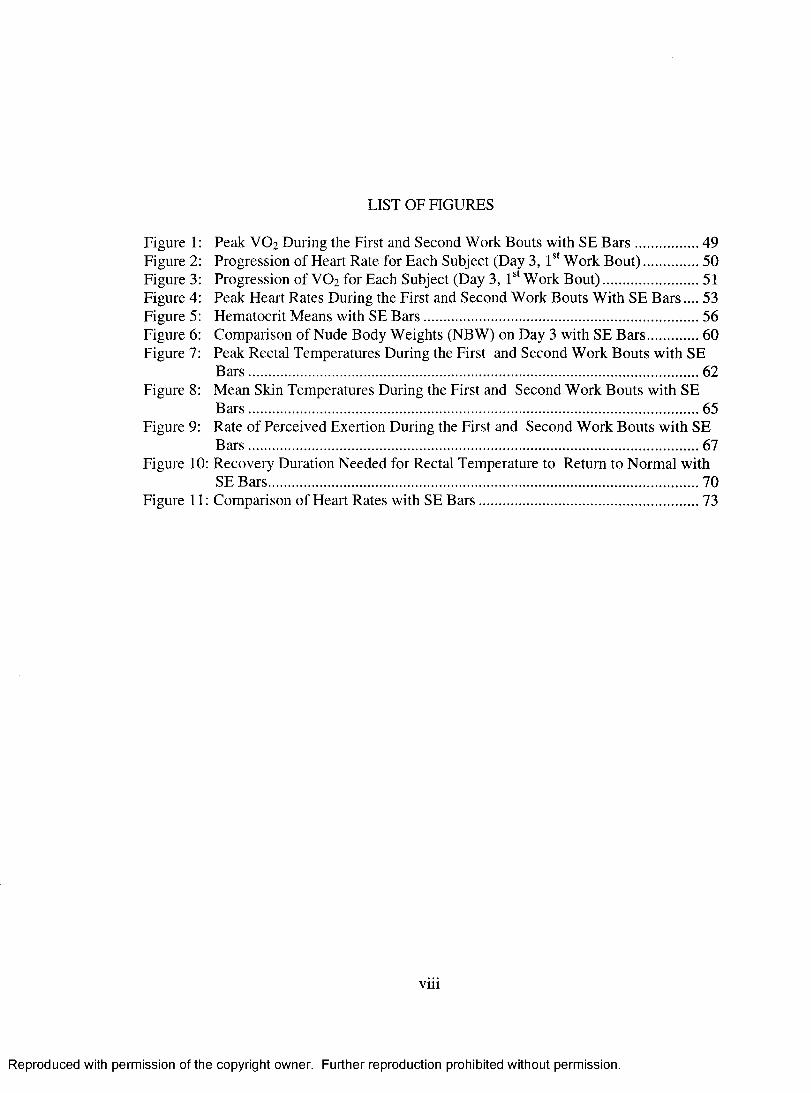
LIST OF FIGURES
Figure 1 : Peak VO2 During the First and Second Work Bouts with SE B ars ..................49Figure 2: Progression of Heart Rate for Each Subject (Day 3, U* Work Bout)................50Figure 3: Progression of VO2 for Each Subject (Day 3, U* Work Bout)...........................51Figure 4: Peak Heart Rates During the First and Second Work Bouts With SE B ars.... 53Figure 5: Hematocrit Means with SE B ars............................................................................56Figure 6: Comparison of Nude Body Weights (NBW) on Day 3 with SE Bars...............60Figure 7: Peak Rectal Temperatures During the First and Second Work Bouts with SE
B ars............................................................................................................................62Figure 8: Mean Skin Temperatures During the First and Second Work Bouts with SE
B ars............................................................................................................................65Figure 9: Rate of Perceived Exertion During the First and Second Work Bouts with SE
B ars............................................................................................................................67Figure 10; Recovery Duration Needed for Rectal Temperature to Return to Normal with
SE Bars...................................................................................................................... 70Figure 11: Comparison of Heart Rates with SE B ars.............................................................73
V lll
Reproduced with permission of the copyright owner. Further reproduction prohibited without permission.
ACKNOWLEDGEMENTS
I would like to thank my committee members, Dr. Golding, Dr. Mercer,
Dr. Young, and Dr. Kruskall for their endless supply of patience. Your guidance and
expertise led me toward the completion of this study. Eor that I am truly grateful. I
would also like to thank Dr. Hillyard, Dr. Yousef, Jan, and Eva, whose assistance and
expertise greatly contributed to this study; your help always came without hesitation.
Thank you to the Las Vegas Eire Union, Loeal 1285, and the GPS A, whose
generous grants aided this study. Also, thank you to the Clark County and Las Vegas
Valley Eire and Rescue Departments, who supplied equipment, and indispensable
support. I wish to express my sincere appreciation to my participants, whose flexibility,
enthusiasm, responsiveness, endurance and open-mindedness made this study possible.
Thank you Mom & Dad for your enduring support throughout my education.
Thank you for instilling in me a drive for intellect and knowledge, the strength to pursue,
and inherent stamina to complete what I start. You have both been exemplary models
and your high standards drive me to improve upon myself.
Thank you to my priory girls. Even when we are scattered in different places of
the world, your emails and phone calls gave me support, stability, and sanity when I
needed it most. And, finally, Jana, thank you for your encouragement and understanding.
You calmed my frustrations, and provided me with the support I needed to eomplete this
study.
IX
Reproduced with permission of the copyright owner. Further reproduction prohibited without permission.
CHAPTER 1
INTRODUCTION
During fire fighting, fire fighters are exposed to extreme heat from 3 sources:
(1) metabolic heat produced by the working muscles during the task of fire fighting, (2)
the radiant heat associated with the fire itself, and (3) the heat that is trapped next to the
body by the heavy, insulated fire ensemble (Smith & Petruzzello, 1998). The heat from
these sources plays an important role in determining the amount and intensity of work
that the fire fighter is capable of performing. The thermal stress associated with
firefighting is unique because the fire-fighting ensemble limits heat dissipation by
evaporation. Because the heat is trapped next to the body and very little evaporative
cooling takes place, core body temperature continues to rise; this is termed
uncompensable heat stress. In fire fighting, heat stress is a critical and limiting
occupational health hazard. However, the heat stress research among fire fighters is
limited and non-existent in female fire fighters.
Heat stress is the combination of both climatic and non-climatic factors. The
climatic factors include the ambient air temperature, wind veloeity, relative humidity and
radiant heat. Non-elimatic factors include the physical workloads, gender, age and
clothing (Yousef, Sagawa, & Shiraki, 1986).
The body’s thermoregulatory meehanism governs the body’s core temperature.
This mechanism involves maintaining homeostatic levels by balancing the amounts of
1
Reproduced with permission of the copyright owner. Further reproduction prohibited without permission.
2
heat gained and heat lost. Since the body requires homeostasis for normal functioning, it
is important to maintain a normal and constant body temperature. In extreme heat,
thermal balance is maintained by heat loss through evaporation, radiation, convection and
conduction. If the amount of heat gained cannot be balanced by the amount heat lost,
then heat storage increases. The two primary avenues for cooling are evaporation and the
vasodilation of peripheral blood flow (Yousef, 1987a). In fire fighting, the heat continues
to accumulate and this limits work performance (Cheung, McLellan & Tenaglia, 2000).
During fire fighting, typical ambient temperatures have been reported to range
from 38°C to 66°C (100.4°F tol50.9°F), and some air temperatures were as high as
232°C (449.6°F) (Abeles, Del Vecchio & Himel, 1973). Environmental heat is so great,
and the primary heat cooling mechanism, evaporative cooling, is so restricted by the non-
porous fire ensemble, that heat illness and heat stress becomes a major deterrent to
prolonged physical work.
Tolerance time, or the length of time it takes core body temperature to reach a
critical limit is dependent upon several factors. Hence, the rate of increase in core body
temperature is dependent on several factors. These factors include the physical fitness
level of the worker, the heat capacity of the body, the initial eore body temperature, the
rate of heat storage and the state of acclimatization. Many of these factors have been
determined by studies on industrial workers and military personnel working in the heat,
and only a few studies have been done on fire fighters. In short, a high level of physical
fitness, high heat capacity, and heat acclimation in conjunction with a low initial core
body temperature, and slow rate of heat storage increases tolerance time until exhaustion.
Chapter two discusses these factors in greater depth.
In the field, the length of time a fire fighter works in the extreme heat usually
Reproduced with permission of the copyright owner. Further reproduction prohibited without permission.
3
depends on the duration of the air supply provided by the self-contained breathing
apparatus (SCBA). After working for a period of time, the fire fighter exits the burning
building, and recovers. During recovery, fire fighters are allowed to rehydrate ab libitum.
After recovery, the fire fighter reenters the building to work again.
Performing fire-fighting activities during multiple work bouts suggests that fire
fighters may elicit higher heart rates and core body temperatures during a second work
bout. However, whether or not fire fighters elicit higher heart rates and higher core body
temperatures during a second work bout has not been studied. Furthermore, whether or
not they elicit higher heart rates and core body temperatures when given adequate fluid
replacement and adequate time to fully recover is not known.
This study monitored heat rate, core body temperature, oxygen consumption,
mean skin temperature and rating of perceived exertion in female fire fighters while
working in extreme heat to determine the differences in these physiological responses
between two work bouts.
Need for the Study
There has been no published research on the physiological effects of repeated
exposures to work in the heat in females while dressed in modem, full fire fighting
ensemble. Prezant et al. (1999) documented that the modern fire fighting ensemble
reduced burn injuries by using modem, protective textiles. In doing so, the new
protective textiles reduced the mechanical movement and exercise tolerance of the fire
fighter (Malley et al., 1999). Therefore, research utilizing modem fire fighting ensembles
was necessary.
With a recovery period between work bouts, will there be a eumulative rise in
Reproduced with permission of the copyright owner. Further reproduction prohibited without permission.
4
heart rate, rectal temperature, mean skin temperature, oxygen consumption and perceived
exertion? Data on heart rates, core body temperatures, mean skin temperature, oxygen
consumption and perceived exertion levels during work in the heat was necessary to
answer this question.
Purpose
The purpose of the study was to determine the physiological responses of female
fire fighters to work in the heat. Specifically, if female fire fighters work at 50% of their
V02max in a 40°C (104°F) environment, how do their peak heart rates, peak rectal
temperatures, peak mean skin temperatures, peak oxygen consumption, and ratings of
perceived exertion (RPF) compare between two work bouts, when separated by a
standard recovery period?
Limitations
• The results of this study were not directly applicable to actual job situations since this
study was performed in an environmental chamber. The temperature of the
environmental chamber was 40°C, which was substantially lower than actual
environmental temperatures experienced in the field. Typical temperatures for actual
fire fighting have been reported to range from 38°C to 66°C (100.4°F to 150.8°F) and
some cases involved air temperatures as high as 232°C (449.6°F) (Abeles et al.,
1973).
• This study required subjects to walk on a treadmill at 50% of their VOimax. This
workload was considerably less difficult than performing actual fire suppression
Reproduced with permission of the copyright owner. Further reproduction prohibited without permission.
5
tasks. It was found that stair climbing with fire ensemble and fire equipment required
between 63-97% of maximal working capacity (V02max) (O’Connell, Thomas,
Cady, & Karwasky, 1986).
• This study required subjects to work at of 50% of their V02max. This workload was
dependent upon their VÜ2max test performances. This was a limitation because it
cannot be ascertained that the subjects were at their true maximal capacities, as they
may have stopped the V0 2 max test prematurely.
• This study required subjects to walk at steady state. However, the job-related tasks of
fire fighting is not maintained at a steady state VO2 level, but rather it fluctuates
between short bursts of anaerobic work with prolonged, variable workloads.
• Hydration, physical fitness and diet differed among subjects. These differences may
have affected the subjects’ physiological responses to work in the heat.
• Although all subjects were incumbent fire fighters, their levels of heat acclimation
differed. Prior to this study, some subjects fought many fires, while others fought
only a few. Since testing for this study took place during the months of June and
July, when the average Las Vegas, daytime temperature was 39.4°C (103°F), outdoor
activities would increase their level of heat acclimation. Some subjects exercised on
their own time, and they exercised in different environments (i.e., indoors or
outdoors). Between testing days, other subjects participated in outdoor, fire fighting
training programs, such as swift water rescue and rappel training (using a rope to
descend down a building or tower).
• The lack of sleep or strenuous physical activity during the subjects’ workdays may
have influenced their physiological responses to the exercise in this study. Some
Reproduced with permission of the copyright owner. Further reproduction prohibited without permission.
6
subjects came in for testing on days that they did not report to work, while others
came in for testing immediately after their 24-hour shift.
• The psychological state of the subjects may have affected their work performance.
The level of psychological strain during the test differed from the psychological strain
of emergencies experienced in a real life situation. Smith, Petruzzello, Kramer, and
Misner (1996) suggested that the amount of psychological strain depends on the
personality trait characteristics of the individual. The lack of an actual emergency
would decrease the amount of psychological stress in fire fighters working in a
simulated fire emergency. On the other hand, some psychological stress may have
arose from the use of unfamiliar testing apparatus and procedures.
Definitions
The heat balance equation illustrates the different avenues of heat gain and loss:
M = E ± C v ± C d ± R ± S
Where:• M is the metabolic rate• E is evaporation• Cv is convection• Cd is conduction• R is radiation• S is heat storage
The metabolic rate represents the sum of all the basic thermodynamic processes
taking place. Evaporation is the primary avenue of heat loss and it is the transformation
of liquid (sweat) to a vapor. The evaporation of sweat cools the skin, thereby, dissipating
body heat. Convection is the transfer of heat by the circulation of a medium, such as air
or water. Conduction is the transfer of heat through the direct contact of objects of
Reproduced with permission of the copyright owner. Further reproduction prohibited without permission.
7
different temperatures. Radiation is the transfer of heat through electromagnetic waves
(Foss & Keteyian, 1998). Heat storage is the amount of heat the body stores. The
avenues for heat gain or loss include radiation, convection, and conduction. Unlike the
other variables (R, Cv, Cd), evaporation is an avenue solely for heat loss (Yousef,
1987a).
Hyperthermia is a condition of having an increased core body temperature.
Hypothermia is a condition of having a low core body temperature, and it is diagnosed
when core body temperature decreases to 35°C (95°F). If heat production is greater than
the rate heat loss, then body temperature rises and hyperthermia occurs. The opposite
occurs if the rate of heat loss is greater than heat production. In this scenario, body
temperature decreases and hypothermia occurs. Homeothermy is a condition where body
temperature exists in a state homeostasis. This occurs when heat production is equal to
the rate of heat lost.
Heat stress is defined as the rise in core body temperature (Rowell, 1986).
Uncompensable heat stress (UHS) is defined as the storage of heat due to restricted body
eooling mechanisms, or a high relative humidity and/or high ambient temperatures
(Cheung et al., 2000). Fire fighters wear heavy, protective fire fighting ensembles, which
restrict evaporation, the body’s main avenue for heat loss. Since the fire fighters’
ensembles restrict cooling by evaporation, they suffer from UHS while working in the
heat. UHS can also occur in high relative humidity and high ambient temperature
conditions. A high relative humidity decreases the amount of sweat that is evaporated off
the skin. In this case, the body’s decreased evaporation capacity causes the storage of
body heat. Heat travels down the temperature gradient, traveling from an area of high
temperature to an area of low temperature. Therefore, a person exercising in high
Reproduced with permission of the copyright owner. Further reproduction prohibited without permission.
8
ambient temperatures would have difficulty dissipating her body heat, resulting in UHS.
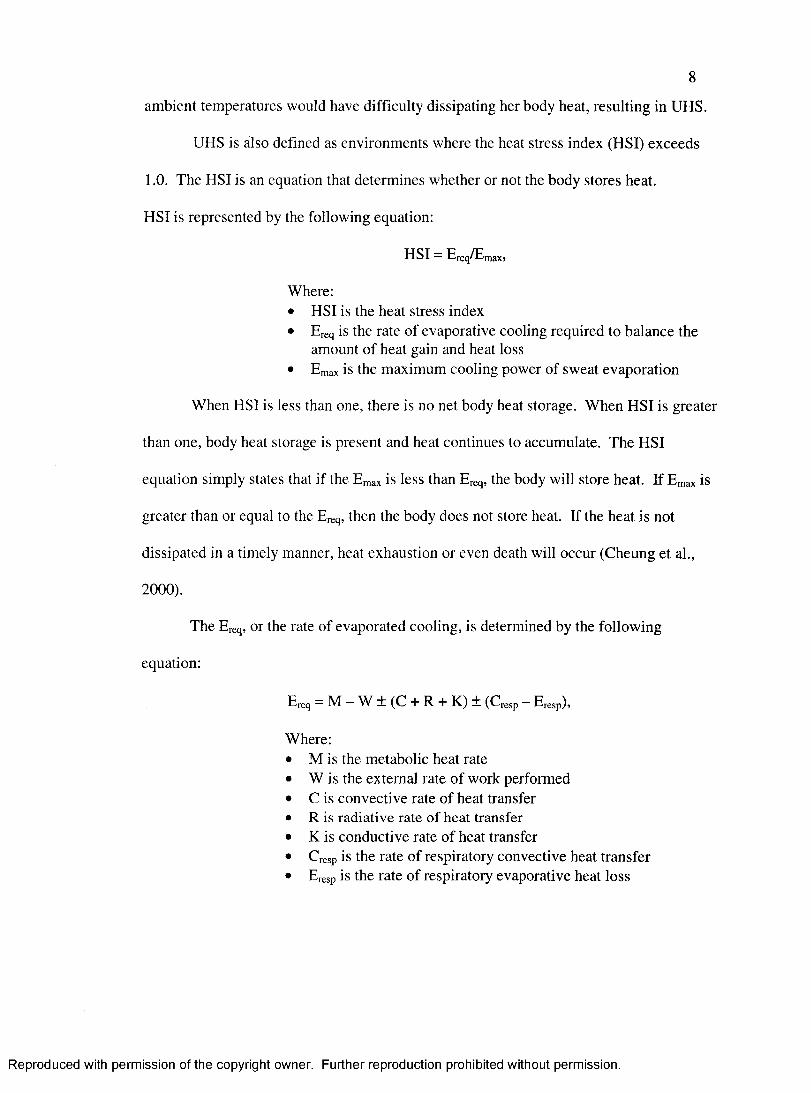
UHS is also defined as environments where the heat stress index (HSI) exceeds
1.0. The HSI is an equation that determines whether or not the body stores heat.
HSI is represented by the following equation:
HSI = Ereq/Emax,
Where:• HSI is the heat stress index• Ereq is the rate of evaporative cooling required to balance the
amount of heat gain and heat loss• Emax is the maximum cooling power of sweat evaporation
When HSI is less than one, there is no net body heat storage. When HSI is greater
than one, body heat storage is present and heat continues to accumulate. The HSI
equation simply states that if the E^ax is less than Ereq, the body will store heat. If E^ax is
greater than or equal to the Ereq, then the body does not store heat. If the heat is not
dissipated in a timely manner, heat exhaustion or even death will occur (Cheung et al.,
2000).
The Ereq, Or the rate of evaporated cooling, is determined by the following
equation:
Ereq = M - W ± ( C + R + K) + (Cresp ~ Eresp),
Where:M is the metabolic heat rate W is the external rate of work performed C is convective rate of heat transfer R is radiative rate of heat transfer K is conductive rate of heat transfer Cresp is the rate of respiratory convective heat transfer Eresp is the rate of respiratory evaporative heat loss
Reproduced with permission of the copyright owner. Further reproduction prohibited without permission.
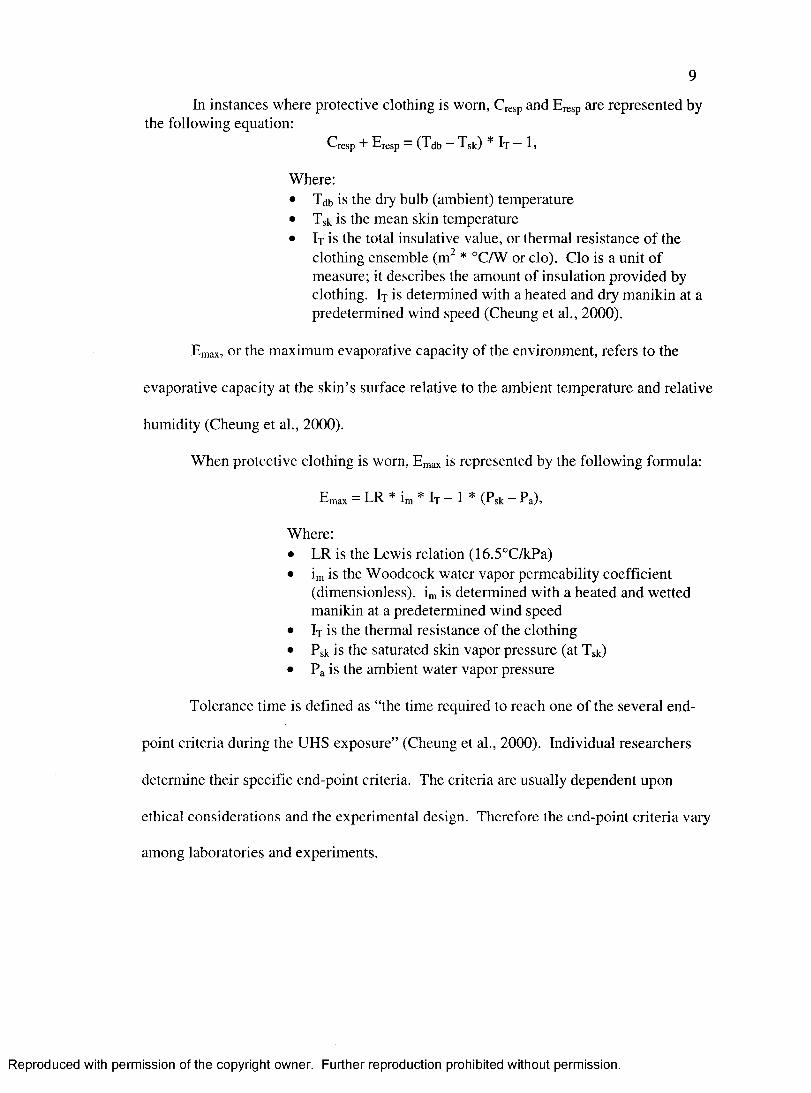
In instances where protective clothing is worn, Cresp and Eresp are represented by the following equation:
Cresp + Eresp = (Tdb ~ Tsk) * E ~ 1,
Where:• Tdb is the dry bulb (ambient) temperature• Tsk is the mean skin temperature• It is the total insulative value, or thermal resistance of the
clothing ensemble (m^ * °CAV or do). Clo is a unit of measure; it describes the amount of insulation provided by clothing. It is determined with a heated and dry manikin at a predetermined wind speed (Cheung et al., 2000).
Emax, or the maximum evaporative capacity of the environment, refers to the
evaporative capacity at the skin’s surfaee relative to the ambient temperature and relative
humidity (Cheung et al., 2000).
When protective clothing is worn, E^ax is represented by the following formula:
Emax = LR * im * It - 1 * (Psk - Pa),
Where:• LR is the Lewis relation (16.5°C/kPa)• im is the Woodcock water vapor permeability coefficient
(dimensionless). im is determined with a heated and wetted manikin at a predetermined wind speed
• It is the thermal resistance of the clothing• Psk is the saturated skin vapor pressure (at Tsk)• Pa is the ambient water vapor pressure
Tolerance time is defined as “the time required to reach one of the several end
point criteria during the UHS exposure” (Cheung et al., 2000). Individual researchers
determine their specific end-point criteria. The criteria are usually dependent upon
ethical considerations and the experimental design. Therefore the end-point criteria vary
among laboratories and experiments.
Reproduced with permission of the copyright owner. Further reproduction prohibited without permission.
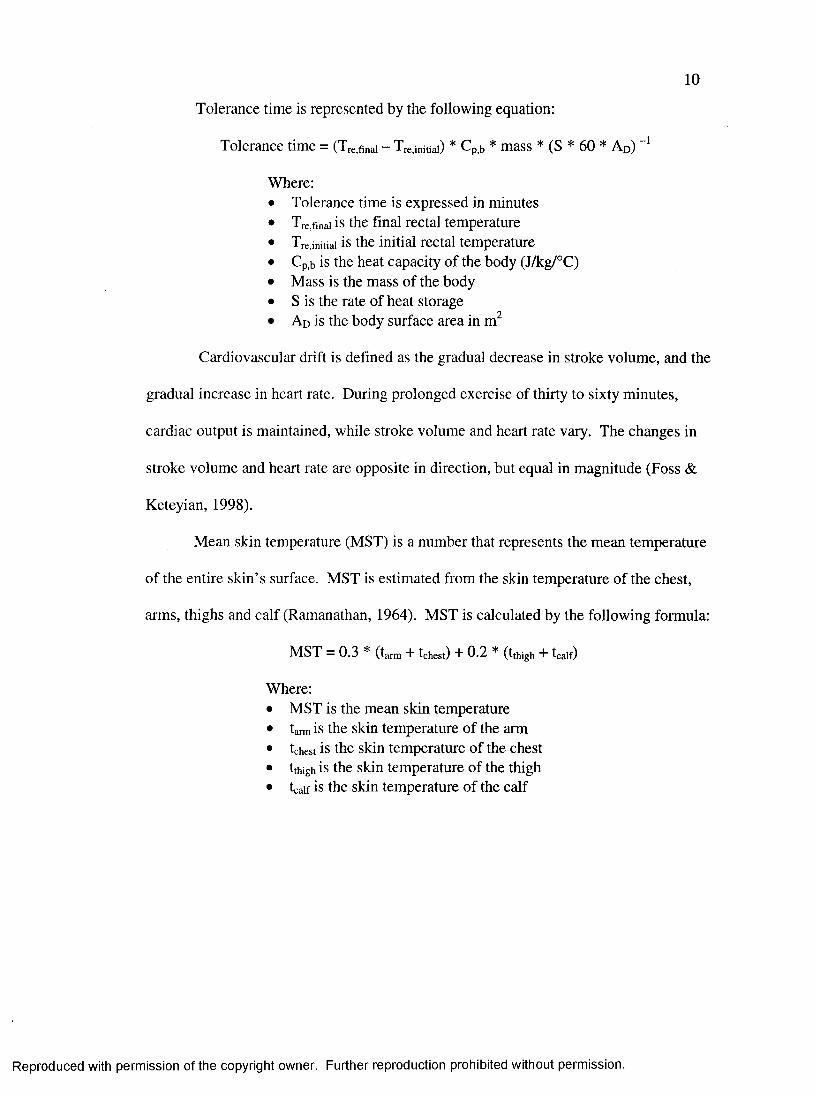
10
Tolerance time is represented by the following equation:
Tolerance time = (Tre/mai - Tre,initiai) * Cp,b * mass * (S * 60 * Ad)
Where:Tolerance time is expressed in minutes Tre,final is the final rectal temperature Tre,initial is the initial rectal temperature Cp,b is the heat capacity of the body (J/kg/°C)Mass is the mass of the body S is the rate of heat storage Ad is the body surface area in m^
Cardiovascular drift is defined as the gradual decrease in stroke volume, and the
gradual increase in heart rate. During prolonged exercise of thirty to sixty minutes,
cardiac output is maintained, while stroke volume and heart rate vary. The changes in
stroke volume and heart rate are opposite in direction, but equal in magnitude (Foss &
Keteyian, 1998).
Mean skin temperature (MST) is a number that represents the mean temperature
of the entire skin’s surface. MST is estimated from the skin temperature of the chest,
arms, thighs and calf (Ramanathan, 1964). MST is calculated by the following formula:
MST = 0.3 * (tarm + tchest) + 0.2 * (tthigh + tcalf)
Where:• MST is the mean skin temperature• tarm IS the skiu temperature of the arm• tchest is the skin temperature of the chest• tthigh is the skin temperature of the thigh• tcalf is the skin temperature of the calf
Reproduced with permission of the copyright owner. Further reproduction prohibited without permission.

CHAPTER 2
LITERATURE REVIEW
Introduction
Fire fighting poses many occupational hazards, including the risk of heat illness.
A fire fighter’s heat tolerance level plays an integral role in determining his or her risk of
heat illness. Factors that affect heat tolerance include: the level of physical fitness, the
state of acclimatization, and the initial core body temperature. This chapter will identify
gender differences of heat tolerance during work in the heat, the factors affecting heat
tolerance, and the effects of working in the heat on oxygen consumption and the
cardiovascular system.
Heat Illness
Heat illness results from the body’s inability to compensate for the metabolic and
environmental heat loads. They are often classified by the severity of the condition.
Listing these illnesses from the least serious to the most serious cases, these include heat
cramps, heat syncope, heat exhaustion, and heat stroke.
The symptoms of heat cramps are skeletal muscular pains and spasms, occurring
often in the legs and abdominal wall. These spasms commonly occur after the individual
has cooled down and several hours after exercise. This condition often results when an
individual sweats extensively and drinks eopious amounts of fluid without replacing the
II
Reproduced with permission of the copyright owner. Further reproduction prohibited without permission.
12
sodium lost in the sweat (Sutton, 2001). Adding table salt to food or fluids, stretching
and rest are recommended to remedy this illness.
Heat syncope is defined as “the abrupt loss of consciousness usually observed in
unacclimatized people in the upright position,” (Sutton, 2001). It is classified by
giddiness, acute fatigue or loss of consciousness (Yousef et al., 1986). Physiological
symptoms include a decreased blood pressure, profuse sweating, and an increased heart
rate.
One of the body’s thermoregulatory cooling responses to exercise is peripheral
vasodilation. Peripheral vasodilation leads to venous pooling in the arms and legs. Thus,
venous pooling leads to a decreased venous return, cardiac output and cerebral perfusion.
The result of these events is syncope, or fainting. Predisposing factors to heat syncope
include cardiovascular disease, hypokalemia, dehydration or salt depletion, diabetes, or
drugs such as diuretics, peripheral vasodilators, beta-blockers and calcium channel
blockers. Heat syncope also occurs often when an individual suddenly stands up from a
supine position, stands in the heat for prolonged period of time, or does not cool down.
The lack of a cool down accentuates venous pooling because it causes the skeletal muscle
pump to cease (Sutton, 2001).
Heat exhaustion and heat stroke are found on a continuum with the former being
non-fatal, and heat stroke being more serious as it can lead to unconsciousness and death.
Symptoms of heat exhaustion include: fatigue, muscular weakness, nausea, vomiting,
giddiness, muscle cramps and in latter stages, circulatory failure. As exercise creates
competition for blood flow between the skin and working muscles, the heat-dissipating
mechanisms are compromised. Although dehydration enhances this effect, dehydration is
not a prerequisite for these heat illnesses (Sutton, 2001).
Reproduced with permission of the copyright owner. Further reproduction prohibited without permission.
13
A rectal temperature greater than 40.6°C (105.1°F), and hot, dry skin are no
longer considered precursors to heat stroke, but are still associated with heat stroke. The
main distinguishing symptoms of heat stroke are central nervous system dysfunction such
as delirium and coma. Heat stroke can be divided into two categories: classical and
exertional.
Classical heat stroke occurs in situations where individuals use medications that
inhibit thermoregulation. Some of these medications include: diuretics, anticholinergics,
anti-Parkinsonians, phenothiazines, tricyclics, and antihistamines. Exertional heat stroke
occurs when an exercising individual loses the capacity for heat dissipation and the body
temperature continues to rise (Sutton, 2001). Exertional heat stroke often occurs in
athletes participating in long durance events in the heat.
Measurement of Body Temperature
Body temperature can be measured at different locations. Since different body
tissues have different temperatures, body temperature is dependent upon the site of
measurement. For example, body temperature can be taken on the surface of the skin,
near the tympanic membrane in the ear, or in the esophagus, mouth, or reetum. There are
many factors that determine the temperature at different sites. For example, the
esophagus temperature is dependent upon the depth of the probe; skin temperature is
dependent upon the environment; drinking and eating affect oral temperature.
Furthermore, when measured orally, the average, normal body temperature is between
36.7°C (98°E) and 37°C (98.6°F). However, when body temperatures are measured
rectally, the temperature is about 1°E higher (Guyton & Hall, 2000).
Reproduced with permission of the copyright owner. Further reproduction prohibited without permission.
14
Gender Differences
Physiological Responses to Work in the Heat
McLellan (1998) found that body composition and aerobic fitness levels
significantly affect heat tolerance between females and males while wearing protective
nuclear, biological and chemical (NBC) clothing. This study required subjects to walk
intermittently at a speed of 4 kilometers per hour in an environment of 40°C and 80%
relative humidity. Walking was terminated when subjects completed five hours, or when
heart rate and rectal temperatures reached critical limits. McLellan (1998) documented
that subjects, regardless of gender, who elicited a lower final rectal temperature at
exhaustion (which demonstrates a lower capacity for heat tolerance) had lower VOipeak
values and higher percentages of body fat. This leads to a general conclusion for both
genders that body composition and aerobic fitness levels affect heat tolerance.
McLellan (1998) also matched female and male subjects for VOzpeak, body fat
percentage, and surface area-to-mass ratio. When males and females were matched for
VOipeak and percentage of body fat, they responded to work in the heat in very similar
manners. The author reported that: (1) when 10 females and 10 males were matched for
V 0 2 peak, the rate of heat storage and the heat storage per unit of lean tissue mass were
not significantly different between the two genders, (2) when 8 females and 8 males were
matched for body fatness, the rate of heat storage and heat storage per unit of lean tissue
mass were not significantly different between the two genders, (3) when 6 females and 6
males were matched for both V0 2 peak and body fatness, the rate of heat storage and heat
storage per unit of lean tissue mass were not significantly different between the two
genders (McLellan, 1998). However there was one gender difference: the rectal
Reproduced with permission of the copyright owner. Further reproduction prohibited without permission.
15
temperature of female subjects increased at a faster rate than the male subjects
(McLellan, 1998).
Rate of Core Cooling
The rate of core cooling following exercise is affected by body composition.
Anderson, Ward and Mekjavie (1995) documented that body mass and muscle mass
significantly contributed to the rate of core cooling, while gender and adipose tissue mass
were insignificant factors. The authors used a standardized regression to show that body
mass has a positive relationship with the rate of core cooling ((3=1.73, p=0.03), and
muscle mass has a negative relationship with the rate of core cooling (P=-1.73, p=0.023).
This is in accordance with White, Ross, Mekjavie (1992), who reported that body
cooling was best predicted by body mass. They documented that body mass had a
significant correlation with rate of core cooling (r=0.5, p<0.05). However, these authors
reported that gender distorted the relationship between total mass and rectal temperature.
They reasoned that the differences in adipose tissue distribution caused the distorted
relationship. Although muscle and fat tissues have different specific heat values, these
studies show that total body mass is the best predictor for the rate of core cooling.
Females have a larger surface area-to-mass ratio than men (Burse, 1979). In
instances without protective clothing, this allows for a greater “heat dissipation” potential
per unit of body mass (Burse, 1979). However, the fire-fighting ensemble creates an
uncompensable heat stress environment. Therefore, heat dissipation through evaporation
does not enhance cooling. McLellan (1998) found that the evaporative heat loss capacity
in females was reduced in uncompensable heat stress environments.
Cardiovascular changes and fluid shifts between compartments are different from
females to males. Females have higher heart rates under all conditions. Females usually
Reproduced with permission of the copyright owner. Further reproduction prohibited without permission.
16
have a 12% smaller blood volume per unit of surface area and slightly lower arterial
oxygen content than males (Astrand, 1952). Therefore, the cutaneous vasodilation during
exercise would cause a relatively greater shift of blood to the periphery in relation to total
blood volume (Senay & Fortney, 1975).
Thermoregulatorv Effects of the Menstrual Cvcle
Progesterone is known to be a thermogenic hormone (Harvey & Crockett, 1932).
Since progesterone is prevalent in the luteal phase, post-ovulatory women have higher
core body temperatures than preovulatory women. The menstrual cycle consists of 28
days. Following menstruation (which occurs during the first five days of the cycle), the
follicular phase begins. The follicular phase lasts about nine days. Ovulation terminates
this phase, and after ovulation, the luteal phase begins. The luteal phase lasts about
fourteen days; at the end of the luteal phase, menstruation occurs, and the cycle begins
again (Guyton & Hall, 2000).
Baker, Mitchell and Driver (2001) found that women taking oral contraceptives
and women in the luteal phase had core body temperatures that were 0.3°C higher than
women in the follicular phase. Haslag and Hertzman (1965) and Haymes, Buskirk,
Hodgson, Lundegren and Nicholas (1974) confirmed the previous study and reported an
elevation of post-ovulation oral and rectal temperatures of 0.3°C and 0.5°C, respectively.
Bittel and Henane (1975) also found that rectal temperatures were higher during the post
ovulation period, and that heat storage was greatest during the post-ovulation period
when exposed to a hot environment. However, Horvath and Drinkwater (1982) reported
that the minor menstrual cyclic changes in rectal temperatures were masked by exercise
at 30% VO^max and specific environmental temperatures of 35°C (95° F) and 48°C
(118.4°F).
Reproduced with permission of the copyright owner. Further reproduction prohibited without permission.
17
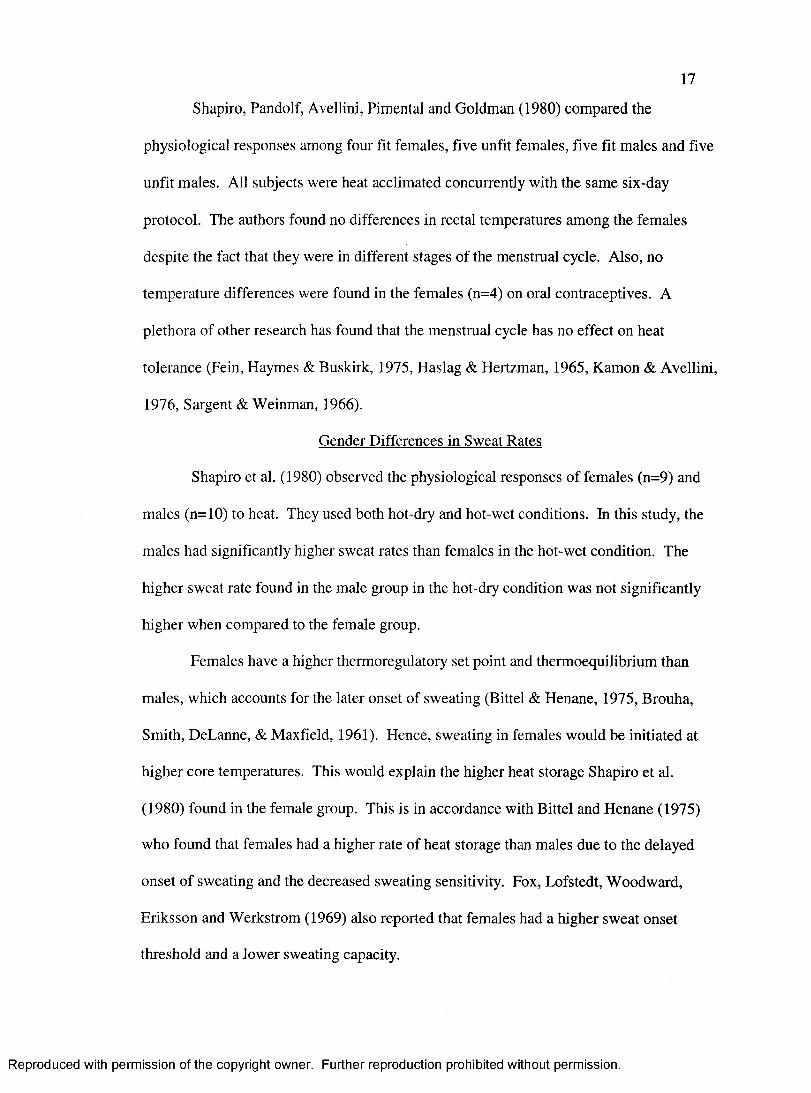
Shapiro, Pandolf, Avellini, Pimentai and Goldman (1980) compared the
physiological responses among four fit females, five unfit females, five fit males and five
unfit males. All subjects were heat acclimated concurrently with the same six-day
protocol. The authors found no differences in rectal temperatures among the females
despite the fact that they were in different stages of the menstrual cycle. Also, no
temperature differences were found in the females (n=4) on oral contraceptives. A
plethora of other research has found that the menstrual cycle has no effect on heat
tolerance (Fein, Haymes & Buskirk, 1975, Haslag & Hertzman, 1965, Kamon & Avellini,
1976, Sargent & Weinman, 1966).
Gender Differences in Sweat Rates
Shapiro et al. (1980) observed the physiological responses of females (n=9) and
males (n=10) to heat. They used both hot-dry and hot-wet conditions. In this study, the
males had significantly higher sweat rates than females in the hot-wet condition. The
higher sweat rate found in the male group in the hot-dry condition was not significantly
higher when compared to the female group.
Females have a higher thermoregulatory set point and thermoequilibrium than
males, which accounts for the later onset of sweating (Bittel & Henane, 1975, Brouha,
Smith, DeLanne, & Max field, 1961). Hence, sweating in females would be initiated at
higher core temperatures. This would explain the higher heat storage Shapiro et al.
(1980) found in the female group. This is in accordance with Bittel and Henane (1975)
who found that females had a higher rate of heat storage than males due to the delayed
onset of sweating and the decreased sweating sensitivity. Fox, Lofstedt, Woodward,
Eriksson and Werkstrom (1969) also reported that females had a higher sweat onset
threshold and a lower sweating capacity.
Reproduced with permission of the copyright owner. Further reproduction prohibited without permission.

18
Shapiro et al. (1980) reported that females had a greater area-to-mass ratio than
the males. In humid conditions, a larger area-to-mass ratio is advantageous. Since heat
production is dependent upon weight, and heat dissipation is dependent upon skin surface
area, females have a greater “heat dissipation” potential. They conclude that this
morphological difference works as an advantage in hot-wet conditions. They also believe
that females have better peripheral feedback from skin wettedness. This enhanced
feedback suppresses excessive sweat loss in humid environments, thus conserving sweat.
In other words, females would eliminate inefficient sweating in hot and wet conditions.
Another explanation for the decreased sweat rate observed in females involves
hidromeiosis (Brown & Sargent H, 1965, Weinman, Slabachova, Bernauer et al., 1967).
Hidromeiosis is due to either the suppression of sweating due to sweat on the skin surface
or the fatigue of sweat glands (Shirreffs, 2002).
Other studies have found that females have a lower total body sweat rate (Frye &
Kamon, 1983, Morimoto, Slabochova, Naman, & Sargent, 1967, Weinman, Slabochova,
Bernauer, Morimoto, & Sargent, 1967, Wyndham, Morrison, & Williams, 1965). Even
with heat acclimatization, females continued to have a lower sweat rate than males (Frye
& Kamon, 1983, Wyndham et al., 1965). Both genders had a reduced sweating rate in
high humidity environments (Frye & Kamon, 1983; Morimoto et al., 1967). For each
study, the relative humidity was 80-82% and 60%, respectively.
Sweat rate differences between females and males have been adequately
researched. In short, females have a later onset of sweating and a higher
thermoequilibrium (Bittel & Henane, 1975, Fox et al., 1969), a lower sweat rate (Frye &
Kamon, 1983) and enhanced skin wettedness feedback (Shapiro et al., 1980).
Reproduced with permission of the copyright owner. Further reproduction prohibited without permission.
19
Factors Affecting Work Tolerance in the Heat
Physical Fitness Level
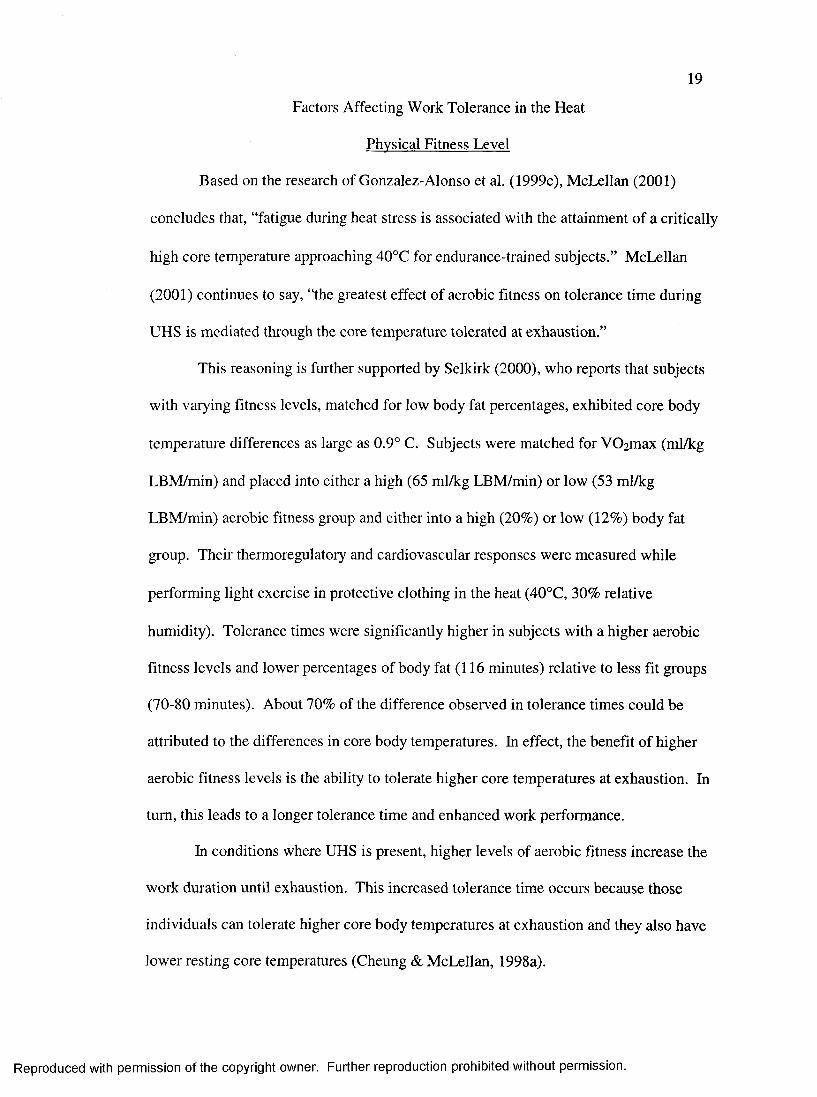
Based on the research of Gonzalez-Alonso et al. (1999c), McLellan (2001)
concludes that, “fatigue during heat stress is associated with the attainment of a critically
high core temperature approaching 40°C for endurance-trained subjects.” McLellan
(2001) continues to say, “the greatest effect of aerobic fitness on tolerance time during
UHS is mediated through the core temperature tolerated at exhaustion.”
This reasoning is further supported by Selkirk (2000), who reports that subjects
with varying fitness levels, matched for low body fat percentages, exhibited core body
temperature differences as large as 0.9° C. Subjects were matched for VOimax (ml/kg
LBM/min) and placed into either a high (65 ml/kg LBM/min) or low (53 ml/kg
LBM/min) aerobic fitness group and either into a high (20%) or low (12%) body fat
group. Their thermoregulatory and cardiovascular responses were measured while
performing light exercise in protective clothing in the heat (40°C, 30% relative
humidity). Tolerance times were significantly higher in subjects with a higher aerobic
fitness levels and lower percentages of body fat (116 minutes) relative to less fit groups
(70-80 minutes). About 70% of the difference observed in tolerance times could be
attributed to the differences in core body temperatures. In effect, the benefit of higher
aerobic fitness levels is the ability to tolerate higher core temperatures at exhaustion. In
turn, this leads to a longer tolerance time and enhanced work performance.
In conditions where UHS is present, higher levels of aerobic fitness increase the
work duration until exhaustion. This increased tolerance time occurs because those
individuals can tolerate higher core body temperatures at exhaustion and they also have
lower resting core temperatures (Cheung & McLellan, 1998a).
Reproduced with permission of the copyright owner. Further reproduction prohibited without permission.
20
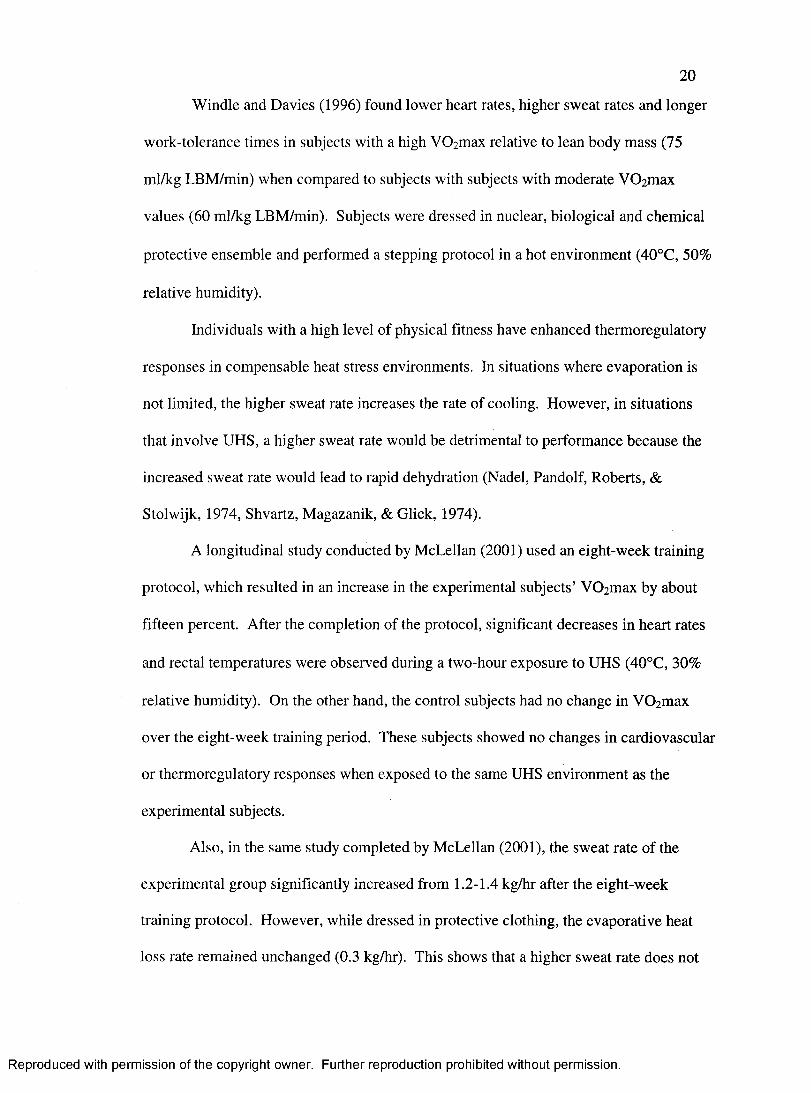
Windle and Davies (1996) found lower heart rates, higher sweat rates and longer
work-tolerance times in subjects with a high VOzmax relative to lean body mass (75
ml/kg LBM/min) when compared to subjects with subjects with moderate VOzmax
values (60 ml/kg LBM/min). Subjects were dressed in nuclear, biological and chemical
protective ensemble and performed a stepping protocol in a hot environment (40°C, 50%
relative humidity).
Individuals with a high level of physical fitness have enhanced thermoregulatory
responses in compensable heat stress environments. In situations where evaporation is
not limited, the higher sweat rate increases the rate of cooling. However, in situations
that involve UHS, a higher sweat rate would be detrimental to performance because the
increased sweat rate would lead to rapid dehydration (Nadel, Pandolf, Roberts, &
Stolwijk, 1974, Shvartz, Magazanik, & Click, 1974).
A longitudinal study conducted by McLellan (2001) used an eight-week training
protocol, which resulted in an increase in the experimental subjects’ VOzmax by about
fifteen percent. After the completion of the protocol, significant decreases in heart rates
and rectal temperatures were observed during a two-hour exposure to UHS (40°C, 30%
relative humidity). On the other hand, the control subjects had no change in VOzmax
over the eight-week training period. These subjects showed no changes in cardiovascular
or thermoregulatory responses when exposed to the same UHS environment as the
experimental subjects.
Also, in the same study completed by McLellan (2001), the sweat rate of the
experimental group significantly increased from 1.2-1.4 kg/hr after the eight-week
training protocol. However, while dressed in protective clothing, the evaporative heat
loss rate remained unchanged (0.3 kg/hr). This shows that a higher sweat rate does not
Reproduced with permission of the copyright owner. Further reproduction prohibited without permission.
21
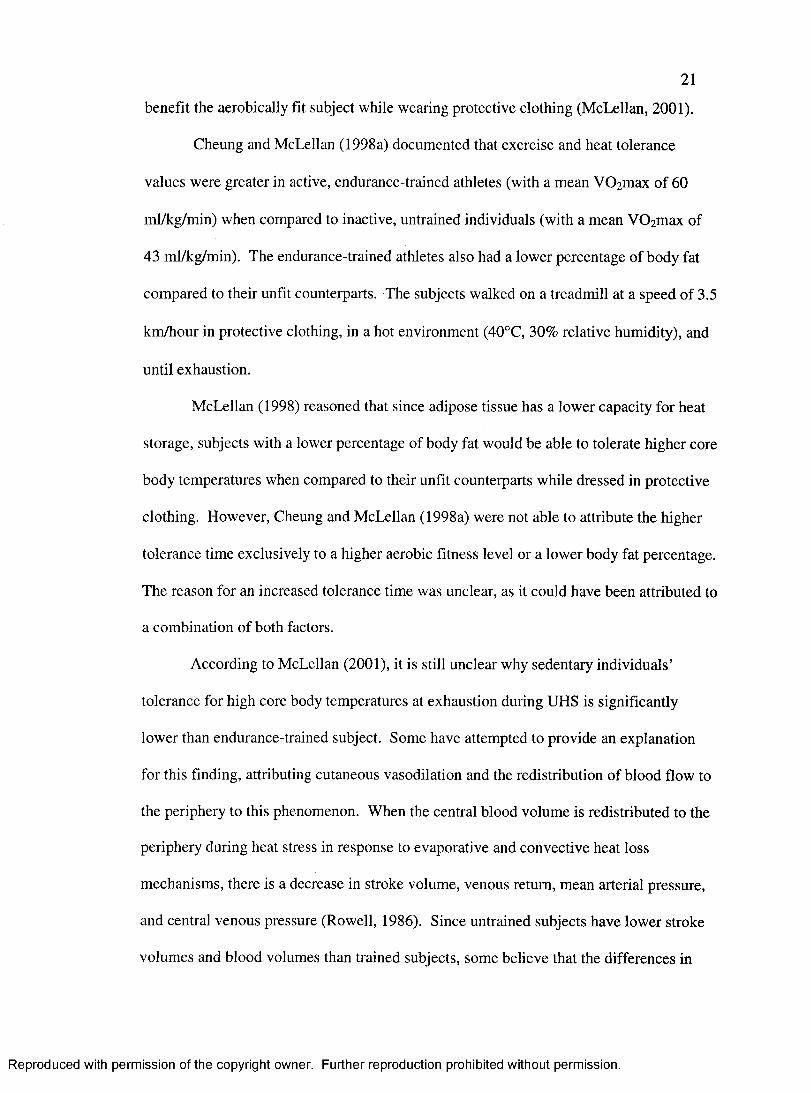
benefit the aerobically fit subject while wearing protective clothing (McLellan, 2001).
Cheung and McLellan (1998a) documented that exercise and heat tolerance
values were greater in active, endurance-trained athletes (with a mean VOzmax of 60
ml/kg/min) when compared to inactive, untrained individuals (with a mean VOzmax of
43 ml/kg/min). The enduranee-trained athletes also had a lower percentage of body fat
compared to their unfit counterparts. The subjects walked on a treadmill at a speed of 3.5
km/hour in protective clothing, in a hot environment (40°C, 30% relative humidity), and
until exhaustion.
McLellan (1998) reasoned that since adipose tissue has a lower capacity for heat
storage, subjects with a lower percentage of body fat would be able to tolerate higher core
body temperatures when compared to their unfit counterparts while dressed in protective
clothing. However, Cheung and McLellan (1998a) were not able to attribute the higher
tolerance time exclusively to a higher aerobic fitness level or a lower body fat percentage.
The reason for an increased tolerance time was unclear, as it could have been attributed to
a combination of both factors.
According to McLellan (2001), it is still unclear why sedentary individuals’
tolerance for high core body temperatures at exhaustion during UHS is significantly
lower than endurance-trained subject. Some have attempted to provide an explanation
for this finding, attributing cutaneous vasodilation and the redistribution of blood flow to
the periphery to this phenomenon. When the eentral blood volume is redistributed to the
periphery during heat stress in response to evaporative and convective heat loss
mechanisms, there is a decrease in stroke volume, venous return, mean arterial pressure,
and eentral venous pressure (Rowell, 1986). Sinee untrained subjeets have lower stroke
volumes and blood volumes than trained subjeets, some believe that the differences in
Reproduced with permission of the copyright owner. Further reproduction prohibited without permission.
22
these volumes account for the differences in core temperatures tolerated at exhaustion
(Hopper, Coggan & Coyle, 1988).
Some researchers believe the “tolerance discrepancy” is due to various other
factors. After using low dose ^-blockers (Fritzsche, Switzer, Hodgkinson & Coyle,
1999), supine exercise (Gonzalez-Alonso, Mora-Rodriguez & Coyle, 1999b), or
dehydration before exposure to hot and cold environments (Gonzalez-Alonso, Mora-
Rodriguez & Coyle, 2000), authors have shown that the increase in heart rate and
decrease in central blood volume during exercise in the heat is related to the drop in
stroke volume. Furthermore, this fall in stroke volume is not associated with increased
peripheral blood flow.
A change in posture (Gonzalez-Alonso et al., 1999b) or changes in central blood
volumes due to dehydration (Gonzalez-Alonso et al., 2000) are responsible for 50% of
the drop in stroke volume during exercise in the heat (Hopper et al., 1998). Therefore,
the difference in central blood volume distribution between trained and untrained subjects
could only partially explain the differences in core temperatures at exhaustion.
McLellan (2001) also suggests that trained individuals become accustomed to
higher core body temperatures during their regular training sessions. Therefore, they may
be more willing to tolerate higher levels of (psychologieal) discomforts and increase their
tolerance time until exhaustion. In conclusion, a higher level of aerobic fitness augments
tolerance time until exhaustion. This is mediated by the lower percentages of body fat,
the increased blood volume, and the ability to endure higher core temperatures at
exhaustion (McLellan, 2001).
Reproduced with permission of the copyright owner. Further reproduction prohibited without permission.
23
Heat Acclimatization
Fein, Haymes and Buskirk (1975) reported that six female subjects were capable
of heat acclimating by walking in a climatic chamber (46.5°C dry-bulb temperature,
24.5±0.5°C wet-bulb temperature) for 100 minutes on a motor-driven treadmill (at a
speed of 5.2 km/hr and a 2.5% grade) for ten consecutive days. Subjects elicited a
significant decrease in heat strain as demonstrated by a decrease in mean skin
temperature, exercise heart rate, heat storage, a slower rise in rectal temperature, and an
increase in sweat rate.
McLellan and Aoyagi (1996) documented the effects of heat acclimation on heart
rate, mean skin and reetal temperatures, sweat rate, and tolerance time. The study used
seven subjects for a hot-wet (HW) aeclimation condition, eight subjects for a hot-dry
(HD) acclimation condition and seven control subjects. The acclimation protocol
consisted of twelve one-hour heat acclimation sessions (40°C, 30% relative humidity),
which were completed within a two-week period. The HD group dressed in t-shirt, shorts
and running shoes, while the HW group wore full NBC protective clothing. The HD
group walked on the treadmill at a speed and grade that corresponded to 45-55% of
subjects’ VOzpeak. The speed and grade were adjusted so that the HW group would
maintain a 1.3°C increase in rectal temperature while walking on a treadmill throughout
the session.
A fter the acclim ation procedure, both the HW and HD groups had significantly
lower heart rates when compared to a control group. The difference in heart rates
between the two-acclimation groups was not significant. The rectal and skin
temperatures were significantly less for both acclimation groups relative to the control
Reproduced with permission of the copyright owner. Further reproduction prohibited without permission.
24
group. Also, both groups experienced a significant increase in sweat rate after the
acclimation protocol by about 0.14 kilograms/hour. When compared to the
preacclimation data, mean tolerance times for the HW and HD groups increased 27% and
11.3%, respectively. However, only the HW group had a significant increase in tolerance
time (McLellan & Aoyagi, 1996).
Shvartz, Magazanik and Click (1974) reported that mean exercise and resting
rectal temperature, skin temperatures, body heat storage, and heart rate decreased in five
male subjects (20-25 years) after a twelve-day training program. However, only the
exercise rectal temperature, skin temperature, and body heat storage were significantly
different (p<0.01) from the first day to the last day. Mean exercise rectal temperature of
all subjects decreased by 0.4°C, skin temperature decreased by 0.6°C, and body heat
storage decreased by 32 W/m^. From the first day to the last day of training, mean heart
rates (which were recorded 30 minutes into the protocol) decreased 35 beats per minute.
Also, it was reported that the increase in sweat rate was insignificant by 0.069 L/m^/hr.
This study used a training program that required subjects to step on a 31-cm bench at a
rate of 25 steps/min for 60 minutes or until they could no longer tolerate exercise
(Shvartz, Magazanik & Click, 1974). The training sessions were performed in a room
with a dry-bulb temperature of 21±0.5°C, a wet-bulb temperature of 17.5±0.7°C and a
wind speed less than 0.20 m/s. The subjects performed this protocol for six successive
days, rested on day seven, and continued training for an additional six days.
Heat acclimated individuals have a smaller reduction in plasma volume (for a
given body water deficit) when compared to unacclimated individuals (Horvath &
Horvath, 1973, Sawka, 1992). As plasma volume decreases due to sweat production and
water loss, the osmolality of the blood increases. Since heat acclimated individuals
Reproduced with permission of the copyright owner. Further reproduction prohibited without permission.
25
conserve electrolytes in their sweat (they have more dilute sweat), they have a greater
concentration of electrolytes remaining in their extracellular space. These electrolytes
exert an osmotic pressure, which redistribute fluid from the intracellular space to the
extracellular space. The increase in fluid in the extracellular space helps to maintain
plasma volume. Hence, heat acclimated individuals have a more stable plasma volume
during exercise in the heat when compared to unacclimated individuals (Sawka et al.,
2000, Sawka et al., 2001).
It is believed that the expansion in plasma volume is mediated by the influx of
protein into intravascular space and by sodium retention (Senay, Mitchell, & Wyndham,
1976, Wyndham et al., 1968). Although an inerease in plasma volume is a definite
outcome of heat acclimatization, the meehanisms that underlie this process remain
unresolved (Nadel, Mack, Nose, & Tripathi, 1987, Senay, 1986).
Heat acclimatization also improves cognitive performance. In unacclimatized
individuals, the ceiling for optimal cognitive functioning appears to be about 25°C (77°F)
while resting. Whereas, in acclimatized individuals, the upper temperature limit for
optimal cognitive functioning appears to be about 30-35°C (86-95°F) (Rodahl & Guthe,
1998).
In conclusion, it is widely accepted that heat acclimatization decreases heart rate
and rectal temperature while working at a given workload (Shvartz, Magazanik & Click,
1974, McLellan & Aoyagi, 1996). Heat acclimation also increases sweat rate, stroke
volume, and plasma volume (McLellan & Aoyagi, 1996, Horvath & Horvath, 1973,
Sawka 1992).
Reproduced with permission of the copyright owner. Further reproduction prohibited without permission.
26
Cardiovascular Drift
Prolonged exercise without any fluid replacement causes a decline in systemic
arterial, pulmonary arterial and right ventricular end-diastolic pressures and stroke
volume, as well as a gradual increase in heart rate (Ekelund, 1967, Rowell, 1986). These
responses are the significant constituents of cardiovascular drift (Rowell, 1974, Rowell,
1986). In cardiovascular drift, stroke volume decreases. However, cardiac output is
maintained by an increase in heart rate. The increase in heart rate and decrease in stroke
volume are equal in magnitude, but opposite in direction (Guyton & Hall, 2000).
Cardiovascular drift is attributed to the competition for blood flow between the working
muscles and skin, as well as the decreasing plasma levels during dehydration.
Cardiovascular drift is detrimental to performance because it increases cardiovascular
strain. However, sufficient fluid replacement may attenuate cardiovascular drift (Coyle
& Montain, 2001).
Hamilton, Alonso, Montain, and Coyle (1991) demonstrated that rectal
temperature increased in endurance-trained cyclists after two hours of a moderately
intense exereise (70-76% VOzmax) without fluid replaeement. However, the increase in
rectal temperature was attenuated with sufficient fluid replacement. Additional results
revealed that the lack of fluid replacement caused cardiovascular drift to occur as stroke
volume decreased 15%, heart rate increased 10%, and subsequently, cardiac output
decreased 7% (Hamilton et al., 1991). Conversely, fluid replacement resulted in an
increase in cardiac output by 7%. With fluid replacement, there was no decrease in
stroke volume, and a 5% increase in heart rate (Hamilton et al., 1991). Although fluid
replacement attenuates hyperthermia, the mechanisms underlying this observation are
unknown. Proposed mechanisms include: 1) fluid ingestion counteracts the reduction in
Reproduced with permission of the copyright owner. Further reproduction prohibited without permission.
27
blood volume, 2) fluid ingestion reduces intracellular dehydration and hypertonicity of
the extracellular fluid (Coyle & Montain, 2001).
Cognitive Function
Nielsen, Savard, Richter, Hargreaves, and Saltin (1990) believe that the primary
cause of exhaustion in severe hyperthermic conditions is due to the effect of heat stress
on brain function. When exposed to high temperatures, the central nervous system
(CNS) and cognitive functions are adversely affected. These authors speeulate that core
body temperatures greater than 39°C (102.2° F) reduce the funetion of motor centers and
their ability to recruit motor units that are required for the desired activity. This reduction
of the CNS function may occur because of the effect of high ambient temperature on the
motivation for motor performanee. As a result of hyperthermic conditions, confusion and
dizziness usually occurs in heat-stressed individuals (Nielsen, et al. 1990).
It has been documented that specific aspects of cognitive performance deteriorate
due to heat exposure. For example, during heat exposure indices of sustained attention,
error rate, response time and task accuracy are all negatively affected. These declines in
cognitive function are present even when individuals are sedentary and euhydrated.
However, transient improvements in brain function result when individuals make a
conscious effort to increase cognitive function during heat exposure. With conscious
effort, individuals are able to temporarily sustain cognitive functioning levels similar to
cooler environments (Razmjou & Kjellberg, 1992). Therefore, fire fighters need to make
a conscious effort to sustain a high level of cognitive performance while working in
extreme heat.
It has been documented that hyperthermic environments inhibit cognitive
functioning in euhydrated states. The underlying meehanism of the decline in CNS
Reproduced with permission of the copyright owner. Further reproduction prohibited without permission.
28
functioning due to hyperthermia is not fully understood. The combined effects of heat
stress and dehydration on mental functioning has not been adequately studied. However,
it can be assured that the combined effects of hyperthermia and dehydration will result in
a greater handicap of CNS functioning when compared to one effector alone (Murray,
1995).
Effect of Heat on Oxygen Consumption
Submaximal Work
Studies have shown that oxygen consumption (VO2) increases when working in
hot environments (Consolazio, Matoush, Nelson, Torres & Issac, 1963, Robinson, 1949).
Consolazio et al. (1963) found that VO2 increased at rest and at submaximal cycling in
hot environments (100°F, 30% relative humidity) when compared to submaximal work
done in cooler environments (70°F and 85°F).
Others have shown that VO2 decreases while performing submaximal exercise in
the heat (Brouha, Smith, DeLanee, & Maxfield, 1961, Williams et al., 1962). Williams et
al. (1962) used a submaximal cycle ergometer test to measure the VO2 of three men.
They found that theVOz was lower in the humid heat (97°F dry-bulb temperature; 93°F
wet-bulb temperature) when compared to the same submaximal exercise in a comfortable
environment (70° F). Although the decrease in VO2 was significant, the decrease in VO2
was small and on the order of 0.2 L/min.
Others have shown that submaximal VO2 does not significantly change as
environmental temperatures increase (Klausen, Dill, Phillips, & McGregor, 1967,
Reproduced with permission of the copyright owner. Further reproduction prohibited without permission.
29
Robinson, 1949). However, both studies indicated that there was a trend for submaximal
VO2 to decrease while working in higher environmental temperatures.
Maximal Work
Klausen et al. (1967) found that maximal VO2 decreased in five out of six men
while working on a cycle ergometer in the heat. The hot environmental temperatures
ranged from 37.5°C to 40°C. These temperatures were not well controlled beeause it
relied on the desert heat. Along the same lines, Brouha et al. (1961) showed that the
V0 2 max of five female and six male subjects decreased in the dry heat.
Williams et al. (1962) found no significant decrease in V02max in three men.
This study utilized heavy workloads on a cycle ergometer in an environment of 97°F dry-
bulb temperature and 93°F wet-bulb temperature. Rowell, Blackmon, Martin,
Mazzarella, and Bruce (1965) also found no change in V02max in eleven male subjects
as determined by uphill running on a treadmill in the heat.
Sweat and Fluid Replaeement
Sweat Composition
The concentration of sweat is dependent upon the sweat rate, and the level of heat
acclimatization, physical fitness, diet, hydration, and sweat rate (Costill, 1977, Sawka,
Montain, & Latzka, 2001). Therefore, the concentration of ions lost through sweat is
highly variable. The major ions lost in sweat are Na"*" and Cl'. Sweat Na" eoncentrations
can range from 18-97 mEq/L, and have been reported as low as 5 mEq/L (Robinson &
Robinson, 1954). The average sweat Na" coneentration is 40-60 mEq/L. The
concentration of chloride in sweat is a little lower than the coneentration of sodium in
sweat. The average sweat Cl concentration is 30-45 mEq/L. Sweat is hypotonic, and
Reproduced with permission of the copyright owner. Further reproduction prohibited without permission.

30
therefore concentrations found in sweat are about one-third of their concentration in
plasma (Nadel, Mack, Takamata, 2001).
The concentration of in sweat is slightly higher than plasma and ranges from
1-15 mEq/L (Robinson et al., 1954). Sweat concentrations are much lower than Na'*'
concentrations and average at 4.5 mEq/L (Robinson & Robinson, 1954). Since sweat is
hypotonic, more water is lost from the body than salt and the plasma becomes more
hypertonic (Nadel, Mack, Takamata, 2001).
Although plasma sodium concentration levels usually rise during exercise,
excessive plain water consumption could over dilute the blood, and result in
hyponatremia. Hyponatremia is classified by plasma sodium concentration levels lower
than 130 mEq/L (Gisolfi, 1988). Normal plasma sodium levels range from 136-145
mEq/L (Marcus, 1962).
Since water and sodium are lost through sweat, they must be replaced to restore
homeostasis. Water replenishment is necessary to increase plasma volume, and sodium is
an important factor in increasing water absorption. Osmotic flow and the presence of
sodium in the extracellular spaee draw water out of the proximal renal tubule in the
kidney. This facilitates the conservation of water, and limits water excretion through
urine (Guyton & Hall, 2000).
It has been concluded that sodium content of the extracellular space regulates the
extracellular fluid volume (Nadel, Maek, Nose, 1990). Thus, a decrease in the
extracellular volume must occur when a sodium deficiency develops. This explains why
relatively stable plasma sodium eontent (or slightly elevated) during prolonged periods of
exercise is necessary when water and sodium are lost as sweat (Noakes, 1993).
Reproduced with permission of the copyright owner. Further reproduction prohibited without permission.
31
Hematocrit
Blood is composed of hematocrit and plasma. Hematocrit is the percentage of
blood that is composed of cells and plasma is the non-cellular portion of blood (Guyton
& Hall, 2000). Fluid lost as sweat decreases total body water (plasma levels),
consequently, there is a reduction in blood volume (Costill, 1984). Hematocrit
measurements can be used to determine the changes in plasma volume. For example, if
the hematocrit percentage rose sharply from one sample to the next, it can be assumed
that plasma volume has decreased dramatically. With exercise, hematocrit is expected to
increase due to the decrease in extracellular fluid, or water lost through sweat.
Fluid Replacement
Rowell (1986) stated that the combined effects of exercise and hyperthermia pose
the seeond greatest stress on the human cardiovascular system. The adverse affects are
two-fold. First, since the skin and muscles compete for blood flow, their demands can
easily be too large for the pumping capacity of the heart. Secondly, cardiac filling and
stroke volume decrease as cutaneous vasodilation transports the blood to the skin.
Ultimately, this will result in the failure to maintain adequate blood flow to both the
working muscles and the skin. Failure to maintain adequate blood flow to the muscles
results in the termination of work; failure to maintain adequate blood flow to the skin
results in hyperthermia (Rowell, 1986).
An effective way of replenishing the decreasing blood volume due to sweating is
accomplished by combining sodium chloride with water during rehydration (Nadel,
Mack, & Takamata, 2001). The net fluid retention during a three-hour period of plain
water rehydration was 51% of what was lost, whereas, salt capsules in conjunction with
Reproduced with permission of the copyright owner. Further reproduction prohibited without permission.
32
water resulted in a 71% net fluid retention (Nose, Mack, Shi, & Nadel, 1988). When salt
was ingested with water, plasma sodium concentrations were sustained for a greater
duration of the rehydration period. The intake of sodium capsules and water also caused
a significantly higher plasma sodium concentration when compared to water alone. The
sodium chloride delayed urine production and maintained the salt-dependent thirst drive,
thus leading to a more complete restoration of body water content (Nadel et al. 2001).
One way to decrease the risk of progressive dehydration during exercise is to
replace water and electrolytes at the same rates at which they are lost (Ladell, 1965).
Furthermore, the optimal replacement fluid should contain about one gram of
carbohydrate per minute of work, and an adequate amount of electrolytes that will
maintain serum osmolality and plasma volume (Noakes, 1993).
Montain and Coyle (1992) demonstrated that fluid replacement maintained blood
volume. Hence, fluid replacement between fire suppression work bouts is necessary in
order to maintain blood volume and venous return. As blood volume decreases with
dehydration, there is a further decrease in venous return to the heart, which decreases
stroke volume. This decrease in stroke volume decreases the physical working capacity
of the fire fighters.
Hvpohvdration
When hypohydrated, skin blood flow (Bittel & Henane, 1975) and local sweating
(Kenney, Tankersley, Newswanger et al., 1990) decreases. Whole-body sweating has
been reported to decrease (Kenney et al., 1990) or remain the same (Senay Jr., 1968)
while exercising at a given workload in the heat. However, in all cases mentioned above,
hypohydration caused an increase in core body temperature, even if the rate of whole-
body sweating remained unehanged (Sawka, Francesconi, Young, et al., 1984).
Reproduced with permission of the copyright owner. Further reproduction prohibited without permission.
33
Furthermore, hypohydration usually results in hypovolemia and hypertonicity.
These conditions contribute to increased heat storage and a reduction in heat loss (Sawka,
Latza, & Montain, 2001b). This increased core body temperature has implications in the
fire fighting occupation as Gonzalez-Alonso et al. (1999c) demonstrated, “a high internal
body temperature causes fatigue in trained subjects during prolonged exercise in
uncompensable heat stress environments.”
Furthermore, Cheung and MeLellan (1998a) showed that hypohydrated subjects
exhibited an increase in rectal temperature and heart rate while tolerance time decreased.
The results were consistent among heat acclimated and non-heat acclimated subjects. In
short, regardless of the level of heat acclimation, hypohydration simultaneously increased
rectal temperature and heart rate while decreasing tolerance time.
Hypohydration also affects other aspects of performance. For instance,
hypohydration causes a decrease in maximal aerobic power (Sawka & Pandolf, 1990),
anaerobic performance (Nielson, Kubica, Bonnesen, et al., 1981), muscular endurance
(Montain et al., 1998, Petrofsky & Lind, 1975), isometric endurance (Petrofsky & Lind,
1975), VOzmax (Craig & Cummings, 1966), mental performance (Adolf & Associates,
1947), and physical working capacity (Armstrong, Hubard, Szlyk, Matthew, & Sills,
1985).
In summary, hypohydration causes a decrease in blood volume, skin blood flow,
stroke volume, and sweating rate. Hypohydration causes an increase in plasma
osmolality, heat storage, body temperature, and heart rate (Coyle & Hamilton, 2001).
Humans are not able to adapt to chronic dehydration (Adolf & Associates, 1947). In fact,
the changes in physiological function due to heat acclimation and a high fitness level are
masked by hypohydration while exercising in the heat (Buskirk, lampietro, & Bass, 1958,
Reproduced with permission of the copyright owner. Further reproduction prohibited without permission.
34
Caderette, Sawka, Toner, & Pandolf, 1984, Sawka, Toner, Francesconi & Pandolf, 1983).
The effects of hypohydration on work performance has been researched in depth, and the
results reinforce the concept that fire fighters need to adequately replenish their fluids
between work bouts in order to maintain work at maximal capacity.
Gastric Emptying
The hydration state, volume, temperature and osmolality of the fluid influence the
rate of gastric emptying. Dehydration reduces the rate of gastric emptying (Neufer,
Young, & Sawka, 1989). Also, the volume of fluid is one of the strongest regulators of
gastric emptying (Costill, 2001). The fluid volume is proportionate to the rate of gastric
emptying, up to a volume of 600 ml (Costill & Saltin, 1974).
Costill and Saltin (1974) have determined that cold drinks empty more rapidly
than warmer ones. By ingesting cold water, gastric temperature drops by 7-18°C (12.6-
32.4°F). A decrease in gastric temperature increases the motility of smooth muscle in the
stomach wall, causing a faster flow of fluid into the intestine.
It is well known that a carbohydrate-electrolyte fluid enhances intestinal sodium
absorption and decreases the extent of diuresis (Gisolfi, 1991, Noakes, 1993, Riklis &
Quastel, 1958, Schedl & Clifton, 1963, Schultz & Curran, 1970). A 250-mOsm/L
sodium chloride solution has a faster emptying rate than water. A 500-mOsm/L sodium
chloride solutions empties at a rate of 27 ml/min, the same rate as water. Hunt and Knox
(1969) proposed that sodium chloride exerts an osmotic effect, which increases gastric
emptying. Gisolfi (1991) showed that in 40 centimeters of duojejunum, the absorption
rate of a 6% carbohydrate-electrolyte fluid was 480 ml/hour, whereas the rate of plain
water absorption averaged 324 ml/hour. Costill (2001) documented that a drink with 6%
Reproduced with permission of the copyright owner. Further reproduction prohibited without permission.
35
carbohydrate emptied at a rate of 9.9 ml/min. If this gastric emptying rate continued for
an hour, 594 millimeters of fluid would empty in the hour.
Gastric motility and emptying is influenced by the osmolality of the ingested
fluid. Excessive amounts of glucose, fructose, and sucrose decrease the rate of gastric
emptying. The addition of electrolytes elevates the osmolarity of the solution and further
decreases the rate of gastric emptying (Hunt & Knox, 1969). Therefore, replacement
fluids should contain very little sugar (less than 25 g/L) and electrolytes.
Summary
Research has shown that gender differences pose a minimal effect on work
duration if females and males are matched for the level of physical conditioning and body
compositions (McLellan, 1998). In an UHS environment, many factors affect fire
fighters’ work performance and the level of physiological strain. The physical fitness
level of the fire fighter and the state of heat acclimation are huge predictors of work
duration and work performance (Selkirk, 2000, Cheung & McLellan, 1998a, Windle &
Davies, 1996, Nadel, Pandolf, Roberts, & Stolwijk, 1974, Shvartz, Magazanik, & Glick,
1974, McLellan, 2000). Also, adequate fluid replacement between work bouts decreases
the level of physiological strain while working in extreme heat (Montain & Coyle, 1992,
Cheung & McLellan, 1998a). The interactions among fitness level, the state of heat
acclimation, the effects of heat stress on eognitive function, and the level of hydration
play important roles in determining the performance and physiological strain elicited by
fire fighters.
Reproduced with permission of the copyright owner. Further reproduction prohibited without permission.
CHAPTER 3
METHODS
Prior to Testing
The study was approved by UNLV’s Institutional Review Board (appendix A).
Since the subject’s diet could have affected the physiological responses to work in the
heat, a diet record was taken three days prior to the second day of testing (appendix C).
The diet record was analyzed using The Food Processor (ESHA Research, version 7.81,
2000, Salem, OR), which determined carbohydrate, protein, fat, sodium, and potassium
contributions to the diet (appendix C contains an example of one subject’s dietary
analysis). It appeared that all subjects were similar in diet; no bizarre dieting habits were
observed. The dietary survey was not statistically analyzed. It was conducted in case a
need arose to explain unusual physiological responses to the heat. A summary of the
dietary results is presented in appendix C.
Testing for the second and third days of testing were completed during the luteal
phase of the menstrual cycle (fourteen days after the start of the menstrual cycle).
Subjects four and six did not have a menstrual cycle because subject four had a
hysterectomy and subject six was receiving Depo-Provera injections. Subject seven was
taking Trivora, an oral contraceptive.
36
Reproduced with permission of the copyright owner. Further reproduction prohibited without permission.
37
Instrumentation
Temperature Data Logger and Thermistors
A temperature data logger (Grant Squirrel 1200 series, Cambridge, England) was
used to continuously record the rectal, skin and environmental temperatures. The data
logger had data ports to accommodate the skin, rectal, and environmental thermistors.
The skin thermistors (Yellow Springs Instrument, 400 series, Dayton, OH) were flat,
round, metal discs (about 0.25 inches in diameter) connected to an insulated, connecting
wire. The metal discs were on the subject’s skin, and the temperature was sent to the data
logger. The rectal probe (Yellow Springs Instrument, 400 series, Dayton, OH) was a
flexible, vinyl-covered thermistor that transmitted rectal temperature to the data logger.
The environmental ehamber temperature was measured using a skin thermistor that was
suspended approximately nine inches in front of the subject at waist level; this was also
attached to the data logger. The data logger recorded all temperatures every ten seconds.
Prior to testing, the data logger was sent to the manufacturer for calibration. All
thermistors were NIST-Traceable (National Institute of Standards and Technology).
Each thermistor was calibrated and certificated by NIST standards.
Metabolic Svstem
The metabolic system (VacuMed, Ventura, CA) was calibrated according to
manufacturer specifications each day prior to testing (appendix D). Since the last two
days of testing occurred in the environmental chamber, the expired air temperature for the
metabolie system was set at 40°C.
Hematocrit Centrifuge
The hematocrit centrifuge (DAMON/IEC, Model MB) was calibrated using a
tachometer; the timer was calibrated against a stopwatch, and the brushes and the brake
Reproduced with permission of the copyright owner. Further reproduction prohibited without permission.
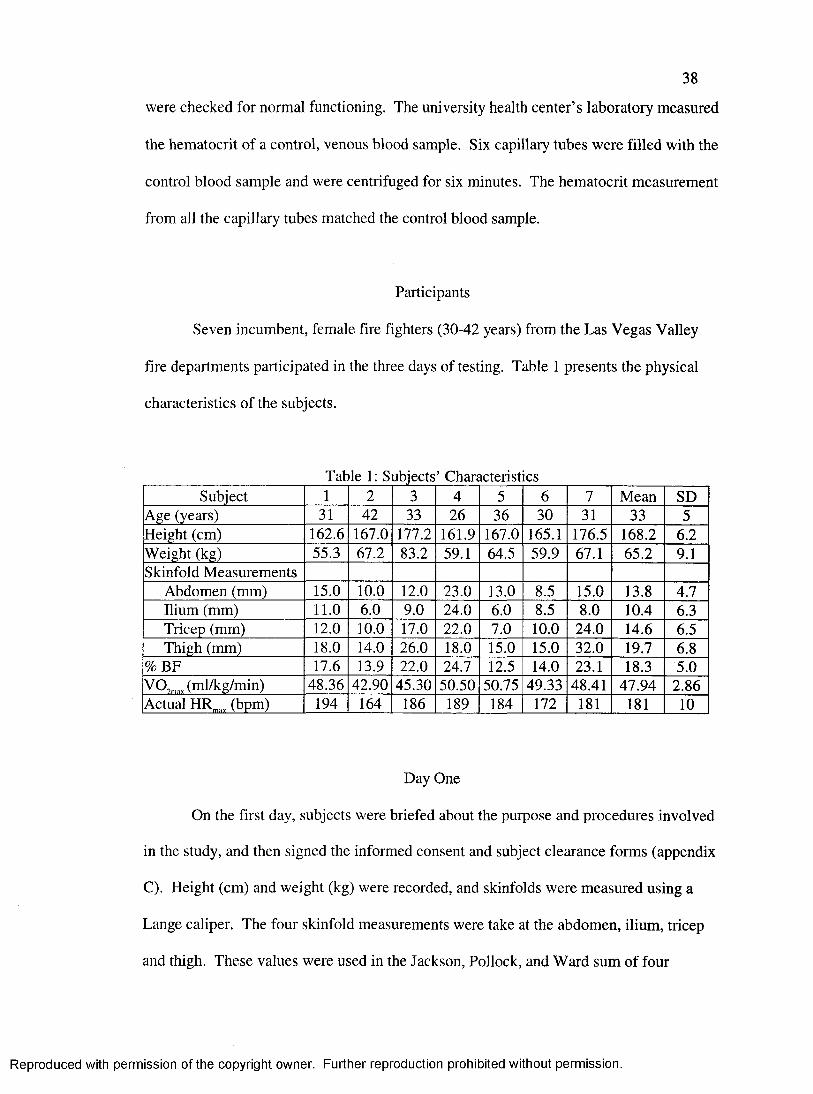
38
were checked for normal functioning. The university health center’s laboratory measured
the hematocrit of a control, venous blood sample. Six capillary tubes were filled with the
control blood sample and were centrifuged for six minutes. The hematocrit measurement
from all the capillary tubes matched the control blood sample.
Participants
Seven incumbent, female fire fighters (30-42 years) from the Las Vegas Valley
fire departments participated in the three days of testing. Table 1 presents the physical
characteristics of the subjects.
Table 1: Subjects’ CharacteristicsSubject 1 2 3 4 5 6 7 Mean SD
Age (years) 31 42 33 26 36 30 31 33 5Height (cm) I62J5 167.0 177.2 161.9 167.0 165.1 176.5 168.2 6.2Weight (kg) 55.3 67.2 833 59.1 64.5 59.9 67.1 65.2 9.1Skinfold Measurements
Abdomen (mm) 15.0 10.0 12.0 23.0 13.0 8.5 15.0 13.8 4.7Ilium (mm) 11.0 6.0 9.0 24.0 6.0 8.5 8.0 10.4 6.3Tricep (mm) 12.0 10.0 17.0 22 0 7.0 10.0 24.0 14.6 6.5Thigh (mm) 18.0 14.0 2&0 18.0 15.0 15.0 32.0 19.7 6.8
% B F 17.6 13.9 22 0 24.7 12.5 14.0 23.1 18.3 5.0(ml/kg/min) 4836 42.90 45.30 50.50 50.75 4933 48.41 47.94 2 8 6
Actual HR^_ (bpm) 194 164 186 189 184 172 181 181 10
Day One
On the first day, subjects were briefed about the purpose and procedures involved
in the study, and then signed the informed consent and subject clearance forms (appendix
C). Height (cm) and weight (kg) were recorded, and skinfolds were measured using a
Lange caliper. The four skinfold measurements were take at the abdomen, ilium, tricep
and thigh. These values were used in the Jackson, Pollock, and Ward sum of four
Reproduced with permission of the copyright owner. Further reproduction prohibited without permission.
39
equation (Jackson, Pollock, & Ward, 1980). The sum of four equation was:
%BF = 0.29669 * (E4) - [0.00043 * (14)^] + 0.02963 * (age in years) + 1.4072.
Then, a maximum oxygen uptake (VOzmax) test was administered to each subject
on a treadmill. The subject was fitted with the appropriate-sized facemask, and elastic
straps secured the facemask over the nose and mouth. The facemask was fitted tightly to
create an airtight seal. The telemetric heart rate monitor strap (Polar Electro, Inc., A1
series, Woodbury, NY) containing electrodes was dampened with water, and it was fitted
around the subject’s chest. After it was determined that the heart rate monitor was
working, the subject straddled the treadmill belt. The pneumotach, which measures
expiration volumes, was attached to the subject’s facemask, and the subject began to
walk as a warm up to the test.
It was practical to have the test last between ten and fifteen minutes. After the
warm up, the subject self-selected her running speed; depending on her running
experience, the speed of the treadmill varied between four to seven miles per hour (mph).
The protocol was set for two-minute stages, with progressive increases in grade (2-3%) at
the end of each stage while the speed was held constant. Heart rate and oxygen
consumption were averaged every twenty seconds and then recorded by the metabolic
system. During the last fifteen seconds of each stage, the subject indicated her rating of
pereeived exertion (RPE) on a chart, and this number was recorded.
The criteria for the termination of the test were: a respiratory exchange ratio
(RER) greater than or equal to one; a plateau in VOz; or the subject’s request to stop.
After the subject reached her maximal working capacity, the pneumotach and facemask
were removed. The subject was allowed to cool down by walking on the treadmill at a
self-selected speed, with no incline. Only heart rate was monitored during the cool down.
Reproduced with permission of the copyright owner. Further reproduction prohibited without permission.
40
Once heart rate decreased to 120 beats per minute, the subject stopped walking and
stepped off the treadmill. After the test, the subject’s VOzmax and maximum heart rate
were recorded. Then, 50% of the subject’s VOzmax was calculated.
Day Two
The original purpose of day two was to determine the subject’s sweat rate and
sweat composition (sodium and potassium concentrations). Once these values were
attained, the appropriate volume and composition of fluid replacement was to be given to
the subject on day three. However, due to technical and procedural difficulties, it was
decided that subjects would rehydrate with a commercial sports drink (Gatorade®) but
the volume was determined by the sweat loss. The difference between pre- and post
nude body weights (kg) determined sweat loss. One liter of Gatorade® was replaced for
every kilogram of weight lost.
On the second day of testing, the procedures were explained to the subject. Gauze
was tied ten centimeters from the end of the rectal probe (Yellow Springs Instrument, 400
series, Dayton, OH) as a marker for the subject. The marker ensured that each subject
inserted the probe exactly ten centimeters into the rectum. A nude body weight was
recorded and then the subject dressed in clothing that is usually worn under the turnouts
(cotton t-shirt and shorts). At this time, the subject was fitted with a telemetric heart rate
monitor (Polar Electro, Inc., A1 series, Woodbury, NY). The heart rate monitor strap
was dampened with water and then fitted around the subject’s chest. To ensure the strap
was fitted properly, the heart rate monitor which displayed the subject’s heart rate was
checked.
Latex disposable gloves used for collecting sweat and the subject’s hands were
Reproduced with permission of the copyright owner. Further reproduction prohibited without permission.
41
rinsed with distilled water, and allowed to air dry. The gloves were fitted and secured at
the wrist with sweat-resistant tape (Beiersdorf Leukotape, Bangkok, Thailand). The skin
thermistors were attached securely with sweat-resistant tape on the right side of the body
at the following locations: lateral mid-upper arm, anterior mid-thigh, upper anterior chest,
three inches below the mid-clavicle, and mid-calf. The thermistors were attached to the
data logger, and checked for normal functioning. Pre-exercise rectal temperature and
resting heart rate were recorded.
The subject then dressed in the regulation fire fighter pants and jacket (Morning
Pride Manufacturing, Inc., Dayton, OH), Fireguard Crosstech® gloves, and a Nomex®
hood. Normally, fire fighters wear boots that weigh about 1.36 kilograms each,
depending on the boot size. To facilitate walking on the treadmill, athletic shoes were
worn. However, weight was added to each ankle to equal the weight of the boot. The
subject’s athletic shoes were weighed, and the weight of each shoe was recorded. The
subject put on the athletic shoes and ankle weights. The combined weights of the shoes
and ankle weights equaled 1.36 kilograms per foot (1.37+0.03 kg), equaling the weight of
the boots. The full fire fighting ensemble, including footwear weighed a total of 21.4
kilograms.
The subject was then fitted with the facemask for measuring oxygen consumption.
The subject put on the helmet and self-contained breathing apparatus (SCBA). Since the
oxygen consumption mask was being used, the SCBA facemask was secured to the
SCBA and jacket, but was not worn on the face; it was carried to add to the normal
equipment weight.
The subject entered the environmental chamber, which was at 40.0±0.7°C and a
relative humidity of 19.4±3.0%. The thermistor cables, gas sampling lines, and
Reproduced with permission of the copyright owner. Further reproduction prohibited without permission.
42
telemetric heart rate cable passed through the wall of the environmental room and were
attached into the respective outlets on the data logger and metabolic system. The subject
began to walk on a treadmill. The subject selected her walking speed, and the grade was
increased until she reached the predetermined 50% of her measured V02max. At this
point, the speed and grade of the treadmill were recorded and the time of the work
started. The subject walked for an additional twenty minutes. The data logger recorded
rectal, skin and environmental temperatures every ten seconds. The metabolic system
automatically averaged and recorded heart rate and oxygen consumption every twenty
seconds. Ratings of perceived exertion, or RPE (Borg, 1998) were recorded every five
minutes.
Mean skin temperature was calculated as described by Ramanathan (1964).
MST = 0.3 * (tarm + tchest) + 0.2 * (tthigh + tca lf) ,
where MST represents the mean skin temperature; tarm, tchest, tthigh, and tcair represent the
temperatures at the arm, chest, thigh, and calf, respectively. All temperature data were
downloaded and exported to a computer Excel document, using Filewise Software
(Science Electronics-One, Dayton, OH).
The walk was terminated when the subjeet completed twenty minutes of walking
or when the subject exhibited one of the following: a reetal temperature of 39.5°C or
above, signs of severe or unusual fatigue, or the subject’s request to stop.
The subject exited the environmental chamber, removed the helmet, facemask,
jacket, pants and SCBA. The Fireguard Crosstech® gloves and disposable latex gloves
were removed and the sweat was collected. A funnel was used to pour the sweat from the
glove into a plastic vial. Sweat from each hand was stored in two separate vials and
labeled. As previously mentioned, the sweat was analyzed for sodium and potassium, but
Reproduced with permission of the copyright owner. Further reproduction prohibited without permission.
43
it was decided that this data would not be used. The skin thermistors and metabolic
system equipment were removed. The subject was allowed to rest until her heart rate
decreased to 120 beats per minute, and then the heart rate monitor was removed. The
subject entered an enclosed room, and completely undressed. After wiping the sweat
from the body with a towel, a final nude body weight was measured and the rectal probe
was removed. After dressing, the subject was allowed to rehydrate and if feeling
recovered and normal she could leave.
Day Three
Testing for day three took place within two weeks of day two. The procedures of
the third day of testing were similar to the day two. After the procedures were explained,
a spring-loaded lancet and two heparinized capillary tubes were used to collect a sample
of blood for hematocrit determination. The blood was centrifuged for six minutes, and
hematocrit was determined using a hematocrit percentage reader. Hematocrit was used
only as a supplementary measurement for the evaluation of dehydration and rehydration.
The subject fitted herself with a rectal probe as one day two. A nude body weight
was measured, and the subject dressed in clothing that is worn under the turnouts as on
day two. The subject was then fitted with a telemetric heart rate monitor. The skin
thermistors were applied identical to day two. Pre-exercise rectal temperature and resting
heart rate were measured.
The subject then dressed in complete fire fighter ensemble as before. Athletic
shoes and ankle weights replaced boots. Then the subject was again fitted with a
Reproduced with permission of the copyright owner. Further reproduction prohibited without permission.
44
facemask for measuring oxygen consumption, and the balance of the equipment as on day
two.
The subject entered the environmental chamber, which was 39.8±0.5°C and had a
relative humidity of 18.6±3.8%. The thermistor cables, gas sampling lines, and
telemetric heart rate cable were passed through the wall of the environmental room and
connected into the respective outlets on the data logger and metabolic system. The
treadmill was set at the speed and grade determined on day two. The subject began to
walk on the treadmill. The absolute workload was not adjusted; it was assumed that she
was working at 50% of her VOimax. The subject walked for three minutes to reach
steady state, and then walked for an additional 20 minutes. Rectal, skin and
environmental temperatures were recorded at ten second intervals by the data logger.
Heart rate and oxygen consumption were averaged every twenty seconds and recorded by
the metabolic system. RPE was recorded every five minutes. Mean skin temperature, as
previously described, was determined at a later time. The walk was stopped when the
subject completed 20 minutes of walking or when the subject exhibited one of the
following conditions: a rectal temperature of 39.5°C or above, signs of severe fatigue, or
the subject’s request to stop the test.
The subject exited the environmental chamber, removed the helmet, facemask,
Nomex® hood, jacket, gloves and SCBA, and pulled down the turnout pants around her
ankles. The subject sat seven feet in front of a fan (wind speed of 4.5 m/s when measured
27 em above the ground). Another blood sample was taken from the finger and
hematocrit percentage was determined. The subject rehydrated with Gatorade®. She
was given an amount that would adequately replenish her sweat losses as determined the
previous testing day (the mean volume of Gatorade® given to subjects was 627.1+90.7
Reproduced with permission of the copyright owner. Further reproduction prohibited without permission.

45
ml). The temperature of the beverage was recorded (24.3±0.95°C). The subject rested
until rectal temperature decreased to 0.5°C above baseline temperatures, with a maximal
recovery time of thirty minutes. The final resting heart rate was recorded. Once this
value was attained, the rest period ended.
The subject then donned the fire fighter ensemble and re-entered the
environmental chamber and the final work stage began. The subject walked on a
treadmill at the same speed and grade as the first work bout. The conditions remained
approximately the same as the first work period (40.0+0.9°C, 18.6+3.8% relative
humidity). The subject walked for three minutes to reach steady state. The subject’s
rectal and skin temperatures, and the environmental temperature were recorded every ten
seconds by the data logger. The heart rate and oxygen uptake were automatically
averaged and recorded every twenty seconds. RPE was monitored every five minutes as
previously explained. Time was stopped when the subject completed 20 minutes of
walking or when she exhibited one of the conditions mentioned earlier.
The subject exited the environmental chamber and removed the helmet, facemask,
jacket, Nomex® hood and Fireguard Crosstech® gloves, and the SCBA. The subject sat
seven feet in front of a fan (wind speed of 4.5 m/s when measured 27 cm above the
surface of the ground) with the turnout pants pulled down around her ankles. A final
blood sample was taken as described above, and the hematocrit percentage was
determined. The subject hydrated with Gatorade® as previously explained. The subject
was allowed to recover until a baseline temperature (0.5°C above pre-exercise level) was
achieved, with a maximal recovery time of 30 minutes. Once the rectal temperature
Reproduced with permission of the copyright owner. Further reproduction prohibited without permission.
46
reached baseline levels, the recovery time period was terminated, and the final recovery
heart rate was recorded.
The skin thermistors and heart rate monitor were removed. After wiping off the
sweat with a towel, a final nude body weight was measured and the rectal probe was
removed. After redressing, the diet record forms were collected, and the subject was free
to leave. Diet records were analyzed using The Food Processor (ESHA Research,
version 7.81, 2000, Salem, OR) and diets were analyzed for carbohydrate, protein, fat,
sodium and potassium (see appendix D).
Statistical Analyses
This study was a one-way design; [Group (work bouti, work bouta)]. The
independent variable was the number of work bouts. All subjects participated in both
work bouts. The dependent variables were peak HR, peak VO2, peak Tree, peak MST,
and peak RPE. Paired t-tests were used to compare the means of peak HR, peak VO2,
peak Tree, peak MST, and peak RPE between the first and second work bouts.
Peak HR for each subject was calculated by averaging the last minute of heart rate
data. Heart rate was recorded every twenty seconds, so peak HR was the average of three
numbers. Peak HR was calculated for both the first and second work bouts. A paired t-
test was used to compare the two means.
Peak VO2 was calculated by averaging VO2 over the last minute of each work
bout. VO2 was recorded every twenty seconds, so peak VO2 was the average of three
numbers. Peak VO2 was calculated for both work bouts, and a paired t-test was used to
compare the means.
The same analysis method was employed for Tree and MST. Peak Tree and MST
Reproduced with permission of the copyright owner. Further reproduction prohibited without permission.
47
were calculated for eaeh subject by averaging the last minute of data for each work bout.
Tree and MST were recorded every ten seconds. Therefore peak Tree was the average of
six numbers; peak MST was also the average of six numbers. The means were compared
using a paired t-test.
The highest RPE was used for the statistical analysis. The highest RPE was
always the last RPE recorded. Another paired t-test was used to compare RPE means.
Reproduced with permission of the copyright owner. Further reproduction prohibited without permission.
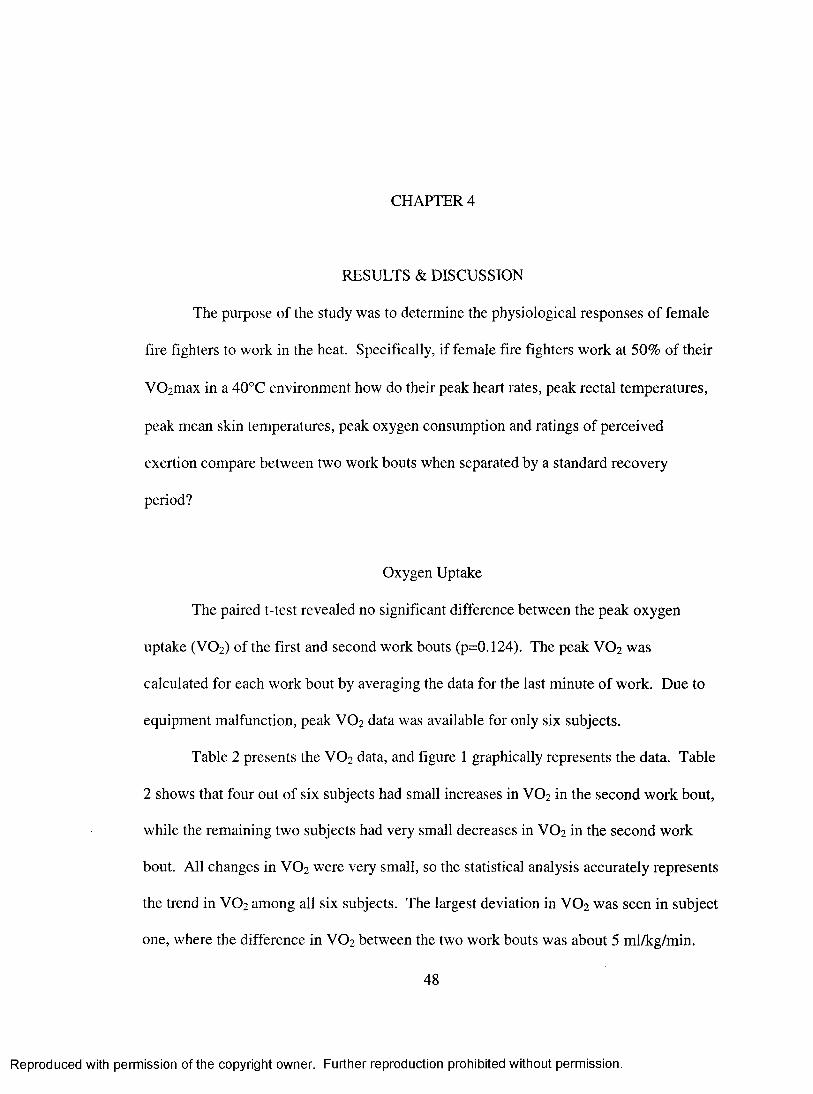
CHAPTER 4
RESULTS & DISCUSSION
The purpose of the study was to determine the physiological responses of female
fire fighters to work in the heat. Specifically, if female fire fighters work at 50% of their
VOzmax in a 40°C environment how do their peak heart rates, peak rectal temperatures,
peak mean skin temperatures, peak oxygen consumption and ratings of perceived
exertion compare between two work bouts when separated by a standard recovery
period?
Oxygen Uptake
The paired t-test revealed no significant difference between the peak oxygen
uptake (VO2) of the first and second work bouts (p=0.124). The peak VO2 was
calculated for each work bout by averaging the data for the last minute of work. Due to
equipment malfunction, peak VO2 data was available for only six subjects.
Table 2 presents the VO2 data, and figure 1 graphically represents the data. Table
2 shows that four out of six subjects had small increases in VO2 in the second work bout,
while the remaining two subjects had very small decreases in VO2 in the second work
bout. All changes in VO2 were very small, so the statistical analysis accurately represents
the trend in VO2 among all six subjects. The largest deviation in VO2 was seen in subject
one, where the difference in VO2 between the two work bouts was about 5 ml/kg/min.
48
Reproduced with permission of the copyright owner. Further reproduction prohibited without permission.
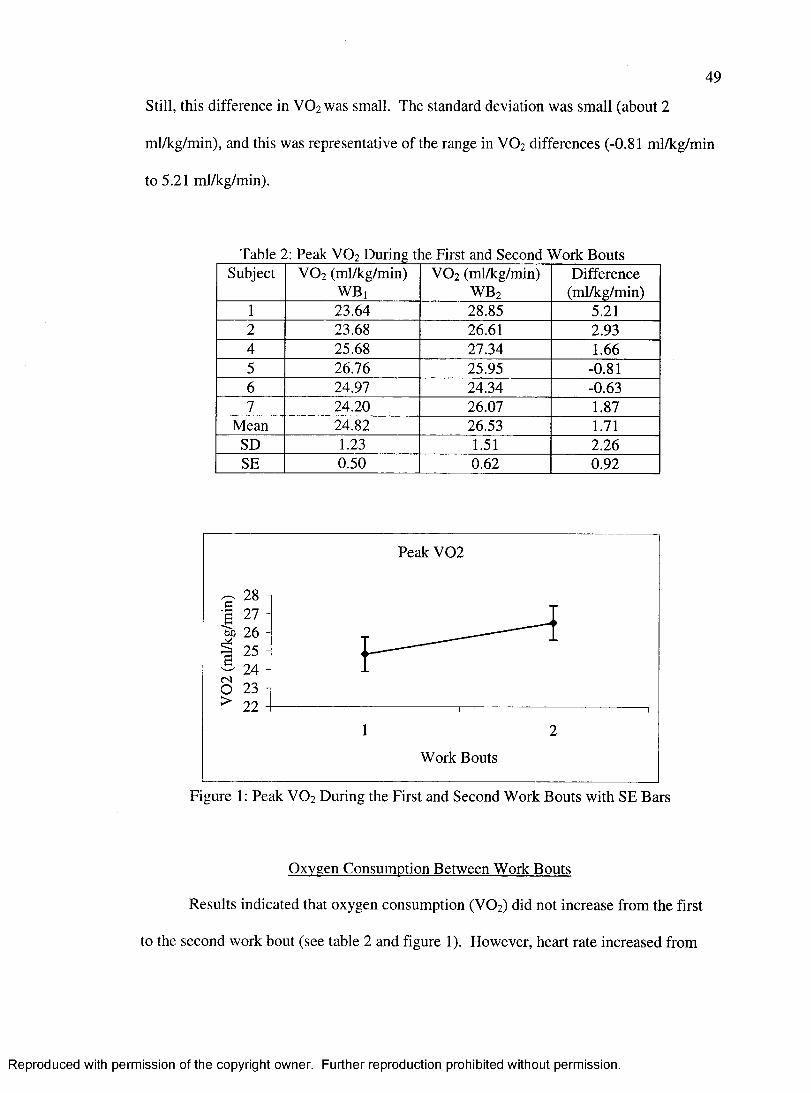
49
Still, this difference in VO2 was small. The standard deviation was small (about 2
ml/kg/min), and this was representative of the range in VO2 differences (-0.81 ml/kg/min
to 5.21 ml/kg/min).
Table 2: Peak VO2 During t le First and Second Work BoutsSubject VO2 (ml/kg/min) VO2 (ml/kg/min) Difference
WBi WB2 (ml/kg/min)1 23^4 28.85 5.212 23.68 2&61 2.934 25^8 27.34 1.665 2 6 J6 25^5 -0.816 24.97 24.34 -0.637 24.20 26.07 1.87
Mean 2182 26.53 1.71SD 1.23 1.51 22 6SE 0.50 0.62 0.92
Peak V 02
^ 26 -
^ 24 - O 2 3 -
Work Bouts
Figure 1: Peak VO2 During the First and Second Work Bouts with SE Bars
Oxvgen Consumption Between Work Bouts
Results indicated that oxygen consumption (VO2) did not increase from the first
to the second work bout (see table 2 and figure 1). However, heart rate increased from
Reproduced with permission of the copyright owner. Further reproduction prohibited without permission.
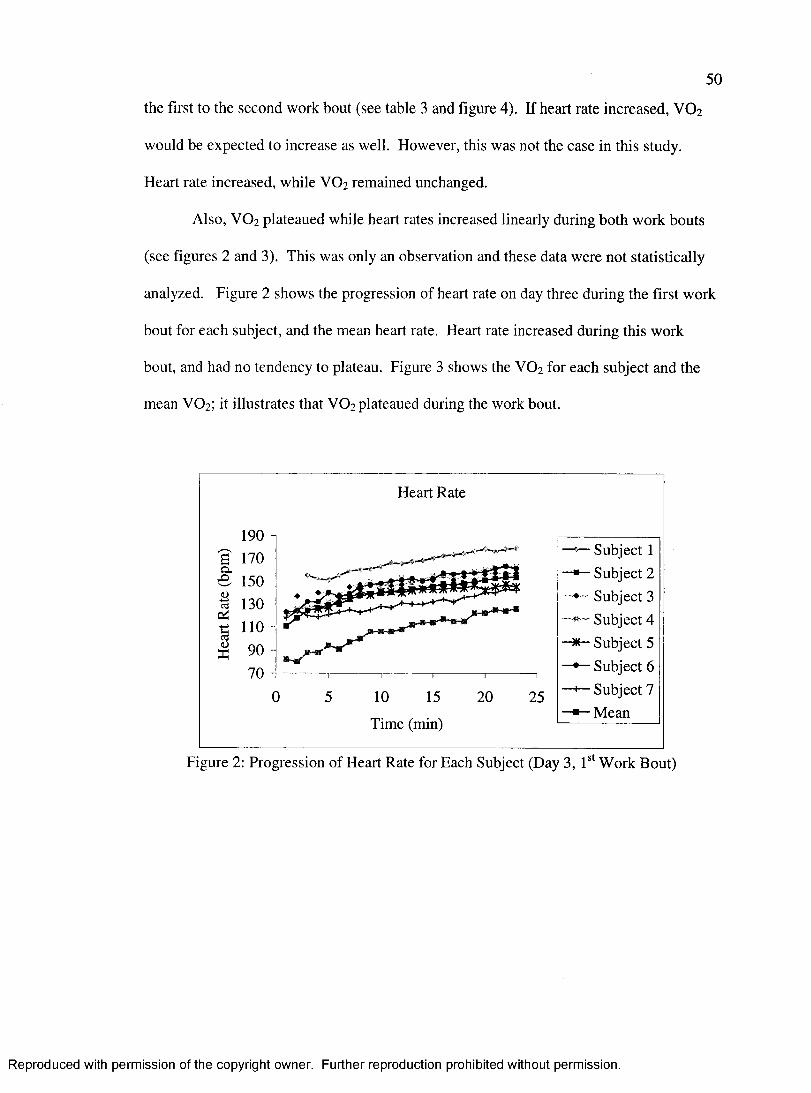
50
the first to the second work bout (see table 3 and figure 4). If heart rate increased, VO2
would be expected to increase as well. However, this was not the case in this study.
Heart rate increased, while VO2 remained unchanged.
Also, VO2 plateaued while heart rates increased linearly during both work bouts
(see figures 2 and 3). This was only an observation and these data were not statistically
analyzed. Figure 2 shows the progression of heart rate on day three during the first work
bout for each subject, and the mean heart rate. Heart rate increased during this work
bout, and had no tendency to plateau. Figure 3 shows the VO2 for each subject and the
mean VO2 ; it illustrates that VO2 plateaued during the work bout.
Heart Rate
190 nS' 170 -Ohe 150 -(1)
130 -Pi
110 -90 -70 J
0 10 15
Time (min)
20 25
Subject 1 Subject 2
♦ Subject 3 Subject 4 Subject 5 Subject 6 Subject 7
-«—Mean
Figure 2: Progression of Heart Rate for Each Subject (Day 3, F ' Work Bout)
Reproduced with permission of the copyright owner. Further reproduction prohibited without permission.
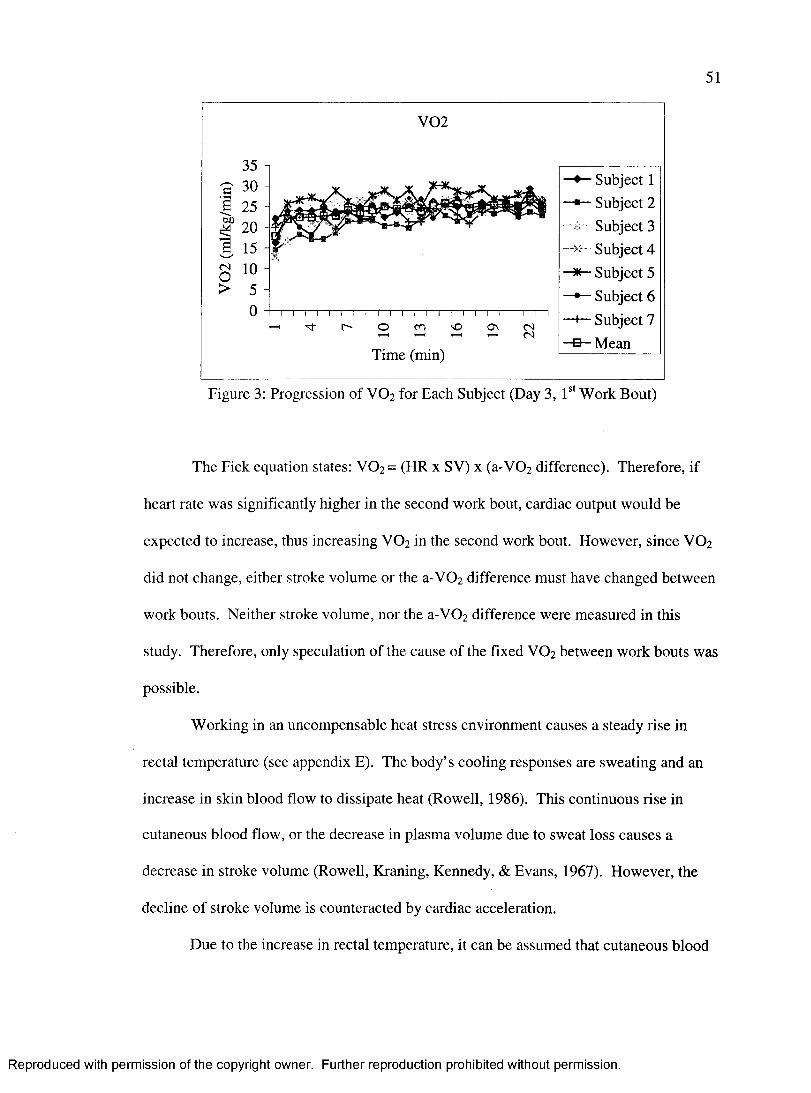
51
V 02
bû
g
35 30 25 20 15 H 10 5 0 “1 I i I I r~T
- Tf_ _ i I I I , I [ r
2 ^ STime (min)
1 1 I I I I
ON
Subject 1 Subject 2 Subject 3
-M Subject 4 Subject 5 Subject 6 Subject 7 Mean
Figure 3: Progression of VO2 for Each Subject (Day 3, F* Work Bout)
The Fick equation states; V 02= (HR x SV) x (a-V02 difference). Therefore, if
heart rate was significantly higher in the second work bout, cardiac output would be
expected to increase, thus increasing VO2 in the second work bout. However, since VO2
did not change, either stroke volume or the a-V0 2 difference must have changed between
work bouts. Neither stroke volume, nor the a-V02 difference were measured in this
study. Therefore, only speculation of the cause of the fixed VO2 between work bouts was
possible.
Working in an uncompensable heat stress environment causes a steady rise in
rectal temperature (see appendix E). The body’s cooling responses are sweating and an
increase in skin blood flow to dissipate heat (Rowell, 1986). This continuous rise in
cutaneous blood flow, or the decrease in plasma volume due to sweat loss causes a
decrease in stroke volume (Rowell, Kraning, Kennedy, & Evans, 1967). However, the
decline of stroke volume is counteracted by cardiac acceleration.
Due to the increase in rectal temperature, it can be assumed that cutaneous blood
Reproduced with permission of the copyright owner. Further reproduction prohibited without permission.
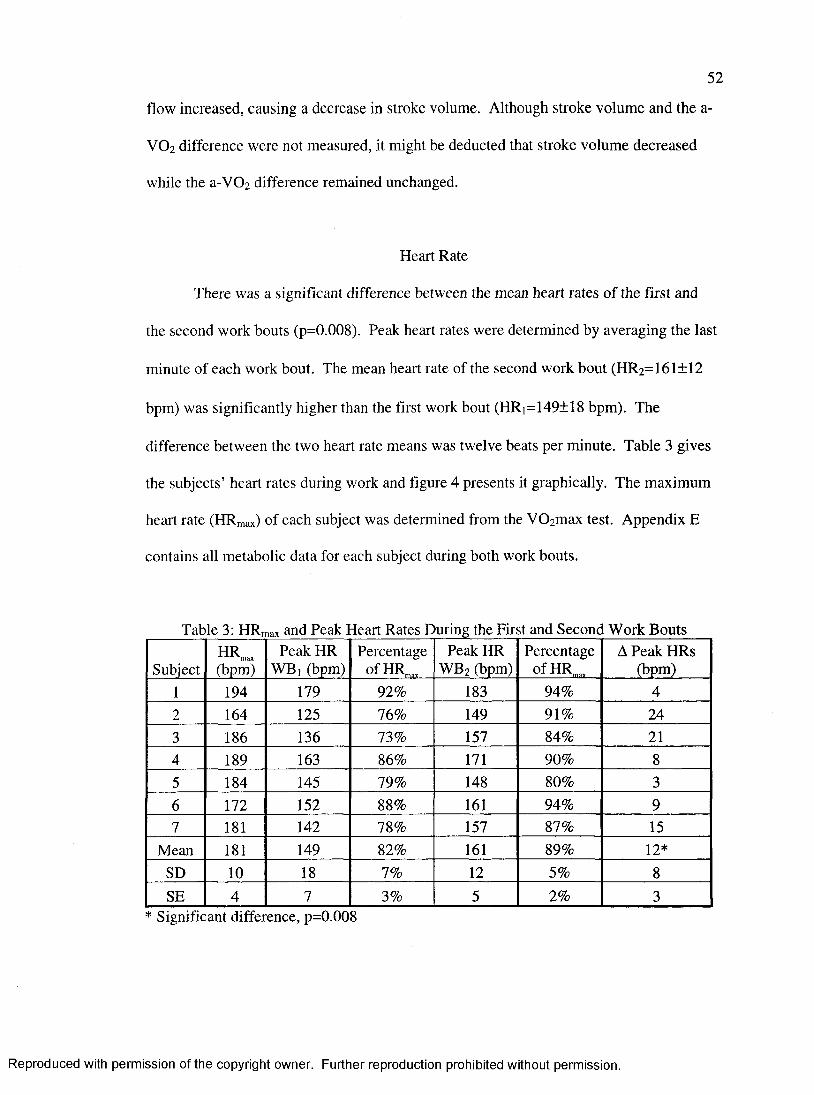
52
flow increased, causing a decrease in stroke volume. Although stroke volume and the a-
VO2 difference were not measured, it might be deducted that stroke volume decreased
while the a-V0 2 difference remained unchanged.
Heart Rate
There was a significant difference between the mean heart rates of the first and
the second work bouts (p=0.008). Peak heart rates were determined by averaging the last
minute of each work bout. The mean heart rate of the second work bout (HR2=161+12
bpm) was significantly higher than the first work bout (HRi=149±18 bpm). The
difference between the two heart rate means was twelve beats per minute. Table 3 gives
the subjects’ heart rates during work and figure 4 presents it graphically. The maximum
heart rate (HRmax) of each subject was determined from the V02max test. Appendix E
contains all metabolic data for each subject during both work bouts.
Table 3: HR^ax and Peak Heart Rates During the First and Second Work Bouts
SubjectH R _(bpm)
Peak HR WB] (bpm)
Percentageo fH R _
Peak HR WB2 (bpm)
Percentageo fH R _
A Peak HRs (bpm)
1 194 179 92% 183 94% 42 164 125 76% 149 91% 243 186 136 73% 157 84% 214 189 163 86% 171 90% 85 184 145 79% 148 80% 36 172 152 88% 161 94% 97 181 142 78% 157 87% 15
Mean 181 149 82% 161 89% 12*SD 10 18 7% 12 5% 8SE 4 7 3% 5 2% 3
* Significant difference, p=0.008
Reproduced with permission of the copyright owner. Further reproduction prohibited without permission.
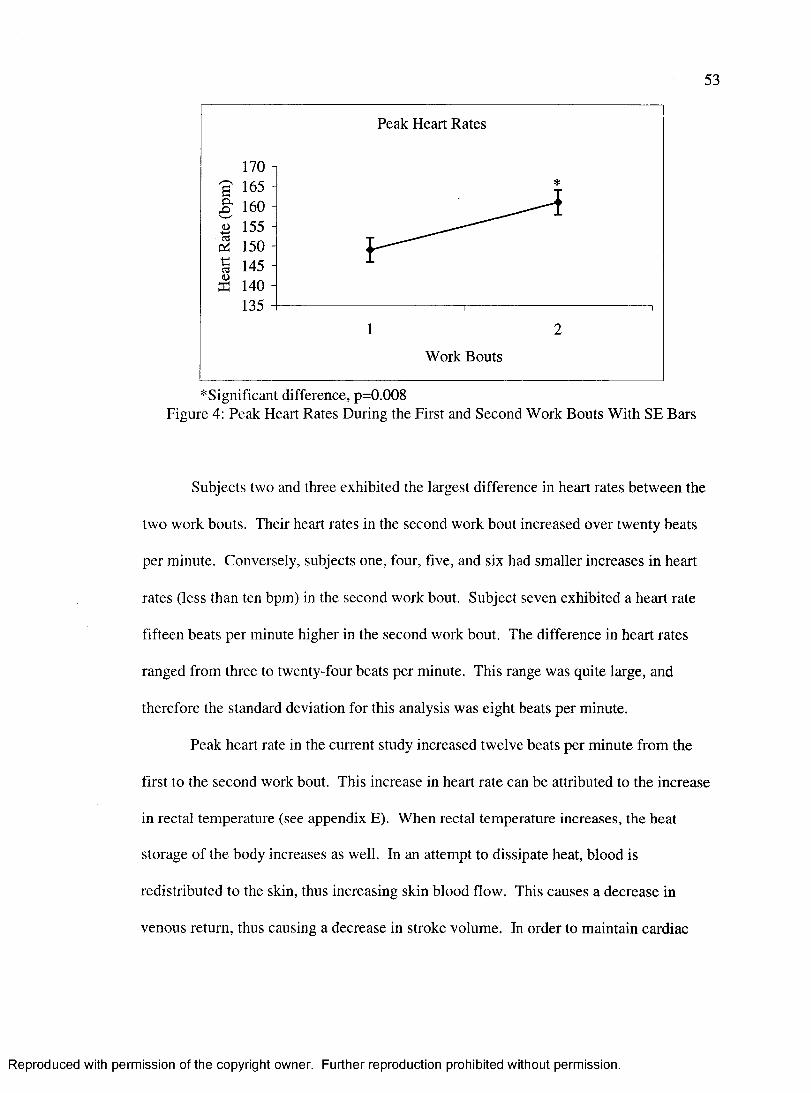
53
Peak Heart Rates
170 ? 165e 160B 155 S 150 1 145 Ï 140
135
Work Bouts
^Significant difference, p=0.008 Figure 4: Peak Heart Rates During the First and Second Work Bouts With SE Bars
Subjects two and three exhibited the largest difference in heart rates between the
two work bouts. Their heart rates in the second work bout increased over twenty beats
per minute. Conversely, subjects one, four, five, and six had smaller increases in heart
rates (less than ten bpm) in the second work bout. Subject seven exhibited a heart rate
fifteen beats per minute higher in the second work bout. The difference in heart rates
ranged from three to twenty-four beats per minute. This range was quite large, and
therefore the standard deviation for this analysis was eight beats per minute.
Peak heart rate in the current study increased twelve beats per minute from the
first to the second work bout. This increase in heart rate can be attributed to the increase
in rectal temperature (see appendix E). When rectal temperature increases, the heat
storage of the body increases as well. In an attempt to dissipate heat, blood is
redistributed to the skin, thus increasing skin blood flow. This causes a decrease in
venous return, thus causing a decrease in stroke volume. In order to maintain cardiac
Reproduced with permission of the copyright owner. Further reproduction prohibited without permission.
54
output, heart rate would need to increase in order to compensate for the decrease in stroke
volume. In fact, like rectal temperature, heart rates did not appear to plateau during both
work bouts (see figure 2 or appendix E). This response was expected because there is a
high correlation between rectal temperature and heart rate (Skoldstrom, 1987). The
increases in heart rate and rectal temperature during the work bout were gradual and
continuous, and they did not appear to plateau (see appendix E for complete rectal
temperature data). If subjects continued to work in the heat, there would probably be a
continuous rise in rectal temperature. These were only observations; the data during the
work bouts were not statistically analyzed.
Skoldstrom (1987) documented peak heart rates of fire fighters during work in the
heat (45°C, 15% relative humidity). The mean peak heart rate of eight subjects during
work in the heat was 169 beats per minute. Subjects walked at 3.5 kilometers per hour
for 60 minutes while wearing 30 kilograms of fire fighting equipment. This workload
corresponded to 20-30% of their maximal capacity. Maximal heart rates of the subjects
were not reported. Therefore, peak heart rates recorded during work in the heat could not
be compared to the actual maximal heart rates. However, in the current study, peak heart
rates were 149 beats per minute and 161 beats per minute for the first and second work
bouts, respectively. The peak heart rate of the second work bout was comparable to the
peak heart rate reported by Skoldstrom (1987).
Manning and Griggs (1983) documented that fire fighters’ heart rates quickly rose
to 70-80% of their maximal heart rates during initial exposure to fire fighting. However,
as the work progressed, their heart rates were maintained at 85-100% of their maximal
heart rate. During the first and second work bouts, subjects in this study maintained heart
rates at 82% and 89% of their maximal heart rate, respectively (see table 3). The
Reproduced with permission of the copyright owner. Further reproduction prohibited without permission.
55
subjects’ heart rates in this study were on the lower end of the range reported by Manning
and Griggs (1983).
Subjects in this study performed aerobic work at 50% of their VOimax. This
explains why their heart rates did not reach higher heart rates. Furthermore, the
environmental temperature was 40°C, which was considerably less than an actual fire
fighting environment. Since the workload and environmental temperatures were less than
an actual fire fighting setting, lower heart rates could be expected.
Rehvdration
Dehydration, and a decreased blood volume are other possible explanations for
the increase in peak heart rate from the first to second work bout. However, the
hematocrit measurements (see table 4) show that subjects were not dehydrated.
Hematocrit was measured before exercise (Hcti) and during the first and recovery
periods, (Hcti) and (Hctg). The difference between Hct] and Hct2 indicated water loss
during the first work bout. Since the subjects rehydrated during the first recovery period,
the difference between Hct2 and Hcta showed the effects of rehydration and additional
water loss during the second work bout. Mean hematocrit values before exercise and
during the first and second recovery periods were 41.2+2.3%, 42.5+3.2%, and
43.1+3.3%, respectively. These values are fall within 36%-48%, the typical hematocrit
range for women (Franklin, Whaley, & Howley, 2000).
A one-way ANOVA was used to determine the effects of exercise, rehydration
and water loss on hematocrit. The test revealed no significant differences among the
three hematocrit concentration means (F2, 18=0.768, p=0.479), indicating that subjects did
Reproduced with permission of the copyright owner. Further reproduction prohibited without permission.
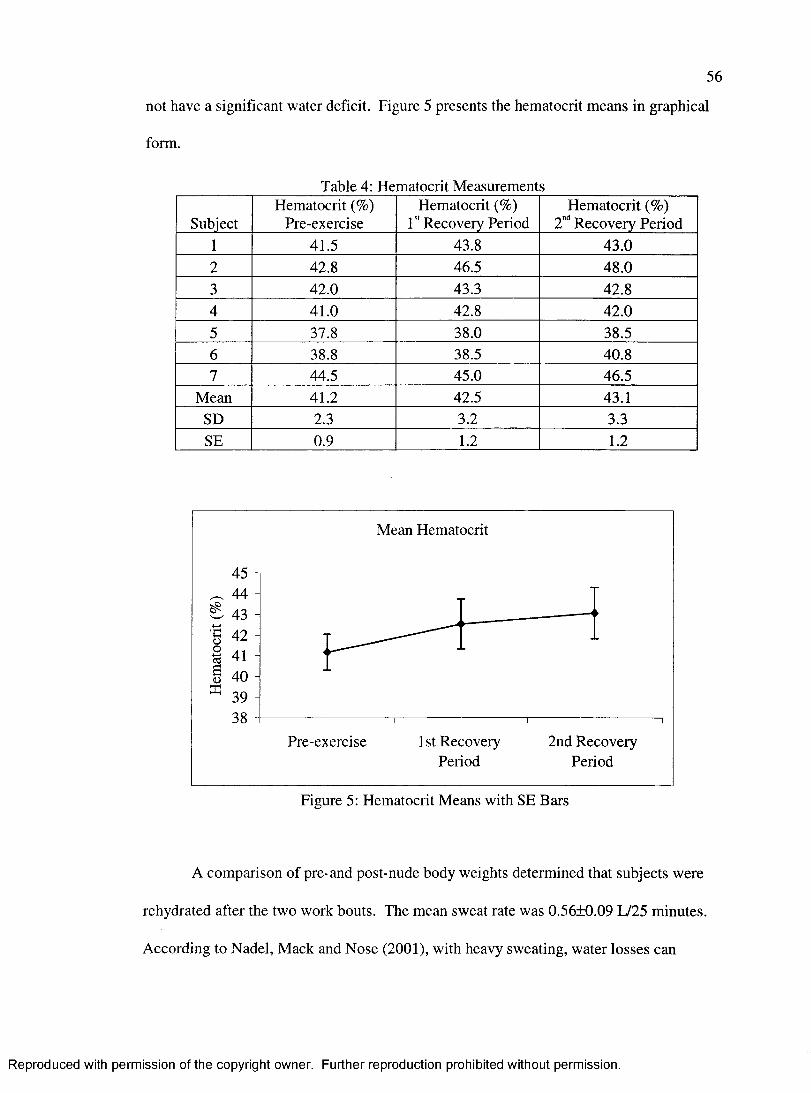
56
not have a significant water deficit. Figure 5 presents the hematocrit means in graphical
form.
Table 4: Hematocrit Measurements
SubjectHematocrit (%)
Pre-exerciseHematocrit (%)
F‘ Recovery PeriodHematocrit (%)
2"“' Recovery Period1 41.5 43.8 43.02 42.8 46.5 48.03 42.0 43.3 42.84 41.0 428 42.05 3T8 3&0 38.56 3&8 3&5 40.87 44.5 45.0 46.5
Mean 41.2 42.5 43.1SD 2.3 3.2 3.3SE 0.9 1.2 1.2
Mean Hematocrit
45 1 44 -
40 -
Pre-exercise 1 St Recovery Period
2nd Recovery Period
Figure 5: Hematocrit Means with SE Bars
A comparison of pre-and post-nude body weights determined that subjects were
rehydrated after the two work bouts. The mean sweat rate was 0.56+0.09 L/25 minutes.
According to Nadel, Mack and Nose (2001), with heavy sweating, water losses can
Reproduced with permission of the copyright owner. Further reproduction prohibited without permission.
57
exceed 1.8 L/hour. If the subjects continued to sweat at this reported rate for an entire
hour, their mean sweat rate would be 1.34+0.22 L/hour. Therefore, these results fall
within normal and acceptable limits.
Subjects were given Gatorade® as the fluid replacement drink during the two
recovery periods. The amount of Gatorade® given to the subjects depended on the
volume of sweat they lost on the second day of testing. The difference between the pre-
and post-nude body weights determined the sweat loss. For every kilogram of weight
loss, the subject was given one liter of Gatorade®. Subjects were allowed to drink ab
libitum and they were not forced to finish the drink. The mean volume fluid replacement
that subjects ingested during the first and second recovery periods were 0.63+0.09 liters
and 0.52+0.12 liters, respectively. Table 5 presents individual subject data.
Since it is widely accepted that dehydration is detrimental to performance
(Murray, 1995, Montain et al., 1998, Sawka & Pandolf, 1990), adequate rehydration
between multiple work bouts in the heat is of great consideration. Table 5 shows the
volume of fluid given to each subject, and the volume left in the cup. Interestingly,
subjects adequately rehydrated ab libitum when given one bolus of fluid. After the
subject finished the rehydration drink, they were satisfied, and did not want more to
drink. In 2001, Kenney stated:
“Surprisingly, if cold palatable beverages are within arm’s length of well-
trained, experienced, exercising athletes, most do drink enough to offset sweat
losses. However, if they have to move even a short distance to get a drink bottle,
voluntary dehydration usually occurs. This suggests that a complex behavioral
component is involved in determining fluid consumption by exercising athletes.
In less experienced athletes during exercise, and in almost all athletes after
Reproduced with permission of the copyright owner. Further reproduction prohibited without permission.
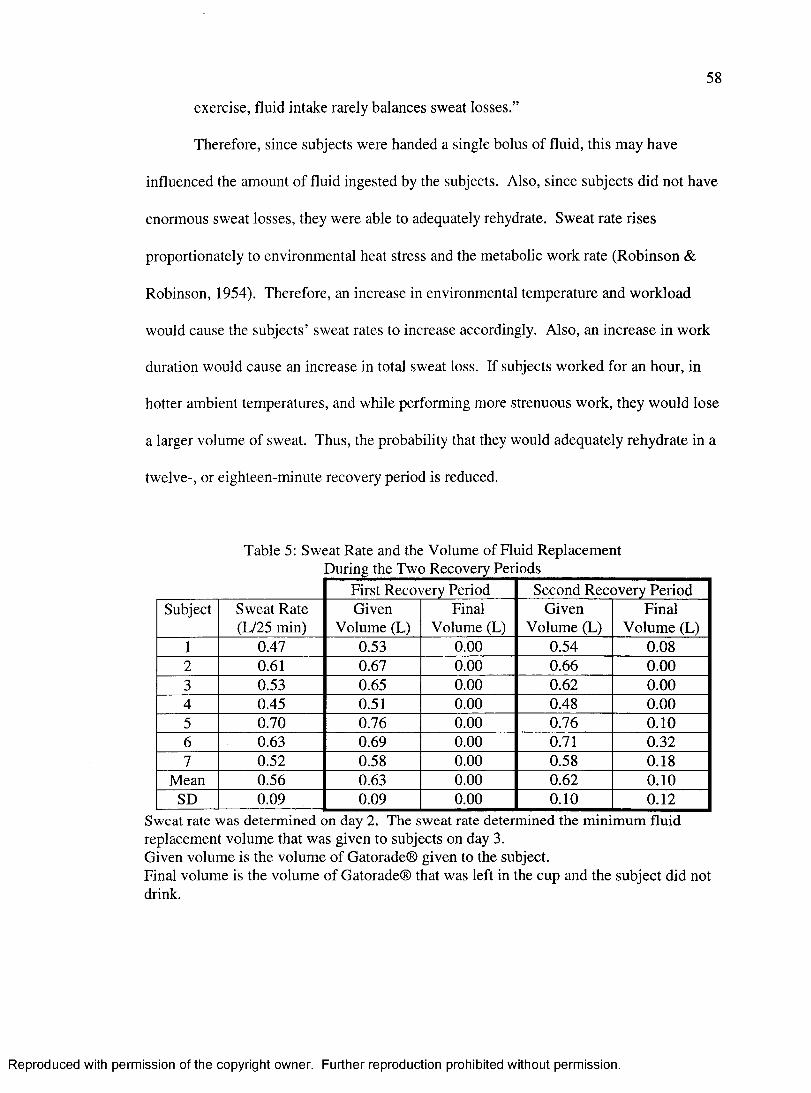
58
exercise, fluid intake rarely balances sweat losses.”
Therefore, since subjects were handed a single bolus of fluid, this may have
influenced the amount of fluid ingested by the subjects. Also, since subjects did not have
enormous sweat losses, they were able to adequately rehydrate. Sweat rate rises
proportionately to environmental heat stress and the metabolic work rate (Robinson &
Robinson, 1954). Therefore, an increase in environmental temperature and workload
would cause the subjects’ sweat rates to increase accordingly. Also, an increase in work
duration would cause an increase in total sweat loss. If subjects worked for an hour, in
hotter ambient temperatures, and while performing more strenuous work, they would lose
a larger volume of sweat. Thus, the probability that they would adequately rehydrate in a
twelve-, or eighteen-minute recovery period is reduced.
Table 5: Sweat Rate and the Volume of Fluid Replacement
First Recovery Period Second Recovery PeriodSubject Sweat Rate Given Final Given Final
(L/25 min) Volume (L) Volume (L) Volume (L) Volume (L)1 0.47 0.53 0.00 0.54 0.082 0.61 0.67 0.00 0.66 0.003 &53 0.65 0.00 0.62 0.004 0.45 0.51 0.00 0.48 0.005 0.70 0.76 0.00 0.76 0.106 0.63 0.69 0.00 0.71 0.327 0.52 0.58 0.00 0.58 0.18
Mean 0.56 0.63 0.00 0.62 0.10SD 0.09 0.09 0.00 0.10 0.12
Sweat rate was determined on day 2. The sweat rate determined the minimum fluid replacement volume that was given to subjects on day 3.Given volume is the volume of Gatorade® given to the subject.Final volume is the volume of Gatorade® that was left in the cup and the subject did not drink.
Reproduced with permission of the copyright owner. Further reproduction prohibited without permission.
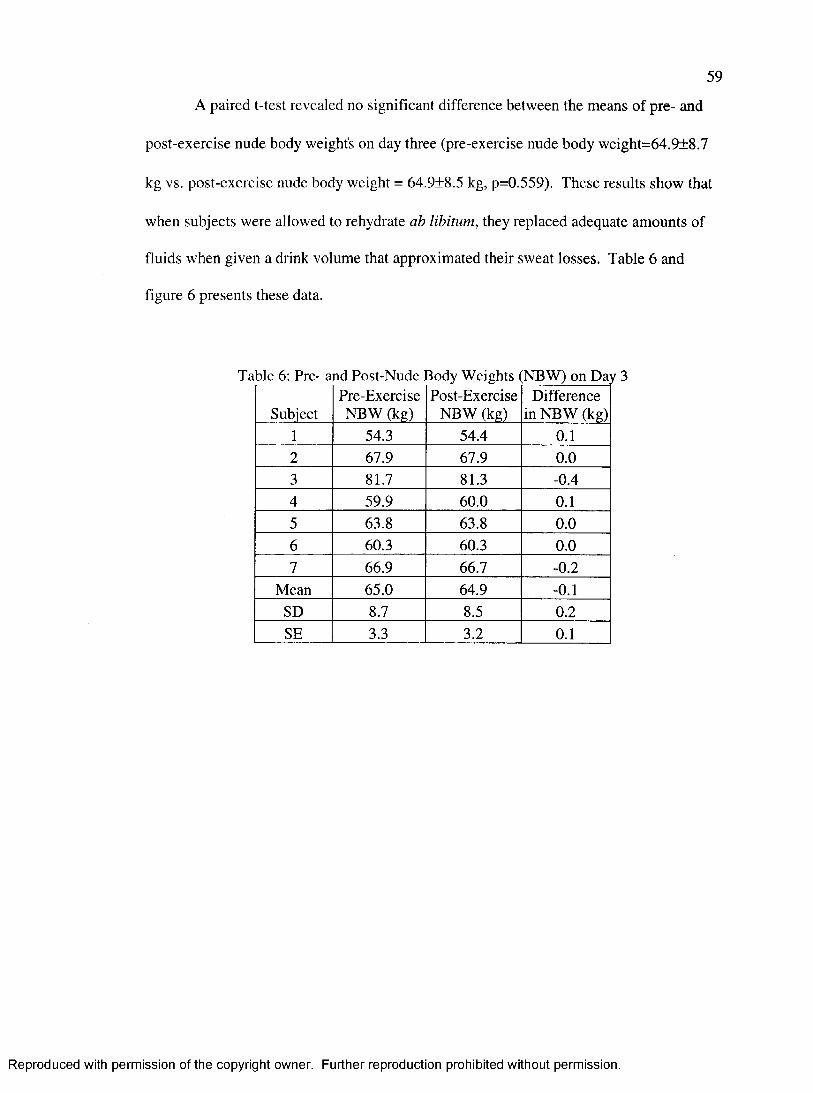
59
A paired t-test revealed no significant difference between the means of pre- and
post-exercise nude body weight's on day three (pre-exercise nude body weight=64.9±8.7
kg vs. post-exercise nude body weight = 64.9+8.5 kg, p=0.559). These results show that
when subjects were allowed to rehydrate ab libitum, they replaced adequate amounts of
fluids when given a drink volume that approximated their sweat losses. Table 6 and
figure 6 presents these data.
Table 6: Pre- and Post-Nude Body Weights NBW) on Day 3
SubjectPre-Exercise NBW (kg)
Post-Exercise NBW (kg)
Difference in NBW (kg)
1 54.3 54.4 0.12 67.9 67.9 0.03 81.7 81.3 -0.44 59.9 60.0 0.15 63.8 63.8 0.06 60.3 60.3 0.07 66.9 66.7 -0.2
Mean 65.0 64.9 -0.1SD 8.7 8.5 0.2SE 3.3 3.2 0.1
Reproduced with permission of the copyright owner. Further reproduction prohibited without permission.
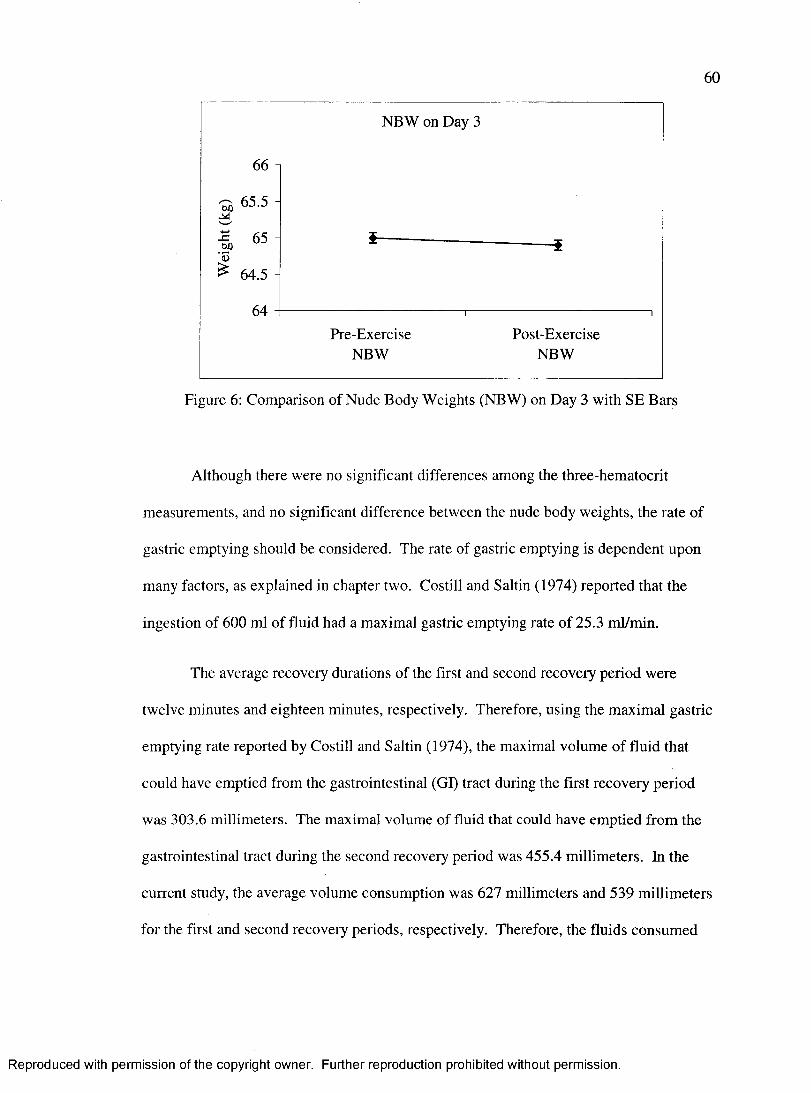
60
NBW on Day 3
66
65.5 H
^ 65 4I 64.5 -
64Pre-Exercise
NBWPost-Exercise
NBW
Figure 6: Comparison of Nude Body Weights (NBW) on Day 3 with SE Bars
Although there were no significant differences among the three-hematocrit
measurements, and no significant difference between the nude body weights, the rate of
gastric emptying should be considered. The rate of gastric emptying is dependent upon
many factors, as explained in chapter two. Costill and Saltin (1974) reported that the
ingestion of 600 ml of fluid had a maximal gastric emptying rate of 25.3 ml/min.
The average recovery durations of the first and second recovery period were
twelve minutes and eighteen minutes, respectively. Therefore, using the maximal gastric
emptying rate reported by Costill and Saltin (1974), the maximal volume of fluid that
could have emptied from the gastrointestinal (GI) tract during the first recovery period
was 303.6 millimeters. The maximal volume of fluid that could have emptied from the
gastrointestinal tract during the second recovery period was 455.4 millimeters. In the
current study, the average volume consumption was 627 millimeters and 539 millimeters
for the first and second recovery periods, respectively. Therefore, the fluids consumed
Reproduced with permission of the copyright owner. Further reproduction prohibited without permission.
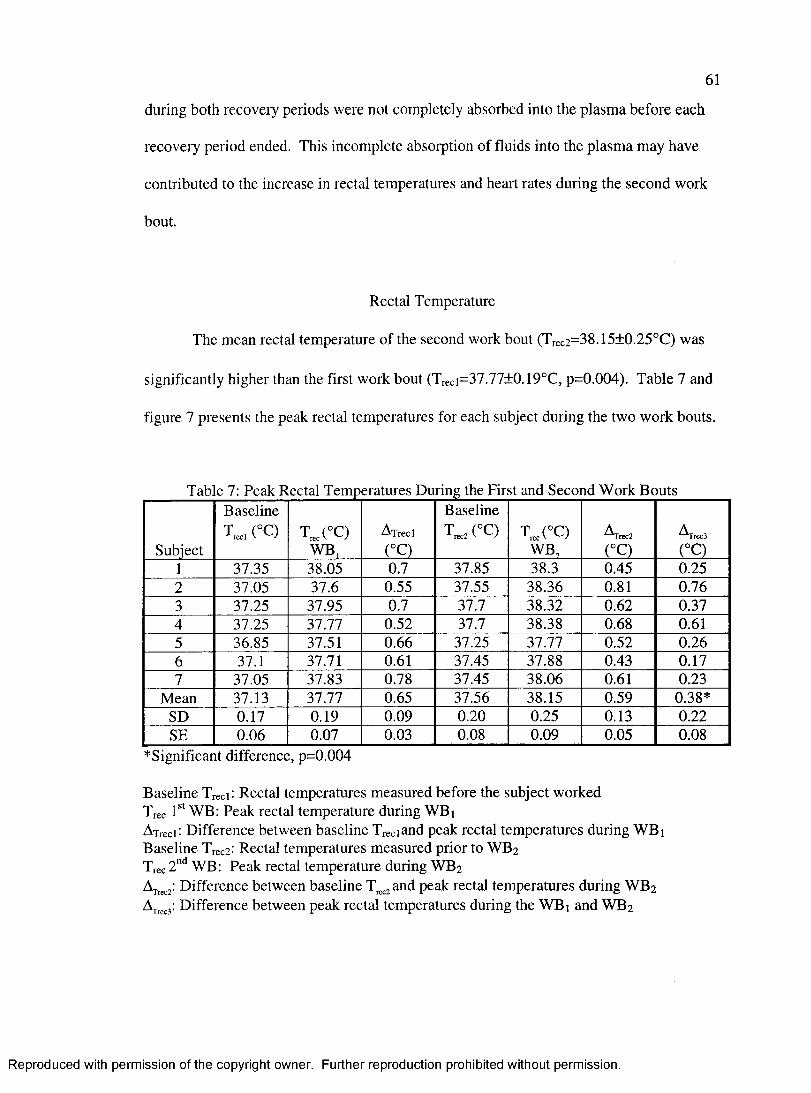
61
during both recovery periods were not completely absorbed into the plasma before each
recovery period ended. This incomplete absorption of fluids into the plasma may have
contributed to the increase in rectal temperatures and heart rates during the second work
bout.
Rectal Temperature
The mean rectal temperature of the second work bout ( T r e c 2 = 3 8 . 1 5 ± 0 . 2 5 ° C ) was
significantly higher than the first work bout ( T r e c i = 3 7 . 7 7 ± 0 . 1 9 ° C , p=0.004). Table 7 and
figure 7 presents the peak rectal temperatures for each subject during the two work bouts.
Table 7: Peak Rectal Temperatures During the First and Second Work Bouts
Subject
Baseline T,«, (°C) T ^C C )
WB,Axrecl(°C)
BaselineT,^(°C)
WB,Arrec2(°C)
Ajreca(°C)
1 37.35 38.05 0.7 37.85 383 0.45 0.252 37.05 37.6 0.55 37.55 38.36 0.81 0.763 37.25 37.95 0.7 37.7 38.32 0.62 0.374 37.25 37.77 0.52 37.7 38.38 0.68 0.615 36.85 37.51 0.66 37.25 37.77 0.52 0.266 37.1 37.71 0.61 37.45 37.88 0.43 0.177 37.05 37.83 &78 37.45 38.06 0.61 0.23
Mean 37.13 37.77 0.65 37.56 38.15 0.59 0.38*SD 0.17 0.19 0.09 0.20 0.25 0.13 0.22SE 0.06 0.07 0.03 0.08 0.09 0.05 0.08
^Significant difference, p=0.004
Baseline Trecb Rectal temperatures measured before the subject worked Tree 1* WB: Peak rectal temperature during WBiATrecb Difference between baseline Treeiand peak rectal temperatures during WBi Baseline Trec2 : Rectal temperatures measured prior to WB^Tree 2"** WB: Peak rectal temperature during WBa
Difference between baseline peak rectal temperatures during WB2
Difference between peak rectal temperatures during the WB] and WB2
Reproduced with permission of the copyright owner. Further reproduction prohibited without permission.
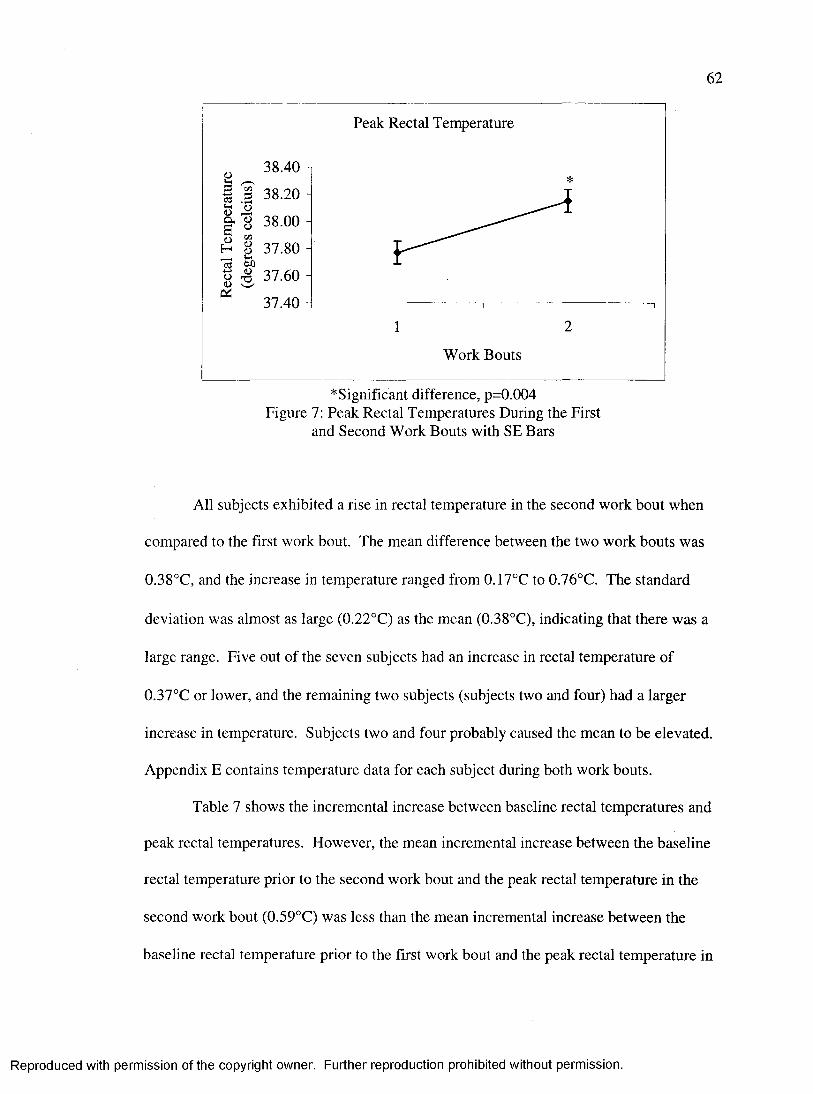
62
Peak Rectal Temperature
38.40
38.20
8 38.00
^ I 37.80
o S 37.60
37.40
Work Bouts
^Significant difference, p=0.004 Figure 7: Peak Rectal Temperatures During the First
and Second Work Bouts with SE Bars
All subjects exhibited a rise in rectal temperature in the second work bout when
compared to the first work bout. The mean difference between the two work bouts was
0.38°C, and the increase in temperature ranged from 0.17°C to 0.76°C. The standard
deviation was almost as large (0.22°C) as the mean (0.38°C), indicating that there was a
large range. Five out of the seven subjects had an increase in rectal temperature of
0.37°C or lower, and the remaining two subjects (subjects two and four) had a larger
increase in temperature. Subjects two and four probably caused the mean to be elevated.
Appendix E contains temperature data for each subject during both work bouts.
Table 7 shows the incremental increase between baseline rectal temperatures and
peak rectal temperatures. However, the mean incremental increase between the baseline
rectal temperature prior to the second work bout and the peak rectal temperature in the
second work bout (0.59°C) was less than the mean incremental increase between the
baseline rectal temperature prior to the first work bout and the peak rectal temperature in
Reproduced with permission of the copyright owner. Further reproduction prohibited without permission.
63
the first work bout (0.65°C). Since these means were not statistically analyzed, it was
unknown whether these means were statistically different.
However, since subjects began with higher baseline rectal temperatures prior to
the second work bout, they exhibited higher rectal temperatures in the second work bout.
Since the criterion for beginning the second work bout was a rectal temperature 0.5°C
above pre-exercise levels, subjects started the second work bout with higher rectal
temperatures. Thus, their peak rectal temperatures during the second work bout were
statistically higher than the first work bout.
Peak rectal temperatures in the first and second work bouts were 37.77°C and
38.15°C, which was a small increase in temperature (0.38°C). While working in
impermeable clothing and in the heat, rectal temperatures should not exceed 38.8°C to
39.2°C (Faff & Tutak, 1989), which is a 0.4°C buffer in acceptable and safe rectal
temperatures. In the current study, rectal temperature increased 0.38°C, which is an
acceptable increase.
Resting rectal temperatures varied from 36.85°C to 37.35°C. This results in a
0.5°C, which is only a 0.5°C difference between subjects. The criterion for the
termination of the recovery period was a decrease of rectal temperatures within 0.5°C of
pre-exercise levels. Rectal temperatures can be expected to increase to 38.5°C when
exposed to moderate exercise (Guyton and Hall, 2000). The rectal temperatures in the
current study increased to 38.15°C. Therefore, the 0.38°C increase in rectal temperature
in the current study was viewed as a small change.
Faff & Tutak (1989) reported that the rectal temperatures and heart rates of fire
fighters working on a Monark cycle ergometer in full fire fighting ensemble continued to
Reproduced with permission of the copyright owner. Further reproduction prohibited without permission.
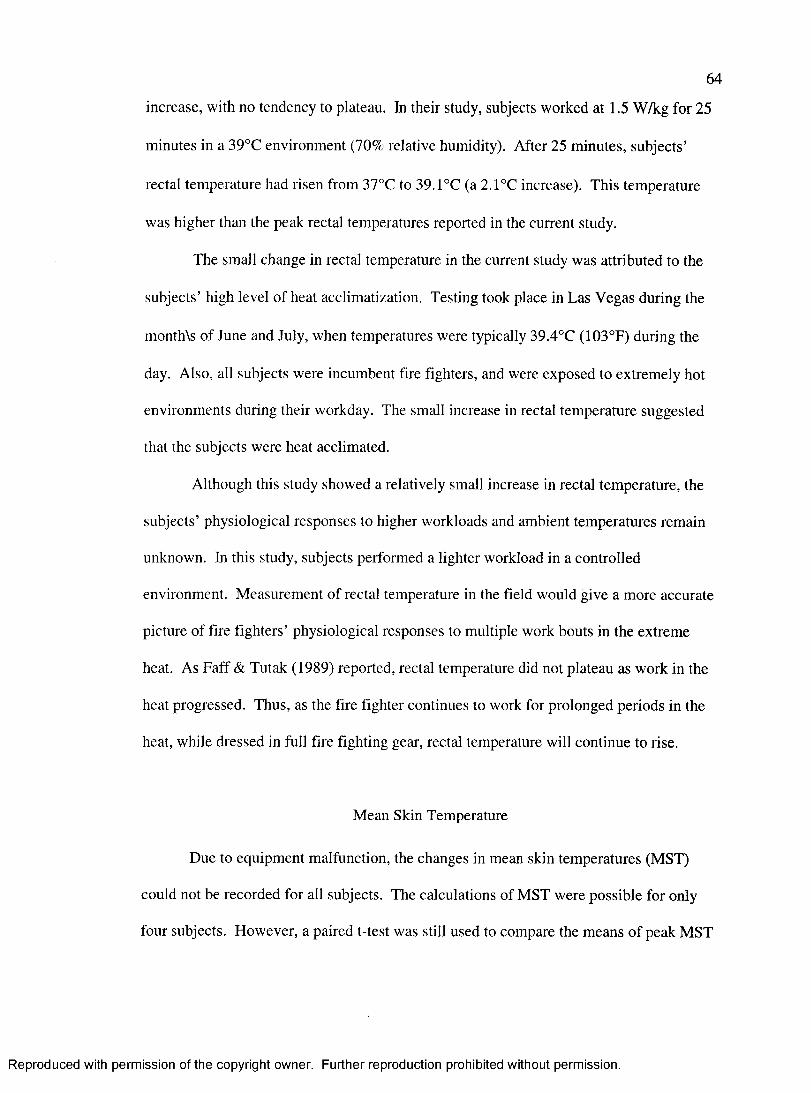
64
increase, with no tendency to plateau. In their study, subjects worked at 1.5 W/kg for 25
minutes in a 39°C environment (70% relative humidity). After 25 minutes, subjects’
rectal temperature had risen from 37°C to 39.1°C (a 2.1°C increase). This temperature
was higher than the peak rectal temperatures reported in the current study.
The small change in rectal temperature in the current study was attributed to the
subjects’ high level of heat acclimatization. Testing took place in Las Vegas during the
month\s of June and July, when temperatures were typically 39.4°C (103°F) during the
day. Also, all subjects were incumbent fire fighters, and were exposed to extremely hot
environments during their workday. The small increase in rectal temperature suggested
that the subjects were heat acclimated.
Although this study showed a relatively small increase in rectal temperature, the
subjects’ physiological responses to higher workloads and ambient temperatures remain
unknown. In this study, subjects performed a lighter workload in a controlled
environment. Measurement of rectal temperature in the field would give a more accurate
picture of fire fighters’ physiological responses to multiple work bouts in the extreme
heat. As Faff & Tutak (1989) reported, rectal temperature did not plateau as work in the
heat progressed. Thus, as the fire fighter continues to work for prolonged periods in the
heat, while dressed in full fire fighting gear, rectal temperature will continue to rise.
Mean Skin Temperature
Due to equipment malfunction, the changes in mean skin temperatures (MST)
could not be recorded for all subjects. The calculations of MST were possible for only
four subjects. However, a paired t-test was still used to compare the means of peak MST
Reproduced with permission of the copyright owner. Further reproduction prohibited without permission.
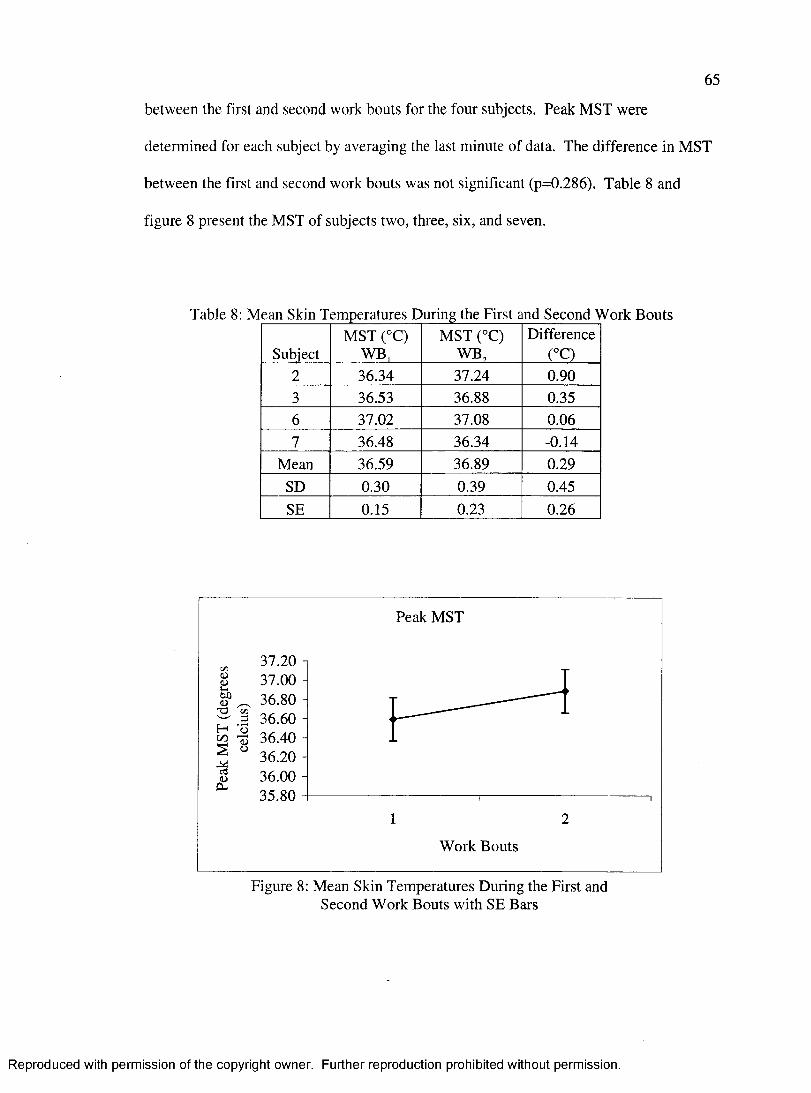
65
between the first and second work bouts for the four subjects. Peak MST were
determined for each subject by averaging the last minute of data. The difference in MST
between the first and second work bouts was not significant (p=0.286). Table 8 and
figure 8 present the MST of subjects two, three, six, and seven.
Table 8: Mean Skin Temperatures During the First and Second Work Bouts
SubjectMST (°C)
WB,MST (°C)
WB,Difference
(°(:)2 36.34 37.24 0.903 36.53 3&88 0.356 37.02 37.08 0.067 3&48 36.34 -0.14
Mean 36.59 3&89 0.29SD 0.30 0.39 0.45SE 0.15 0.23 0.26
I
37.2037.00 3&80 36.60 36.4036.2036.00 H 35.80
Peak MST
Work Bouts
Figure 8: Mean Skin Temperatures During the First and Second Work Bouts with SE Bars
Reproduced with permission of the copyright owner. Further reproduction prohibited without permission.
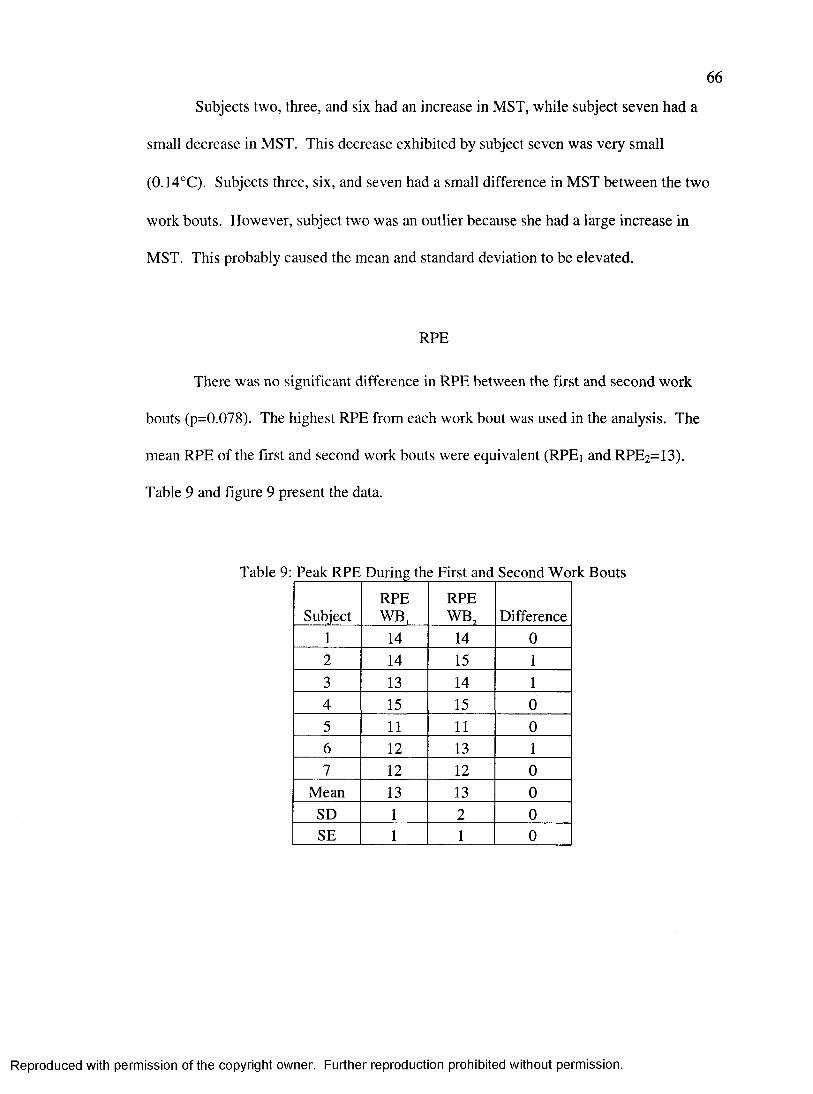
66
Subjects two, three, and six had an increase in MST, while subject seven had a
small decrease in MST. This decrease exhibited by subject seven was very small
(0.14°C). Subjects three, six, and seven had a small difference in MST between the two
work bouts. However, subject two was an outlier because she had a large increase in
MST. This probably caused the mean and standard deviation to be elevated.
RPE
There was no significant difference in RPE between the first and second work
bouts (p=0.078). The highest RPE from each work bout was used in the analysis. The
mean RPE of the first and second work bouts were equivalent (RPEi and RPE2=13).
Table 9 and figure 9 present the data.
Table 9: Peak RPE During the First and Second Work Bouts
SubjectRPEWB,
RPEWB, Difference
1 14 14 02 14 15 13 13 14 14 15 15 05 11 11 06 12 13 17 12 12 0
Mean 13 13 0SD 1 2 0SE 1 1 0
Reproduced with permission of the copyright owner. Further reproduction prohibited without permission.
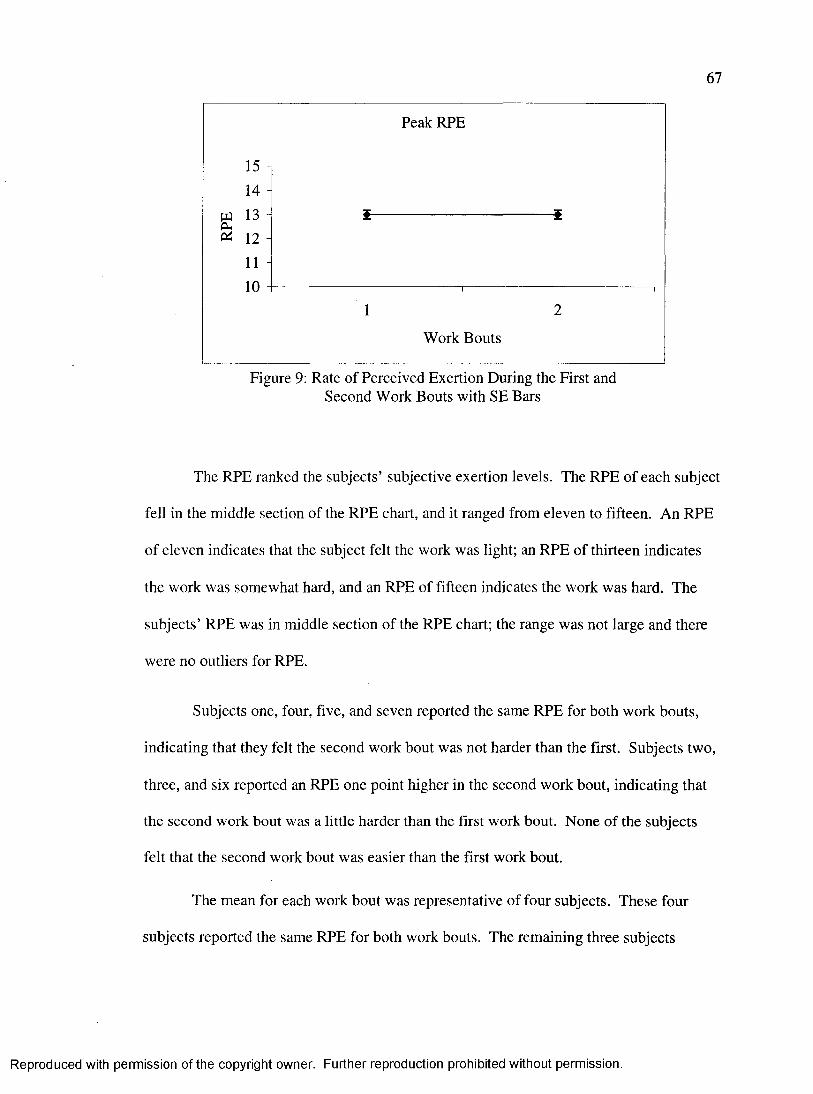
67
Peak RPE
15
14
W 13 12
11 4 10
1 2
Work Bouts
Figure 9: Rate of Perceived Exertion During the First and Second Work Bouts with SE Bars
The RPE ranked the subjects’ subjective exertion levels. The RPE of each subject
fell in the middle section of the RPE chart, and it ranged from eleven to fifteen. An RPE
of eleven indicates that the subject felt the work was light; an RPE of thirteen indicates
the work was somewhat hard, and an RPE of fifteen indicates the work was hard. The
subjects’ RPE was in middle section of the RPE chart; the range was not large and there
were no outliers for RPE.
Subjects one, four, five, and seven reported the same RPE for both work bouts,
indicating that they felt the second work bout was not harder than the first. Subjects two,
three, and six reported an RPE one point higher in the second work bout, indicating that
the second work bout was a little harder than the first work bout. None of the subjects
felt that the second work bout was easier than the first work bout.
The mean for each work bout was representative of four subjects. These four
subjects reported the same RPE for both work bouts. The remaining three subjects
Reproduced with permission of the copyright owner. Further reproduction prohibited without permission.
68
reported an RPE only one point higher in the second work bout. Thus, the standard
deviation was zero.
In summary, the only dependent measures that were significantly different from
the first to the second work bouts were heart rate (p=0.008) and rectal temperature
(p=0.004). Although both measures were higher in the second work bout, the difference
in rectal temperature was small (0.38°C). The increase in rectal temperature was due to
the subjects’ inability to dissipate heat. Therefore, the heat storage caused the rise in
rectal temperature. The increase in heart rate could be attributed to the increase in rectal
temperature. As more blood is redistributed to the periphery, heart rate increases to
compensate for the decrease in stroke volume. This increase in rectal temperature and
heart rate did not affect the subjects’ VO2, MST, or RPE.
Population
The physical fitness levels of the female fire fighters that participated in this study
were well above average. The mean V02max was 47.94+2.86 ml/kg/min and the mean
percentage of body fat for the group was 18.3+5.0%. The mean V02max of the group is
higher than the 90^ percentile for women of all ages (ACSM, 2000). In addition, when
the mean percentage of body fat of the subjects was compared to women between the
ages of 30 and 39, the subjects’ score fell between the 80* and 90* percentile (ACSM,
2000).
Reproduced with permission of the copyright owner. Further reproduction prohibited without permission.
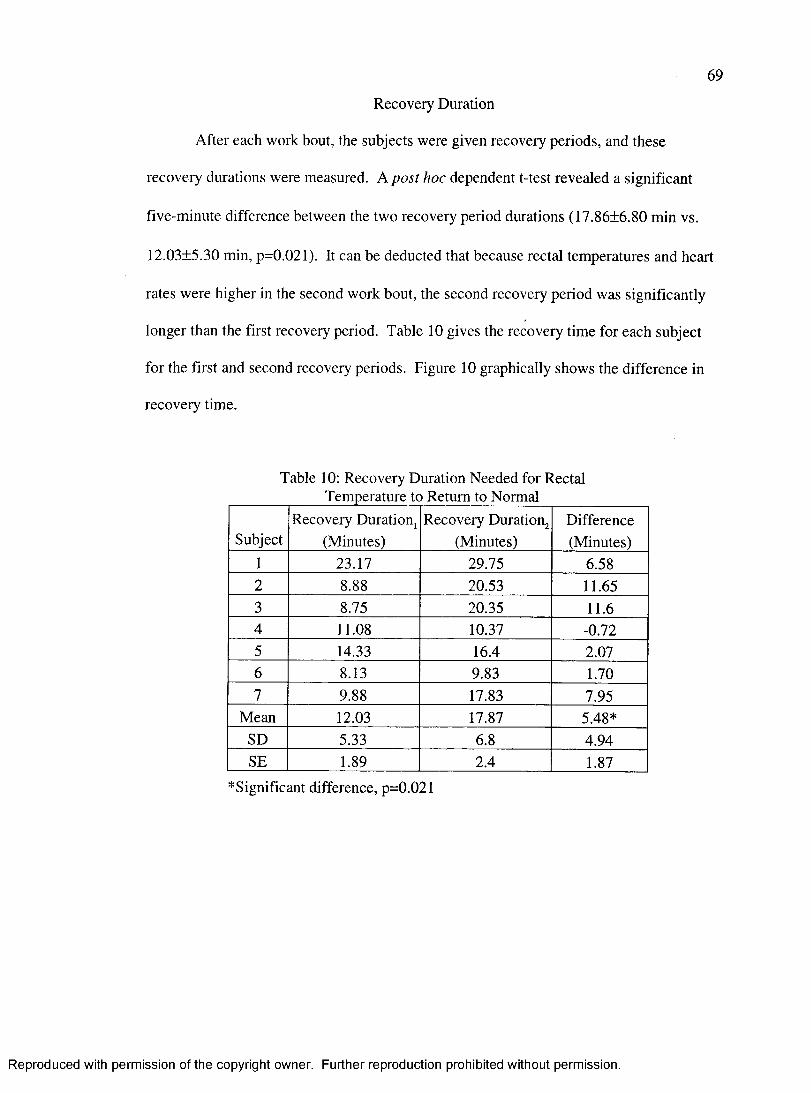
69
Recovery Duration
After each work bout, the subjects were given recovery periods, and these
recovery durations were measured. A post hoc dependent t-test revealed a significant
five-minute difference between the two recovery period durations (17.8616.80 min vs.
12.0315.30 min, p=0.021). It can be deducted that because rectal temperatures and heart
rates were higher in the second work bout, the second recovery period was significantly
longer than the first recovery period. Table 10 gives the recovery time for each subject
for the first and second recovery periods. Figure 10 graphically shows the difference in
recovery time.
Table 10: Recovery Duration Needed for Rectal
SubjectRecovery Duration,
(Minutes)Recovery Duration^
(Minutes)Difference(Minutes)
1 23.17 29.75 6382 &88 20.53 11.653 8J5 20.35 11.64 11.08 10.37 -0.725 14.33 16.4 2.076 8H3 933 1.707 &88 17.83 7.95
Mean 12.03 17.87 5.48*SD 533 6.8 4.94SE 189 2.4 1.87
''Significant difference, p=0.021
Reproduced with permission of the copyright owner. Further reproduction prohibited without permission.
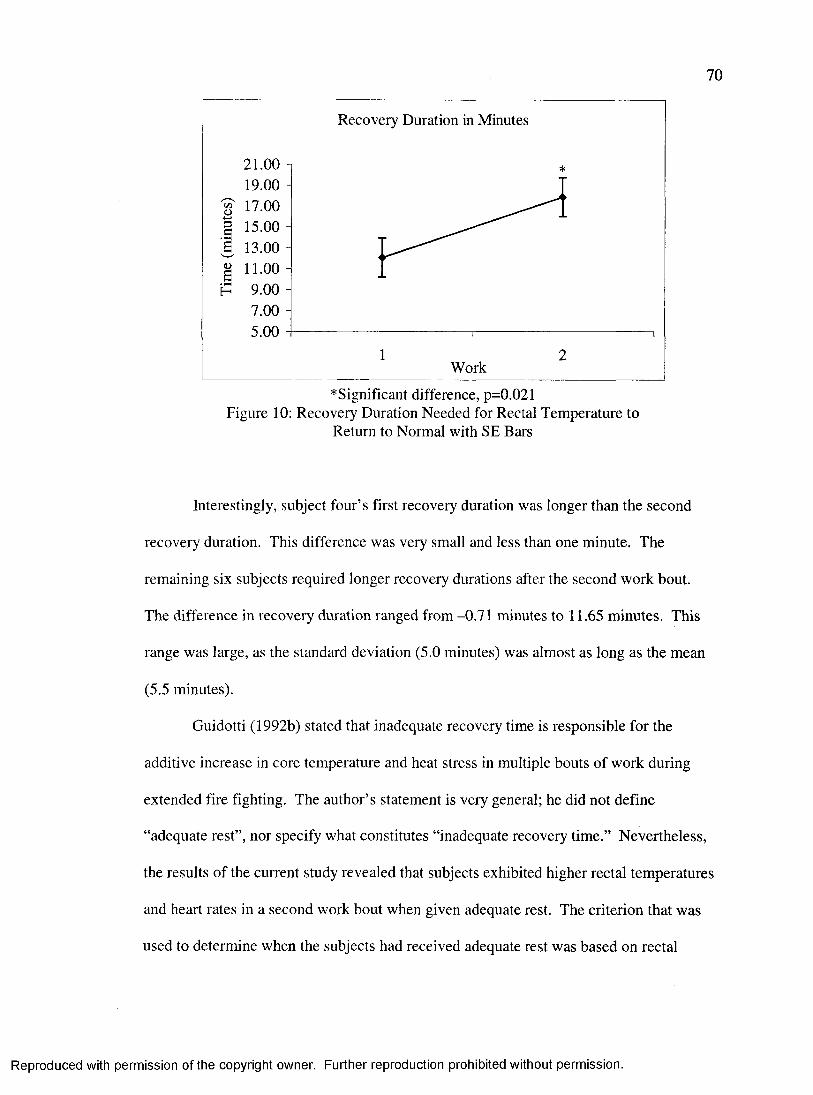
70
Recovery Duration in Minutes
21.00 119.00 -17.00 -
1 15.00 -ë 13.00 -
11.00 -H 9.00 -
7.00 -5.00 4
1 2 Work
^Significant difference, p=0.021 Figure 10: Recovery Duration Needed for Rectal Temperature to
Return to Normal with SE Bars
Interestingly, subject four’s first recovery duration was longer than the second
recovery duration. This difference was very small and less than one minute. The
remaining six subjects required longer recovery durations after the second work bout.
The difference in recovery duration ranged from -0.71 minutes to 11.65 minutes. This
range was large, as the standard deviation (5.0 minutes) was almost as long as the mean
(5.5 minutes).
Guidotti (1992b) stated that inadequate recovery time is responsible for the
additive increase in core temperature and heat stress in multiple bouts of work during
extended fire fighting. The author’s statement is very general; he did not define
“adequate rest”, nor specify what constitutes “inadequate recovery time.” Nevertheless,
the results of the current study revealed that subjects exhibited higher rectal temperatures
and heart rates in a second work bout when given adequate rest. The criterion that was
used to determine when the subjects had received adequate rest was based on rectal
Reproduced with permission of the copyright owner. Further reproduction prohibited without permission.
71
temperatures: when rectal temperatures returned to 0.5°C above pre-exercise levels, the
rest period was terminated.
The removal of protective clothing and the recovery in front of a fan probably
accelerated the rate of recovery. Carter, Banister and Morrison (1999) examined the
effectiveness of using a fan during work and rest intervals. Twelve professional fire
fighters completed a work-rest cycle: they stepped for ten minutes in a 40°C
environment, recovered for ten minutes, stepped again for ten minutes, and recovered for
another ten minutes. Each subject completed two trials, one with a normal recovery, and
one with an enhanced recovery. The enhanced recovery consisted of the subject
removing the jacket and sitting in front of a fan. The authors demonstrated that recovery
in front of a fan after a ten-minute work bout reduced heart rates during a subsequent
work bout and recovery period.
Skoldstrom (1987) stated that recovery time between work bouts should be
equivalent to working time. However, this study demonstrated that a 23-minute work
bout required 12.03+5.33 minutes of enhanced recovery and a similar second work bout
required 17.86+6.80 minutes of enhanced recovery. The recovery in this study was
enhanced because subjects removed their jackets, pulled turn out pants down around the
ankles, and sat seven feet in front of a fan. Therefore, recovery time should be adjusted
according to the number of work bouts, and the type of recovery (i.e., enhanced or
normal recovery).
Reproduced with permission of the copyright owner. Further reproduction prohibited without permission.
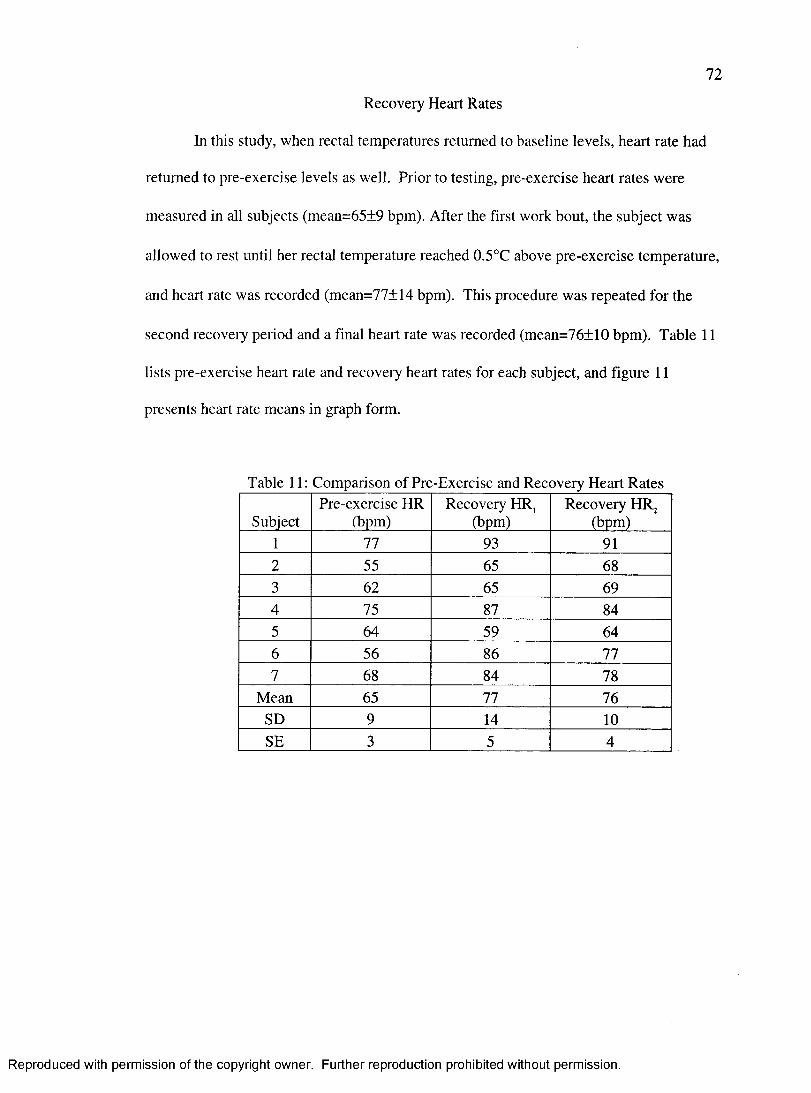
72
Recovery Heart Rates
In this study, when rectal temperatures returned to baseline levels, heart rate had
returned to pre-exercise levels as well. Prior to testing, pre-exercise heart rates were
measured in all subjects (mean=65±9 bpm). After the first work bout, the subject was
allowed to rest until her rectal temperature reached 0.5°C above pre-exercise temperature,
and heart rate was recorded (mean=77±14 bpm). This procedure was repeated for the
second recovery period and a final heart rate was recorded (mean=76±10 bpm). Table 11
lists pre-exercise heart rate and recovery heart rates for each subject, and figure 11
presents heart rate means in graph form.
Table 11: Comparison of Pre-Exercise and Reeovery Heart Rates
SubjectPre-exercise HR
(bpm)Recovery HR,
(bpm)Recovery HR^
(bpm)1 77 93 912 55 65 683 62 65 694 75 87 845 64 59 646 56 86 777 68 84 78
Mean 65 77 76SD 9 14 10SE 3 5 4
Reproduced with permission of the copyright owner. Further reproduction prohibited without permission.
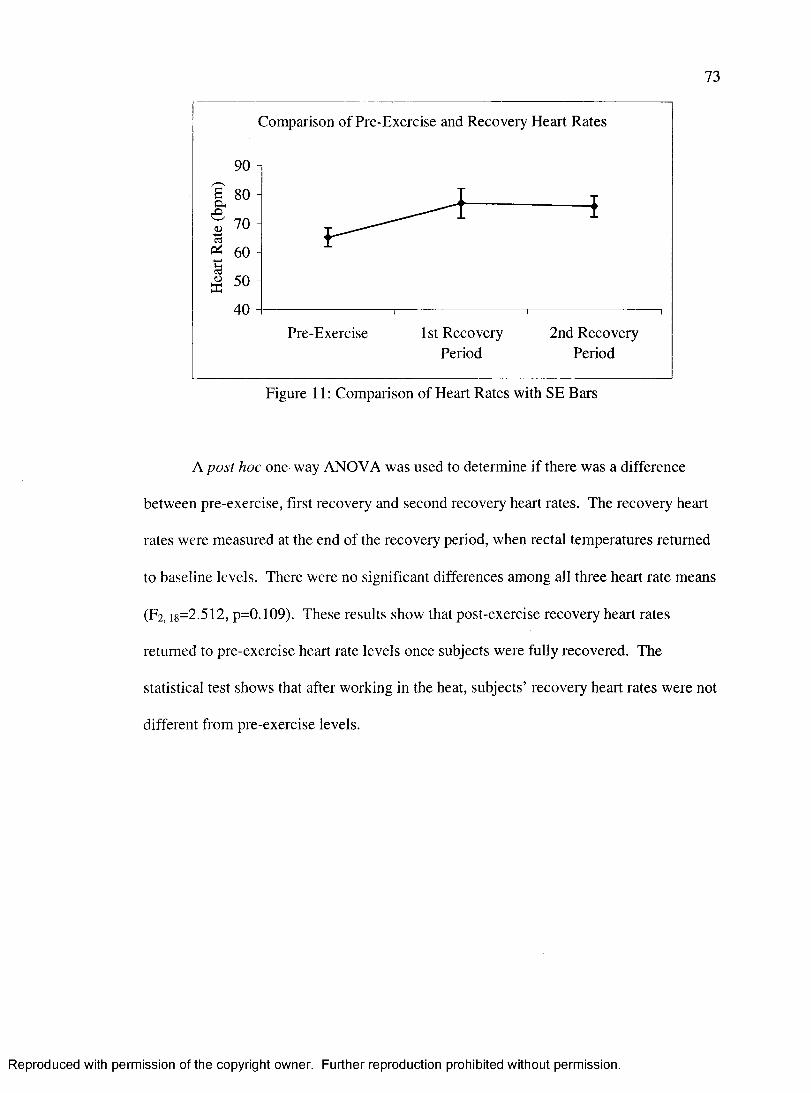
73
Comparison of Pre-Exercise and Recovery Heart Rates
60 -
2nd Recovery Period
Pre-Exercise 1 St Recovery Period
Eigure 11 : Comparison of Heart Rates with SE Bars
A post hoc one-way ANOVA was used to determine if there was a difference
between pre-exercise, first recovery and second recovery heart rates. The recovery heart
rates were measured at the end of the recovery period, when rectal temperatures returned
to baseline levels. There were no significant differences among all three heart rate means
(p2, 18=2.512, p=0.109). These results show that post-exercise recovery heart rates
returned to pre-exercise heart rate levels once subjects were fully recovered. The
statistical test shows that after working in the heat, subjects’ recovery heart rates were not
different from pre-exercise levels.
Reproduced with permission of the copyright owner. Further reproduction prohibited without permission.
CHAPTER 5
SUMMARY, CONCLUSIONS AND RECOMMENDATIONS
Summary
The comparison of the physiological responses during work in the heat between
two work bouts revealed that rectal temperatures and heart rates were significantly higher
in the second work bout, when compared to the first work bout. Although the peak rectal
temperature in the second work bout was statistically higher than the first work bout, the
increase was small, and 0.38°C. The higher rectal temperature in the second work bout
was attributed to the higher baseline rectal temperatures prior to the second work bout.
Since subjects began the second work bout with higher rectal temperatures, the peak
rectal temperature observed in the second work bout was higher than those observed in
the first work bout.
The significantly higher heart rates observed in the second work bout were
attributed to the increase in rectal temperature, cardiovascular drift, and dehydration.
Skoldstrom (1987) stated that there is a high correlation between rectal temperature and
heart rate. Since rectal temperature increased, heart rate would be expected to increase
accordingly. In response to an increased rectal temperature, skin blood flow increases in
an attempt to dissipate heat (Rowell, 1986). The skin and working muscles compete for
blood flow, and ultimately the rise in cutaneous blood flow causes a decrease in stroke
volume (Rowell, Kraning, Kennedy, & Evans, 1967). The decrease in stroke volume is
74
Reproduced with permission of the copyright owner. Further reproduction prohibited without permission.
75
counteracted by an increase in heart rate. This is one explanation for the inereased mean
heart rate in the second work bout.
The higher heart rates could have also been caused by dehydration. Although the
hematocrit measurements were not significantly different among test samples, the pre-
and post-nude body weights were not different, and subjects adequately replaced their
sweat losses between work bouts, the extent of fluid absorption into plasma was
unknown. Prior studies have documented the rate of gastric emptying: a 600 millimeter
drink has a maximal absorption rate of 25.3 millimeters per minute (Costill & Saltin,
1974), and a 6% carbohydrate drink empties at a rate of 9.9 millimeters per minute
(Costill, 2001), or 480 ml/hour (Gisolfi, 1991). Subjects in the current study ingested 627
millimeters and 539 millimeters during the two recovery periods, respectively. Most
likely, the entire replacement fluid volume of was not completely absorbed within the
twelve- and eighteen-minute recovery periods.
This study required subjects to work at 50% of their maximal working capacity, a
lower intensity that what their job requires. Subjects also worked in a 40°C environment,
a cooler environment than actual ambient temperatures experienced in the field.
Therefore, the rectal temperatures and heart rates elicited in the field would be expected
to be higher than those observed in this study.
Conclusions
• Results of this study indicate that heart rates and rectal temperatures of the seeond
work bout were significantly higher than the first work bout. Although rectal
temperature was significantly higher, the difference was small (0.38°C).
• The increased heart rate could be attributed to the increased rectal temperature, and
Reproduced with permission of the copyright owner. Further reproduction prohibited without permission.
76
increased demands on the peripheral circulation. Also, the increased heart rate could
be attributed to the incomplete absorption of Gatorade® into the plasma during the
recovery period.
• Rectal temperature was a good indicator of when subjects were able to return to work.
After the first work bout, subjects were allowed to rest until their rectal temperatures
decreased to 0.5°C above pre-exercise levels. This criterion allowed for adequate
recovery, enabling the subjects to safely complete a second similar work bout.
• Female fire fighters were capable of completing two work bouts in the heat at 50% of
their V02max with adequate recovery between work bouts. All subjects were able to
complete the protocol, given adequate rest between work bouts.
• When rectal temperature reached baseline levels during the two recovery periods, the
recovery heart rates were not significantly different from pre-exercise heart rates.
• When given adequate amount of fluid replacement in a single bolus, subjects
adequately rehydrated (as determined by hematocrit and nude body weight
measurements).
Recommendations for Future Research
Future research should ensure that the skin thermistors are attached securely to the
skin, and checked for normal functioning before testing. This would ensure the
measurement of all four-skin temperatures and allow for the calculation of mean skin
temperature for all subjects.
Secondly, subjects should perform anaerobic work during each work bout. One
of the limitations of the present study was that subjects performed steady-state work. In
the field, fire fighters perform a series of anaerobic tasks and this needs to be studied. A
Reproduced with permission of the copyright owner. Further reproduction prohibited without permission.
77
study should determine the effects of multiple anaerobic work bouts on physiological
measures. For example, a study could examine the effects of two work bouts in the heat
on heart rate, rectal temperature, mean skin temperature and RPF while performing job-
related tasks.
Furthermore, this study was performed in a laboratory and the actual ambient
temperatures and work intensities in the field were not duplicated. Since the ambient
temperatures and workloads in the field are much higher, a study should measure
physiological parameters while performing work in more realistic conditions. A study
could measure physiological responses to work and heat (heart rate, core body
temperature and RPF) in the field. These results would accurately measure physiological
responses of fire fighters to work in the heat between multiple work bouts.
Another study should determine the minimum recovery duration that would still
allow fire fighters to complete multiple work bouts in the heat. In addition, if a minimum
recovery duration is established, what effect does a shortened recovery time have on
physiological responses during multiple work bouts? The study should determine what
recovery duration will allow for the most efficient and safe work performance of fire
fighters.
A field study should measure the fluid intake of fire fighters during recovery and
after performing fire-fighting tasks in the extreme heat. These measurements should be
compared with the minimum fluid intake requirement, or sweat loss, to determine if fire
fighters are adequately rehydrating on the scene. The current study documented that
subjects adequately rehydrated when given a single bolus of fluid. Often times in the
field, fire fighters are not given enough fluids in a single serving to offset sweat losses.
Reproduced with permission of the copyright owner. Further reproduction prohibited without permission.

78
This study should determine how smaller and multiple servings of fluids affect the
volume of fluid intake.
Reproduced with permission of the copyright owner. Further reproduction prohibited without permission.
APPENDIX A
HUMAN SUBJECTS PROTOCOL AND APPROVAL
79
Reproduced with permission of the copyright owner. Further reproduction prohibited without permission.
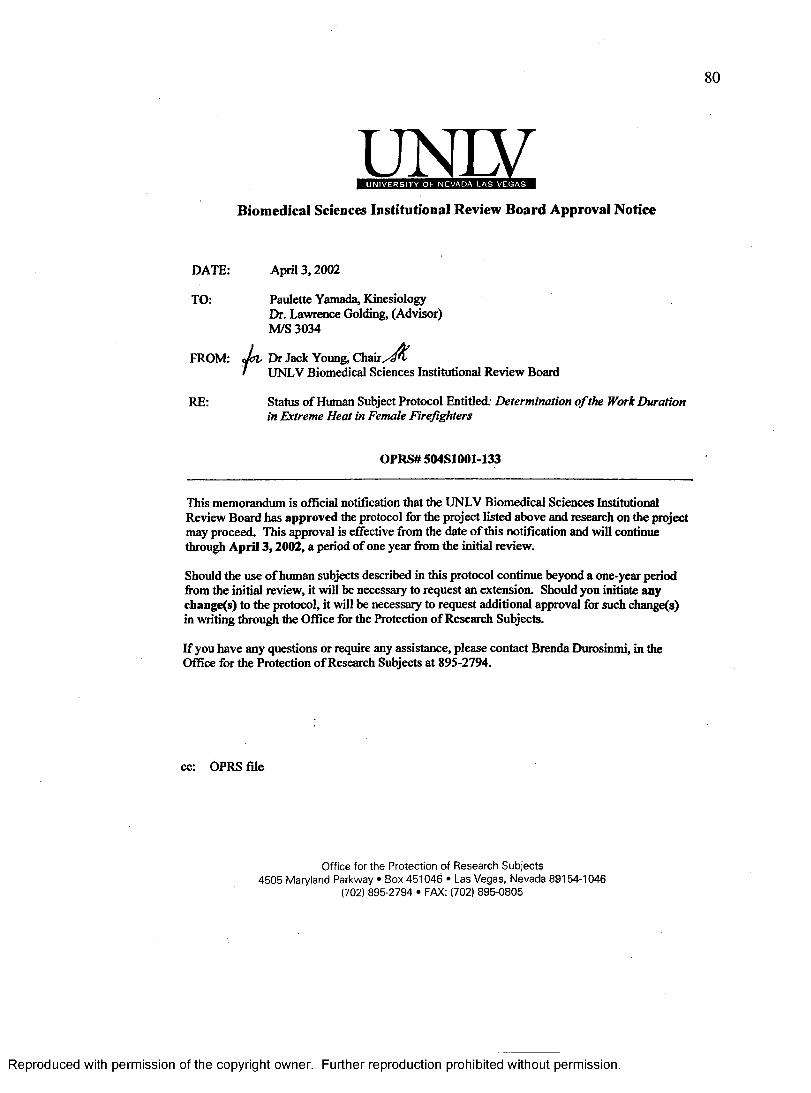
80
uNiyU N I V E R S I T Y O F N E V A D A L A S V E G A S
Biomedical Sciences Institutional Review Board Approval Notice
DATE: April 3 ,2002
TO: Paulette Yamada, KinesiologyDr. Lawrence Golding, (Advisor) M/S 3034
FROM: dfV Dr Jack Young, C h a ir /^ ^ / UNLV Biomedical Science:UNLV Biomedical Sciences Institutional Review Board
RE: Status o f Human Subject Protocol Entitled; Determination o f the Work Durationin Extreme Heat in Female Firefighters
OPRS# 50481001-133
This memorandum is officiai notification that the UNLV Biomedical Sciences Institutional Review Board has approved the protocol for the project listed above and research on the project may proceed. This approval is effective ftom the date o f this notification and will continue through A pril 3 ,2002 , a period o f one year fiom the initial review.
Should the use o f human subjects described in this protocol continue beyond a one-year period fiom the initial review, it will be necessary to request an extension. Should you initiate any change(s) to the protocol, it will be necessary to request additional approval for such change(s) in writing through the Office for the Protection o f Research Subjects.
I f you have any questions or require any assistance, please contact Brenda Durosinmi, in the Office for the Protection o f Research Subjects at 895-2794.
cc: OPRS file
Office for the Protection of Research Subjects 4505 Maryland Parkway • Box 451046 • Las Vegas, Nevada 89154-1046
(702) 895-2794 • FAX: (702) 895-0805
Reproduced with permission of the copyright owner. Further reproduction prohibited without permission.
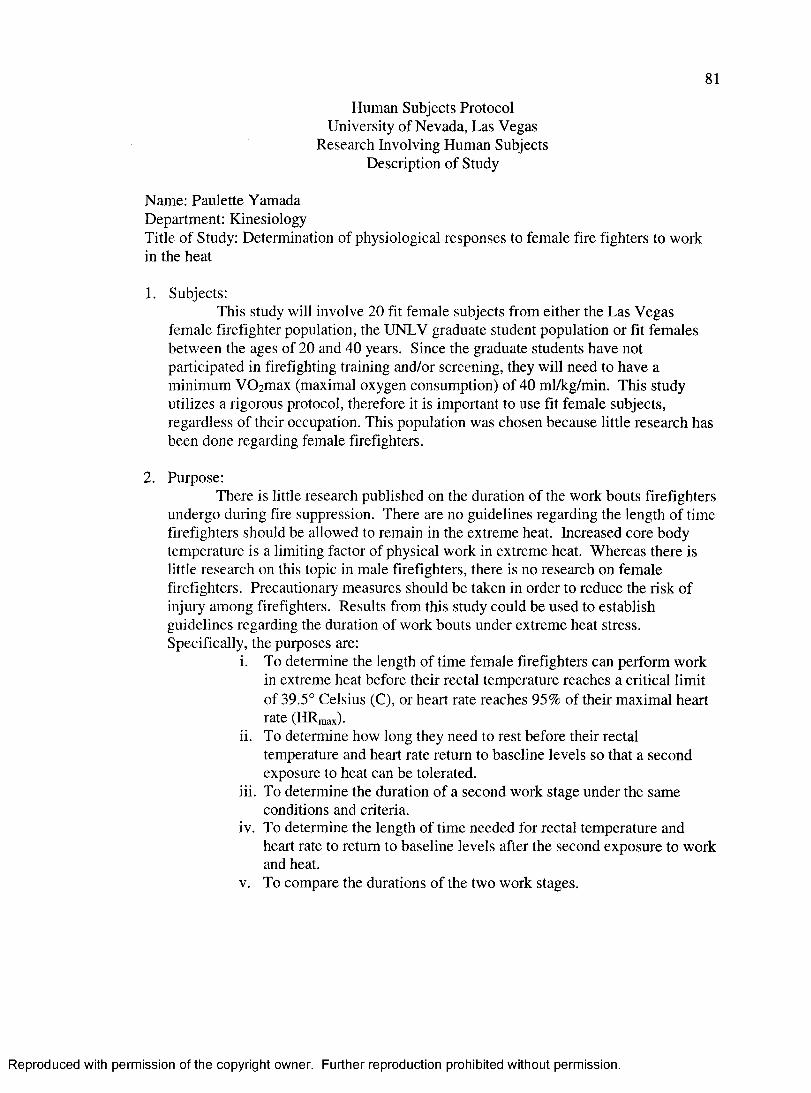
81
Human Subjects Protocol University of Nevada, Las Vegas
Research Involving Human Subjects Description of Study
Name; Paulette YamadaDepartment: KinesiologyTitle of Study: Determination of physiological responses to female fire fighters to workin the heat
1. Subjects:This study will involve 20 fit female subjects from either the Las Vegas
female firefighter population, the UNLV graduate student population or fit females between the ages of 20 and 40 years. Since the graduate students have not participated in firefighting training and/or screening, they will need to have a minimum VOamax (maximal oxygen consumption) of 40 ml/kg/min. This study utilizes a rigorous protocol, therefore it is important to use fit female subjects, regardless of their occupation. This population was chosen because little research has been done regarding female firefighters.
2. Purpose:There is little research published on the duration of the work bouts firefighters
undergo during fire suppression. There are no guidelines regarding the length of time firefighters should be allowed to remain in the extreme heat. Increased core body temperature is a limiting factor of physical work in extreme heat. Whereas there is little research on this topic in male firefighters, there is no research on female firefighters. Precautionary measures should be taken in order to reduce the risk of injury among firefighters. Results from this study could be used to establish guidelines regarding the duration of work bouts under extreme heat stress. Specifically, the purposes are:
i. To determine the length of time female firefighters can perform work in extreme heat before their rectal temperature reaches a critical limit of 39.5° Celsius (C), or heart rate reaches 95% of their maximal heart rate (HRfnax)-
ii. To determine how long they need to rest before their rectal temperature and heart rate return to baseline levels so that a second exposure to heat can be tolerated.
iii. To determine the duration of a second work stage under the same conditions and criteria.
iv. To determine the length of time needed for rectal temperature and heart rate to return to baseline levels after the second exposure to work and heat.
V. To compare the durations of the two work stages.
Reproduced with permission of the copyright owner. Further reproduction prohibited without permission.
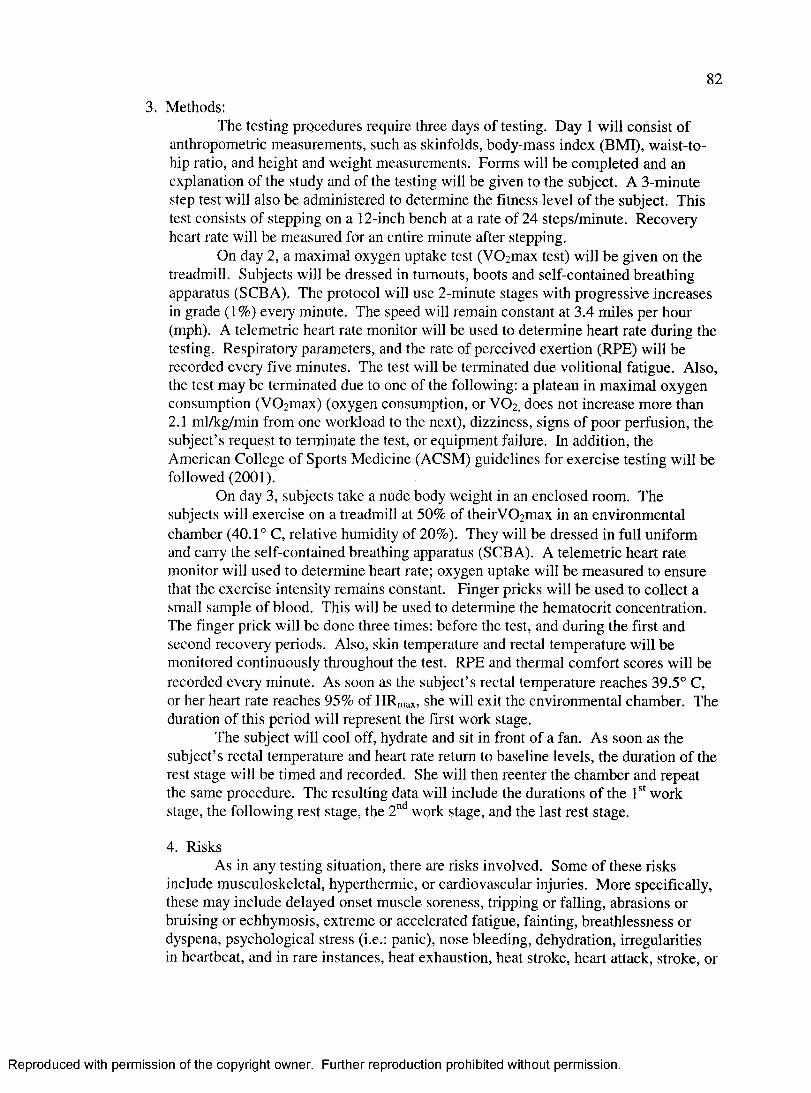
82
3. Methods:The testing procedures require three days of testing. Day 1 will consist of
anthropometric measurements, such as skinfolds, body-mass index (BMI), waist-to- hip ratio, and height and weight measurements. Forms will be completed and an explanation of the study and of the testing will be given to the subject. A 3-minute step test will also be administered to determine the fitness level of the subject. This test consists of stepping on a 12-inch bench at a rate of 24 steps/minute. Recovery heart rate will be measured for an entire minute after stepping.
On day 2, a maximal oxygen uptake test (VÜ2max test) will be given on the treadmill. Subjects will be dressed in turnouts, boots and self-contained breathing apparatus (SCBA). The protocol will use 2-minute stages with progressive increases in grade (1%) every minute. The speed will remain constant at 3.4 miles per hour (mph). A telemetric heart rate monitor will be used to determine heart rate during the testing. Respiratory parameters, and the rate of perceived exertion (RPE) will be recorded every five minutes. The test will be terminated due volitional fatigue. Also, the test may be terminated due to one of the following: a plateau in maximal oxygen consumption (VOimax) (oxygen consumption, or VO2, does not increase more than 2.1 ml/kg/min from one workload to the next), dizziness, signs of poor perfusion, the subject’s request to terminate the test, or equipment failure. In addition, the American College of Sports Medicine (ACSM) guidelines for exercise testing will be followed (2001).
On day 3, subjects take a nude body weight in an enclosed room. The subjects will exercise on a treadmill at 50% of theirV02max in an environmental chamber (40.1° C, relative humidity of 20%). They will be dressed in full uniform and carry the self-contained breathing apparatus (SCBA). A telemetric heart rate monitor will used to determine heart rate; oxygen uptake will be measured to ensure that the exercise intensity remains constant. Finger pricks will be used to collect a small sample of blood. This will be used to determine the hematocrit concentration. The finger prick will be done three times: before the test, and during the first and second recovery periods. Also, skin temperature and rectal temperature will be monitored continuously throughout the test. RPE and thermal comfort scores will be recorded every minute. As soon as the subject’s rectal temperature reaches 39.5° C, or her heart rate reaches 95% of HRmax, she will exit the environmental chamber. The duration of this period will represent the first work stage.
The subject will cool off, hydrate and sit in front of a fan. As soon as the subject’s rectal temperature and heart rate return to baseline levels, the duration of the rest stage will be timed and recorded. She will then reenter the chamber and repeat the same procedure. The resulting data will include the durations of the E* work stage, the following rest stage, the 2" work stage, and the last rest stage.
4. RisksAs in any testing situation, there are risks involved. Some of these risks
include musculoskeletal, hyperthermic, or cardiovascular injuries. More specifically, these may include delayed onset muscle soreness, tripping or falling, abrasions or bruising or echhymosis, extreme or accelerated fatigue, fainting, breathlessness or dyspena, psychological stress (i.e.: panic), nose bleeding, dehydration, irregularities in heartbeat, and in rare instances, heat exhaustion, heat stroke, heart attack, stroke, or
Reproduced with permission of the copyright owner. Further reproduction prohibited without permission.
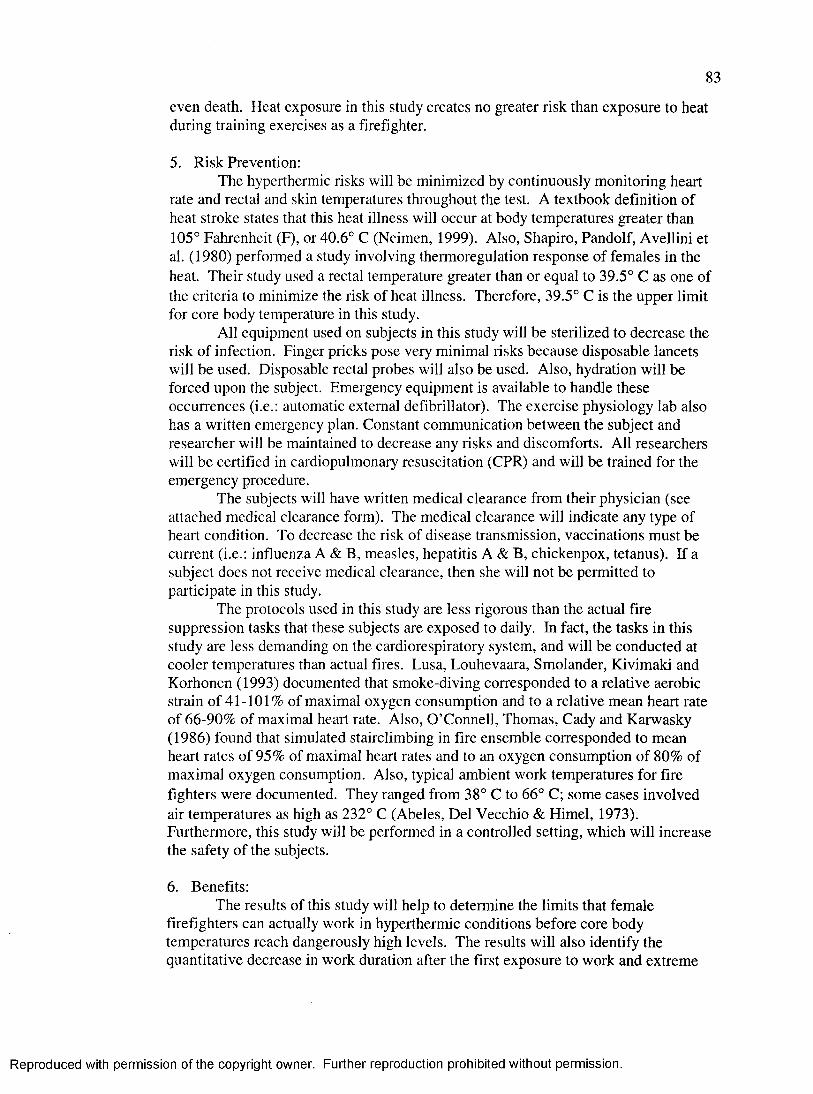
83
even death. Heat exposure in this study creates no greater risk than exposure to heat during training exercises as a firefighter.
5. Risk Prevention:The hyperthermic risks will be minimized by continuously monitoring heart
rate and rectal and skin temperatures throughout the test. A textbook definition of heat stroke states that this heat illness will occur at body temperatures greater than 105° Fahrenheit (F), or 40.6° C (Neimen, 1999). Also, Shapiro, Pandolf, Avellini et al. (1980) performed a study involving thermoregulation response of females in the heat. Their study used a rectal temperature greater than or equal to 39.5° C as one of the criteria to minimize the risk of heat illness. Therefore, 39.5° C is the upper limit for core body temperature in this study.
All equipment used on subjects in this study will be sterilized to decrease the risk of infection. Finger pricks pose very minimal risks because disposable lancets will be used. Disposable rectal probes will also be used. Also, hydration will be forced upon the subject. Emergency equipment is available to handle these occurrences (i.e.: automatic external defibrillator). The exercise physiology lab also has a written emergency plan. Constant communication between the subject and researcher will be maintained to decrease any risks and discomforts. All researchers will be certified in cardiopulmonary resuscitation (CPR) and will be trained for the emergency procedure.
The subjects will have written medical clearance from their physician (see attached medical clearance form). The medical clearance will indicate any type of heart condition. To decrease the risk of disease transmission, vaccinations must be current (i.e.: influenza A & B, measles, hepatitis A & B, chickenpox, tetanus). If a subject does not receive medical clearance, then she will not be permitted to participate in this study.
The protocols used in this study are less rigorous than the actual fire suppression tasks that these subjects are exposed to daily. In fact, the tasks in this study are less demanding on the cardiorespiratory system, and will be conducted at cooler temperatures than actual fires. Lusa, Louhevaara, Smolander, Kivimaki and Korhonen (1993) documented that smoke-diving corresponded to a relative aerobic strain of 41-101% of maximal oxygen consumption and to a relative mean heart rate of 66-90% of maximal heart rate. Also, O’Connell, Thomas, Cady and Karwasky (1986) found that simulated stairclimbing in fire ensemble corresponded to mean heart rates of 95% of maximal heart rates and to an oxygen consumption of 80% of maximal oxygen consumption. Also, typical ambient work temperatures for fire fighters were documented. They ranged from 38° C to 66° C; some cases involved air temperatures as high as 232° C (Abeles, Del Vecchio & Himel, 1973). Furthermore, this study will be performed in a controlled setting, which will increase the safety of the subjects.
6. Benefits:The results of this study will help to determine the limits that female
firefighters can actually work in hyperthermic conditions before core body temperatures reach dangerously high levels. The results will also identify the quantitative decrease in work duration after the first exposure to work and extreme
Reproduced with permission of the copyright owner. Further reproduction prohibited without permission.
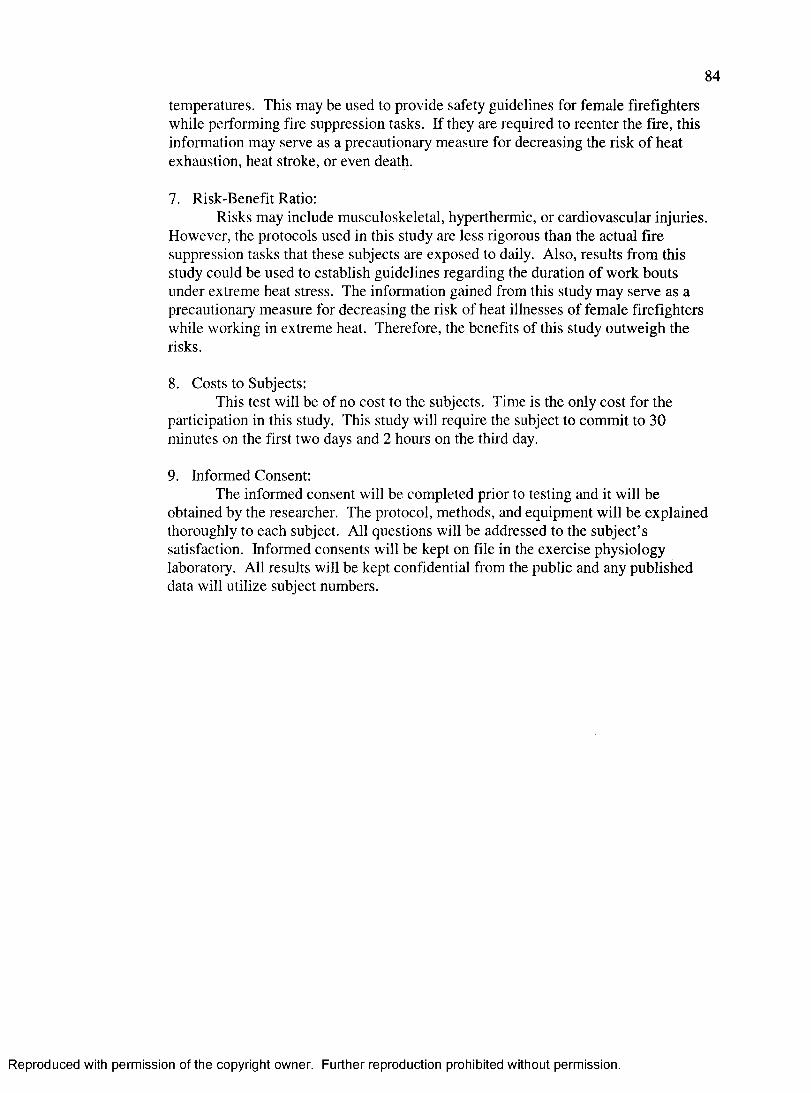
84
temperatures. This may be used to provide safety guidelines for female firefighters while performing fire suppression tasks. If they are required to reenter the fire, this information may serve as a precautionary measure for decreasing the risk of heat exhaustion, heat stroke, or even death.
7. Risk-Benefit Ratio:Risks may include musculoskeletal, hyperthermic, or cardiovascular injuries.
However, the protocols used in this study are less rigorous than the actual fire suppression tasks that these subjects are exposed to daily. Also, results from this study could be used to establish guidelines regarding the duration of work bouts under extreme heat stress. The information gained from this study may serve as a precautionary measure for decreasing the risk of heat illnesses of female firefighters while working in extreme heat. Therefore, the benefits of this study outweigh the risks.
8. Costs to Subjects:This test will be of no cost to the subjects. Time is the only cost for the
participation in this study. This study will require the subject to commit to 30 minutes on the first two days and 2 hours on the third day.
9. Informed Consent:The informed consent will be completed prior to testing and it will be
obtained by the researcher. The protocol, methods, and equipment will be explained thoroughly to each subject. All questions will be addressed to the subject’s satisfaction. Informed consents will be kept on file in the exercise physiology laboratory. All results will be kept confidential from the public and any published data will utilize subject numbers.
Reproduced with permission of the copyright owner. Further reproduction prohibited without permission.
APPENDIX BINFORMED CONSENT AND SUBJECT CLEARANCE FORMS
85
Reproduced with permission of the copyright owner. Further reproduction prohibited without permission.

86
Informed Consent University of Nevada, Las Vegas
Department of Kinesiology
Title: Determination of physiological responses to female fire fighters to work in the heat
General InformationI am Paulette Yamada from the UNLV Department of Kinesiology. I am the
researcher on this project and a graduate student at the university. You are invited to participate in a research study, which will involve the thermoregulatory response of female firefighters working in the heat.
PurposeThe purpose of this study is to measure the duration of work performance in
female firefighters in the heat. Although there has been research on male firefighters, there is a lack of research on female firefighters. Research specific to females is important because females have different thermoregulatory responses than males due to the difference in body composition and average body size and weight. Furthermore, firefighters experience uncompensable heat stress because their uniforms do not allow sweat to evaporate, or body heat to dissipate. Ultimately, turnouts suppress the body cooling mechanisms.
Explanation of the TestsThe testing will take place in the exercise physiology lab in the McDermott
Center (MPE), room 326. The protocol requires you to commit to 3 different days. On the first day, you will undergo preliminary testing consisting of a 3-minute step test, body composition measurements and resting temperature, heart rate and blood pressure measurements. These procedures will last about 60 minutes.
On the second day, you will undergo a maximal oxygen consumption test (VOzmax test), which will be used to calculate the exercise intensity for future testing. This will involve walking on the treadmill to voluntary exhaustion. The protocol will use 2-minute stages with progressive increases in grade (2%) every minute. The speed will remain constant at 3.4 miles per hour (mph). You will be dressed in turnouts, boots and self-contained breathing apparatus (SCBA). Skin temperatures, rectal temperature, heart rate and oxygen uptake will be continuously monitored throughout the test. You will be given instructions for inserting the disposable rectal probe. The rectal probe will be inserted -10 cm from the rectum. This test should take no more than 60 minutes.On the third day you will walk on a treadmill at 50% of your VÜ2max in an environmental chamber (40.1° C, 20% RH) until heart rate and/or rectal temperatures reach 95% HRmax and 39.5° C, respectively. Skin temperatures, rectal temperature, heart rate and oxygen uptake will be continuously monitored throughout the test. RPE and thermal comfort scales will be used to determine your subjective exertion and comfort. A finger prick will be used to collect small samples of blood on three different occasions. There will be 2 trials of exercising in the environmental chamber and 2 periods of rest following each work period. These procedures should be completed within 2 hours.
Reproduced with permission of the copyright owner. Further reproduction prohibited without permission.
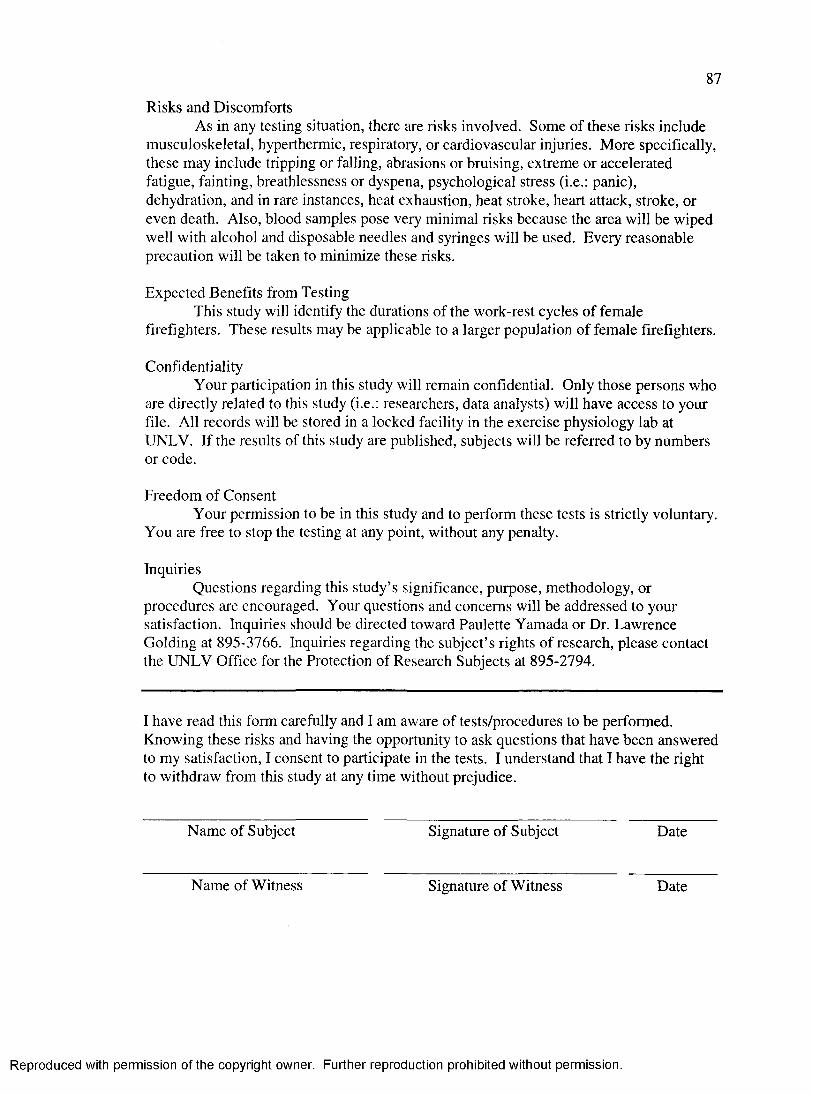
87
Risks and DiscomfortsAs in any testing situation, there are risks involved. Some of these risks include
musculoskeletal, hyperthermic, respiratory, or cardiovascular injuries. More specifically, these may include tripping or falling, abrasions or bruising, extreme or accelerated fatigue, fainting, breathlessness or dyspena, psychological stress (i.e.: panic), dehydration, and in rare instances, heat exhaustion, heat stroke, heart attack, stroke, or even death. Also, blood samples pose very minimal risks because the area will be wiped well with alcohol and disposable needles and syringes will be used. Every reasonable precaution will be taken to minimize these risks.
Expected Benefits from TestingThis study will identify the durations of the work-rest cycles of female
firefighters. These results may be applicable to a larger population of female firefighters.
ConfidentialityYour participation in this study will remain confidential. Only those persons who
are directly related to this study (i.e.: researchers, data analysts) will have access to your file. All records will be stored in a locked facility in the exercise physiology lab at UNLV. If the results of this study are published, subjects will be referred to by numbers or code.
Freedom of ConsentYour permission to be in this study and to perform these tests is strictly voluntary.
You are free to stop the testing at any point, without any penalty.
InquiriesQuestions regarding this study’s significance, purpose, methodology, or
procedures are encouraged. Your questions and concerns will be addressed to your satisfaction. Inquiries should be directed toward Paulette Yamada or Dr. Lawrence Golding at 895-3766. Inquiries regarding the subject’s rights of research, please contact the UNLV Office for the Protection of Research Subjects at 895-2794.
I have read this form carefully and I am aware of tests/procedures to be performed. Knowing these risks and having the opportunity to ask questions that have been answered to my satisfaction, I consent to participate in the tests. I understand that I have the right to withdraw from this study at any time without prejudice.
Name of Subject Signature of Subject Date
Name of Witness Signature of Witness Date
Reproduced with permission of the copyright owner. Further reproduction prohibited without permission.
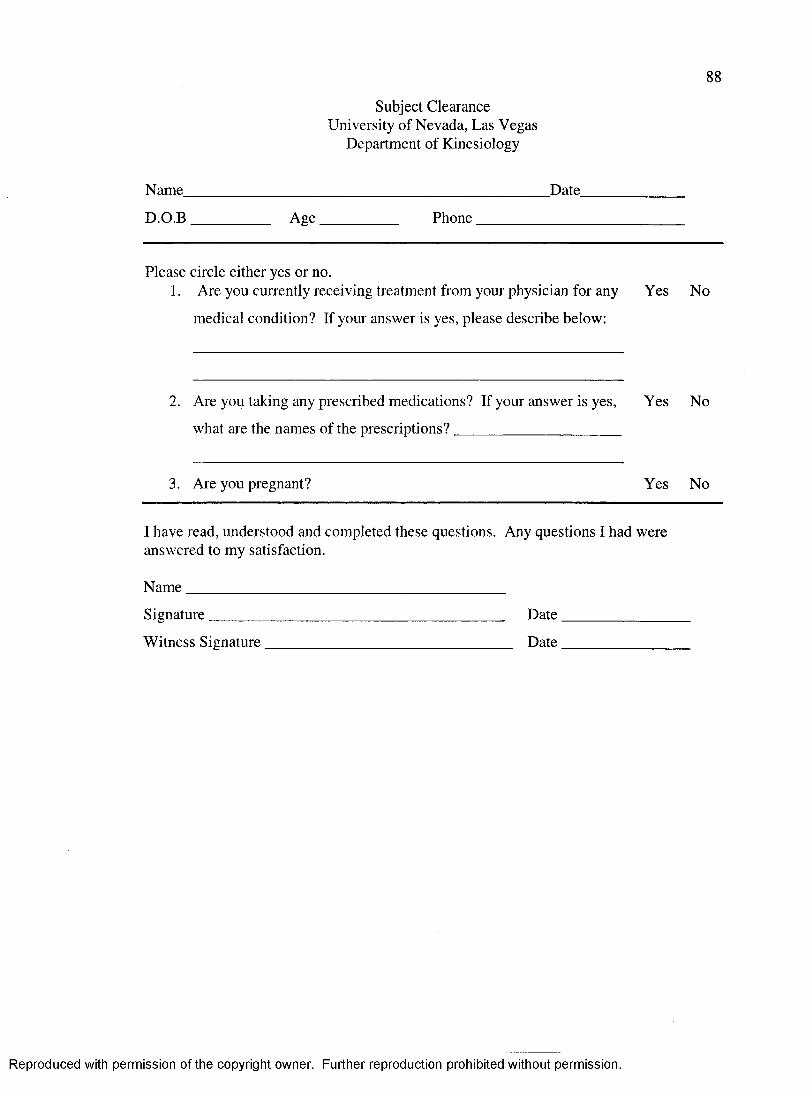
88
Subject Clearance University of Nevada, Las Vegas
Department of Kinesiology
Name__________________________________________________Date_
D .O .B__________ A ge___________ Phone______________
Please circle either yes or no.1. Are you currently receiving treatment from your physician for any Yes No
medical condition? If your answer is yes, please describe below:
2. Are you taking any prescribed medications? If your answer is yes. Yes No
what are the names of the prescriptions?______________________
3. Are you pregnant? Yes No
I have read, understood and completed these questions. Any questions I had were answered to my satisfaction.
N a m e ___________________________________________
Signature _______________________________________ _ D ate .
Witness Signature_________________________________ D ate ,
Reproduced with permission of the copyright owner. Further reproduction prohibited without permission.

APPENDIX C
DIET ANALYSES
89
Reproduced with permission of the copyright owner. Further reproduction prohibited without permission.
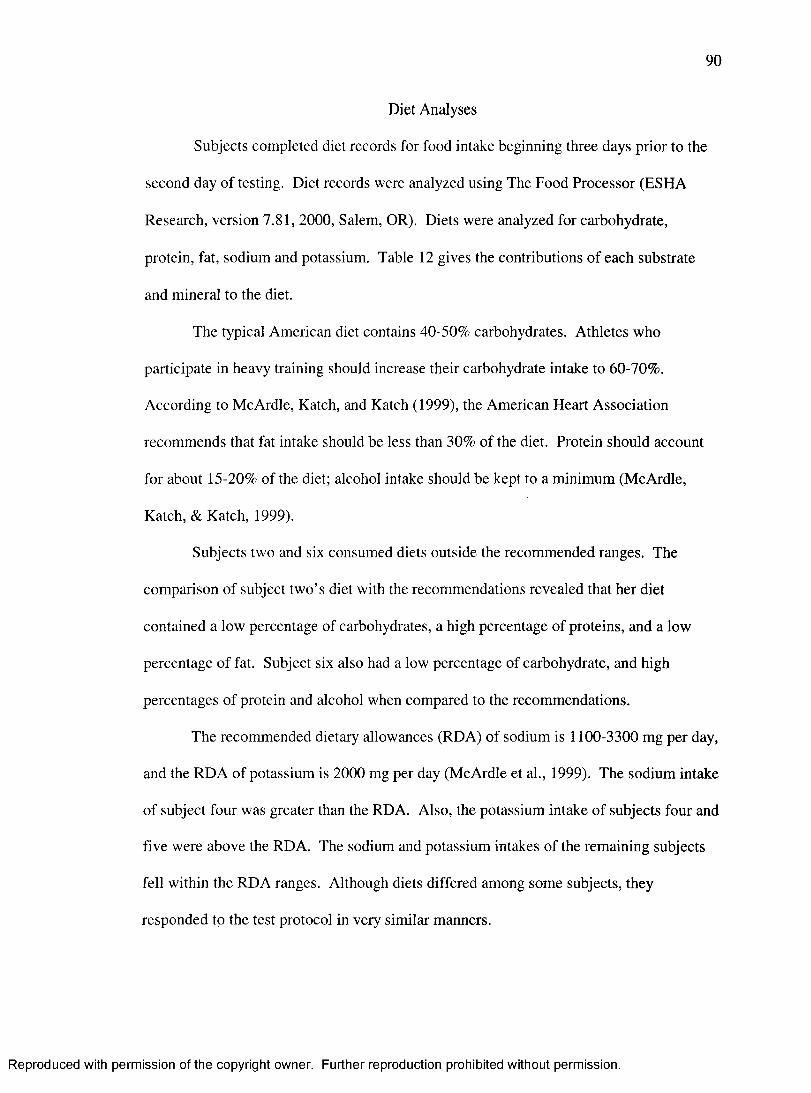
90
Diet Analyses
Subjects completed diet records for food intake beginning three days prior to the
second day of testing. Diet records were analyzed using The Food Processor (ESHA
Research, version 7.81, 2000, Salem, OR). Diets were analyzed for carbohydrate,
protein, fat, sodium and potassium. Table 12 gives the contributions of each substrate
and mineral to the diet.
The typical American diet contains 40-50% carbohydrates. Athletes who
participate in heavy training should increase their carbohydrate intake to 60-70%.
According to McArdle, Katch, and Katch (1999), the American Heart Association
recommends that fat intake should be less than 30% of the diet. Protein should account
for about 15-20% of the diet; alcohol intake should be kept to a minimum (McArdle,
Katch, & Katch, 1999).
Subjects two and six consumed diets outside the recommended ranges. The
comparison of subject two’s diet with the recommendations revealed that her diet
contained a low percentage of carbohydrates, a high percentage of proteins, and a low
percentage of fat. Subject six also had a low percentage of carbohydrate, and high
percentages of protein and alcohol when compared to the recommendations.
The recommended dietary allowances (RDA) of sodium is 1100-3300 mg per day,
and the RDA of potassium is 2000 mg per day (McArdle et al., 1999). The sodium intake
of subject four was greater than the RDA. Also, the potassium intake of subjects four and
five were above the RDA. The sodium and potassium intakes of the remaining subjects
fell within the RDA ranges. Although diets differed among some subjects, they
responded to the test protocol in very similar manners.
Reproduced with permission of the copyright owner. Further reproduction prohibited without permission.
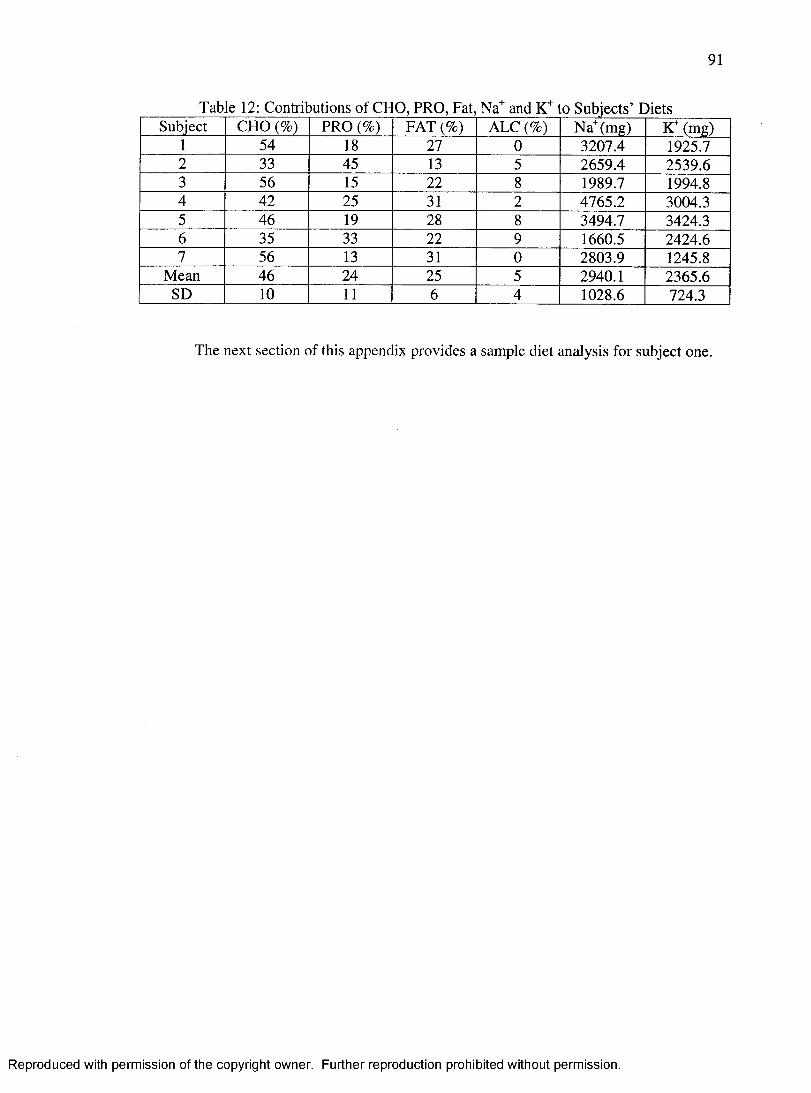
91
Tab e 12: Contributions of Ch 0 , PRO, Fat, Na+ and K+ .0 Subjects’ DietsSubject CHO (%) PRO (%) FAT (%) ALC(%) Na^(mg) K" (m%)
1 54 18 27 0 3207.4 1925.72 33 45 13 5 2659.4 2539.63 56 15 22 8 1989.7 1994.84 42 25 31 2 4765.2 3004.35 46 19 28 8 3494.7 3424.36 35 33 22 9 1660.5 2424.67 56 13 31 0 2803.9 1245.8
Mean 46 24 25 5 2940.1 2365.6SD 10 11 6 4 1028.6 724.3
The next section of this appendix provides a sample diet analysis for subject one.
Reproduced with permission of the copyright owner. Further reproduction prohibited without permission.
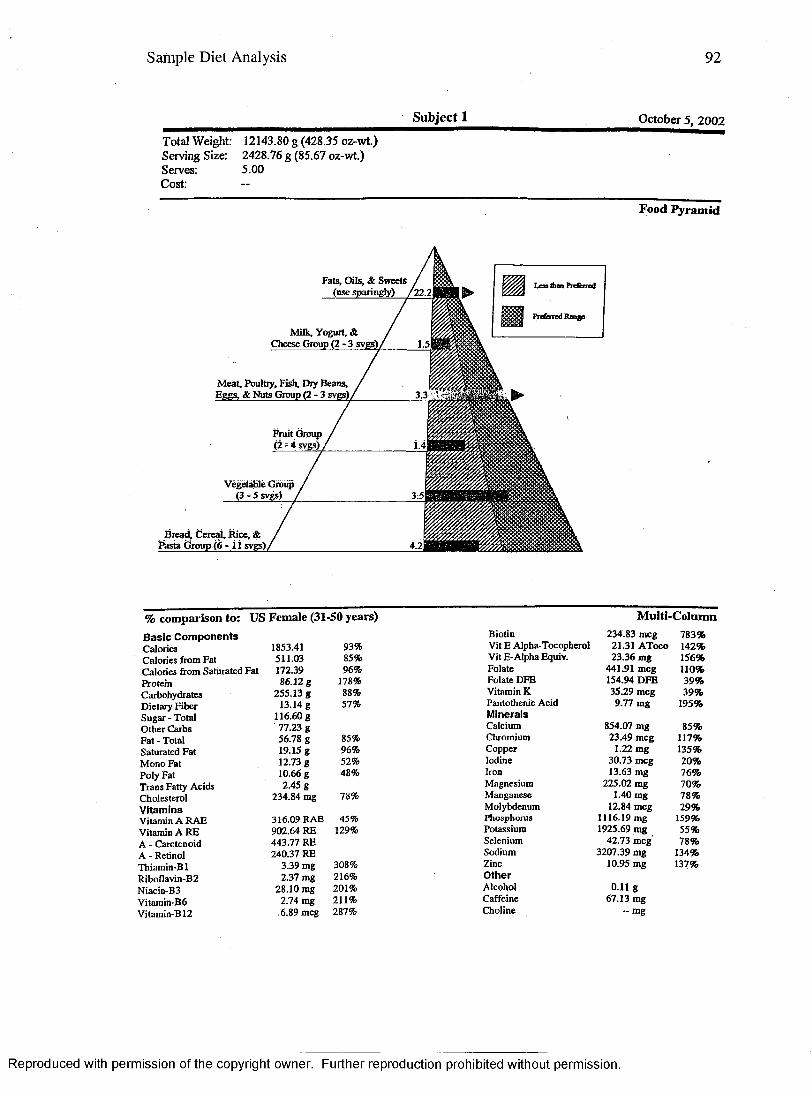
Sample Diet Analysis 92
Subject 1 October 5, 2002Total Weight: 12143.80 g (428.35 oz-wt.) Serving Size: 2428.76 g (85.67 oz-wt.)Serves: 5.00Cost:
Food Pyram id
Fats, Oils, & Sweets (use sparingly) / 22.:
Milk, Yogurt, & Cheese Group (2 -3 svgs)
Meat, Poultry, Fish, Diy Beans, Eggs. & Nuts Group (2 -3 svgs)
Leg than Prrfared
ftd b re d Range
Brea4 C e rc^ Rice, & Pasta Group (6 - 11 svgs),
Fruit Group (2 - 4 svgs)
V égétale Grinÿ (3 - 5 sv^)
comparison to: US Female (31-50 years) M ulti-Column
B asic C om ponents Biotin 234.83 mcg 783%Calories 1853.41 93% Vit E Alpha-Tocopherol 21.31 AToco 142%Calories from Fat 511.03 85% Vit E-Alpha Equiv. 23.36 mg 156%Calories from Saturated Fat 172.39 96% Folate 441.91 mcg 110%Protein 86.12 g 178% Folate DFB 154.94 DFE 39%Carbohydrates 255.13 g 88% Vitamin K 35.29 mcg 39%Dietary Fiber 13.14 g 57% Pantothenic Acid 9.77 mg 195%Sugar - Total 116.60 g MineralsOther Garbs 77.23 g Calcium 854.07 mg 85%Fat - Total 56.78 g 85% Chromium 23.49 mcg 117%Saturated Fat 19.15 g 96% Copper 1.22 mg 135%Mono Fat 12.73 g 52% Iodine 30.73 mcg 20%Poly Fat 10.66 g 48% Iron 13.63 mg 76%Trans Fatty Acids 2.45 g Magnesium 225.02 mg 70%Cholesterol 234.84 mg 78% Manganese 1.40 mg 78%Vitamins Molybdenum 12.84 mcg 29%Vitamin A RAE 316.09 RAE 45% Phosphorus 1116.19 mg 159%Vitamin A RE 902.64 RE 129% Potassium 1925.69 mg 55%A - Carotenoid 443.77 RE Selenium 42.73 mcg 78%A - Retinol 240.37 RE Sodium 3207.39 mg 134%Thiamin-B 1 3.39 mg 308% Zinc 10.95 mg 137%Riboflavin-B2 2.37 mg 216% OtherNiacin-B3 28.10 mg 201% Alcohol 0.11 gVitamin-B6 2.74 mg 211% Caffeine 67.13 mgVitamin-B12 .6.89 mcg 287% Choline - m g
Reproduced with permission of the copyright owner. Further reproduction prohibited without permission.
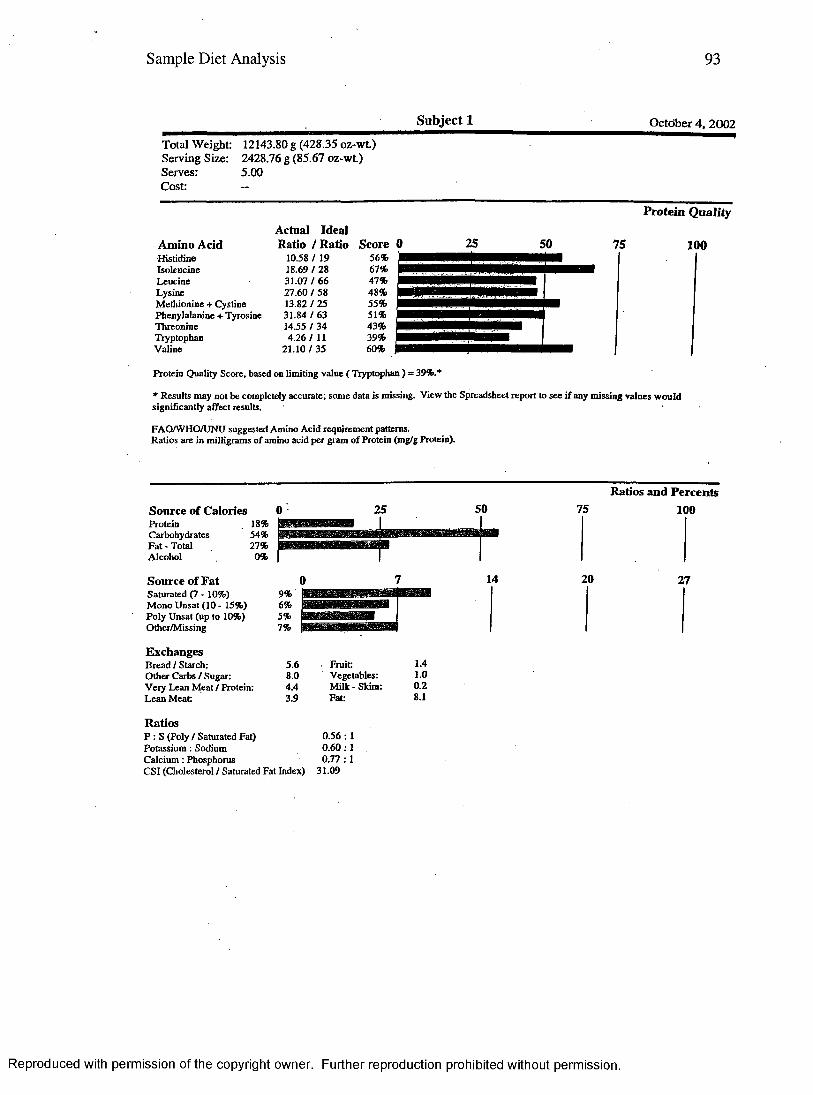
Sample Diet Analysis 93
Subject 1 October 4. 2002
Total Weight: Serving Size: Serves:Cost:
12143.80 g (428.35 oz-wt.)2428.76 g (85.67 oz-wt.)5.00
Actual IdealAmino Acid Ratio / Ratio ScoreHisddine 10.58 / 19 56%Isoleucine 18.69 / 28 67%Leucine 31.07 / 66 47%Lysine 27.60 / 58 48%Methionine + Cystine 13.82 / 25 55%Phenylalanine + Tyrosine 31.84 / 63 51%Threonine 14.55 / 34 43%Tryptophan 4 .2 6 /1 1 39%Valine 21.10 / 35 60%
25 50
Protein Q uality
75 100
Protein Quality Score, based on limiting value ( Tryptophan ) = 39%.*
* Results may not be completely accurate; some data is missing. View the Spreadsheet report to see if any missing values would significantly affect results.
FAO/WHO/UNU suggested Amino Acid requirement patterns.Ratios are in milligrams of amino acid per gram of Protein (mg/g Protein).
Source of Calories 0Protein . 18%Carbohydrates 54%Fat-Total 27%Alcohol 0%
Source of FatSaturated (7 - 10%)Mono Unsat (10- 15%)Poly Unsat (up to 10%)Other/Missing
ExchangesBread / Starch: 5.6Other Garbs / Sugar: 8.0Very Lean Meat / Protein: 4.4Lean Meat: 3.9
RatiosP : S (Poly / Saturated Fat)Potassium : SodiumCalcium : PhosphorusCSl (Cholesterol / Saturated Fat Index)
25 50
14
Ratios and Percents 75 100
20 27
Fruit:Vegetables: Milk - Skim: Fat:
0.56: 1 0 .60:1 0 .77 :1
31.09
1.41.00.28.1
Reproduced with permission of the copyright owner. Further reproduction prohibited without permission.

Sample Diet Analysis 94
Subject 1 October 4, 2002
Total Weight: Serving Size: Serves:Cost:
12143.80 g (428.35 oz-wt.)2428.76 g (85.67 oz-wt.)5.00
% comparison to
NutrientBasic ComponentsCaloriesCalories from Fat Calories from Saturated ProteinCarbohydrates Dietary Fiber Sugar - Total Other Carbs Fat - Total Saturated Fat Mono Fat Poly FatTrans Fatty Acids Cholesterol Vitamins
US Female (31-50 years)Value Goal % 0
Fat
1853.41511.03172.3986.12 g
255.13 g13.14 g
116.60 g77.23 g 56.78 g19.15 g 12.73 g10.66 g2.45 g
234.84 mg
Minerals-
Bar Graph 100
57%
78%
Vitamin A RAE 316.09 RAE 45%Vitamin A RE 902.64 RE 129%A - Carotenoid 443.77 REA - Retinol 240.37 REThiamin-B 1 3.39 rag 308%Riboflavin-B2 2.37 mg 216%Niacin-B3 28.10 mg 201%Vitamin-B6 2.74 mg 211%Vitamin-B12 6.89 mcg 287%Biotin 234.83 mcg 783%Vit E Alpha-Tocopherol 21.31 AToco 142%Vit E-Alpha Equiv. 23.36 mg 156%Folate 441.91 mcg 110%Folate DFE 154.94 DFE 39%Vitamin K 35.29 mcg 39%Pantothenic Acid 9.77 mg 195%
Calcium 854.07 mg 85%Chromium 23.49 mcg .117%Copper 1.22 mg 135%Iodine 30.73 mcg 20%Iron 13.63 mg 76%Magnesium 225.02 mg 70%Manganese 1.40 mg 78%Molybdenum 12.84 mcg 29%Phosphorus 1116.19 mg 159%Potassium 1925.69 mg 55%Selenium 42.73 mcg 78%Sodium 3207.39 mg 134%Zinc 10.95 mg 137%
Alcohol 0.11 gCaffeine 67.13 mgCholine - mg
Reproduced with permission of the copyright owner. Further reproduction prohibited without permission.
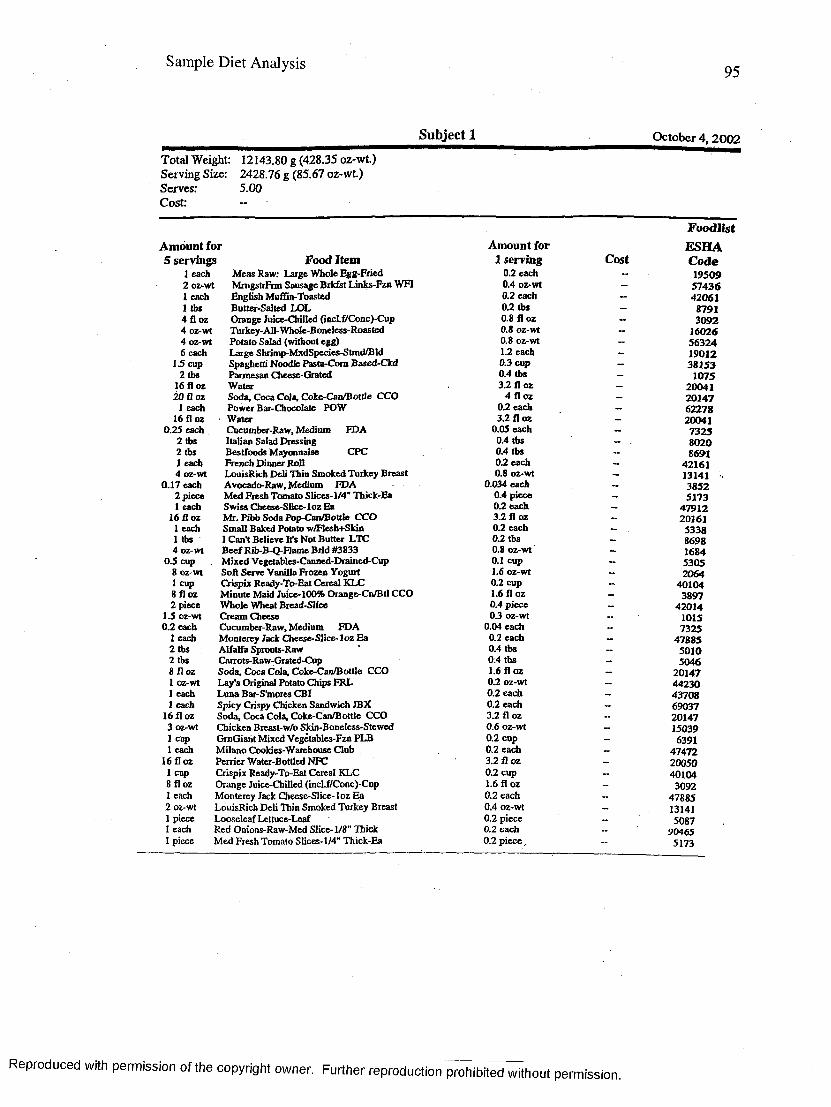
Sample Diet Analysis 95
Subject 1 October 4, 2002
Total Weight: Serving Size: Serves:Cost:
12143.80 g (428.35 oz-wt.)2428.76 g (85.67 oz-wt.)5.00
FoodlistAmount for Amount for E SH A5 servings Food Item 1 serving Cost Code
1 each Meas Raw: Large Whole Egg-Fried 0.2 each - 195092 oz-wt MrngstrFnn Sausage Brkfst Links-Fzn WFI 0.4 oz-wt - 574361 each English Muffin-Toasted 0.2 each - 420611 tbs Butter-Salted LOL 0.2 tbs — 87914 fl oz Orange Juice-Chilled (incl.ffConc)-Cup 0.8 fl oz - 30924 oz-wt nn-key-AH-Whclc-Boneless-Roasted 0.8 oz-wt — 160264 oz-wt Potato Salad (without egg) 0.8 oz-wt - 563246 each Large Shrimp-MxdSpecies-Stmd/Bld 1.2 each - 19012
1.5 cup Spaghetti Noodle Pasta-Com Based-Ckd 0.3 cup - 381532 tbs Parmesan Cheese-Grated 0.4 tbs — 1075
16 fl oz Water 3.2 floz — 2004120floz Soda, Coca Cols, Cokc-Can/B ottle CCD 4 fl oz - 20147
1 each Power Bar-Chocolate POW 0.2 each - 6227816 fl oz • Water 3.2 fl oz - 20041
0.25 each . (Zucumber-Raw, Medium FDA 0.05 each w. 73252tbs Italian Salad Dressing 0.4 tbs - . 80202 tbs Bestfoods Mayonnaise CPC 0.4 tbs - 86911 each french Dinner Roll 0.2 each — 421614 oz-wt LouisRich Deli Thin Smoked Turkey Breast 0.8 oz-wt - 13141
0.17 each Avocado-Raw, Medium FDA 0.034 each — 38522 piece Med fresh Tomato Slices-1/4" Thick-Ea 0.4 piece - 51731 each Swiss Cheese-Slice-loz Ea 0.2 each — 47912
16 fl oz Mr. Pibb Soda Pop-CanŒottle CCO 3.2fl oz — 201611 each Small Baked Potato w/Flcsh+Skin 0.2 each - 53381 tbs I Can't Believe It's Not Butter LTC 0.2 tbs - 86984 oz-wt Beef Rib-B-CMTame Bild #3833 0.8 oz-wt - 1684
0.5 cup Mixed Vegetables-Canned-Diained-Cup 0.1 cup — 53058 oz-wt Soft Serve Vanilla Frozen Yogurt 1.6 oz-wt 20641 cup (hiqrix Ready-To-Eat Cereal KLC 0.2 cup 401048 floz Minute Maid Juice-1(X)% Orange-Cn/Btl CCO 1.6 fl oz — 38972 piece Whole Wheat Bread-Slice 0.4 piece - 42014
1.5 oz-wt Cream Cheese 0.3 oz-wt — 10150.2 each Cucumber-Raw, Medium FDA 0.04 each — 7325
1 each Monterey Jack Cheese-Slice-loz Ea 0.2 each - 478852 tbs Alfalfa Sprouts-Raw 0.4 tbs - , 50102 tbs Carrots Raw-Grated-tZup 0.4 tbs — 5046S f l o z Soda, Coca Cola, Coke-Can/B ottle CCO 1.6 fl oz - 201471 oz-wt Lay's Original Potato Chips FRL 0.2 oz-wt - 442301 each Luna Bar-S'mores CBI 0.2 each — 437081 each Spicy Crispy Chicken Sandwich JBX 0.2 each - 69037
16 floz Soda, Coca Cola, Coke-Can/Bottle CCO 3.2 fl oz - 201473 oz-wt Chicken Breast-w/o Skin-Boneless-Stewed 0.6 oz-wt - 150391 cup GmGiant Mixed Vegètables-Fzn PLB 0.2 cup - - 63911 each Milano Cookies-Warehouse Club . 0.2 each - 47472
16 fl oz Perrier Water-Bottled NFC 3.2 fl oz - 200501 cup Crispix Ready-To-Eat Cereal KLC 0.2 cup - 401048 fl oz Orange Juice-Chilled (incl.flConc)-Cup 1.6 fl oz - 30921 each Monterey Jack Cheese-Slice-loz Ea 0.2 each — 478852 oz-wt LouisRich Deli Thin Smoked Turkey Breast 0.4 oz-wt - 131411 piece Looseleaf Lettuce-Leaf 0.2 piece 50871 each Red Onions-Raw-Med Slice-1/8" Thick 0.2 each — 904651 piece Med Fresh Tomato Slices-1/4" Thick-Ea 0.2 piece. 5173
Reproduced with permission of the copyright owner. Further reproduction prohibited without permission.
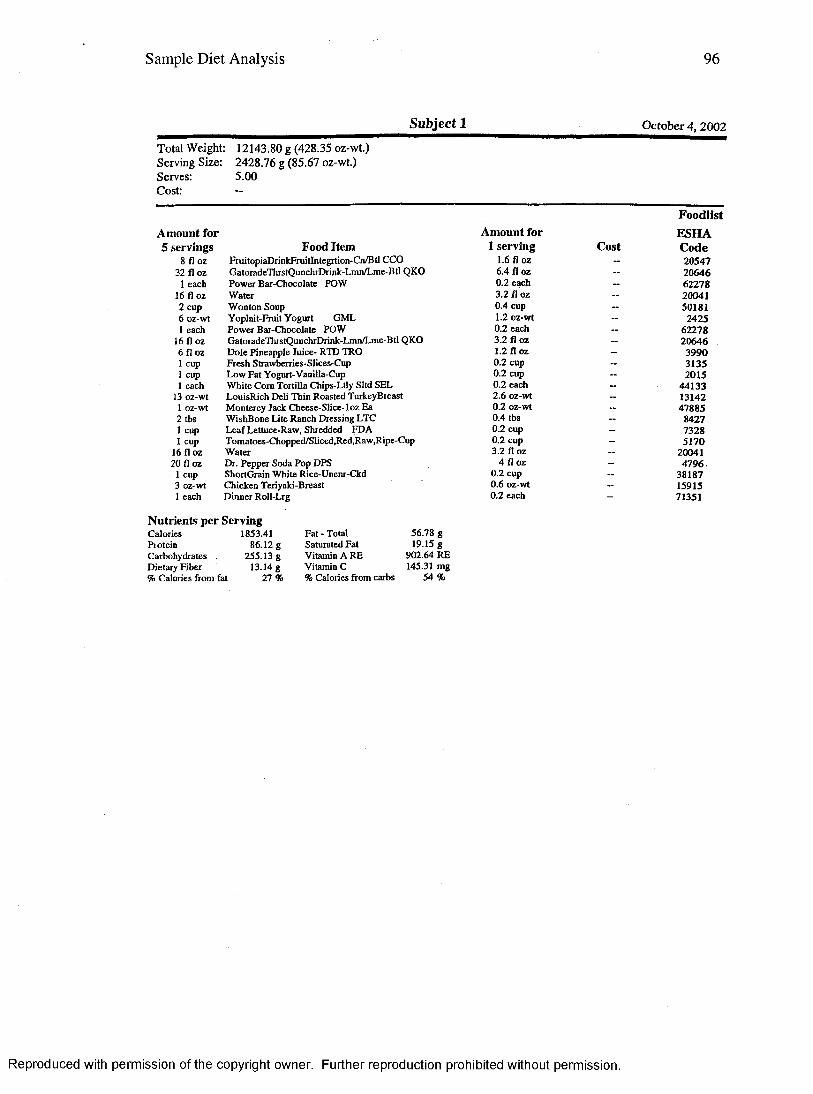
Sample Diet Analysis 96
Subject 1 October 4, 2002
Total Weight: Serving Size: Serves:Cost:
12143.80 g (428.35 oz-wt.)2428.76 g (85.67 oz-wt.)5.00
FoodlistAmount for Amount for ESHA5 servings Food Item 1 serving Cost Code
8 fl oz FruitopiaDrinkFruitlntegrtion-Cn/Btl CCO 1.6 fl oz — 2054732 fl oz GatoradeThrstQunchrDrink-Lmn/Lme-B tl QKO 6.4 fl oz — 20646
1 each Power Bar-Chocolate POW 0.2 each — 6227816 fl oz Water 3.2 fl oz — 200412 cup Wonton Soup 0.4 cup — 501816 oz-wt Yoplait-Fruit Yogurt GML 1.2 oz-wt — 24251 each Power Bar-Chocolate POW 0.2 each — 62278
16 fl oz GatoradeThrstQunchrDrink-Lmn/Lme-Btl QKO 3.2 fl oz — 206466 fl oz Dole Pineapple Juice- RTD TRO 1.2 fl oz — 39901 cup Fresh Strawberries-Slices-Cup 0.2 cup — 31351 cup Low Fat Yogurt-Vanilla-Cup 0.2 cup — 20151 each White Com Tortilla Chips-Ltly Sltd SEL 0.2 each — 44133
13 oz-wt LouisRich Deli Thin Roasted TurkeyBreast 2.6 oz-wt - 131421 oz-wt Monterey Jack Cheese-Slice-loz Ea 0.2 oz-wt — 478852 tbs WishBone Lite Ranch Dressing LTC 0.4 tbs — 84271 cup Leaf Lettuce-Raw. Shredded FDA 0.2 cup — 73281 cup Tomatoes-Chopped/Sliced,Red,Raw,Ripe-Cup 0.2 cup - 5170
16 fl oz Water 3.2 fl oz — 2004120 fl oz Dr. Pepper Soda Pop DPS 4 fl oz - 4796
1 cup ShortGrain White Rice-Unenr-Ckd 0.2 cup —- 381873 oz-wt Chicken Teriyald-Breast 0.6 oz-wt - 159151 each Dinner Roll-Lrg 0.2 each - 71351
Nutrients per ServingCalories 1853.41Protein 86.12 gCarbohydrates . 255.13 gDietary Fiber 13.14 g% Calories from fat 27 %
Fat - Total Saturated Fat Vitamin A RE Vitamin C% Calories from carbs
56.78 g 19.15 g
902.64 RE 145.31 mg
54 %
Reproduced with permission of the copyright owner. Further reproduction prohibited without permission.
APPENDIX D METABOLIC SYSTEM CALIBRATION METHODS
97
Reproduced with permission of the copyright owner. Further reproduction prohibited without permission.
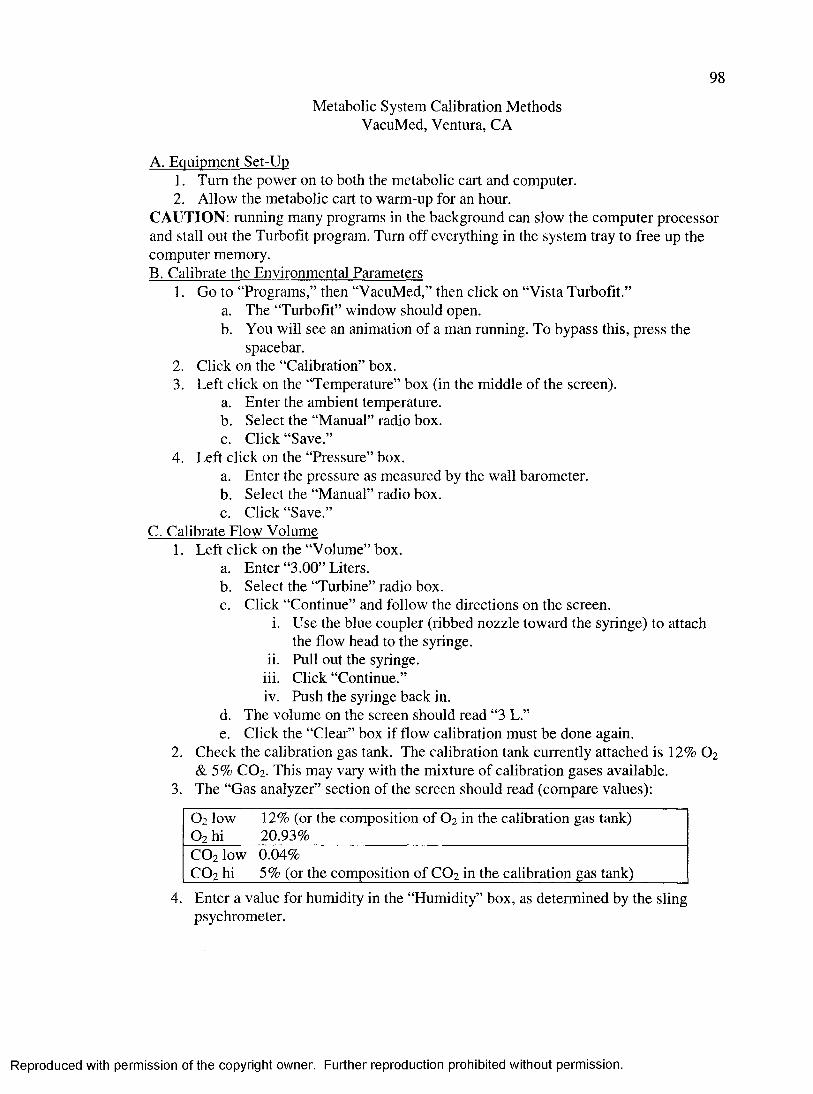
98
Metabolic System Calibration Methods VacuMed, Ventura, CA
A. Equipment Set-Up1. Turn the power on to both the metabolic cart and computer.2. Allow the metabolic cart to warm-up for an hour.
CAUTION: running many programs in the background can slow the computer processor and stall out the Turbofit program. Turn off everything in the system tray to free up the computer memory.B. Calibrate the Environmental Parameters
1. Go to “Programs,” then “VacuMed,” then click on “Vista Turbofit.”a. The “Turbofit” window should open.b. You will see an animation of a man running. To bypass this, press the
spacebar.2. Click on the “Calibration” box.3. Left click on the “Temperature” box (in the middle of the screen).
a. Enter the ambient temperature.b. Select the “Manual” radio box.c. Click “Save.”
4. Left click on the “Pressure” box.a. Enter the pressure as measured by the wall barometer.b. Select the “Manual” radio box.c. Click “Save.”
C. Calibrate Elow Volume1. Left click on the “Volume” box.
a. Enter “3.00” Liters.b. Select the “Turbine” radio box.c. Click “Continue” and follow the directions on the screen.
i. Use the blue coupler (ribbed nozzle toward the syringe) to attaeh the flow head to the syringe.
ii. Pull out the syringe.iii. Click “Continue.”iv. Push the syringe back in.
d. The volume on the screen should read “3 L.”e. Click the “Clear” box if flow calibration must be done again.
2. Check the calibration gas tank. The calibration tank currently attached is 12% O2
& 5% CO2 . This may vary with the mixture of calibration gases available.3. The “Gas analyzer” section of the screen should read (compare values):
O2 low 12% (or the composition of O2 in the calibration gas tank)O2 hi 20.93%CO2 low 0.04%CO2 hi 5% (or the composition of CO2 in the calibration gas tank)
4. Enter a value for humidity in the “Humidity” box, as determined by the sling psychrometer.
Reproduced with permission of the copyright owner. Further reproduction prohibited without permission.
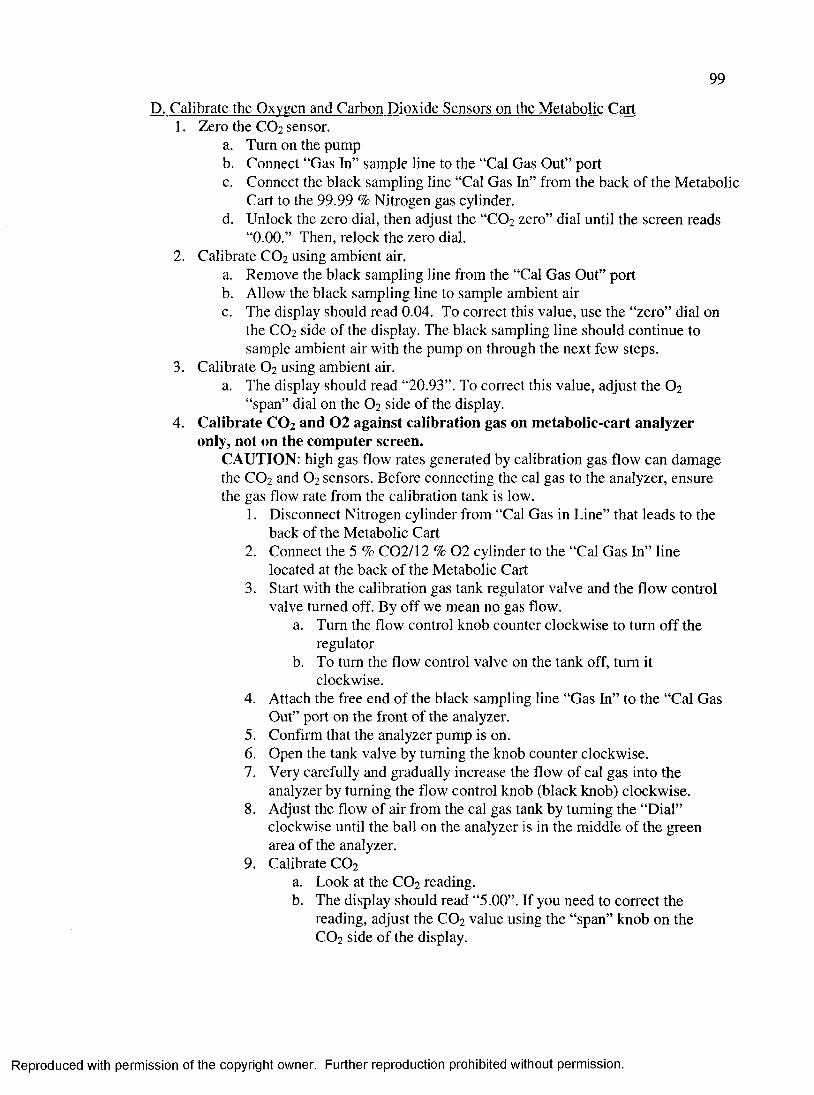
99
D. Calibrate the Oxygen and Carbon Dioxide Sensors on the Metabolic Cart1. Zero the CO2 sensor.
a. Turn on the pumpb. Connect “Gas In” sample line to the “Cal Gas Out” portc. Connect the black sampling line “Cal Gas In” from the back of the Metabolic
Cart to the 99.99 % Nitrogen gas cylinder.d. Unlock the zero dial, then adjust the “CO2 zero” dial until the screen reads
“0.00.” Then, relock the zero dial.2. Calibrate CO2 using ambient air.
a. Remove the black sampling line from the “Cal Gas Out” portb. Allow the black sampling line to sample ambient airc. The display should read 0.04. To correct this value, use the “zero” dial on
the CO2 side of the display. The black sampling line should continue to sample ambient air with the pump on through the next few steps.
3. Calibrate O2 using ambient air.a. The display should read “20.93”. To correct this value, adjust the O2
“span” dial on the O2 side of the display.4. Calibrate CO% and 0 2 against calibration gas on metabolic-cart analyzer
only, not on tbe computer screen.CAUTION: high gas flow rates generated by calibration gas flow can damage the CO2 and O2 sensors. Before connecting the cal gas to the analyzer, ensure the gas flow rate from the calibration tank is low.
1. Disconnect Nitrogen cylinder from “Cal Gas in Line” that leads to the back of the Metabolic Cart
2. Connect the 5 % C 02/I2 % 0 2 cylinder to the “Cal Gas In” line located at the back of the Metabolic Cart
3. Start with the calibration gas tank regulator valve and the flow control valve turned off. By off we mean no gas flow.
a. Turn the flow control knob counter clockwise to turn off the regulator
b. To turn the flow control valve on the tank off, turn it clockwise.
4. Attach the free end of the black sampling line “Gas In” to the “Cal Gas Out” port on the front of the analyzer.
5. Confirm that the analyzer pump is on.6. Open the tank valve by turning the knob counter clockwise.7. Very carefully and gradually increase the flow of cal gas into the
analyzer by turning the flow control knob (black knob) clockwise.8. Adjust the flow of air from the cal gas tank by turning the “Dial”
clockwise until the ball on the analyzer is in the middle of the green area of the analyzer.
9. Calibrate CO2
a. Look at the CO2 reading.b. The display should read “5.00”. If you need to correct the
reading, adjust the CO2 value using the “span” knob on the CO2 side of the display.
Reproduced with permission of the copyright owner. Further reproduction prohibited without permission.
100
10. Calibrate O2
a. Look at the O2 reading.b. The display should read “12.00”. If you need to correct the
reading, adjust the O2 value using the O2 zero dial on the O2
side of the display.5. Calibrate Software with the Metabolic-Cart Analyzer (Auto-Calibration)
1. Disconnect the sample line from the “Cal Gas Out” port2. Sample ambient (room air)3. Click on the “Auto-Calibrate” box on the computer screen.4. When the display on the calibration screen on the computer reads
“0.04” for CO2 and “20.93” for O2 , click the “Auto-Calibration” box.a. Click “Start.”b. You should see smiley faces and a progress bar. These will
disappear once the Auto-Calibration is complete.5. Reconnect to Cal Gas and Cal Gas Out port. Run 5% CO2 and 12%
O2 . Press continue when ready.a. Click the “Continue” box.b. Click “Finish”c. Click “Show Voltages.” The voltages should not differ by
more than 0.2 units.d. Click “Exit to Cal Menu”e. Click “Quit”
6. Turn off the calibration gas at the flow control knob. (Counter clockwise)
7. Turn off the calibration gas at the tank control. (Clockwise)8. Turn the analyzer pump switch off.9. Connect the black sampling line to the flow head on the mouthpiece
and head straps.E. Measurement of VO? during Testing
1. Click the “Stress” box.a. Input data into the fields (i.e.; identification number, first and last name,
D.O.B., height, weight).b. Click “Interval Set-up).
i. Click on the “Time” radio box.ii. Enter “15” seconds into the field.
2. Click “Start Test” box when ready to begin testing. Double-check the sampling interval time. It should be 15 seconds.
3. Click “Continue” and the clock will appear and start timing.4. When the test is finished, click “Stop Test.”
F. Retrieval of Data1. Click the “Review” box.2. Click “Current test.” Choose either “L/min” or “kg/min.”3. Go to the desktop, click on the “My Computer” icon. Proceed to the “C:drive”
then “TurboFit.”4. Copy the desired file to a disk.
Reproduced with permission of the copyright owner. Further reproduction prohibited without permission.
APPENDIX E
RAW DATA
101
Reproduced with permission of the copyright owner. Further reproduction prohibited without permission.
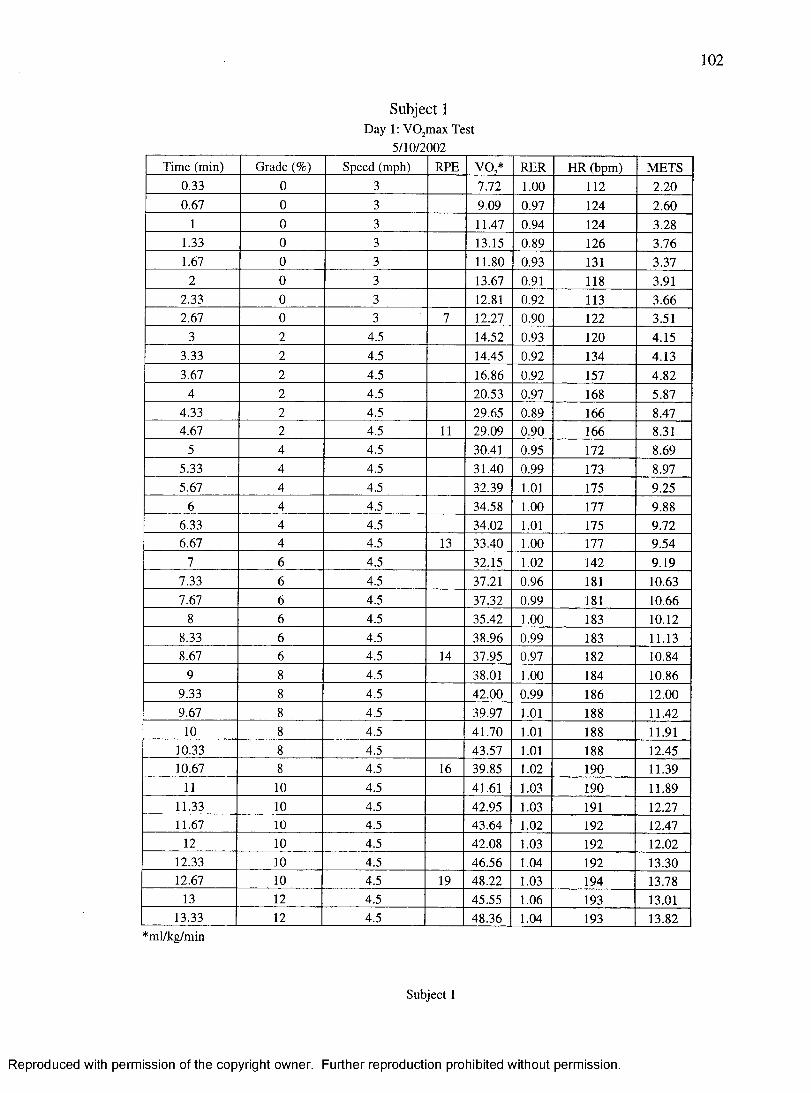
102
Subject 1Day 1: VO^max Test
5/10/2002Time (min) Grade (%) Speed (mph) RPE VO,* RER HR (bpm) METS
0.33 0 3 7.72 1.00 112 2.200.67 0 3 9.09 0.97 124 2.60
1 0 3 11.47 0.94 124 3.281.33 0 3 13.15 0.89 126 3.761.67 0 3 11.80 0.93 131 3.37
2 0 3 13.67 0.91 118 3.912.33 0 3 12.81 0.92 113 3.662.67 0 3 7 12.27 0.90 122 3.51
3 2 4.5 14.52 0.93 120 4.153.33 2 4.5 14.45 0.92 134 4.133.67 2 4.5 16.86 0.92 157 4.82
4 2 4.5 20.53 0.97 168 5.874.33 2 4.5 29.65 0.89 166 8.474.67 2 4.5 11 29.09 0.90 j 166 8.31
5 4 4.5 30.41 0.95 172 8.695.33 4 4.5 31.40 0.99 173 8.975.67 4 4.5 32.39 1.01 175 9.25
6 4 4.5 34.58 1.00 177 9.886.33 4 4.5 34.02 1.01 175 9.726.67 4 4.5 13 33.40 1.00 177 9.54
7 6 4.5 32.15 1.02 142 9.197.33 6 4.5 37.21 0.96 181 10.637.67 6 4.5 37.32 0.99 181 10.66
8 6 4.5 35.42 1.00 183 10.128.33 6 4.5 38.96 0.99 183 11.138.67 6 4.5 14 37.95 0.97 182 10.84
9 8 4.5 38.01 1.00 184 10.869.33 8 4.5 42.00 0.99 186 12.009.67 8 4.5 39.97 1.01 188 11.4210 8 4.5 41.70 1.01 188 11.91
10.33 8 4.5 43.57 1.01 188 12.4510.67 8 4.5 16 39.85 1.02 190 11.39
11 10 4.5 41.61 1.03 190 11.8911.33 10 4.5 42.95 1.03 191 12.2711.67 10 4.5 43.64 1.02 192 12.47
12 10 4.5 42.08 1.03 192 12.0212.33 10 4.5 46.56 1.04 192 13.3012.67 10 4.5 19 48.22 1.03 194 13.78
13 12 4.5 45.55 1.06 193 13.0113.33 12 4.5 48.36 1.04 193 13.82
*ml/kg/min
Subject 1
Reproduced with permission of the copyright owner. Further reproduction prohibited without permission.
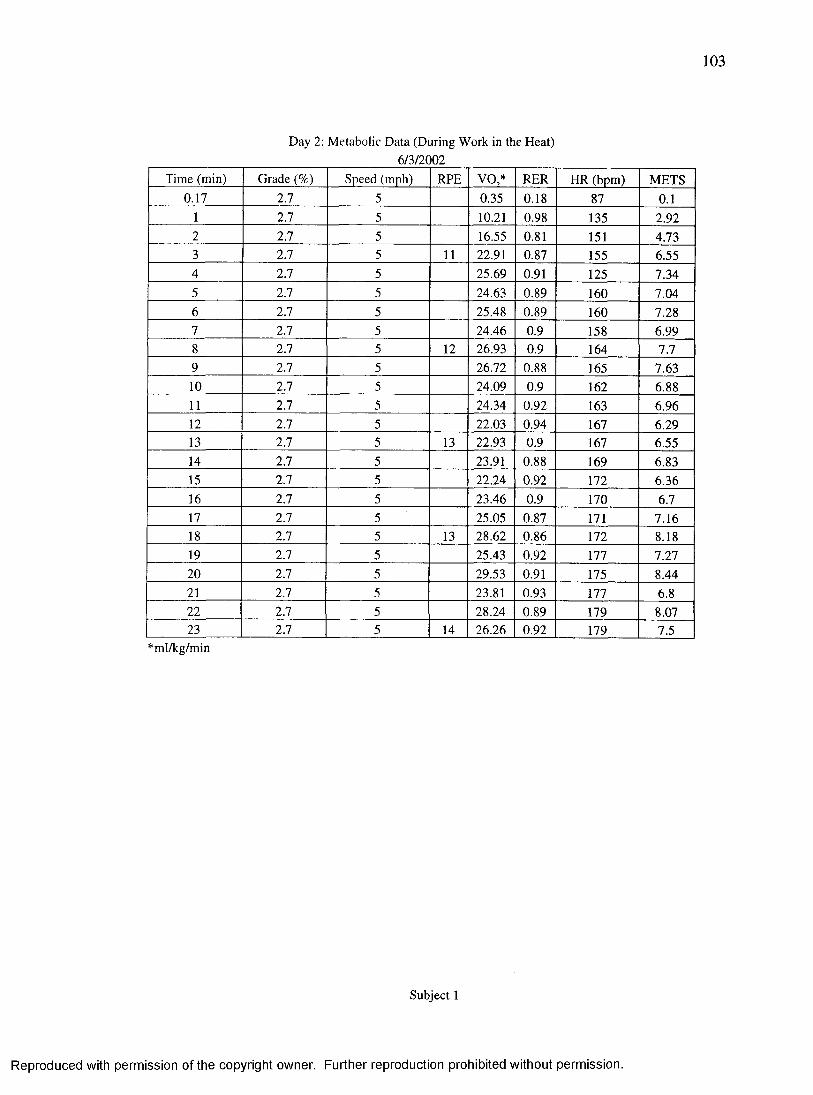
103
Day 2; Metabolic Data (During Work in the Heat)6/3/2002
Time (min) Grade (%) Speed (mph) RPE VO,* RER HR (bpm) METS0.17 2.7 5 0.35 0.18 87 0.1
1 2.7 5 10.21 0.98 135 2.922 2.7 5 16.55 0.81 151 4.733 2.7 5 11 22.91 0.87 155 6.554 2.7 5 25.69 0.91 125 7.345 2.7 5 24.63 0.89 160 7.046 2.7 5 25.48 0.89 160 7.287 2.7 5 24.46 0.9 158 6.998 2.7 5 12 26.93 0.9 164 7.79 2.7 5 26.72 0.88 165 7.6310 2.7 5 24.09 0.9 162 6.8811 2.7 5 24.34 0.92 163 6.9612 2.7 5 22.03 0.94 167 6.2913 2.7 5 13 22.93 0.9 167 6.5514 2.7 5 23.91 0.88 169 6.8315 2.7 5 22.24 0.92 172 6.3616 2.7 5 23.46 0.9 170 6.717 2.7 5 25.05 0.87 171 7.1618 2.7 5 13 28.62 0.86 172 8.1819 2.7 5 25.43 0.92 177 7.2720 2.7 5 29.53 0.91 175 8.4421 2.7 5 23.81 0.93 177 6.822 2.7 5 28.24 0.89 179 8.0723 2.7 5 14 26.26 0.92 179 7.5
*ml/kg/min
Subject 1
Reproduced with permission of the copyright owner. Further reproduction prohibited without permission.
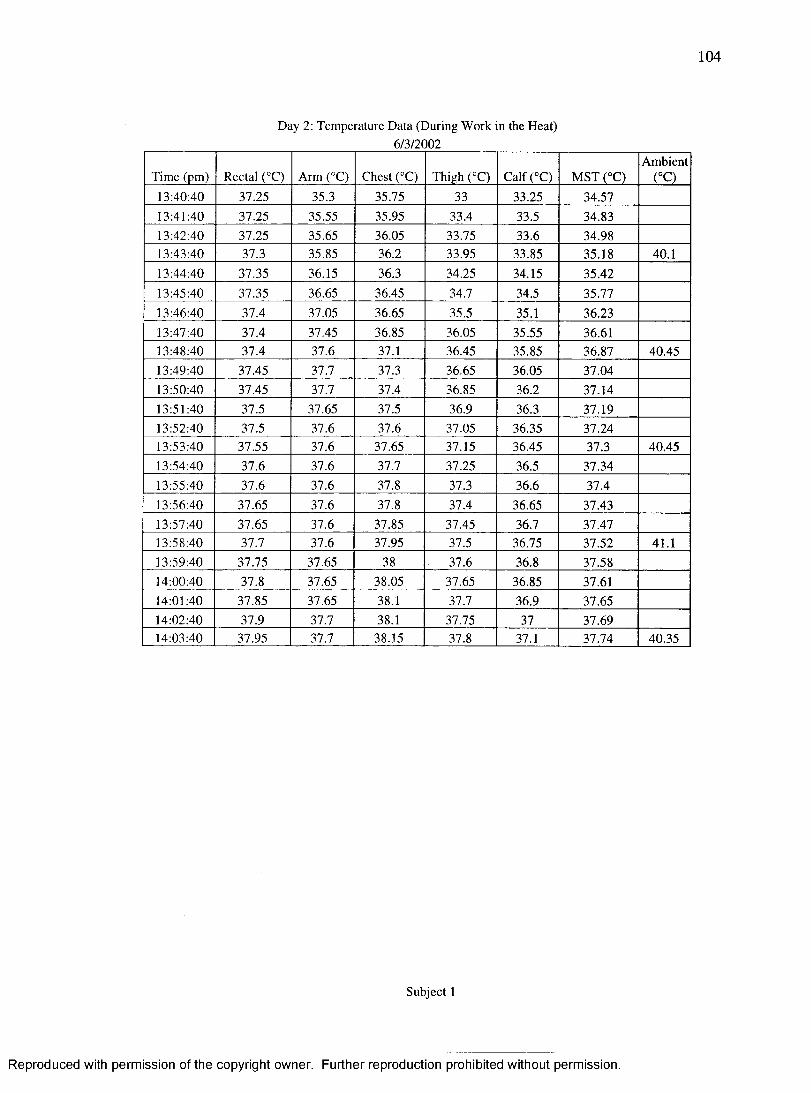
104
Day 2: Temperature Data (During Work in the Heat)6/3/2002
Time (pm) Rectal (°C) Arm (°C) Chest C O Thigh C O Calf C O MST C OAmbient
C O13:40:40 37.25 35.3 35.75 33 33.25 34.5713:41:40 37.25 35.55 35.95 33.4 33.5 34.8313:42:40 37.25 35.65 36.05 33.75 33.6 34.9813:43:40 37.3 35.85 36.2 33.95 33.85 35.18 40.113:44:40 37.35 36.15 36.3 34.25 34.15 35.4213:45:40 37.35 36.65 36.45 34.7 34.5 35.7713:46:40 37.4 37.05 36.65 35.5 35.1 36.2313:47:40 37.4 37.45 36.85 36.05 35.55 36.6113:48:40 37.4 37.6 37.1 36.45 35.85 36.87 40.4513:49:40 37.45 37.7 37.3 36.65 36.05 37.0413:50:40 37.45 37.7 37.4 36.85 36.2 37.1413:51:40 37.5 37.65 37.5 36.9 36.3 37.1913:52:40 37.5 37.6 37.6 37.05 36.35 37.2413:53:40 37.55 37.6 37.65 37.15 36.45 37.3 40.4513:54:40 37.6 37.6 37.7 37.25 36.5 37.3413:55:40 37.6 37.6 37.8 37.3 36.6 37.413:56:40 37.65 37.6 37.8 37.4 36.65 37.4313:57:40 37.65 37.6 37.85 37.45 36.7 37.4713:58:40 37.7 37.6 37.95 37.5 36.75 37.52 41.113:59:40 37.75 37.65 38 37.6 36.8 37.5814:00:40 37.8 37.65 38.05 37.65 36.85 37.6114:01:40 37.85 37.65 38.1 37.7 36.9 37.6514:02:40 37.9 37.7 38.1 37.75 37 37.6914:03:40 37.95 37.7 38.15 37.8 37.1 37.74 40.35
Subject 1
Reproduced with permission of the copyright owner. Further reproduction prohibited without permission.
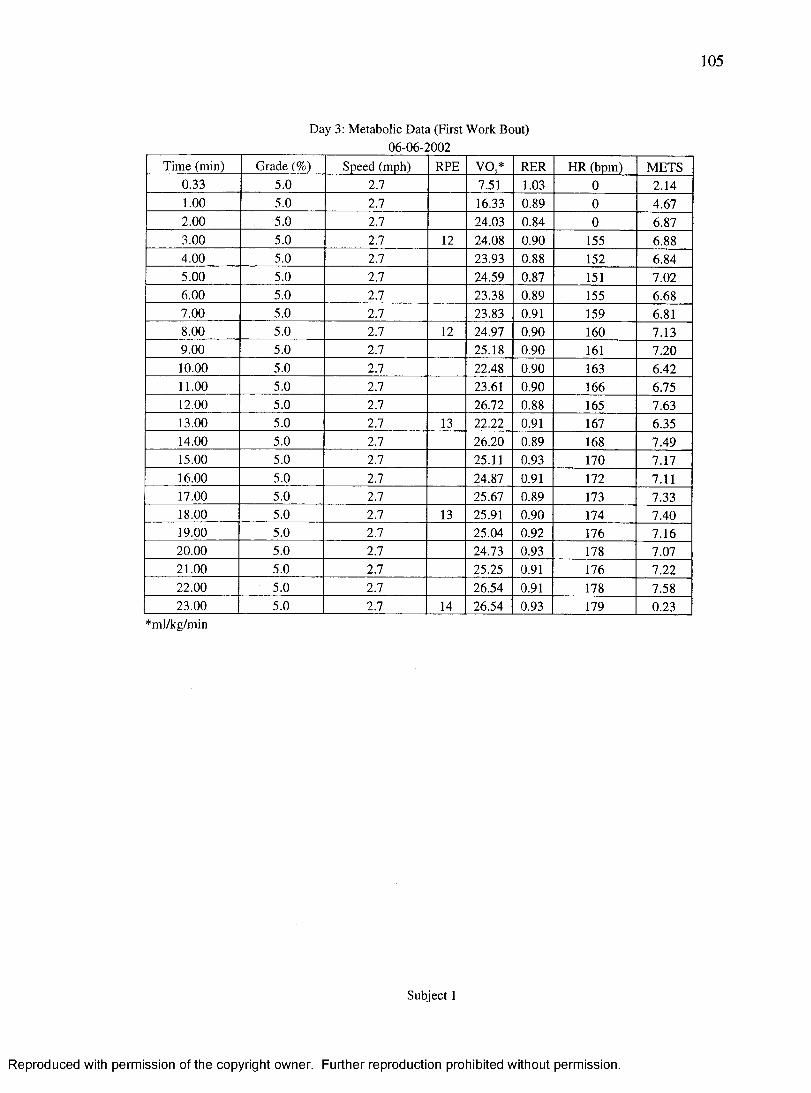
105
Day 3: Metabolic Data (First Work Bout)06-06-2002
Time (min) Grade (%) Speed (mph) RPE VO,* RER HR (bpm) METS0.33 5.0 2.7 7.51 1.03 0 2.141.00 5.0 2.7 16.33 0.89 0 4.672.00 5.0 2.7 24.03 0.84 0 6.873.00 5.0 2.7 12 24.08 0.90 155 6.884.00 5.0 2.7 23.93 0.88 152 6.845.00 5.0 2.7 24.59 0.87 151 7.026.00 5.0 2.7 23.38 0.89 155 6.687.00 5.0 2.7 23.83 0.91 159 6.818.00 5.0 2.7 12 24.97 0.90 160 7.139.00 5.0 2.7 25.18 0.90 161 7.2010.00 5.0 2.7 22.48 0.90 163 6.4211.00 5.0 2.7 23.61 0.90 166 6.7512.00 5.0 2.7 26.72 0.88 165 7.6313.00 5.0 2.7 13 22.22 0.91 167 6.3514.00 5.0 2.7 26.20 0.89 168 7.4915.00 5.0 2.7 25.11 0.93 170 7.1716.00 5.0 2.7 24.87 0.91 172 7.1117.00 5.0 2.7 25.67 0.89 173 7.3318.00 5.0 2.7 13 25.91 0.90 174 7.4019.00 5.0 2.7 25.04 0.92 176 7.1620.00 5.0 2.7 24.73 0.93 178 7.0721.00 5.0 2.7 25.25 0.91 176 7.2222.00 5.0 2.7 26.54 0.91 178 7.5823.00 5.0 2.7 14 26.54 0.93 179 0.23
•'ml/kg/min
Subject 1
Reproduced with permission of the copyright owner. Further reproduction prohibited without permission.
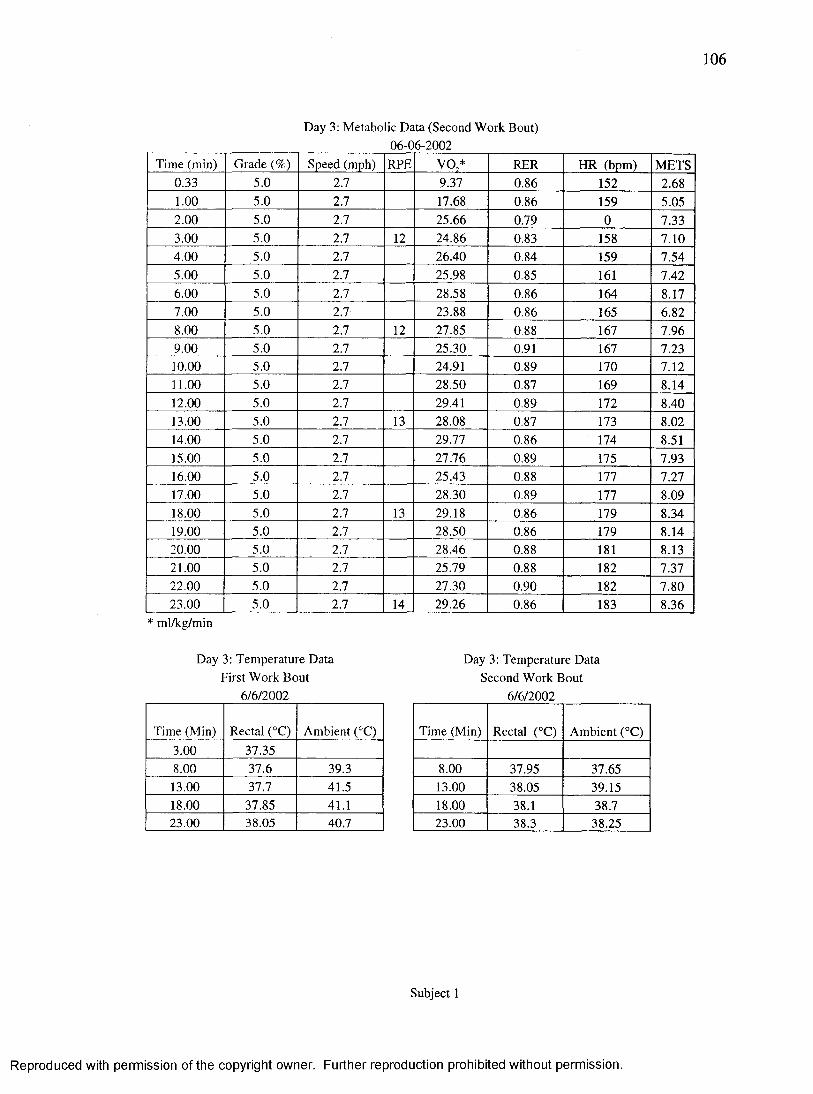
106
Day 3: Metabolic Data (Second Work Bout)06-06-2002
Time (min) Grade (%) Speed (mph) RPE VO,* RER HR (bpm) METS0.33 5.0 2.7 9.37 0.86 152 2.681.00 5.0 2.7 17.68 0.86 159 5.052.00 5.0 2.7 25.66 0,79 0 7.333.00 5.0 2.7 12 24.86 0.83 158 7.104.00 5.0 2.7 26.40 0.84 159 7.545.00 5.0 2.7 25.98 0.85 161 7.426.00 5.0 2.7 28.58 0.86 164 8.177.00 5.0 2.7 23.88 0.86 165 6.828.00 5.0 2.7 12 27.85 0.88 167 7.969.00 5.0 2.7 25.30 0.91 167 7.2310.00 5.0 2.7 24.91 0.89 170 7.1211.00 5.0 2.7 28.50 0.87 169 8.1412.00 5.0 2.7 29.41 0.89 172 8.4013.00 5.0 2.7 13 28.08 0.87 173 8.0214.00 5.0 2.7 29.77 0.86 174 8.5115.00 5.0 2.7 27.76 0.89 175 7.9316.00 5.0 2.7 25.43 0.88 177 7.2717.00 5.0 2.7 28.30 0.89 177 8.0918.00 5.0 2.7 13 29.18 0.86 179 8.3419.00 5.0 2.7 28.50 0.86 179 8.1420.00 5.0 2.7 28.46 0.88 181 8.1321.00 5.0 2.7 25.79 0.88 182 7.3722.00 5.0 2.7 27.30 0.90 182 7.8023.00 5.0 2.7 14 29.26 0.86 183 8.36
ml/kg/min
Day 3: Temperature Data First Work Bout
6/6/2002
Time (Min) Rectal (°C) Ambient (°C)3.00 37.358.00 37.6 39.313.00 37.7 41.518.00 37.85 41.123.00 38.05 40.7
Day 3: Temperature Data Second Work Bout
6/6/2002
Time (Min) Rectal (°C) Ambient (°C)
8.00 37.95 37.6513.00 38.05 39.1518.00 38.1 38.723.00 38.3 38.25
Subject 1
Reproduced with permission of the copyright owner. Further reproduction prohibited without permission.
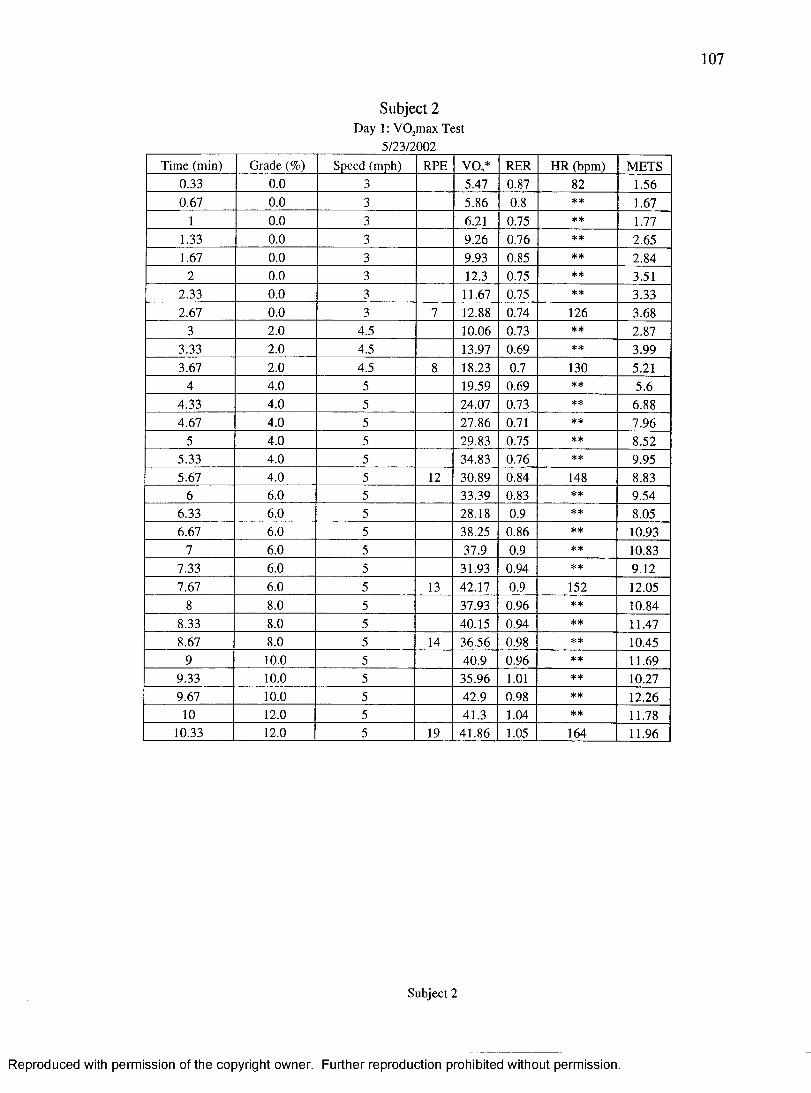
107
Subject 2Day 1: VO^max Test
5/23/2002Time (min) Grade (%) Speed (mph) RPE V O / RER HR (bpm) METS
0.33 0.0 3 5.47 0.87 82 1.560.67 0.0 3 5.86 0.8 ** 1.67
1 0.0 3 6.21 0.75 ** 1.771.33 0.0 3 9.26 0.76 ** 2.651.67 0.0 3 9.93 0.85 ** 2.84
2 0.0 3 12.3 0.75 ** 3.512.33 0.0 3 11.67 0.75 ** 3.332.67 0.0 3 7 12.88 0.74 126 3.68
3 2.0 4.5 10.06 0.73 ** 2.873.33 2.0 4.5 13.97 0.69 ** 3.993.67 2.0 4.5 8 18.23 0.7 130 5.21
4 4.0 5 19.59 0.69 ** 5.64.33 4.0 5 24.07 0.73 ** 6.884.67 4.0 5 27.86 0.71 ** 7.96
5 4.0 5 29.83 0.75 ** 8.525.33 4.0 5 34.83 0.76 ** 9.955.67 4.0 5 12 30.89 0.84 148 8.83
6 6.0 5 33.39 0.83 ** 9.546.33 6.0 5 28.18 0.9 ** 8.056.67 6.0 5 38.25 0.86 ** 10.93
7 6.0 5 37.9 0.9 ** 10.837.33 6.0 5 31.93 0.94 ** 9.127.67 6.0 5 13 42.17 0.9 152 12.05
8 8.0 5 37.93 0.96 ** 10.848.33 8.0 5 40.15 0.94 ** 11.478.67 8.0 5 14 36.56 0.98 ** 10.45
9 10.0 5 40.9 0.96 ** 11.699.33 10.0 5 35.96 1.01 ** 10.279.67 10.0 5 42.9 0.98 ** 12.2610 12.0 5 41.3 1.04 ** 11.78
10.33 12.0 5 19 41.86 1.05 164 11.96
Subject 2
Reproduced with permission of the copyright owner. Further reproduction prohibited without permission.
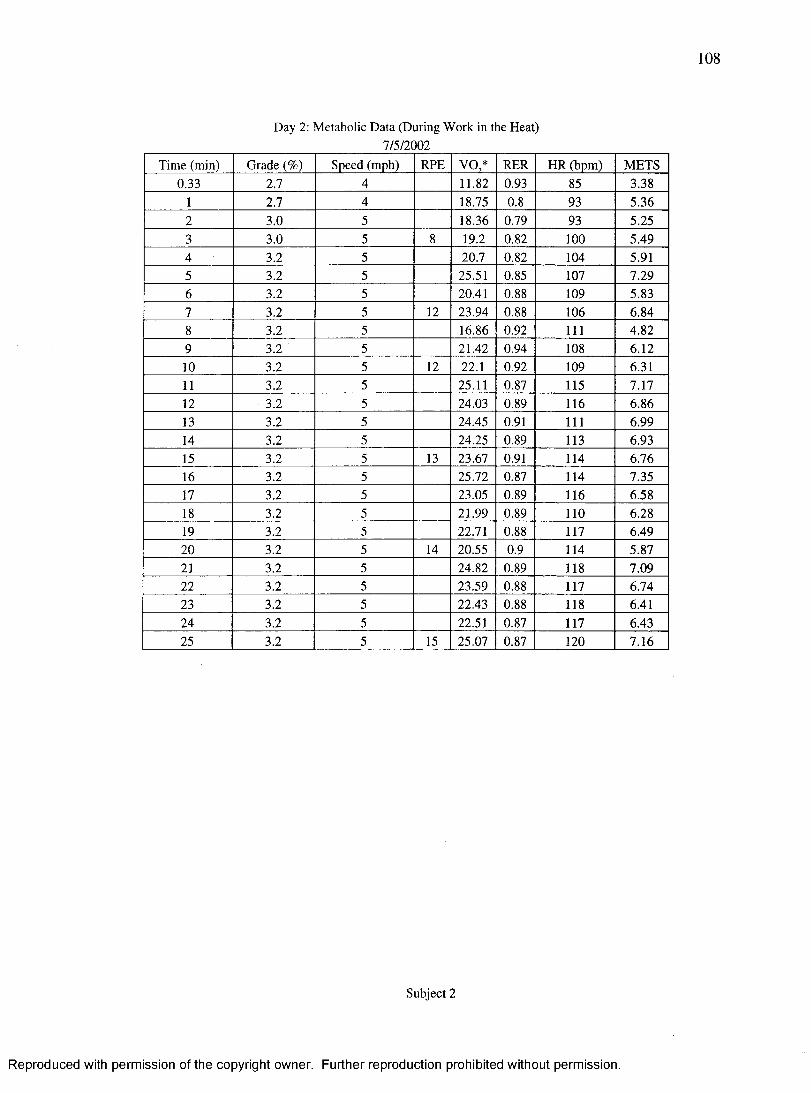
108
Day 2; Metabolic Data (During Work in the Heat)7/5/2002
Time (min) Grade (%) Speed (mph) RPE V O / RER HR (bpm) METS0.33 2.7 4 11.82 0.93 85 3.38
1 2.7 4 18.75 0.8 93 5.362 3.0 5 18.36 0.79 93 5.253 3.0 5 8 19.2 0.82 100 5.494 3.2 5 20.7 0.82 104 5.915 3.2 5 25.51 0.85 107 7.296 3.2 5 20.41 0.88 109 5.837 3.2 5 12 23.94 0.88 106 6.848 3.2 5 16.86 0.92 111 4.829 3.2 5 21.42 0.94 108 6.1210 3.2 5 12 22.1 0.92 109 6.3111 3.2 5 25.11 0.87 115 7.1712 3.2 5 24.03 0.89 116 6.8613 3.2 5 24.45 0.91 111 6.9914 3.2 5 24.25 0.89 113 6.9315 3.2 5 13 23.67 0.91 114 6.7616 3.2 5 25.72 0.87 114 7.3517 3.2 5 23.05 0.89 116 6.5818 3.2 5 21.99 0.89 110 6.2819 3.2 5 22.71 0.88 117 6.4920 3.2 5 14 20.55 0.9 114 5.8721 3.2 5 24.82 0.89 118 7.0922 3.2 5 23.59 0.88 117 6.7423 3.2 5 22.43 0.88 118 6.4124 3.2 5 22.51 0.87 117 6.4325 3.2 5 15 25.07 0.87 120 7.16
Subject 2
Reproduced with permission of the copyright owner. Further reproduction prohibited without permission.
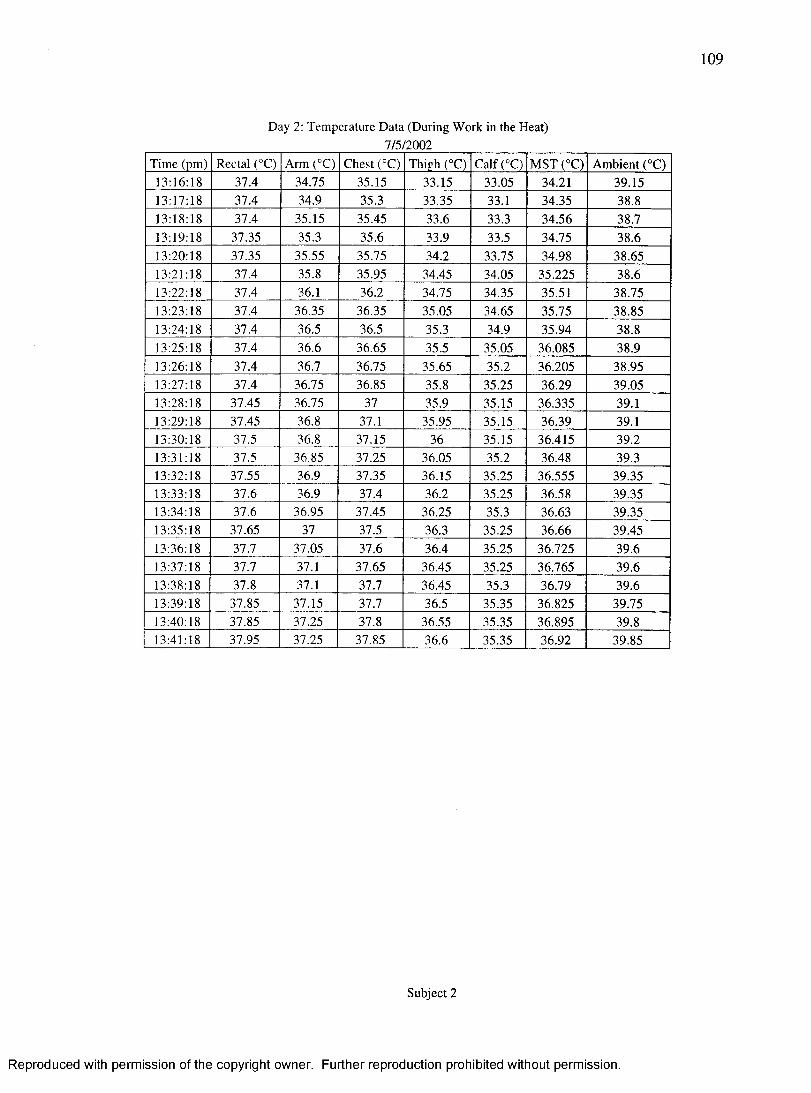
109
Day 2: Temperature Data (During Work in the Heat)7/5/2002
Time (pm) Rectal (°C) Arm C O Chest C O Thigh C O Calf CO MST CC) Ambient (°C)13:16 18 37.4 34.75 35.15 33.15 33.05 34.21 39.1513:17 18 37.4 34.9 35.3 33.35 33.1 34.35 38.813:18 18 37.4 35.15 35.45 33.6 33.3 34.56 38.713:19 18 37.35 35.3 35.6 33.9 33.5 34.75 38.613:20 18 37.35 35.55 35.75 34.2 33.75 34.98 38.6513:21 18 37.4 35.8 35.95 34.45 34.05 35.225 38.613:22 18 37.4 36.1 36.2 34.75 34.35 35.51 38.7513:23 18 37.4 36.35 36.35 35.05 34.65 35.75 38.8513:24 18 37.4 36.5 36.5 35.3 34.9 35.94 38.813:25 18 37.4 36.6 36.65 35.5 35.05 36.085 38.913:26 18 37.4 36.7 36.75 35.65 35.2 36.205 38.9513:27 18 37.4 36.75 36.85 35.8 35.25 36.29 39.0513:28 18 37.45 36.75 37 35.9 35.15 36.335 39.113:29 18 37.45 36.8 37.1 35.95 35.15 36.39 39.113:30 18 37.5 36.8 37.15 36 35.15 36.415 39.213:31 18 37.5 36.85 37.25 36.05 35.2 36.48 39.313:32 18 37.55 36.9 37.35 36.15 35.25 36.555 39.3513:33 18 37.6 36.9 37.4 36.2 35.25 36.58 39.3513:34 18 37.6 36.95 37.45 36.25 35.3 36.63 39.3513:35 18 37.65 37 37.5 36.3 35.25 36.66 39.4513:36 18 37.7 37.05 37.6 36.4 35.25 36.725 39.613:37 18 37.7 37.1 37.65 36.45 35.25 36.765 39.613:38 18 37.8 37.1 37.7 36.45 35.3 36.79 39.613:39 18 37.85 37.15 37.7 36.5 35.35 36.825 39.7513:40 18 37.85 37.25 37.8 36.55 35.35 36.895 39.813:41 18 37.95 37.25 37.85 36.6 35.35 36.92 39.85
Subject 2
Reproduced with permission of the copyright owner. Further reproduction prohibited without permission.
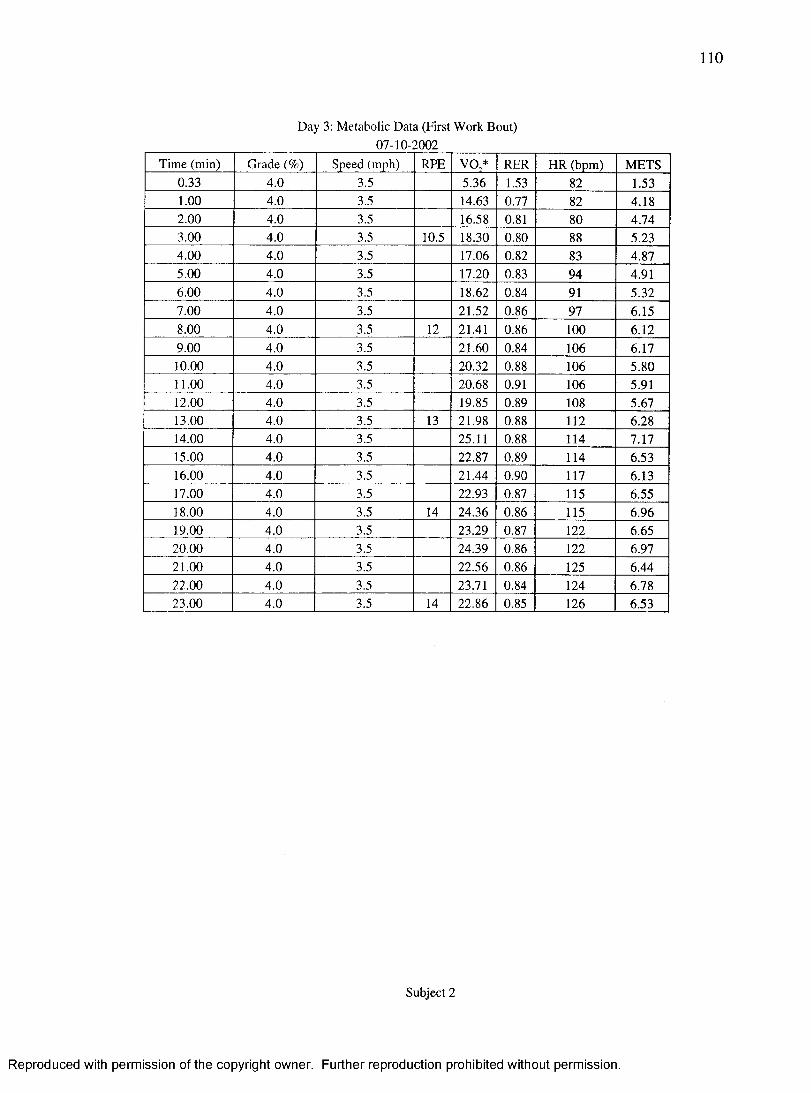
110
Day 3: Metabolic Data (First Work Bout)07-10-2002
Time (min) Grade (%) Speed (mph) RPE V O / RER HR (bpm) METS0.33 4.0 3.5 5.36 1.53 82 1.531.00 4.0 3.5 14.63 0.77 82 4.182.00 4.0 3.5 16.58 0.81 80 4.743.00 4.0 3.5 10.5 18.30 0.80 88 5.234.00 4.0 3.5 17.06 0.82 83 4.875.00 4.0 3.5 17.20 0.83 94 4.916.00 4.0 3.5 18.62 0.84 91 5.327.00 4.0 3.5 21.52 0.86 97 6.158.00 4.0 3.5 12 21.41 0.86 100 6.129.00 4.0 3.5 21.60 0.84 106 6.1710.00 4.0 3.5 20.32 0.88 106 5.8011.00 4.0 3.5 20.68 0.91 106 5.9112.00 4.0 3.5 19.85 0.89 108 5.6713.00 4.0 3.5 13 21.98 0.88 112 6.2814.00 4.0 3.5 25.11 0.88 114 7.1715.00 4.0 3.5 22.87 0.89 114 6.5316.00 4.0 3.5 21.44 0.90 117 6.1317.00 4.0 3.5 22.93 0.87 115 6.5518.00 4.0 3.5 14 24.36 0.86 115 6.9619.00 4.0 3.5 23.29 0.87 122 6.6520.00 4.0 3.5 24.39 0.86 122 6.9721.00 4.0 3.5 22.56 0.86 125 6.4422.00 4.0 3.5 23.71 0.84 124 6.7823.00 4.0 3.5 14 22.86 0.85 126 6.53
Subject 2
Reproduced with permission of the copyright owner. Further reproduction prohibited without permission.
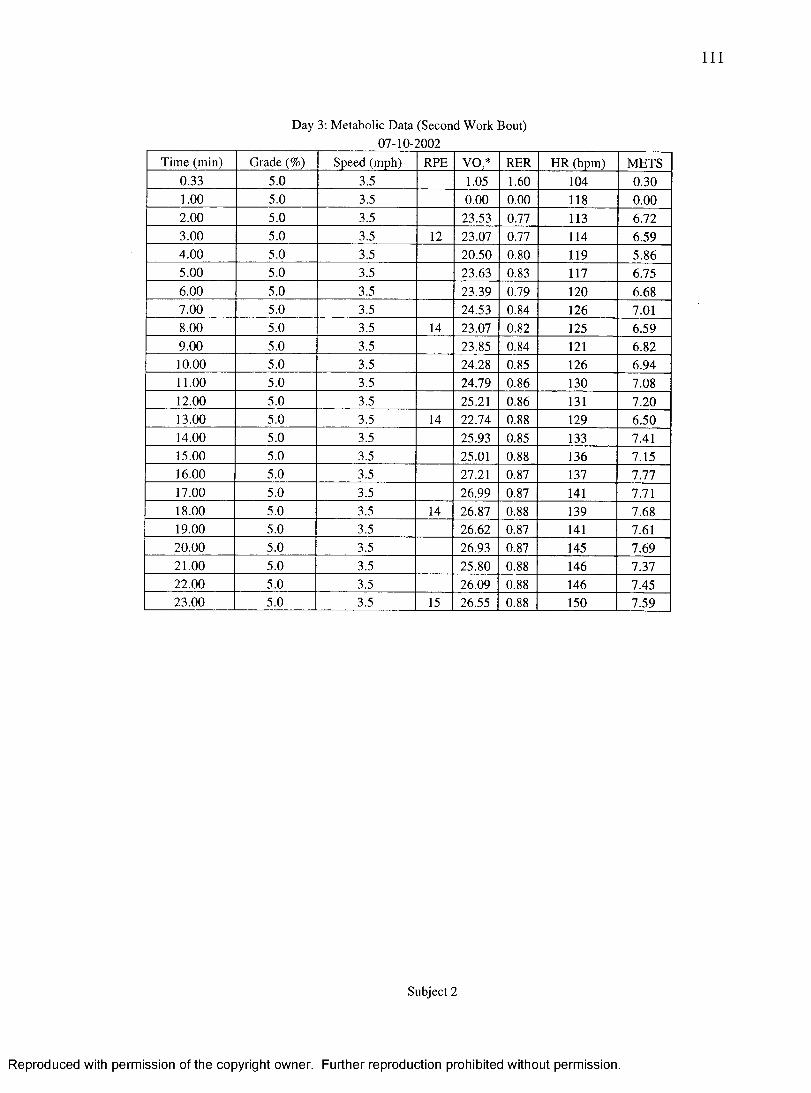
I l l
Day 3: Metabolic Data (Second Work Bout)07-10-2002
Time (min) Grade (%) Speed (mph) RPE V O / RER HR (bpm) METS0.33 5.0 3.5 1.05 1.60 104 0.301.00 5.0 3.5 0.00 0.00 118 0.002.00 5.0 3.5 23.53 0.77 113 6.723.00 5.0 3.5 12 23.07 0.77 114 6.594.00 5.0 3.5 20.50 0.80 119 5.865.00 5.0 3.5 23.63 0.83 117 6.756.00 5.0 3.5 23.39 0.79 120 6.687.00 5.0 3.5 24.53 0.84 126 7.018.00 5.0 3.5 14 23.07 0.82 125 6.599.00 5.0 3.5 23.85 0.84 121 6.8210.00 5.0 3.5 24.28 0.85 126 6.9411.00 5.0 3.5 24.79 0.86 130 7.0812.00 5.0 3.5 25.21 0.86 131 7.2013.00 5.0 3.5 14 22.74 0.88 129 6.5014.00 5.0 3.5 25.93 0.85 133 7.4115.00 5.0 3.5 25.01 0.88 136 7.1516.00 5.0 3.5 27.21 0.87 137 7.7717.00 5.0 3.5 26.99 0.87 141 7.7118.00 5.0 3.5 14 26.87 0.88 139 7.6819.00 5.0 3.5 26.62 0.87 141 7.6120.00 5.0 3.5 26.93 0.87 145 7.6921.00 5.0 3.5 25.80 0.88 146 7.3722.00 5.0 3.5 26.09 0.88 146 7.4523.00 5.0 3.5 15 26.55 0.88 150 7.59
Subject 2
Reproduced with permission of the copyright owner. Further reproduction prohibited without permission.
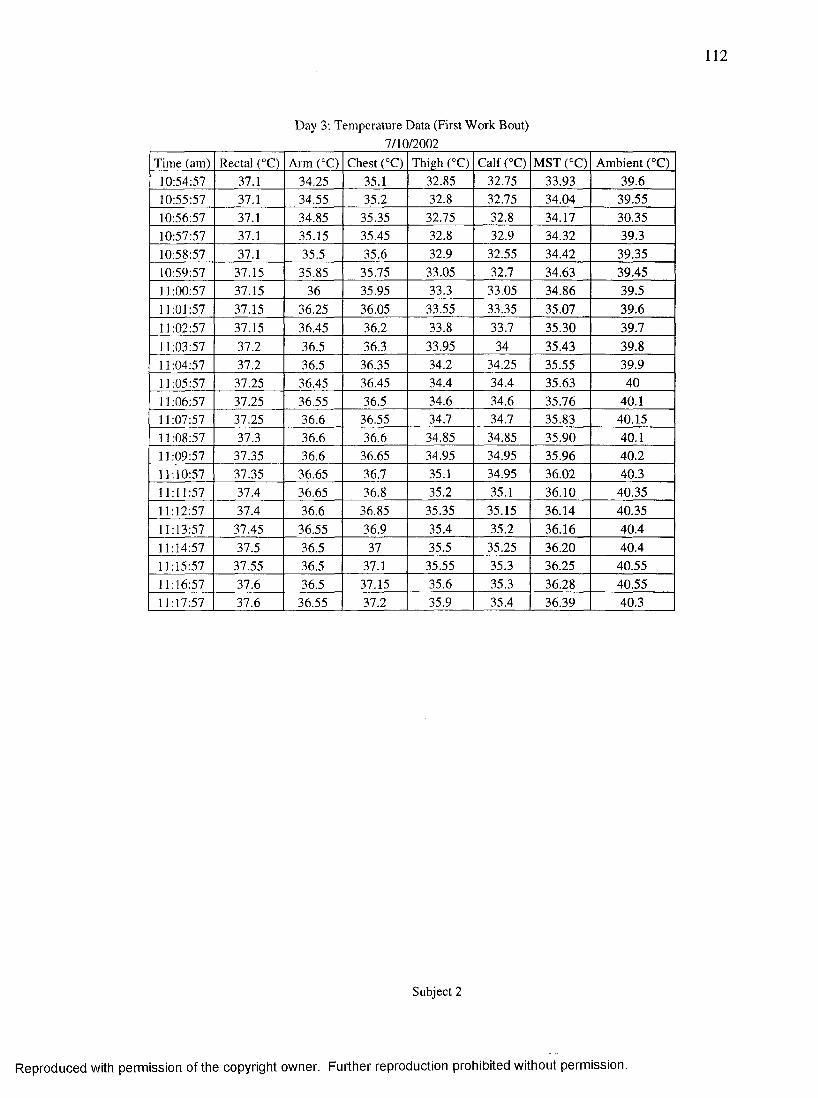
112
Day 3; Temperature Data (First Work Bout)7/10/2002
Time (am) Rectal (°C) Arm CC) Chest CC) Thigh C O Calf C O MST C O Ambient (°C)10:54:57 37.1 34.25 35.1 32.85 32.75 33.93 39.610:55:57 37.1 34.55 35.2 32.8 32.75 34.04 39.5510:56:57 37.1 34.85 35.35 32.75 32.8 34.17 30.3510:57:57 37.1 35.15 35.45 32.8 32.9 34.32 39.310:58:57 37.1 35.5 35.6 32.9 32.55 34.42 39.3510:59:57 37.15 35.85 35.75 33.05 32.7 34.63 39.4511:00:57 37.15 36 35.95 33.3 33.05 34.86 39.511:01:57 37.15 36.25 36.05 33.55 33.35 35.07 39.611:02:57 37.15 36.45 36.2 33.8 33.7 35.30 39.711:03:57 37.2 36.5 36.3 33.95 34 35.43 39.811:04:57 37.2 36.5 36.35 34.2 34.25 35.55 39.911:05:57 37.25 36.45 36.45 34.4 34.4 35.63 4011:06:57 37.25 36.55 36.5 34.6 34.6 35.76 40.111:07:57 37.25 36.6 36.55 34.7 34.7 35.83 40.1511:08:57 37.3 36.6 36.6 34.85 34.85 35.90 40.111:09:57 37.35 36.6 36.65 34.95 34.95 35.96 40.211:10:57 37.35 36.65 36.7 35.1 34.95 36.02 40.311:11:57 37.4 36.65 36.8 35.2 35.1 36.10 40.3511:12:57 37.4 36.6 36.85 35.35 35.15 36.14 40.3511:13:57 37.45 36.55 36.9 35.4 35.2 36.16 40.411:14:57 37.5 36.5 37 35.5 35.25 36.20 40.411:15:57 37.55 36.5 37.1 35.55 35.3 36.25 40.5511:16:57 37.6 36.5 37.15 35.6 35.3 36.28 40.5511:17:57 37.6 36.55 37.2 35.9 35.4 36.39 40.3
Subject 2
Reproduced with permission of the copyright owner. Further reproduction prohibited without permission.
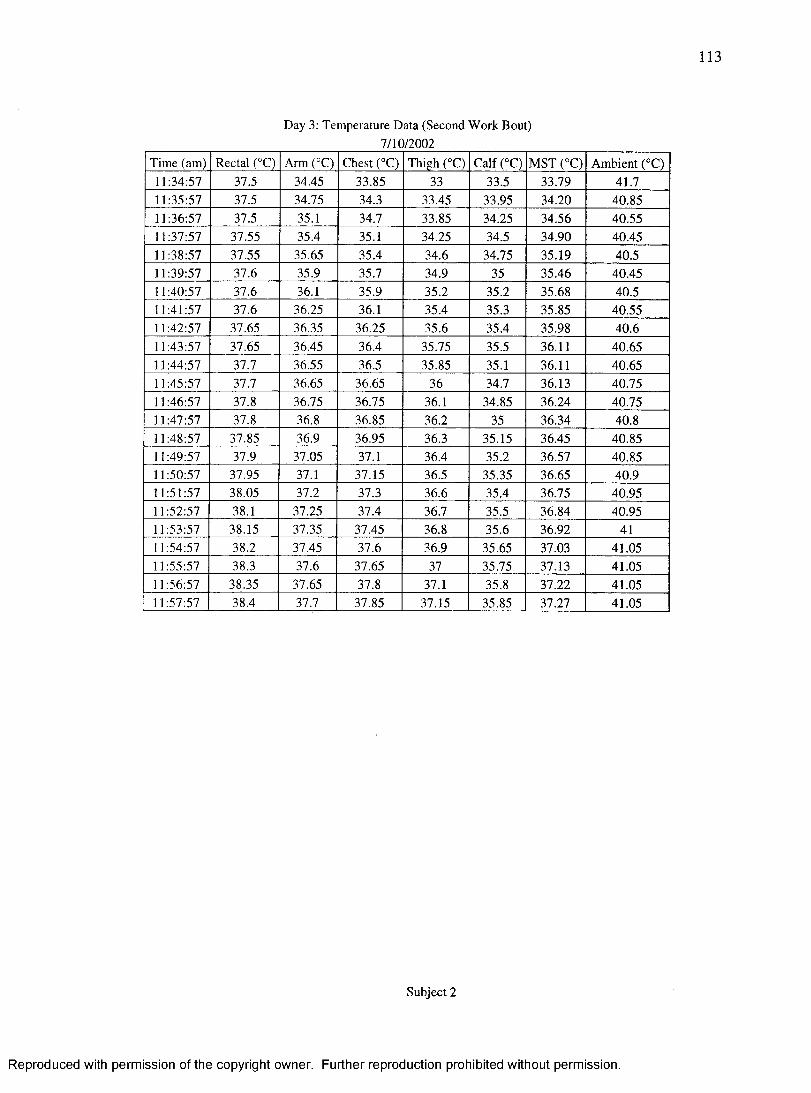
113
Day 3: Temperature Data (Second Work Bout)7/10/2002
Time (am) Rectal CC) ArmCC) Chest C O Thigh C O CalfCC) MST C O Ambient (°C)11:34:57 37.5 34.45 33.85 33 33.5 33.79 41.711:35:57 37.5 34.75 34.3 33.45 33.95 34.20 40.8511:36:57 37.5 35.1 34.7 33.85 34.25 34.56 40.5511:37:57 37.55 35.4 35.1 34.25 34.5 34.90 40.4511:38:57 37.55 35.65 35.4 34.6 34.75 35.19 40.511:39:57 37.6 35.9 35.7 34.9 35 35.46 40.4511:40:57 37.6 36.1 35.9 35.2 35.2 35.68 40.511:41:57 37.6 36.25 36.1 35.4 35.3 35.85 40.5511:42:57 37.65 36.35 36.25 35.6 35.4 35.98 40.611:43:57 37.65 36.45 36.4 35.75 35.5 36.11 40.6511:44:57 37.7 36.55 36.5 35.85 35.1 36.11 40.6511:45:57 37.7 36.65 36.65 36 34.7 36.13 40.7511:46:57 37.8 36.75 36.75 36.1 34.85 36.24 40.7511:47:57 37.8 36.8 36.85 36.2 35 36.34 40.811:48:57 37.85 36.9 36.95 36.3 35.15 36.45 40.8511:49:57 37.9 37.05 37.1 36.4 35.2 36.57 40.8511:50:57 37.95 37.1 37.15 36.5 35.35 36.65 40.911:51:57 38.05 37.2 37.3 36.6 35.4 36.75 40.9511:52:57 38.1 37.25 37.4 36.7 35.5 36.84 40.9511:53:57 38.15 37.35 37.45 36.8 35.6 36.92 4111:54:57 38.2 37.45 37.6 36.9 35.65 37.03 41.0511:55:57 38.3 37.6 37.65 37 35.75 37.13 41.0511:56:57 38.35 37.65 37.8 37.1 35.8 37.22 41.0511:57:57 38.4 37.7 37.85 37.15 35.85 37.27 41.05
Subject 2
Reproduced with permission of the copyright owner. Further reproduction prohibited without permission.
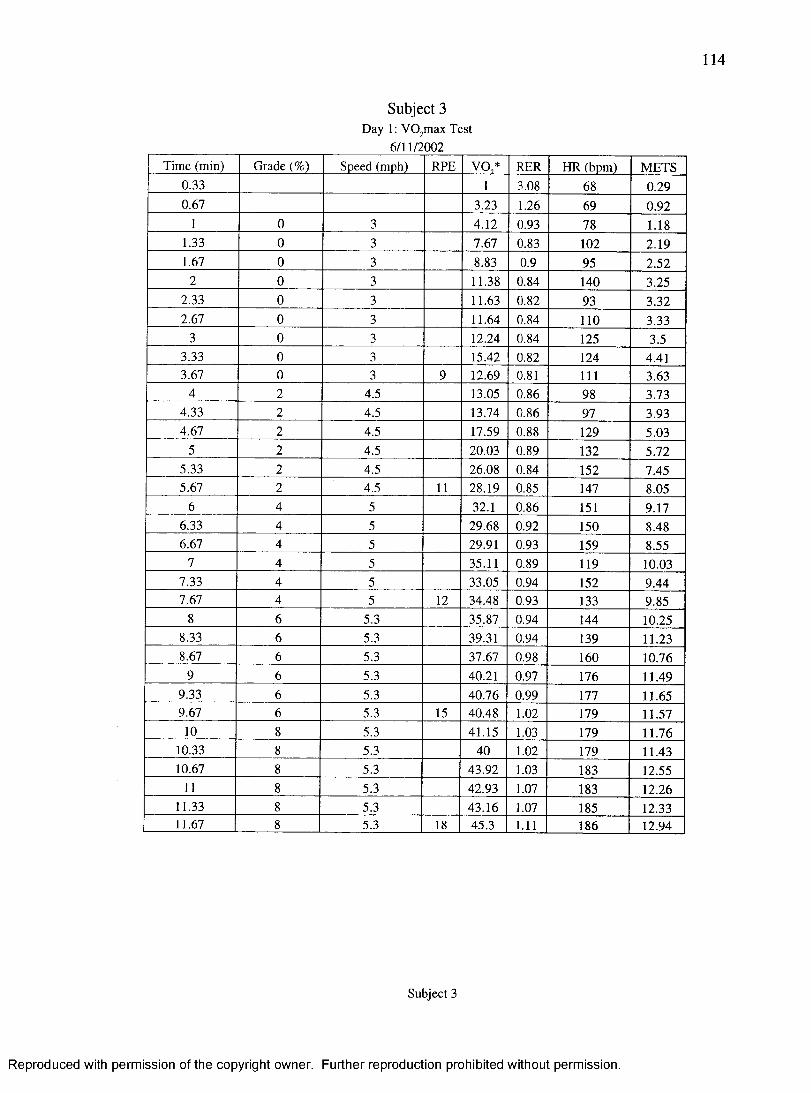
114
Subject 3Day 1: VO^max Test
6/11/2002Time (min) Grade (%) Speed (mph) RPE V O / RER HR (bpm) METS
0.33 1 3.08 68 0.290.67 3.23 1.26 69 0.92
1 0 3 4.12 0.93 78 1.181.33 0 3 7.67 0.83 102 2.191.67 0 3 8.83 0.9 95 2.52
2 0 3 11.38 0.84 140 3.252.33 0 3 11.63 0.82 93 3.322.67 0 3 11.64 0.84 110 3.33
3 0 3 12.24 0.84 125 3.53.33 0 3 15.42 0.82 124 4.413.67 0 3 9 12.69 0.81 111 3.63
4 2 4.5 13.05 0.86 98 3.734.33 2 4.5 13.74 0.86 97 3.934.67 2 4.5 17.59 0.88 129 5.03
5 2 4.5 20.03 0.89 132 5.725.33 2 4.5 26.08 0.84 152 7.455.67 2 4.5 11 28.19 0.85 147 8.05
6 4 5 32.1 0.86 151 9.176.33 4 5 29.68 0.92 150 8.486.67 4 5 29.91 0.93 159 8.55
7 4 5 35.11 0.89 119 10.037.33 4 5 33.05 0.94 152 9.447.67 4 5 12 34.48 0.93 133 9.85
8 6 5.3 35.87 0.94 144 10.258.33 6 5.3 39.31 0.94 139 11.238.67 6 5.3 37.67 0.98 160 10.76
9 6 5.3 40.21 0.97 176 11.499.33 6 5.3 40.76 0.99 177 11.659.67 6 5.3 15 40.48 1.02 179 11.57
10 8 5.3 41.15 1.03 179 11.7610.33 8 5.3 40 1.02 179 11.4310.67 8 5.3 43.92 1.03 183 12.55
11 8 5.3 42.93 1.07 183 12.2611.33 8 5.3 43.16 1.07 185 12.3311.67 8 5.3 18 45.3 1.11 186 12.94
Subject 3
Reproduced with permission of the copyright owner. Further reproduction prohibited without permission.
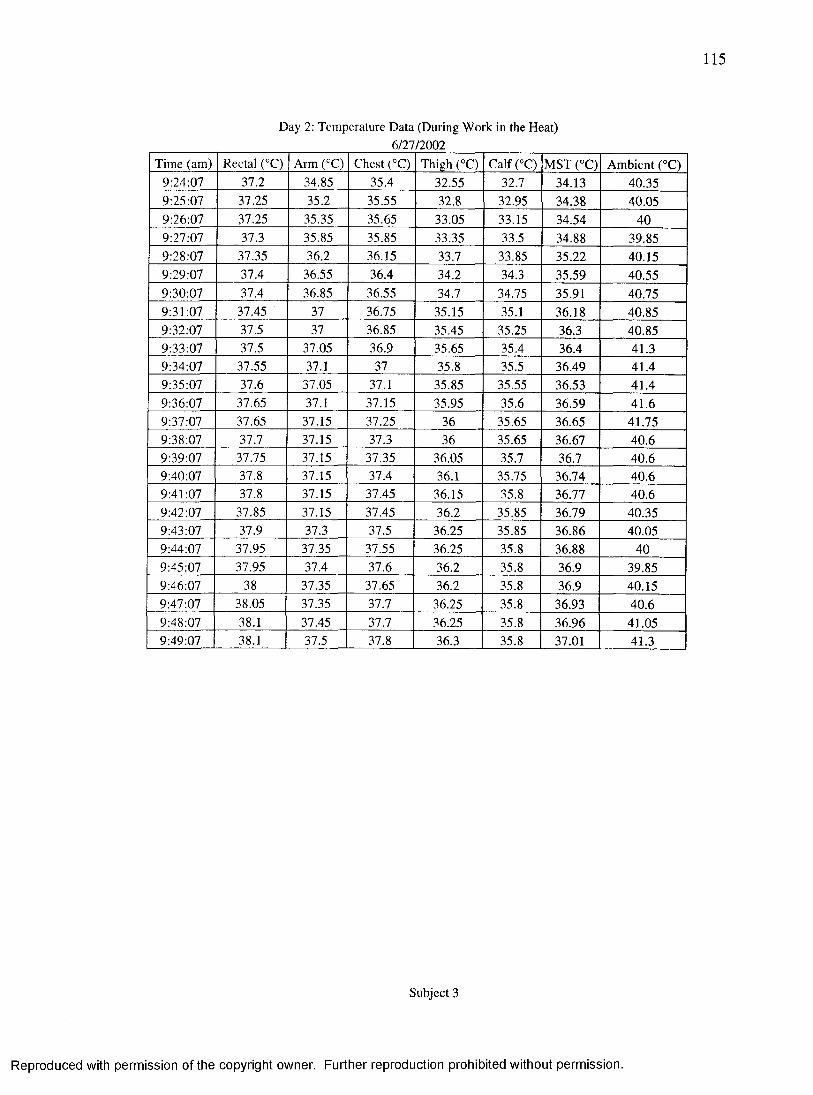
115
Day 2: Temperature Data (During Work in the Heat)6/27/2002
Time (am) Rectal (°C) Arm C O Chest C O Thigh C O CalfCC) MST CC) Ambient (°C)9:24:07 37.2 34.85 35.4 32.55 32.7 34.13 40.359:25:07 37.25 35.2 35.55 32.8 32.95 34.38 40.059:26:07 37.25 35.35 35.65 33.05 33.15 34.54 409:27:07 37.3 35.85 35.85 33.35 33.5 34.88 39.859:28:07 37.35 36.2 36.15 33.7 33.85 35.22 40.159:29:07 37.4 36.55 36.4 34.2 34.3 35.59 40.559:30:07 37.4 36.85 36.55 34.7 34.75 35.91 40.759:31:07 37.45 37 36.75 35.15 35.1 36.18 40.859:32:07 37.5 37 36.85 35.45 35.25 36.3 40.859:33:07 37.5 37.05 36.9 35.65 35.4 36.4 41.39:34:07 37.55 37.1 37 35.8 35.5 36.49 41.49:35:07 37.6 37.05 37.1 35.85 35.55 36.53 41.49:36:07 37.65 37.1 37.15 35.95 35.6 36.59 41.69:37:07 37.65 37.15 37.25 36 35.65 36.65 41.759:38:07 37.7 37.15 37.3 36 35.65 36.67 40.69:39:07 37.75 37.15 37.35 36.05 35.7 36.7 40.69:40:07 37.8 37.15 37.4 36.1 35.75 36.74 40.69:41:07 37.8 37.15 37.45 36.15 35.8 36.77 40.69:42:07 37.85 37.15 37.45 36.2 35.85 36.79 40.359:43:07 37.9 37.3 37.5 36.25 35.85 36.86 40.059:44:07 37.95 37.35 37.55 36.25 35.8 36.88 409:45:07 37.95 37.4 37.6 36.2 35.8 36.9 39.859:46:07 38 37.35 37.65 36.2 35.8 36.9 40.159:47:07 38.05 37.35 37.7 36.25 35.8 36.93 40.69:48:07 38.1 37.45 37.7 36.25 35.8 36.96 41.059:49:07 38.1 37.5 37.8 36.3 35.8 37.01 41.3
Subject 3
Reproduced with permission of the copyright owner. Further reproduction prohibited without permission.
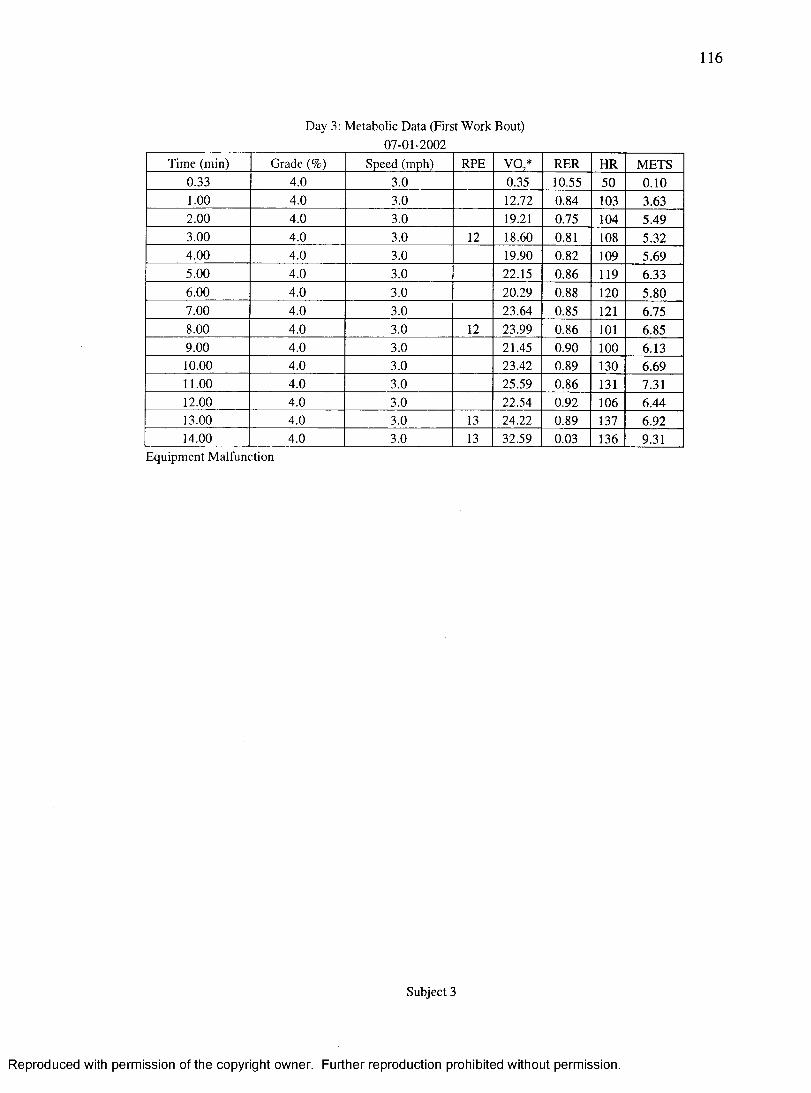
116
Day 3: Metabolic Data (First Work07-01-2002
Bout)
Time (min) Grade (%) Speed (mph) RPE V O / RER HR METS0.33 4.0 3.0 0.35 10.55 50 0.101.00 4.0 3.0 12.72 0.84 103 3.632.00 4.0 3.0 19.21 0.75 104 5.493.00 4.0 3.0 12 18.60 0.81 108 5.324.00 4.0 3.0 19.90 0.82 109 5.695.00 4.0 3.0 22.15 0.86 119 6.336.00 4.0 3.0 20.29 &88 120 5.807.00 4.0 3.0 23.64 0.85 121 6.758.00 4.0 3.0 12 2349 0.86 101 6.859.00 4.0 3.0 21.45 0.90 100 6.1310.00 4.0 3.0 23.42 0.89 130 6.6911.00 4.0 3.0 25.59 0.86 131 7.3112.00 4.0 3.0 2254 0.92 106 6.4413.00 4.0 3.0 13 24.22 0.89 137 6.9214.00 4.0 3.0 13 3259 0.03 136 9.31
Equipment Malfunction
Subject 3
Reproduced with permission of the copyright owner. Further reproduction prohibited without permission.
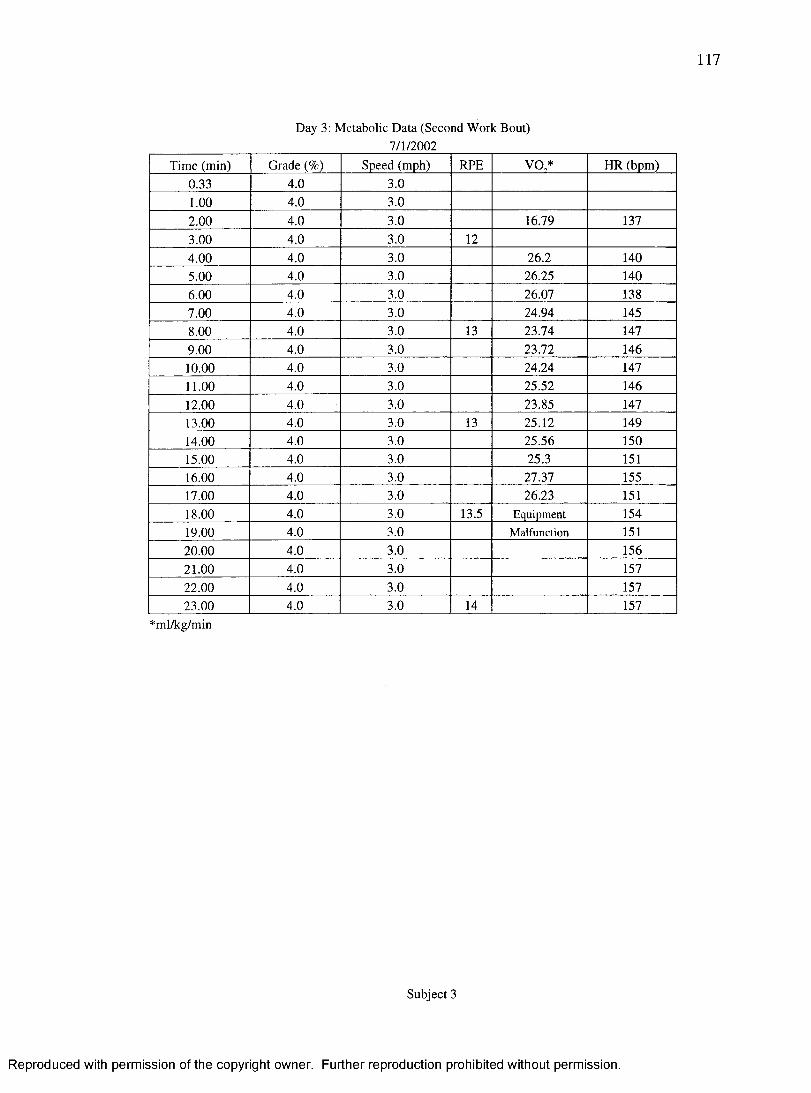
117
Day 3: Metabolic Data (Second Work Bout)7/1/2002
Time (min) Grade (%) Speed (mph) RPE V O / HR (bpm)0.33 4.0 3.01.00 4.0 3.02.00 4.0 3.0 16.79 1373.00 4.0 3.0 124.00 4.0 3.0 2&2 1405.00 4.0 3.0 26J5 1406.00 4.0 3.0 26.07 1387.00 4.0 3.0 24.94 1458.00 4.0 3.0 13 23.74 1479.00 4.0 3.0 23.72 14610.00 4.0 3.0 24.24 14711.00 4.0 3.0 25.52 14612.00 4.0 3.0 23.85 14713.00 4.0 3.0 13 25.12 14914.00 4.0 3.0 25.56 15015.00 4.0 3.0 25.3 15116.00 4.0 3.0 27.37 15517.00 4.0 3.0 2&23 15118.00 4.0 3.0 13.5 Equipment 15419.00 4.0 3.0 Malfunction 15120.00 4.0 3.0 15621.00 4.0 3.0 15722.00 4.0 3.0 15723.00 4.0 3.0 14 157
*ml/kg/min
Subject 3
Reproduced with permission of the copyright owner. Further reproduction prohibited without permission.
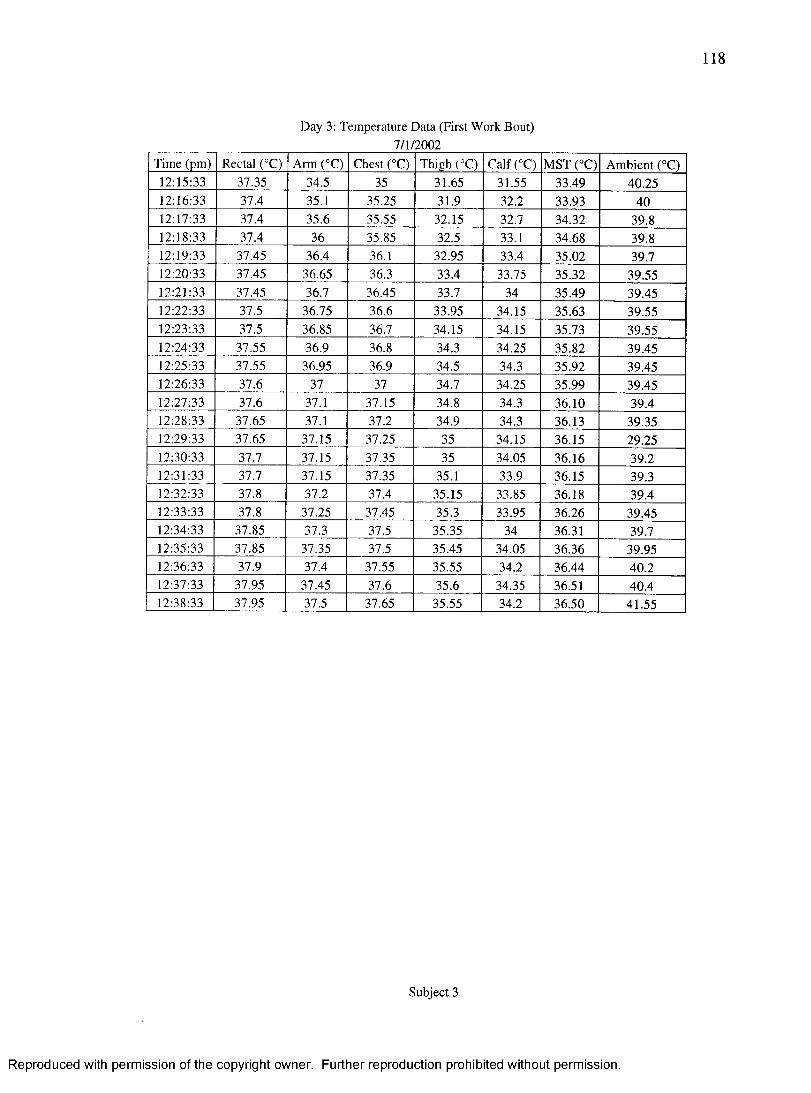
118
Day 3: Temperature Data (First Work Bout)7/1/2002
Time (pm) Rectal (°C) Arm (°C) Chest (®C) Thigh (°C) Calf (°C) MST (°C) Ambient (°C)12:15:33 3T35 34.5 35 31.65 31.55 33.49 40.2512:16:33 37.4 35.1 35^5 31.9 322 3393 4012:17:33 37.4 35.6 35.55 32.15 32.7 34.32 39.812:18:33 37.4 36 35.85 323 33.1 34.68 39912:19:33 37.45 3&4 36.1 3295 324 35.02 39.712:20:33 3T45 36 65 363 33.4 33.75 35.32 39.5512:21:33 37.45 36.7 36.45 333 34 35.49 39.4512:22:33 37.5 36.75 366 33.95 34.15 35.63 39.5512:23:33 37.5 36.85 367 34.15 34.15 35.73 39.5512:24:33 37.55 369 368 343 34.25 35.82 39.4512:25:33 37.55 36.95 369 34.5 343 3592 39.4512:26:33 3T6 37 37 34.7 3435 35.99 39.4512:27:33 37.6 37.1 37.15 343 34.3 36.10 39.412:28:33 37.65 37.1 373 34.9 343 36.13 39.3512:29:33 37.65 37.15 3735 35 34.15 36.15 29.2512:30:33 37.7 37.15 3735 35 3495 36.16 39.212:31:33 3T7 37.15 3735 35.1 339 36.15 39.312:32:33 3T8 37.2 37.4 35.15 3285 36.18 39.412:33:33 3T8 37.25 37.45 35.3 3395 36.26 39.4512:34:33 3T85 37.3 37.5 3535 34 36.31 39.712:35:33 3T85 3T35 37.5 35.45 34.05 3636 39.9512:36:33 37.9 37.4 37.55 35.55 343 36.44 40.212:37:33 37.95 37.45 37.6 35.6 3435 36.51 40.412:38:33 37.95 37.5 37.65 35.55 34.2 36.50 41.55
Subject 3
Reproduced with permission of the copyright owner. Further reproduction prohibited without permission.
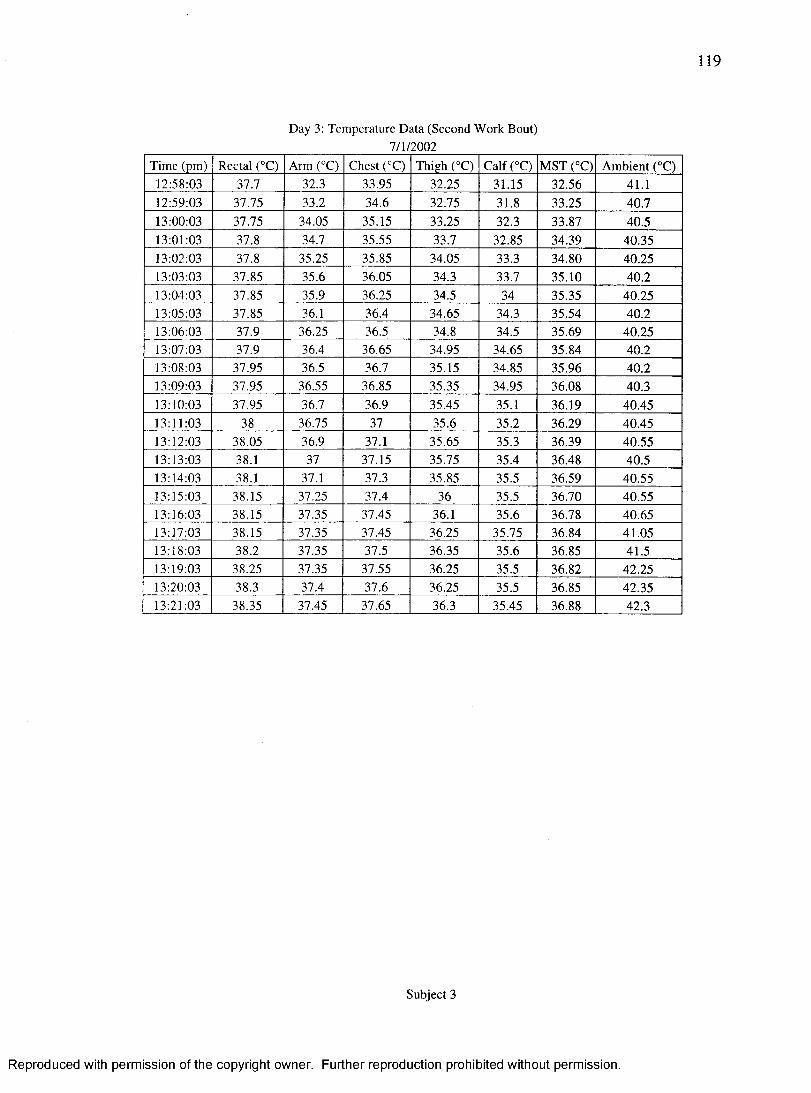
119
Day 3; Temperature Data (Second Work Bout)7/1/2002
Time (pm) Rectal (°C) Arm (°C) Chest (°C) Thigh C O CalfCC) MST (°C) Ambient (°C)12:58:03 37.7 323 3395 3225 31.15 32.56 41.112:59:03 37.75 322 34.6 3275 31.8 33.25 40.713:00:03 37.75 34.05 35.15 33.25 323 33.87 40.513:01:03 379 34.7 35.55 327 3295 34.39 40.3513:02:03 379 35.25 3595 34.05 323 34.80 40.2513:03:03 3795 326 36.05 349 33.7 35.10 40.213:04:03 3795 359 36.25 34.5 34 35.35 40.2513:05:03 3795 36.1 364 34.65 349 35.54 40.213:06:03 379 3625 365 34.8 34.5 35.69 40.2513:07:03 379 364 36.65 34.95 34.65 35.84 40.213:08:03 37.95 365 36.7 35.15 34.85 35.96 40.213:09:03 37.95 36.55 3695 3235 3495 36.08 40.313:10:03 37.95 367 369 35.45 35.1 36.19 40.4513:11:03 38 36.75 37 35.6 35.2 36.29 40.4513:12:03 3895 369 37.1 35.65 359 3699 40.5513:13:03 321 37 37.15 35.75 35.4 36.48 40.513:14:03 38.1 37.1 323 3595 35.5 36.59 40.5513:15:03 3815 37.25 37.4 36 35.5 36.70 40.5513:16:03 3815 37.35 37.45 36.1 35.6 36.78 40.6513:17:03 38.15 37.35 37.45 36.25 35.75 36.84 41.0513:18:03 322 37.35 37.5 36.35 326 36.85 41.513:19:03 3225 37.35 37.55 36.25 35.5 36.82 42.2513:20:03 323 37.4 37.6 3695 35.5 36.85 42.3513:21:03 3235 37.45 37.65 363 35.45 36.88 429
Subject 3
Reproduced with permission of the copyright owner. Further reproduction prohibited without permission.
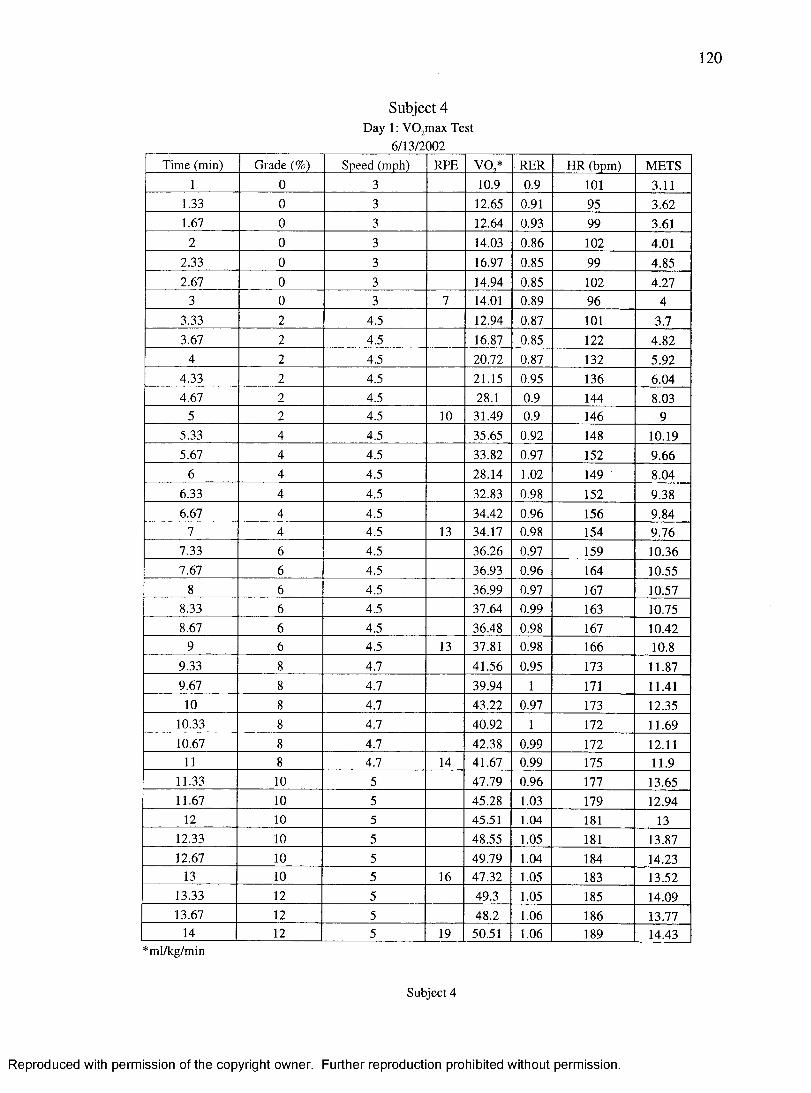
120
Subject 4Day 1: VO^max Test
6/13/2002Time (min) Grade (%) Speed (mph) RPE V O / RER HR (bpm) METS
1 0 3 10.9 0.9 101 3.11133 0 3 12.65 0.91 95 3.621.67 0 3 12.64 0.93 99 3.61
2 0 3 14.03 0.86 102 4.01233 0 3 16.97 0.85 99 4.852.67 0 3 14.94 095 102 4.27
3 0 3 7 14.01 0.89 96 4393 2 4.5 12.94 0.87 101 3.73.67 2 4.5 16.87 095 122
4 2 4.5 20.72 0.87 132 5.92493 2 4.5 21.15 0.95 136 6.044.67 2 4.5 28.1 0.9 144 843
5 2 4.5 10 31.49 0.9 146 9593 4 4.5 35.65 0.92 148 10.195.67 4 4.5 3392 0.97 152 9.66
6 4 4.5 2894 1.02 149 8.04693 4 4.5 32.83 098 152 9386.67 4 4.5 34.42 0.96 156 9.84
7 4 4.5 13 34.17 048 154 9.767.33 6 4.5 36.26 0.97 159 10.367.67 6 4.5 36.93 046 164 10.55
8 6 4.5 3 6 % 0.97 167 10.57893 6 4.5 37.64 0.99 163 10.758.67 6 4.5 36.48 048 167 10.42
9 6 4.5 13 37.81 048 166 10.8993 8 4.7 41.56 0.95 173 11.879.67 8 4.7 39.94 1 171 11.4110 8 4.7 43.22 0.97 173 12.35
10.33 8 4.7 40.92 1 172 11.6910.67 8 4.7 42.38 0.99 172 12.11
11 8 4.7 14 41.67 0.99 175 11.911.33 10 5 47.79 0.96 177 13.6511.67 10 5 45.28 1.03 179 12.94
12 10 5 45.51 1.04 181 1312.33 10 5 48.55 1.05 181 13.8712.67 10 5 49.79 1.04 184 14.23
13 10 5 16 47.32 1.05 183 13.5213.33 12 5 49.3 1.05 185 14.0913.67 12 5 48.2 1.06 186 13.77
14 12 5 19 50.51 1.06 189 14.43*ml/kg/min
Subject 4
Reproduced with permission of the copyright owner. Further reproduction prohibited without permission.
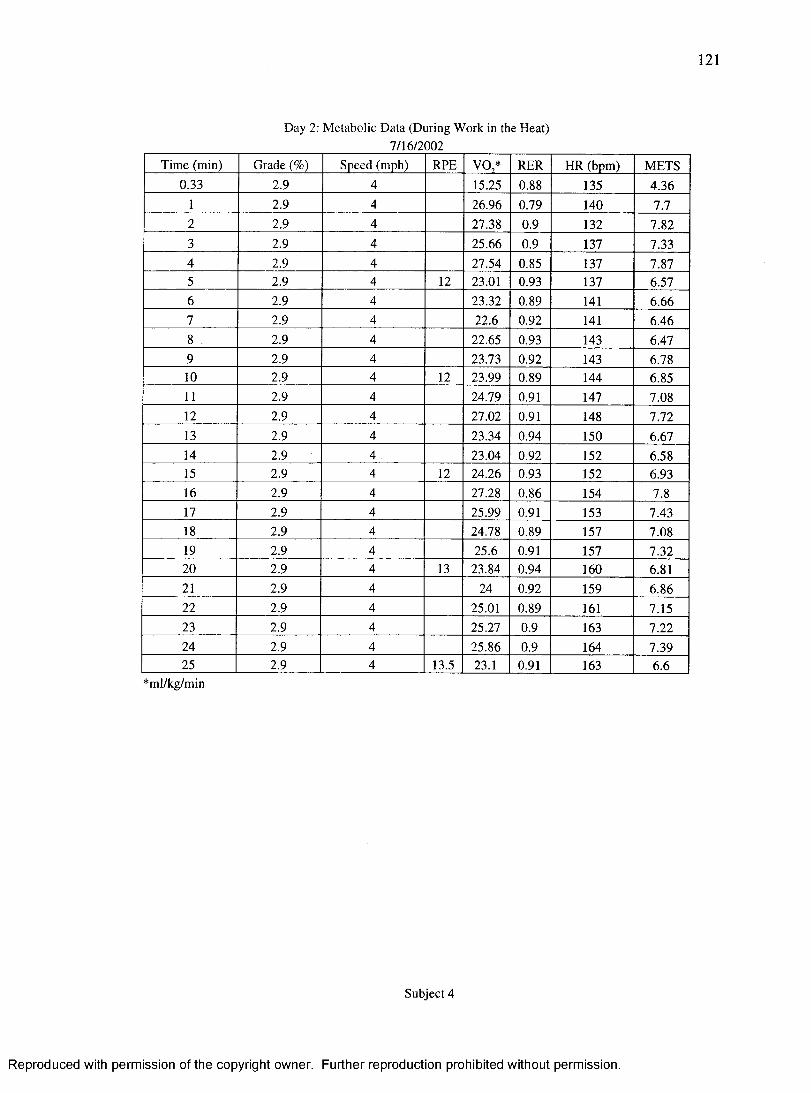
121
Day 2; Metabolic Data (During Work in the Heat)7/16/2002
Time (min) Grade (%) Speed (mph) RPE V O / RER HR (bpm) METS033 2.9 4 15.25 0 88 135 4.36
1 2.9 4 26.96 0.79 140 7.72 2.9 4 27.38 0.9 132 7.823 2.9 4 25.66 0.9 137 7.334 2.9 4 27.54 0.85 137 7.875 2.9 4 12 23.01 0.93 137 6.576 2.9 4 23.32 0.89 141 6.667 2.9 4 226 0.92 141 6.468 2.9 4 22.65 0.93 143 6.479 2.9 4 23.73 0.92 143 6.7810 2.9 4 12 22% 089 144 6.8511 2.9 4 24.79 0.91 147 7.0812 2.9 4 27.02 0.91 148 7.7213 2.9 4 22M 0.94 150 6.6714 2.9 4 23.04 0.92 152 6.5815 2.9 4 12 24.26 033 152 6.9316 2.9 4 27.28 0.86 154 7.817 2.9 4 2299 0.91 153 7.4318 2.9 4 24.78 089 157 7.0819 2.9 4 25.6 0.91 157 7.3220 2.9 4 13 2284 0.94 160 6.8121 2.9 4 24 032 159 6.8622 2.9 4 25.01 089 161 7.1523 2.9 4 25.27 0.9 163 7.2224 2.9 4 :# 3 6 0.9 164 7.3925 2.9 4 13.5 23.1 0.91 163 6.6
*ml/kg/min
Subject 4
Reproduced with permission of the copyright owner. Further reproduction prohibited without permission.
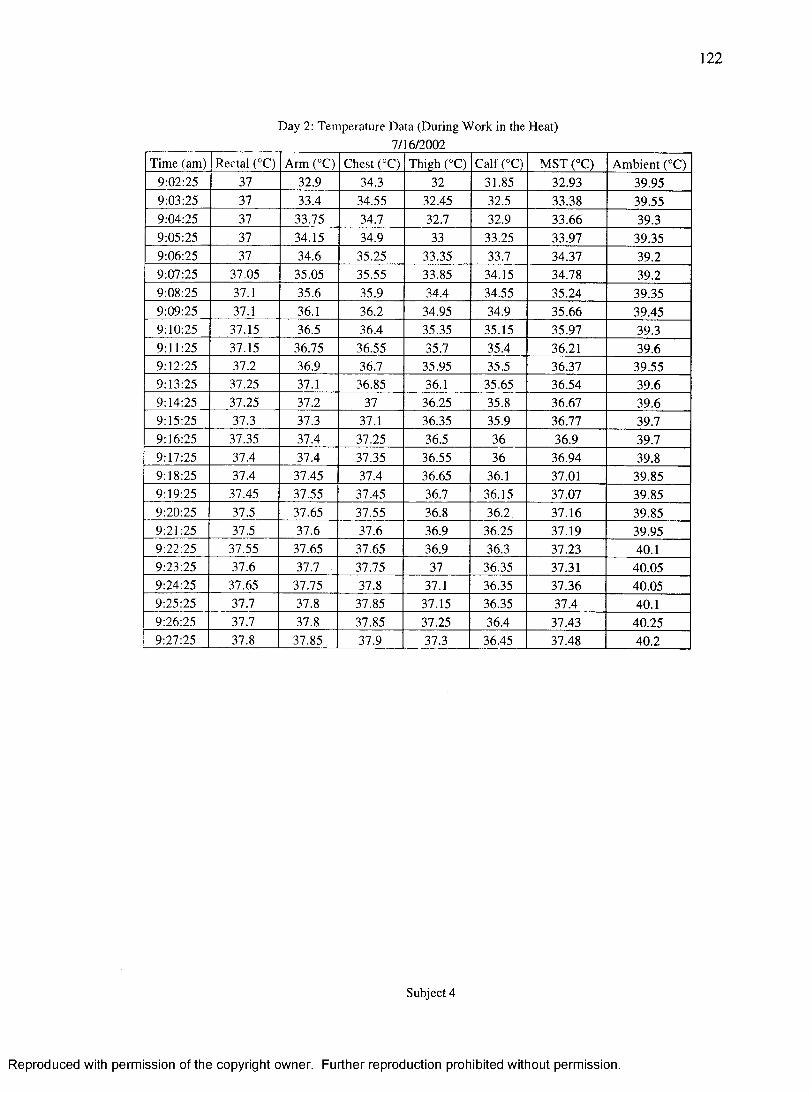
122
Day 2: Temperature Data (During Work in the7/16/2002
Heat)
Time (am) Rectal (°C) Arm C O Chest (°C) Thigh CC) CalfCC) MST C O Ambient (°C)9:02:25 37 324 344 32 31.85 3243 39.959:03:25 37 33.4 34.55 3245 32.5 3348 39.559:04:25 37 33.75 34.7 324 324 33.66 39.39:05:25 37 34.15 344 33 33.25 33.97 39.359:06:25 37 34^ 3543 3345 33.7 34.37 39.29:07:25 37.05 35.05 35.55 3345 34.15 34.78 39.29:08:25 37.1 35.6 354 34.4 34.55 35.24 39.359:09:25 37.1 36.1 364 34.95 34.9 35.66 39.459:10:25 37.15 36.5 36.4 35.35 35.15 35.97 39.39:11:25 37.15 36.75 36.55 354 35.4 36.21 39.69:12:25 37.2 364 36.7 35.95 35.5 36.37 39.559:13:25 37.25 37.1 3645 36.1 35.65 36.54 39.69:14:25 37.25 3T2 37 3645 354 36.67 39.69:15:25 37.3 37.3 37.1 36.35 35.9 36.77 39.79:16:25 37.35 37.4 37.25 36.5 36 36.9 39.79:17:25 37.4 37.4 37.35 36.55 36 36.94 39.89:18:25 37.4 37.45 37.4 36.65 36.1 37.01 39.859:19:25 37.45 37.55 37.45 36.7 36.15 37.07 39.859:20:25 37.5 37.65 37.55 364 364 37.16 39.859:21:25 37.5 3T6 37.6 364 3645 37.19 39.959:22:25 37.55 37.65 37.65 364 36.3 37.23 40.19:23:25 37.6 37.7 37.75 37 36.35 37.31 40.059:24:25 37.65 37.75 374 37.1 36.35 37.36 40.059:25:25 37.7 3T8 3745 37.15 36.35 37.4 40.19:26:25 37.7 3T8 37.85 37.25 36.4 37.43 40.259:27:25 3T8 37.85 374 37.3 36.45 37.48 40.2
Subject 4
Reproduced with permission of the copyright owner. Further reproduction prohibited without permission.
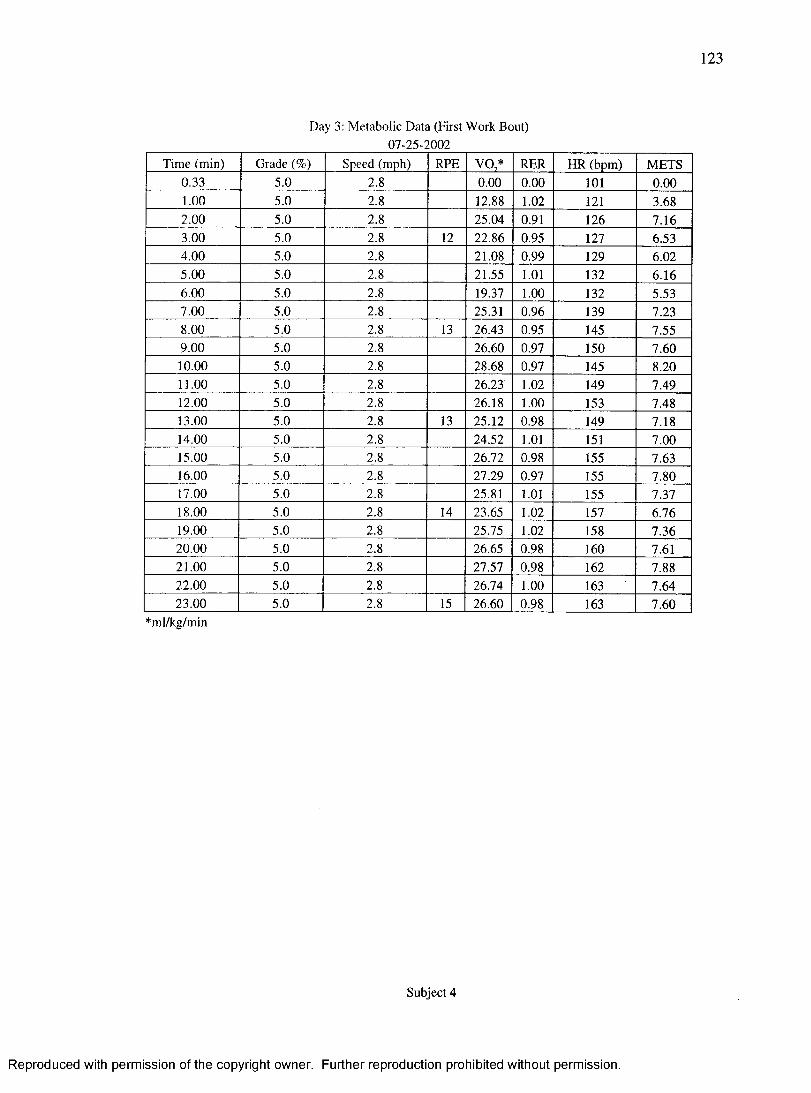
123
Day 3: Metabolic Data (First Work Bout)07-25-2002
Time (min) Grade (%) Speed (mph) RPE V O / RER HR (bpm) METS0.33 5.0 2.8 0.00 0.00 101 0.001.00 5.0 2.8 12 88 1.02 121 3682.00 5.0 2.8 25.04 0.91 126 7.163.00 5.0 2.8 12 22 86 0.95 127 6.534.00 5.0 2.8 21.08 0.99 129 6.025.00 5.0 2.8 21.55 1.01 132 6.166.00 5.0 2.8 19.37 1.00 132 5.537.00 5.0 2.8 25.31 0.96 139 7.238.00 5.0 2.8 13 26.43 0.95 145 7.559.00 5.0 2.8 26.60 0.97 150 7.6010.00 5.0 2.8 28.68 0.97 145 8.2011.00 5.0 2.8 26.23 1.02 149 7.4912.00 5.0 2.8 26.18 1.00 153 7.4813.00 5.0 2.8 13 25.12 0.98 149 7.1814.00 5.0 2.8 24.52 1.01 151 7.0015.00 5.0 2.8 26.72 0.98 155 7.6316.00 5.0 2.8 27.29 0.97 155 7.8017.00 5.0 2.8 25.81 1.01 155 7.3718.00 5.0 2.8 14 23.65 1.02 157 6.7619.00 5.0 2.8 25.75 1.02 158 7.3620.00 5.0 2.8 26.65 0.98 160 7.6121.00 5.0 2.8 27.57 0.98 162 7.8822.00 5.0 2.8 26.74 1.00 163 7.6423.00 5.0 2.8 15 26.60 048 163 7.60
*ml/kg/min
Subject 4
Reproduced with permission of the copyright owner. Further reproduction prohibited without permission.
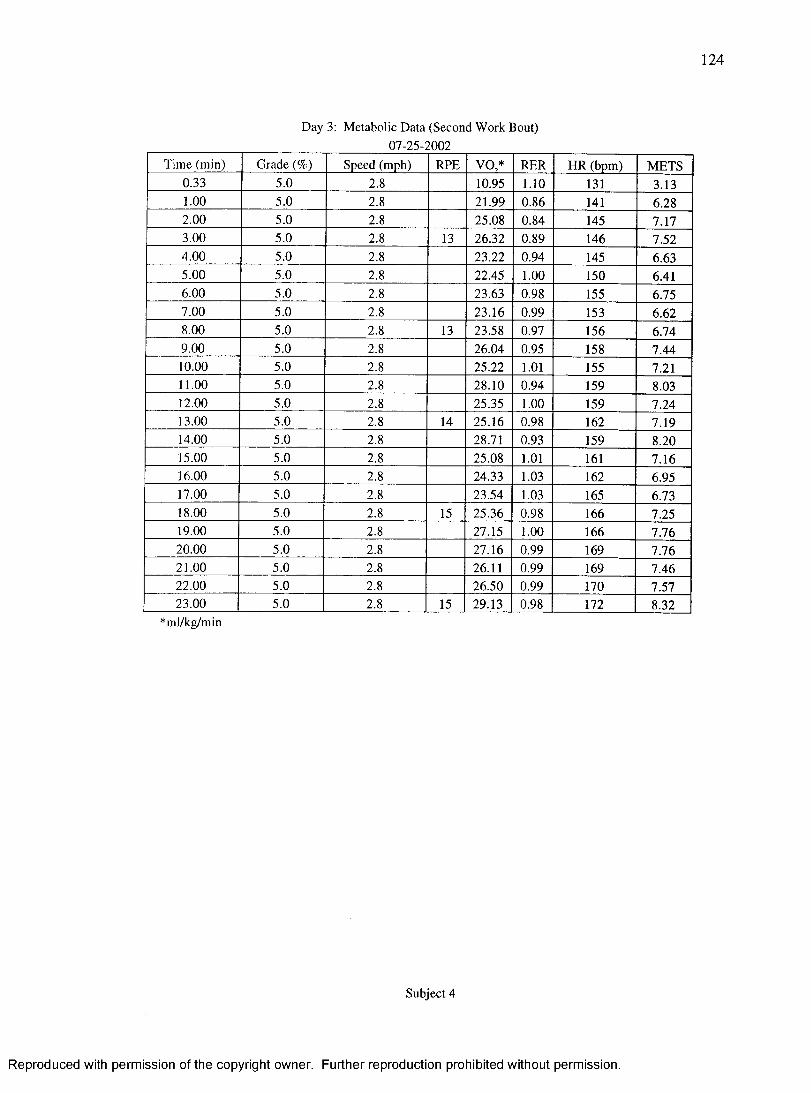
124
Day 3: Metabolic Data (Second Work Bout)07-25-2002
Time (min) Grade (%) Speed (mph) RPE V O / RER HR (bpm) METS0.33 5.0 2.8 10.95 1.10 131 3.131.00 5.0 2.8 21.99 0.86 141 6.282.00 5.0 2.8 25.08 0.84 145 7.173.00 5.0 2.8 13 2642 049 146 7.524.00 5.0 2.8 2342 0.94 145 6.635.00 5.0 2.8 22.45 1.00 150 6.416.00 5.0 2.8 23.63 0.98 155 6.757.00 5.0 2.8 23.16 0.99 153 6.628.00 5.0 2.8 13 23.58 0.97 156 6.749.00 5.0 2.8 26.04 0.95 158 7.4410.00 5.0 2.8 25.22 1.01 155 7.2111.00 5.0 2.8 28.10 0.94 159 8.0312.00 5.0 2.8 25.35 1.00 159 7.2413.00 5.0 2.8 14 25.16 048 162 7.1914.00 5.0 2.8 28.71 0.93 159 8.2015.00 5.0 2.8 25.08 1.01 161 7.1616.00 5.0 2.8 24.33 1.03 162 6.9517.00 5.0 2.8 23.54 1.03 165 6.7318.00 5.0 2.8 15 25.36 0.98 166 7.2519.00 5.0 2.8 27.15 1.00 166 7.7620.00 5.0 2.8 27.16 0.99 169 7.7621.00 5.0 2.8 26.11 0.99 169 7.4622.00 5.0 2.8 26.50 0.99 170 7.5723.00 5.0 2.8 15 29.13 048 172 8.32
*ml/kg/min
Subject 4
Reproduced with permission of the copyright owner. Further reproduction prohibited without permission.
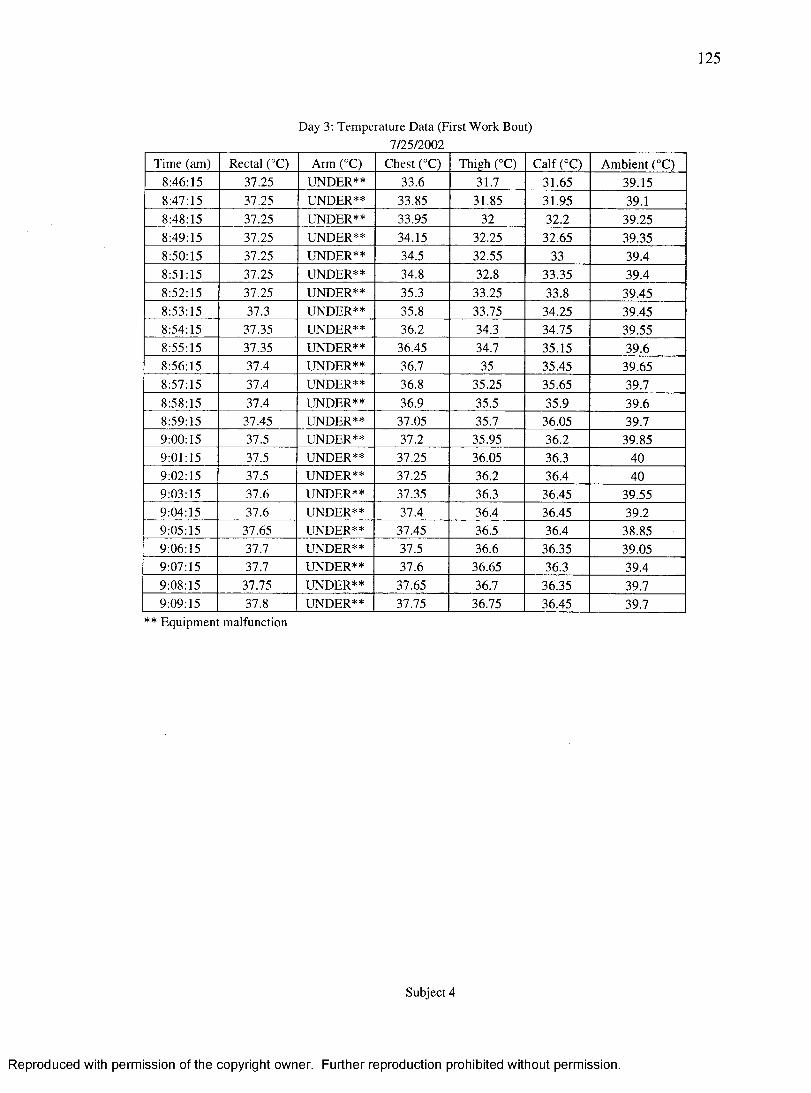
125
Day 3: Temperature Data (First Work Bout)7/25/2002
Time (am) Rectal CC) Arm CC) Chest CC) Thigh (°C) Calf(°C) Ambient (°C)8:46:15 3745 UNDER** 334 31.7 31.65 39.158:47:15 37.25 UNDER** 3345 31.85 31.95 39.18:48:15 37.25 UNDER** 3345 32 32.2 39.258:49:15 37.25 UNDER** 34.15 32.25 32.65 39.358:50:15 37.25 UNDER** 34.5 32.55 33 39.48:51:15 37.25 UNDER** 344 324 33.35 39.48:52:15 37.25 UNDER** 354 3345 334 39.458:53:15 37.3 UNDER** 35.8 33.75 34.25 39.458:54:15 37.35 UNDER** 364 344 34.75 39.558:55:15 37.35 UNDER** 36.45 34.7 35.15 39.68:56:15 37.4 UNDER** 364 35 35.45 39.658:57:15 37.4 UNDER** 364 35.25 35.65 39.78:58:15 37.4 UNDER** 364 35.5 354 3948:59:15 37.45 UNDER** 37.05 35.7 36.05 39.79:00:15 37.5 UNDER** 37.2 35.95 364 39.859:01:15 37.5 UNDER** 3745 36.05 36.3 409:02:15 37.5 UNDER** 3745 364 36.4 409:03:15 3T6 UNDER** 37.35 364 36.45 39.559:04:15 37.6 UNDER** 37.4 36.4 36.45 3949:05:15 37.65 UNDER** 37.45 36.5 36.4 38.859:06:15 37.7 UNDER** 37.5 364 36.35 39.059:07:15 37.7 UNDER** 37.6 36.65 36.3 39.49:08:15 37.75 UNDER** 37.65 36.7 36.35 39.79:09:15 374 UNDER** 37.75 36.75 36.45 39.7
■ Equipment malfunction
Subject 4
Reproduced with permission of the copyright owner. Further reproduction prohibited without permission.
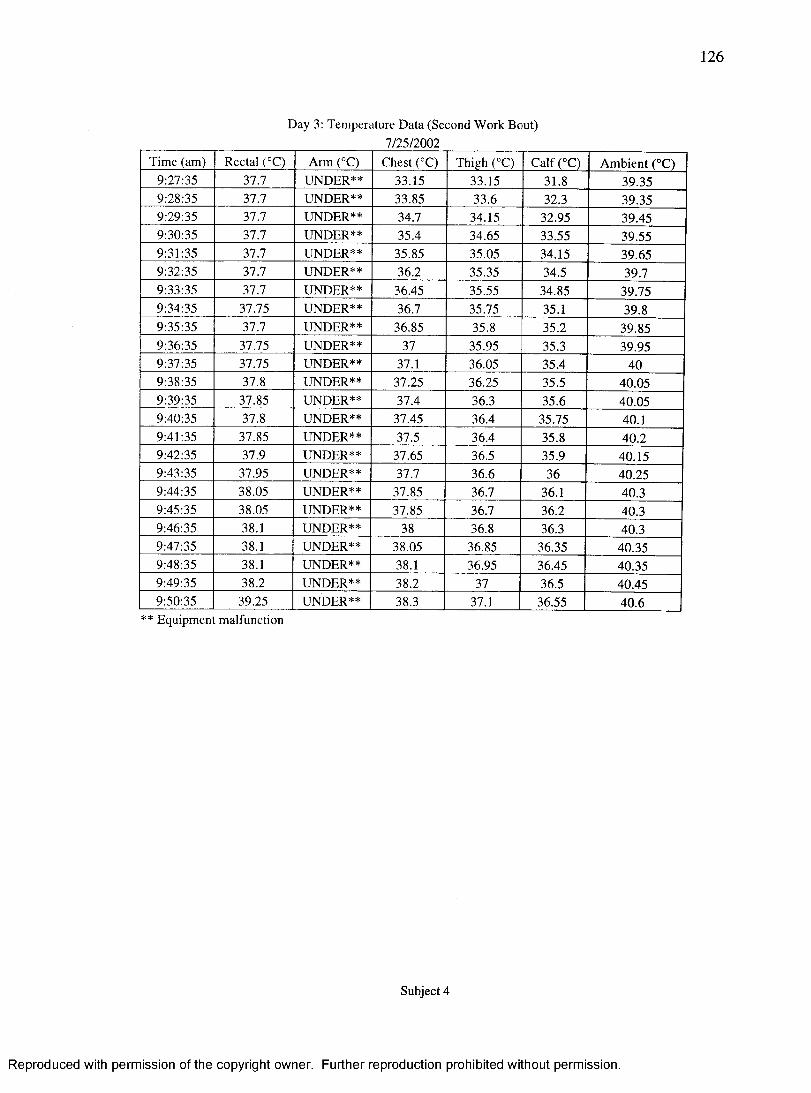
126
Day 3: Temperature Data (Second Work Bout)7/25/2002
Time (am) Rectal (°C) Arm CC) Chest CC) Thigh (°C) Calf(°C) Ambient (°C)9:27:35 37.7 UNDER** 33.15 33.15 31.8 39.359:28:35 37.7 UNDER** 3345 33.6 324 39.359:29:35 37.7 UNDER** 34.7 34.15 32.95 39.459:30:35 37.7 UNDER** 35.4 34.65 33.55 39.559:31:35 37.7 UNDER** 35.85 35.05 34.15 39.659:32:35 37.7 UNDER** 364 35.35 34.5 39.79:33:35 37.7 UNDER** 36.45 35.55 3445 39.759:34:35 37.75 UNDER** 364 35.75 35.1 39.89:35:35 37.7 UNDER** 3645 354 35.2 39.859:36:35 37.75 UNDER** 37 35.95 35.3 39.959:37:35 37.75 UNDER** 37.1 36.05 35.4 409:38:35 37.8 UNDER** 3745 3645 35.5 40.059:39:35 37.85 UNDER** 37.4 364 35.6 40.059:40:35 374 UNDER** 37.45 36.4 35.75 40.19:41:35 3745 UNDER** 37.5 3&4 35.8 40.29:42:35 37.9 UNDER** 37.65 365 35.9 40.159:43:35 37.95 UNDER** 37.7 36.6 36 40.259:44:35 38.05 UNDER** 37.85 36.7 36.1 40.39:45:35 38 05 UNDER** 37.85 36.7 36.2 40.39:46:35 38.1 UNDER** 38 364 364 40.39:47:35 38.1 UNDER** 3845 3645 36.35 40.359:48:35 38J UNDER** 384 3645 36.45 40.359:49:35 384 UNDER** 384 37 36.5 40.459:50:35 39.25 UNDER** 384 37.1 36.55 40.6Equipment malfunction
Subject 4
Reproduced with permission of the copyright owner. Further reproduction prohibited without permission.
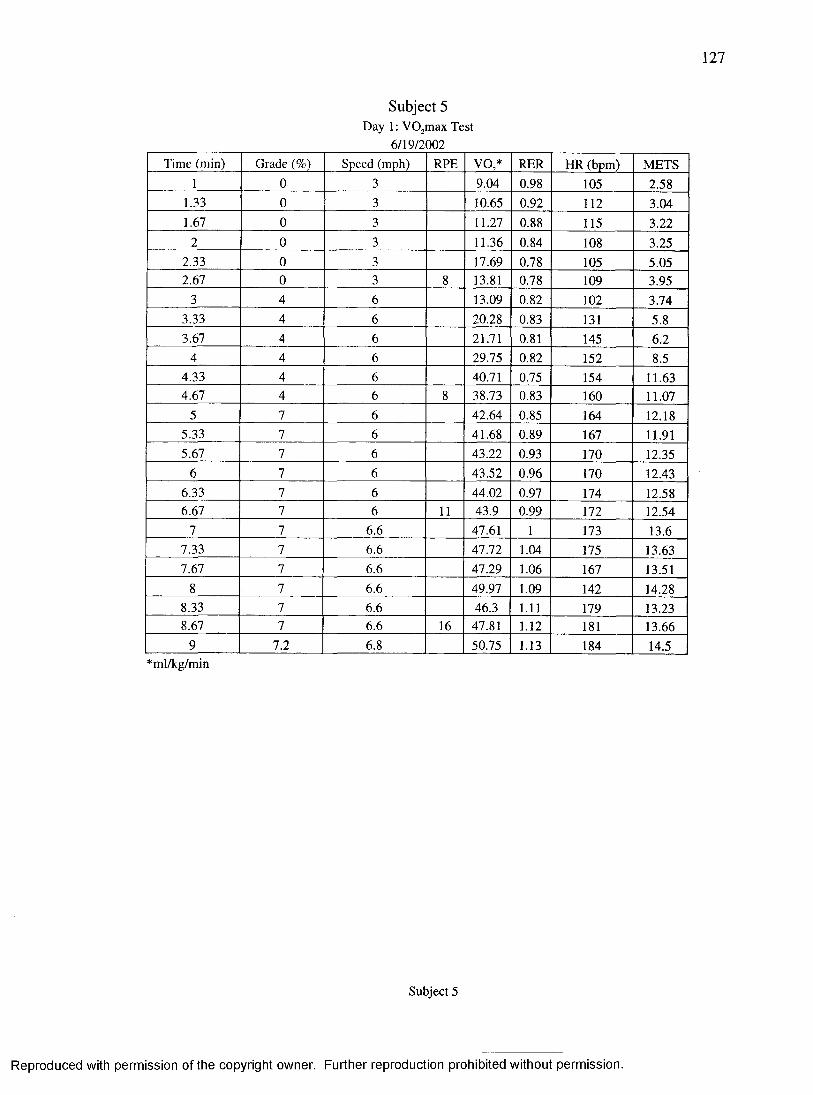
127
Subject 5 Day 1: VO^max Test
6/19/2002Time (min) Grade (%) Speed (mph) RPE V O / RER HR (bpm) METS
1 0 3 9.04 0.98 105 2481.33 0 3 10.65 0.92 112 3.041.67 0 3 11.27 048 115 3 J 2
2 0 3 11.36 0.84 108 3.25243 0 3 17.69 0.78 105 5.052.67 0 3 8 13.81 0.78 109 3.95
3 4 6 13.09 0.82 102 3.74343 4 6 20.28 0.83 131 5.83.67 4 6 21.71 0.81 145 6.2
4 4 6 29.75 0.82 152 8.5443 4 6 40.71 0.75 154 11.634.67 4 6 8 38.73 083 160 11.07
5 7 6 42.64 0.85 164 12.18543 7 6 41.68 089 167 11.915.67 7 6 43.22 0.93 170 12.35
6 7 6 43.52 0.96 170 12.43643 7 6 44.02 0.97 174 12.586.67 7 6 11 43.9 0.99 172 12.54
7 7 6.6 47.61 1 173 13.67.33 7 6.6 47.72 1.04 175 13.637.67 7 6.6 47.29 1.06 167 13.51
8 7 6.6 49.97 1.09 142 14.28843 7 6.6 46.3 1.11 179 13.238^7 7 6.6 16 47.81 1.12 181 13.66
9 7.2 6.8 50.75 1.13 184 14.5*ml/kg/min
Subject 5
Reproduced with permission of the copyright owner. Further reproduction prohibited without permission.
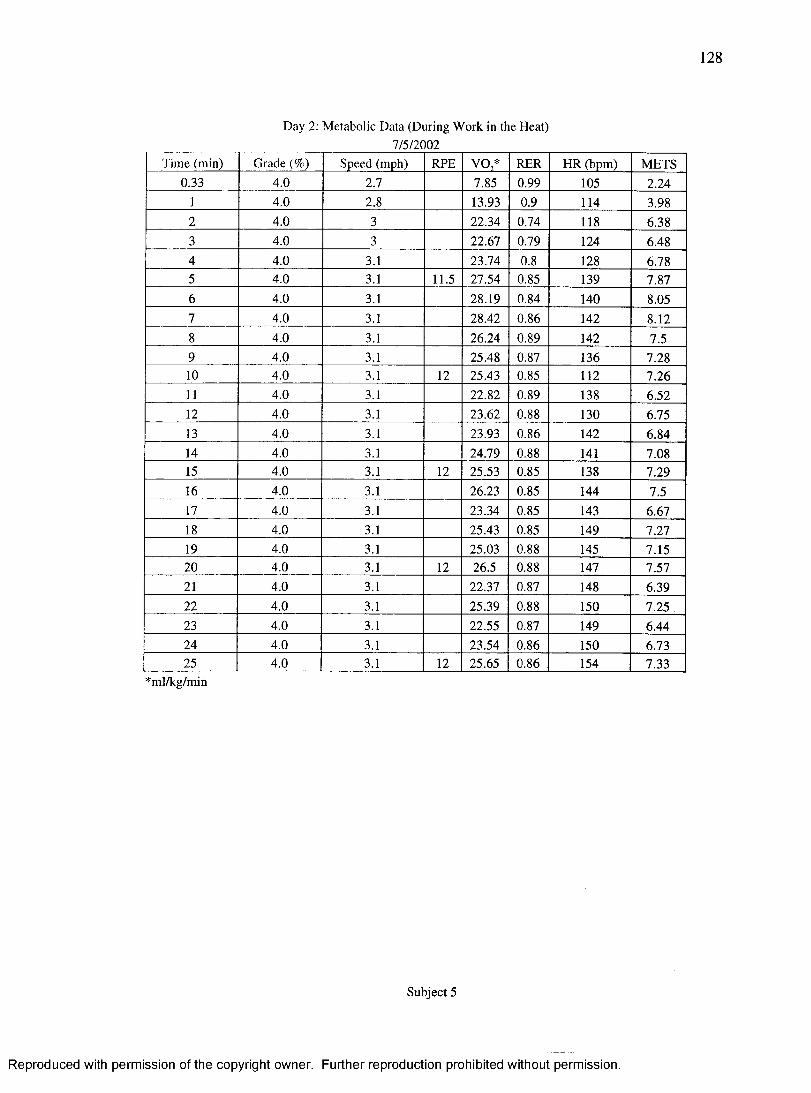
128
Day 2; Metabolic Data (During Work in the Heat)7/5/2002
Time (min) Grade (%) Speed (mph) RPE V O / RER HR (bpm) METS0.33 4.0 2.7 7.85 0.99 105 2.24
1 4.0 2.8 13.93 0.9 114 3.982 4.0 3 22.34 0.74 118 6.383 4.0 3 22.67 0.79 124 6.484 4.0 3.1 23.74 0.8 128 6.785 4.0 3.1 11.5 27.54 0.85 139 7.876 4.0 3.1 28.19 0.84 140 8.057 4.0 3.1 28.42 086 142 8.128 4.0 3.1 26.24 0^9 142 7.59 4.0 3.1 25.48 0.87 136 7.2810 4.0 3.1 12 25.43 0^5 112 7.2611 4.0 3.1 22.82 0.89 138 6.5212 4.0 3.1 23.62 0^8 130 6.7513 4.0 3.1 23.93 0.86 142 6.8414 4.0 3.1 24.79 0.88 141 7.0815 4.0 3.1 12 25.53 0.85 138 7.2916 4.0 3.1 2&j3 0.85 144 7.517 4.0 3.1 23.34 0.85 143 6.6718 4.0 3.1 25.43 0.85 149 7.2719 4.0 3.1 25.03 0^8 145 7.1520 4.0 3.1 12 26.5 0.88 147 7.5721 4.0 3.1 22.37 0.87 148 6.3922 4.0 3.1 25.39 0^8 150 7.2523 4.0 3.1 22.55 0.87 149 6.4424 4.0 3.1 23.54 0.86 150 6.7325 4.0 3.1 12 25.65 0.86 154 7.33
*ml/kg/min
Subject 5
Reproduced with permission of the copyright owner. Further reproduction prohibited without permission.
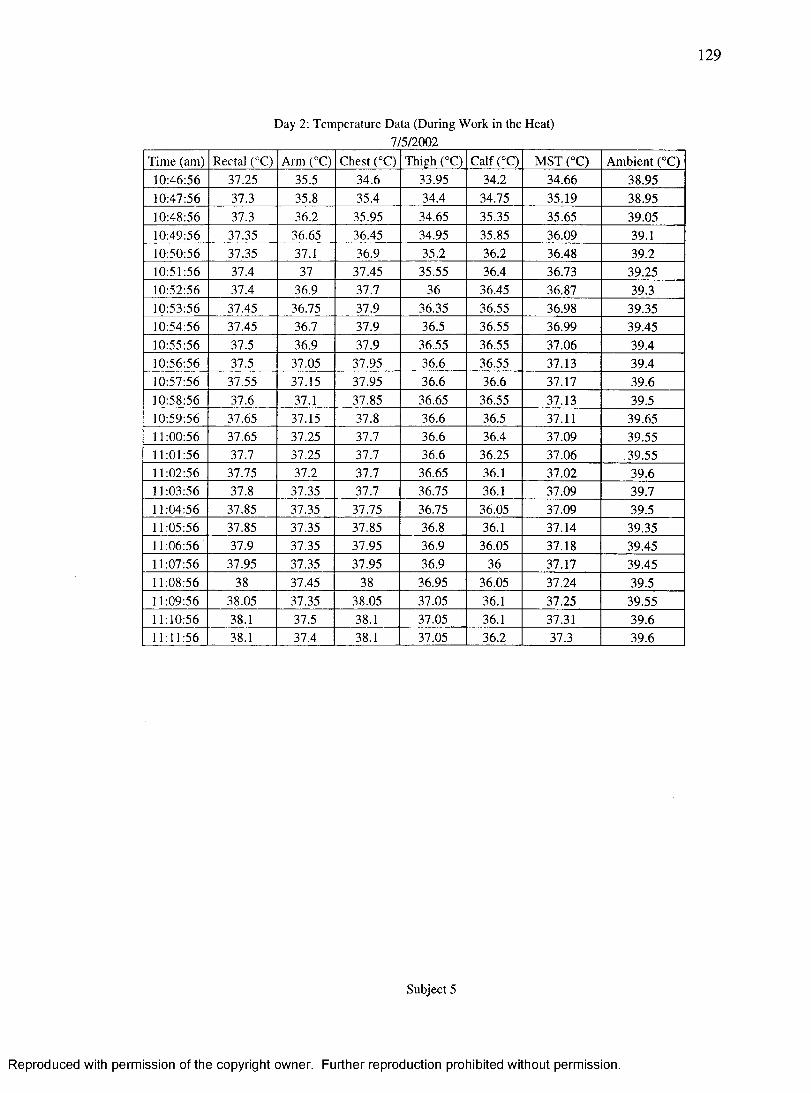
129
Day 2: Temperature Data (During Work in the7/5/2002
Heat)
Time (am) Rectal (°C) Arm (°C) Chest CC) Thigh CC) Calf(°C) MST (°C) Ambient (°C)10:46:56 37.25 35.5 34.6 33.95 34.2 34.66 384510:47:56 37.3 353 35.4 34.4 34.75 35.19 384510:48:56 373 3&2 35.95 34.65 35.35 35.65 39.0510:49:56 3735 36.65 36.45 34.95 35.85 36.09 39.110:50:56 3735 37.1 3&9 35.2 3&2 36.48 39.210:51:56 37.4 37 37.45 35.55 3&4 36.73 39.2510:52:56 37.4 3&9 37.7 36 36.45 36.87 39.310:53:56 37.45 36.75 37.9 36 35 36.55 3&98 39.3510:54:56 37.45 36.7 37.9 36.5 36.55 36.99 39.4510:55:56 37.5 3&9 3T9 36.55 36.55 37.06 39.410:56:56 37.5 37.05 37.95 36.6 36.55 37.13 39.410:57:56 37.55 37.15 37.95 36.6 36.6 37.17 39.610:58:56 37.6 37.1 37.85 36.65 36.55 37.13 39.510:59:56 37.65 37.15 37.8 3&6 36.5 37.11 39.6511:00:56 37.65 37.25 37.7 3&6 3&4 37.09 39.5511:01:56 37.7 37.25 37.7 3&6 36.25 37.06 39.5511:02:56 37.75 37.2 37.7 36.65 36.1 37.02 39.611:03:56 37.8 37.35 37.7 36.75 36.1 37.09 39.711:04:56 3735 37.35 37.75 36.75 36.05 37.09 39.511:05:56 3735 37.35 3T85 3&8 36.1 37.14 39.3511:06:56 3T9 37.35 37.95 36.9 36.05 37.18 39.4511:07:56 37.95 37.35 37.95 3&9 36 37.17 39.4511:08:56 38 37.45 38 3&95 36.05 37.24 39.511:09:56 3&05 37.35 3&05 37.05 36.1 37.25 39.5511:10:56 383 37.5 38.1 37.05 36.1 37.31 39.611:11:56 383 37.4 38.1 37.05 36.2 37.3 39.6
Subject 5
Reproduced with permission of the copyright owner. Further reproduction prohibited without permission.
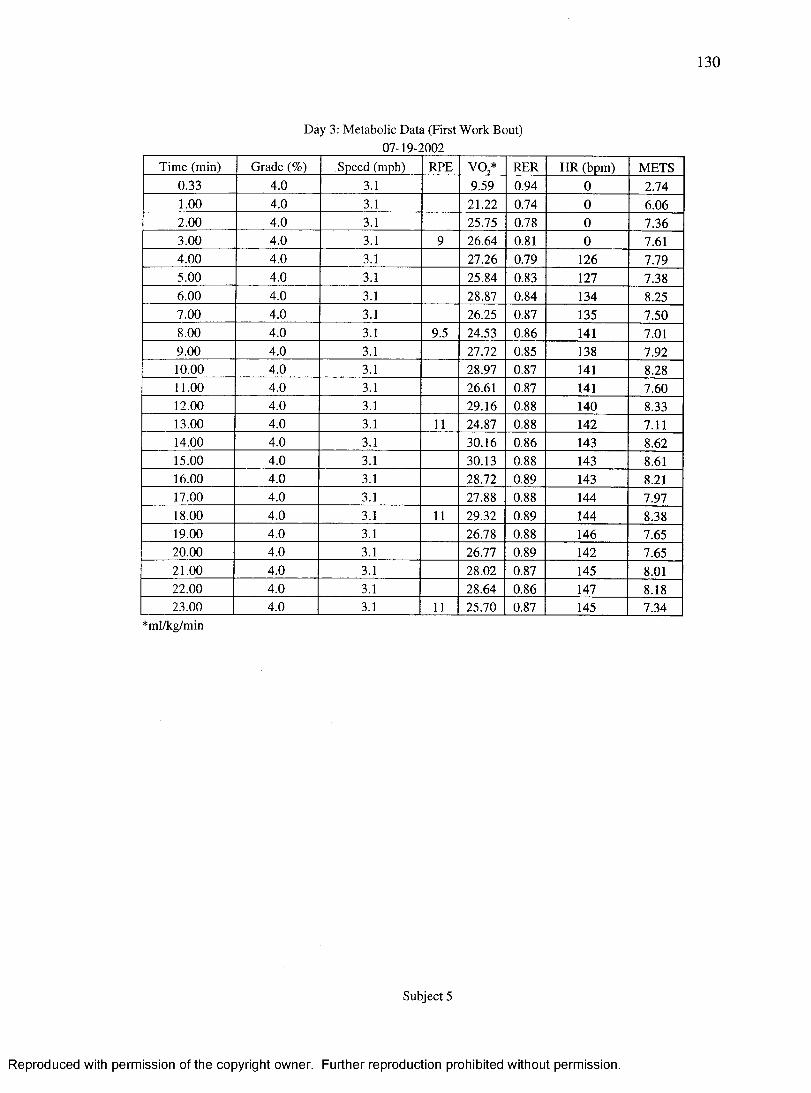
130
Day 3: Metabolic Data (First Work Bout)07-19-2002
Time (min) Grade (%) Speed (mph) RPE V O / RER HR (bpm) METS0.33 4.0 3.1 9.59 0.94 0 2.741.00 4.0 3.1 21.22 0.74 0 6.062.00 4.0 3.1 25.75 0.78 0 7.363.00 4.0 3.1 9 26.64 0.81 0 7.614.00 4.0 3.1 27.26 0.79 126 7.795.00 4.0 3.1 25.84 0^3 127 7.386.00 4.0 3.1 28.87 0.84 134 8.257.00 4.0 3.1 26.25 0.87 135 7.508.00 4.0 3.1 9.5 24.53 0.86 141 7.019.00 4.0 3.1 27.72 0.85 138 7.9210.00 4.0 3.1 28.97 0.87 141 8.2811.00 4.0 3.1 26.61 0.87 141 7.6012.00 4.0 3.1 29.16 088 140 83313.00 4.0 3.1 11 24.87 0.88 142 7.1114.00 4.0 3.1 30.16 0.86 143 8.6215.00 4.0 3.1 30.13 0.88 143 8.6116.00 4.0 3.1 28.72 0.89 143 8.2117.00 4.0 3.1 27.88 088 144 7.9718.00 4.0 3.1 11 29.32 089 144 83819.00 4.0 3.1 26J8 088 146 7.6520.00 4.0 3.1 26.77 089 142 7.6521.00 4.0 3.1 28.02 0.87 145 8.0122.00 4.0 3.1 2&64 0.86 147 8.1823.00 4.0 3.1 11 25.70 0.87 145 7.34
*ml/kg/min
Subject 5
Reproduced with permission of the copyright owner. Further reproduction prohibited without permission.
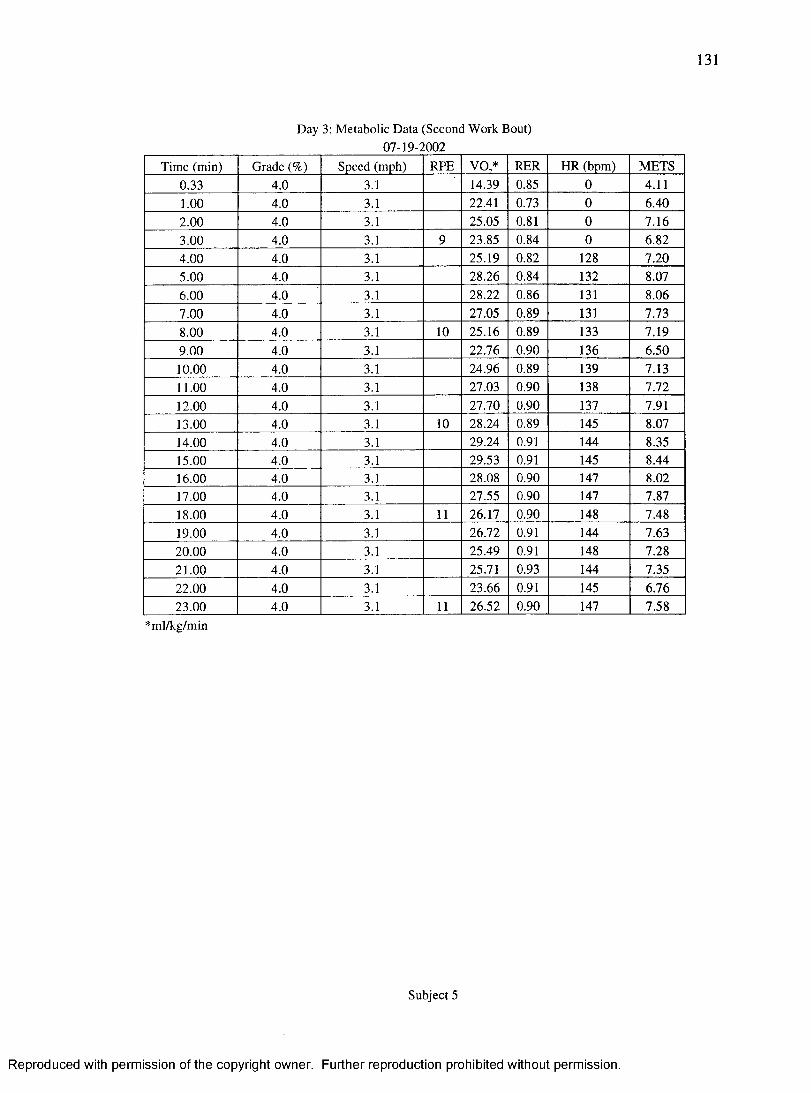
131
Day 3; Metabolic Data (Second Work Bout)07-19-2002
Time (min) Grade (%) Speed (mph) RPE V O / RER HR (bpm) METS0.33 4.0 3.1 14.39 0.85 0 4.111.00 4.0 3.1 22.41 0.73 0 6.402.00 4.0 3.1 25.05 0.81 0 7.163.00 4.0 3.1 9 23.85 0^4 0 6.824.00 4.0 3.1 25.19 0.82 128 7.205.00 4.0 3.1 2&26 0.84 132 8.076.00 4.0 3.1 28.22 086 131 8.067.00 4.0 3.1 27.05 0.89 131 7.738.00 4.0 3.1 10 25.16 0.89 133 7.199.00 4.0 3.1 22.76 0.90 136 6.5010.00 4.0 3.1 24.96 0.89 139 7.1311.00 4.0 3.1 27.03 0.90 138 7.7212.00 4.0 3.1 27.70 0.90 137 7.9113.00 4.0 3.1 10 2&M 0^9 145 8.0714.00 4.0 3.1 29.24 0.91 144 8.3515.00 4.0 3.1 29.53 0.91 145 8.4416.00 4.0 3.1 28.08 0.90 147 8.0217.00 4.0 3.1 27.55 0.90 147 7.8718.00 4.0 3.1 11 26.17 0.90 148 7.4819.00 4.0 3.1 26.72 0.91 144 7.6320.00 4.0 3.1 25.49 0.91 148 7.2821.00 4.0 3.1 25.71 0.93 144 7.3522.00 4.0 3.1 23.66 0.91 145 6.7623.00 4.0 3.1 11 26.52 0.90 147 7.58
*ml/kg/min
Subject 5
Reproduced with permission of the copyright owner. Further reproduction prohibited without permission.

132
Day 3 (First Work7/19/2002
Bout)
Time (am) Rectal (°C) Arm C O Chest CC) Thigh (°C) Calf(°C) Ambient (°C)8:52:30 36.85 UNDER** 34.65 32.5 32.7 39.68:53:30 3&8 UNDER** 34a 32.7 33.25 39.058:54:30 3&8 UNDER** 35 32.95 33.85 38.658:55:30 3&8 UNDER** 35.35 315 34.7 38.58:56:30 36.85 UNDER** 35.7 33.85 312 38.68:57:30 36.85 UNDER** 36.05 34.3 35.55 38.78:58:30 369 UNDER** 364 34.95 35.8 38.68:59:30 3&9 UNDER** 36.65 35.4 35.95 38a9:00:30 3&9 UNDER** 36.75 35.7 36.1 38.959:01:30 36.95 UNDER** 36a 319 36.2 3199:02:30 37 UNDER** 36a5 36.05 36.25 39.059:03:30 37 UNDER** 3&9 36.1 36.25 39.39:04:30 37.05 UNDER** 3&9 36.15 36.25 39.39:05:30 37.1 UNDER** 37 312 36.2 39.49:06:30 37.15 UNDER** 37 312 312 39.79:07:30 37.15 UNDER** 37.1 36.25 36.15 39.89:08:30 37.15 UNDER** 37.1 36.3 36.05 40.059:09:30 37.25 UNDER** 37.15 36.4 36.05 39a9:10:30 37.3 UNDER** 37.2 36.45 36 39.559:11:30 37.35 UNDER** 37.25 36.5 35.95 39.59:12:30 37.4 UNDER** 37.35 36.55 35.85 39a9:13:30 37.4 UNDER** 37.4 36.65 35.8 39.459:14:30 37.5 UNDER** 37.45 36.7 35.85 39.459:15:30 37.55 UNDER** 37.5 36a 35.9 39.45
"♦Equipment malfunction
Subject 5
Reproduced with permission of the copyright owner. Further reproduction prohibited without permission.
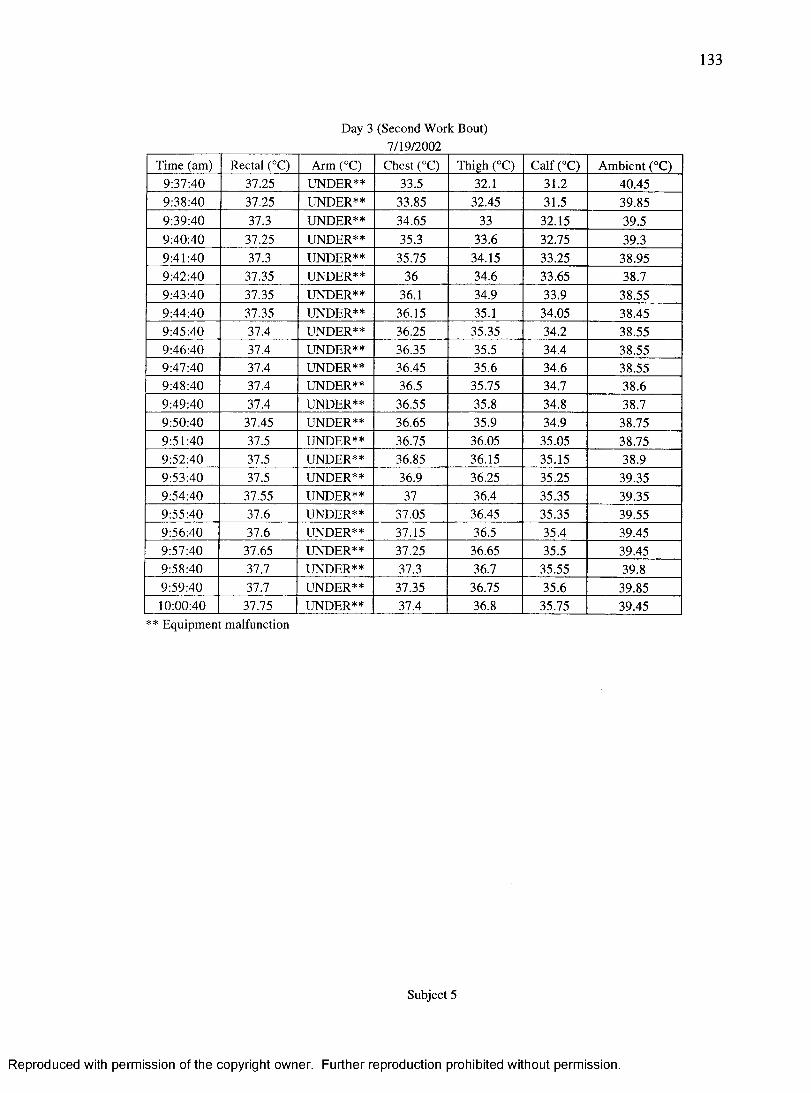
133
Day 3 (Second Work7/19/2002
Bout)
Time (am) Rectal (°C) Arm C O Chest (°C) Thigh (°C) CaIf(“C) Ambient (°C)9:37:40 37.25 UNDER** 33.5 32.1 31.2 40.459:38:40 37.25 UNDER** 3185 32.45 31.5 39.859:39:40 373 UNDER** 34.65 33 32.15 39.59:40:40 37.25 UNDER** 35.3 316 32.75 39.39:41:40 37.3 UNDER** 35.75 34.15 33.25 38.959:42:40 37.35 UNDER** 36 34.6 33.65 38.79:43:40 37.35 UNDER** 36.1 34.9 319 38.559:44:40 37.35 UNDER** 36.15 35.1 34.05 38.459:45:40 37.4 UNDER** 36.25 35.35 34.2 38.559:46:40 3T4 UNDER** 3135 35.5 34.4 38.559:47:40 37.4 UNDER** 36.45 35.6 34.6 38.559:48:40 37.4 UNDER** 36.5 35.75 34.7 38.69:49:40 37.4 UNDER** 36.55 35.8 34.8 38.79:50:40 37.45 UNDER** 3165 35.9 34.9 38.759:51:40 37.5 UNDER** 36.75 36.05 35.05 38.759:52:40 37.5 UNDER** 3185 3115 35.15 38.99:53:40 37.5 UNDER** 319 3125 35.25 39.359:54:40 37.55 UNDER** 37 36.4 35.35 39.359:55:40 37.6 UNDER** 37.05 36.45 3135 39.559:56:40 37.6 UNDER** 37.15 315 35.4 39.459:57:40 37.65 UNDER** 37.25 3165 35.5 39.459:58:40 37.7 UNDER** 313 317 35.55 39a9:59:40 37.7 UNDER** 37.35 36.75 35.6 39.8510:00:40 37.75 UNDER** 37.4 318 35.75 39.45Equipment malfunction
Subject 5
Reproduced with permission of the copyright owner. Further reproduction prohibited without permission.
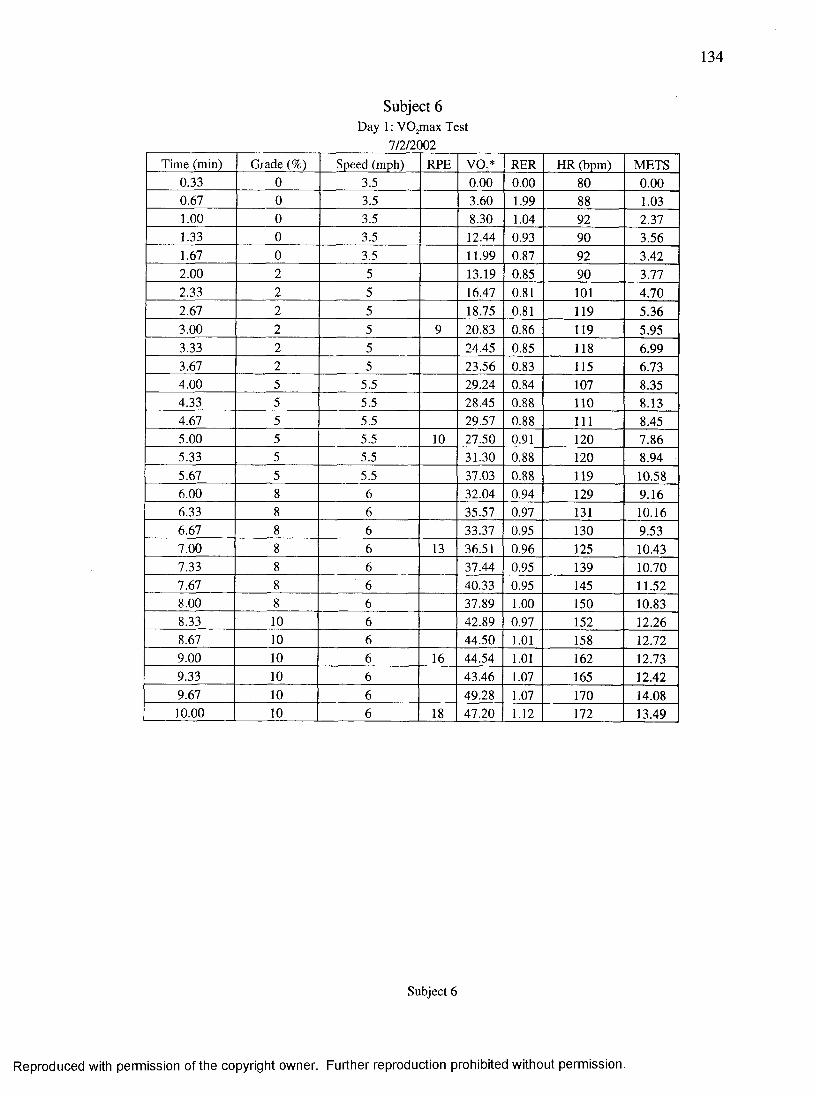
134
Subject 6Day 1: VO^max Test
7/2/2002Time (min) Grade (%) Speed (mph) RPE V O / RER HR (bpm) METS
0.33 0 3.5 0.00 0.00 80 0.000.67 0 3.5 3.60 1.99 88 1.031.00 0 3.5 8.30 1.04 92 2.371.33 0 3.5 12.44 0.93 90 3.561.67 0 3.5 11.99 0.87 92 3.422.00 2 5 13.19 0.85 90 3.77233 2 5 16.47 0.81 101 4.702.67 2 5 18.75 0.81 119 5.363.00 2 5 9 2033 0.86 119 5.95333 2 5 ^ 24.45 0.85 118 6.993.67 2 5 2336 0.83 115 6.734.00 5 5.5 29.24 0.84 107 8.354.33 5 5.5 28.45 038 110 8.134.67 5 5.5 29.57 088 111 8.455.00 5 5.5 10 27.50 0.91 120 7.86533 5 5.5 31.30 038 120 8.945.67 5 5.5 3103 038 119 10.586.00 8 6 32.04 0.94 129 9.16633 8 6 35.57 0.97 131 10.166.67 8 6 3337 0.95 130 9.537.00 8 6 13 36.51 0.96 125 10.43733 8 6 37.44 0.95 139 10.707.67 8 6 40.33 0.95 145 11.528.00 8 6 3189 1.00 150 10.83833 10 6 4239 0.97 152 12.268.67 10 6 44.50 1.01 158 12.729.00 10 6 16 44.54 1.01 162 12.73933 10 6 43.46 1.07 165 12.429.67 10 6 4938 1.07 170 14.0810.00 10 6 18 47.20 1.12 172 13.49
Subject 6
Reproduced with permission of the copyright owner. Further reproduction prohibited without permission.
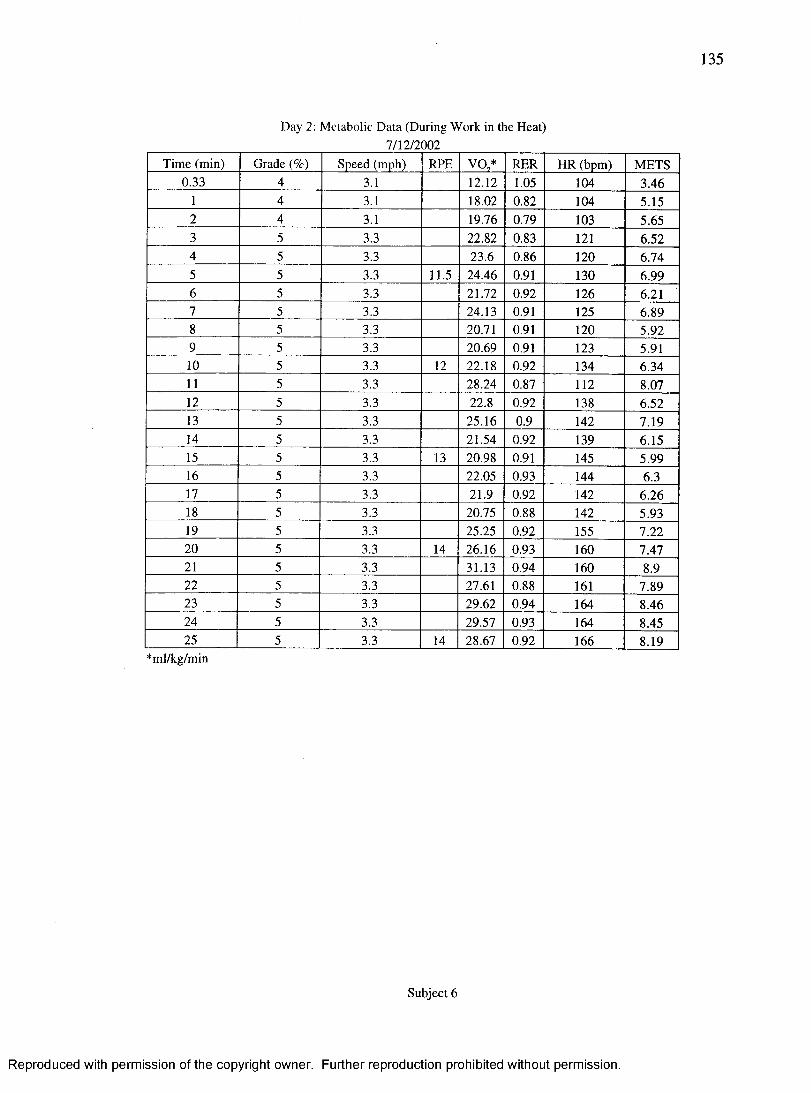
135
Day 2: Metabolic Data (During Work in the Heat)7/12/2002
Time (min) Grade (%) Speed (mph) RPE V O / RER HR (bpm) METS0.33 4 3.1 12.12 1.05 104 3.46
1 4 3.1 18.02 0.82 104 5.152 4 3.1 19.76 0.79 103 5.653 5 3.3 2Z82 083 121 6.524 5 3.3 23.6 0.86 120 6.745 5 3.3 11.5 24.46 0.91 130 6.996 5 3.3 21.72 092 126 6.217 5 3.3 24.13 0.91 125 6.898 5 3.3 20.71 0.91 120 5.929 5 3.3 20.69 0.91 123 5.9110 5 3.3 12 22.18 0.92 134 6.3411 5 3.3 2&M 0.87 112 8.0712 5 3.3 228 092 138 6.5213 5 3.3 25.16 0.9 142 7.1914 5 3.3 21.54 0.92 139 6.1515 5 3.3 13 20.98 0.91 145 5.9916 5 3.3 22.05 0.93 144 6.317 5 3.3 21.9 0.92 142 6.2618 5 3.3 20.75 088 142 5.9319 5 3.3 25.25 0.92 155 7.2220 5 3.3 14 26.16 0.93 160 7.4721 5 3.3 31.13 0.94 160 8.922 5 3.3 27.61 088 161 7.8923 5 3.3 29.62 0.94 164 8.4624 5 3.3 29.57 0.93 164 8.4525 5 3.3 14 28.67 0.92 166 8.19
*ml/kg/min
Subject 6
Reproduced with permission of the copyright owner. Further reproduction prohibited without permission.

136
Day 2: Temperature Data (During Work in the Heat)7/12/2002
Time (pm) Rectal (°C) Arm (°C) Chest CC) Thigh (°C) CalfCC) MST CC) Ambient (°C)13:33:22 37.45 34.65 34j5 32.7 33.1 3342 38.4513:34:22 37.45 34.85 34.7 33 33.35 34.14 38.213:35:22 37.45 35.15 35 333 33.7 34.45 38.113:36:22 37.45 35.35 353 334 34 34.72 37.9513:37:22 37.45 35.75 35 65 34.15 34.4 35.13 38.0513:38:22 3T5 36.1 36.05 34.6 34.65 35.5 38.3513:39:22 37.5 36.55 36.4 35.1 34.95 35.9 38.713:40:22 37.55 37 36.7 35.6 35.2 36.27 38.8513:41:22 37.6 37.3 3645 36 35.3 36.54 39.3513:42:22 37.6 37.4 37.1 3633 35.35 36.67 39.413:43:22 37.6 37.45 37.25 36.4 35.35 36.76 39.813:44:22 37.65 37.5 37.35 36.4 35.35 36.81 40.113:45:22 37.65 37.5 37.4 363 35.4 36.85 40.0513:46:22 37.7 37.5 37.45 36.65 35.55 36.93 40.1513:47:22 37.75 37.5 37.5 36.75 35.7 36.99 40.413:48:22 3T8 3%6 37.6 3635 35.85 37.1 40.4513:49:22 3T85 37.6 37.7 364 36 37.17 40.813:50:22 3T9 3T6 37.75 37 36.05 37.22 40.613:51:22 37.95 37.65 3T85 37.1 36.15 3T3 40.613:52:22 38 37.7 37.95 37.15 36.25 3748 40.8513:53:22 3&05 37.75 3845 37.2 3625 37.43 40.6513:54:22 38.1 37.7 383 37.3 36.3 37.46 40.9513:55:22 38.15 3T9 383 3735 36.4 37.58 41.0513:56:22 3&2 37.95 383 37.4 36.45 37.62 4113:57:22 383 38 05 383 37.5 36.5 37.68 41.113:58:22 3835 383 383 374 364 37.79 40.6
Subject 6
Reproduced with permission of the copyright owner. Further reproduction prohibited without permission.
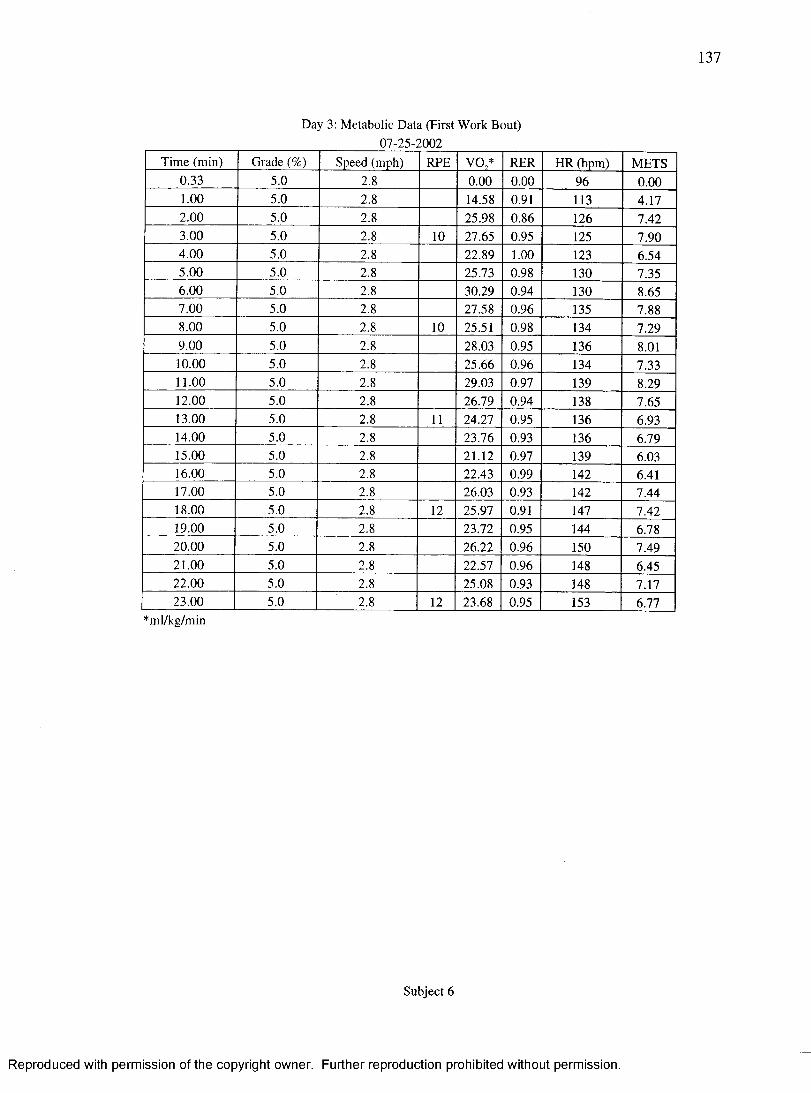
137
Day 3: Metabolic Data (First Work Bout)07-25-2002
Time (min) Grade (%) Speed (mph) RPE V O / RER HR (bpm) METS0.33 5.0 2.8 0.00 0.00 96 0.001.00 5.0 2.8 14.58 0.91 113 4.172.00 5.0 2.8 2548 0.86 126 7.423.00 5.0 2.8 10 27.65 0.95 125 7.904.00 5.0 2.8 22.89 1.00 123 6.545.00 5.0 2.8 25.73 0.98 130 7.356.00 5.0 2.8 30.29 0.94 130 8657.00 5.0 2.8 27.58 0.96 135 7.888.00 5.0 2.8 10 25.51 048 134 7.299.00 5.0 2.8 28.03 0.95 136 8.0110.00 5.0 2.8 25.66 0.96 134 7.3311.00 5.0 2.8 29.03 0.97 139 84912.00 5.0 2.8 26.79 044 138 7.6513.00 5.0 2.8 11 24.27 0.95 136 6.9314.00 5.0 2.8 23.76 043 136 6.7915.00 5.0 2.8 21.12 0.97 139 6.0316.00 5.0 2.8 22.43 0.99 142 6.4117.00 5.0 2.8 26.03 0.93 142 7.4418.00 5.0 2.8 12 25.97 0.91 147 7.4219.00 5.0 2.8 23.72 0.95 144 6.7820.00 5.0 2.8 2642 0.96 150 7.4921.00 5.0 2.8 22.57 0.96 148 6.4522.00 5.0 2.8 25.08 0.93 148 7.1723.00 5.0 2.8 12 23.68 0.95 153 6.77
*ml/kg/min
Subject 6
Reproduced with permission of the copyright owner. Further reproduction prohibited without permission.
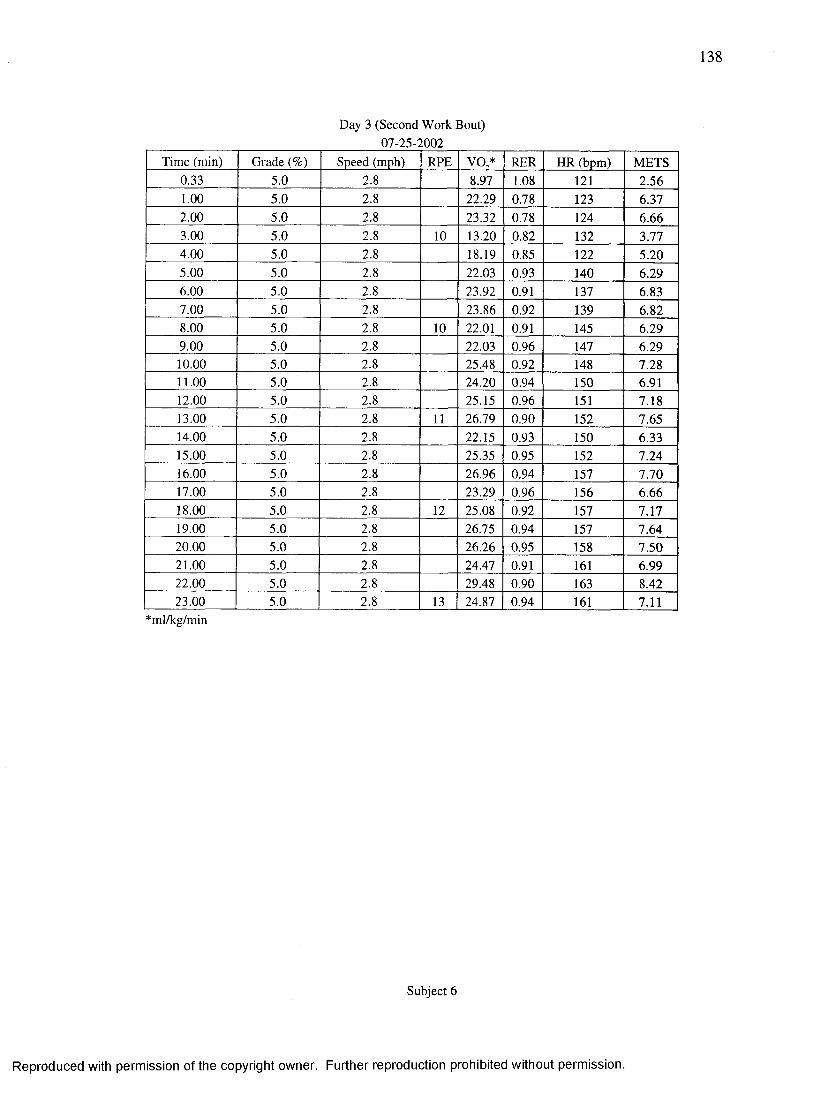
138
Day 3 (Second Work Bout)07-25-2002
Time (min) Grade (%) Speed (mph) RPE V O / RER HR (bpm) METS0.33 5.0 2.8 8.97 1.08 121 2.561.00 5.0 2.8 22 29 0.78 123 6.372.00 5.0 2.8 23.32 0.78 124 6.663.00 5.0 2.8 10 13.20 0^2 132 3.774.00 5.0 2.8 18.19 0.85 122 5.205.00 5.0 2.8 22.03 0.93 140 6.296.00 5.0 2.8 23.92 0.91 137 6.837.00 5.0 2.8 23.86 0.92 139 6828.00 5.0 2.8 10 22.01 0.91 145 6.299.00 5.0 2.8 22.03 0.96 147 6.2910.00 5.0 2.8 25.48 0.92 148 7.2811.00 5.0 2.8 24.20 044 150 64112.00 5.0 2.8 25.15 046 151 7.1813.00 5.0 2.8 11 :# 4 9 0.90 152 7.6514.00 5.0 2.8 22.15 043 150 64315.00 5.0 2.8 25.35 0.95 152 7.2416.00 5.0 2.8 26.96 0.94 157 7.7017.00 5.0 2.8 23.29 0.96 156 6.6618.00 5.0 2.8 12 25.08 0.92 157 7.1719.00 5.0 2.8 26.75 0.94 157 7.6420.00 5.0 2.8 26.26 045 158 7.5021.00 5.0 2.8 24.47 0.91 161 6.9922.00 5.0 2.8 29.48 0.90 163 8.4223.00 5.0 2.8 13 24.87 0.94 161 7.11
*ml/kg/min
Subject 6
Reproduced with permission of the copyright owner. Further reproduction prohibited without permission.
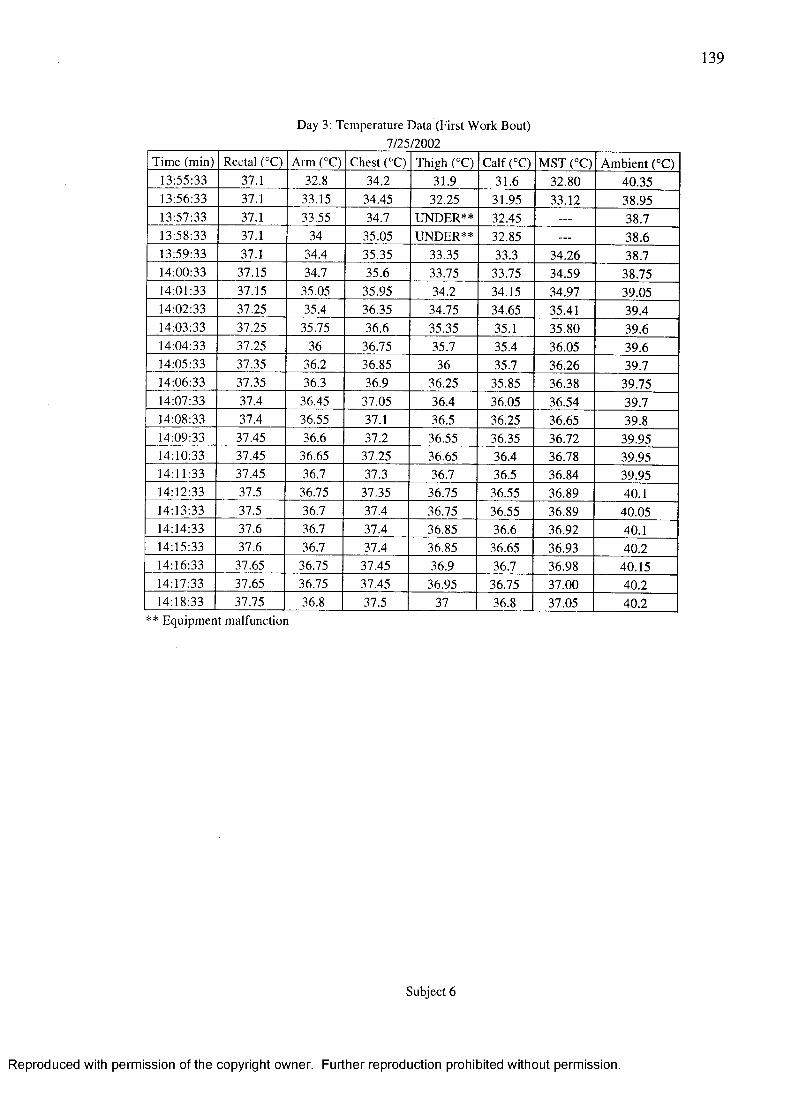
139
Day 3: Temperature Data (First Work Bout)7/25/2002
Time (min) Rectal (°C) Arm(°C) Chest CC) Thigh (°C) CalfCC) MST CC) Ambient (°C)13:55:33 37.1 324 34.2 31.9 31.6 3240 40.3513:56:33 37.1 33.15 34.45 32.25 31.95 33.12 38.9513:57:33 37.1 33.55 34.7 UNDER** 3245 ——— 38.713:58:33 37.1 34 35.05 UNDER** 3245 - —— 38413:59:33 37.1 34.4 3545 3345 334 34.26 38.714:00:33 37.15 34.7 35.6 3345 33.75 34.59 38.7514:01:33 37.15 35.05 35.95 34.2 34.15 34.97 39.0514:02:33 37.25 35.4 3645 34.75 34.65 35.41 39.414:03:33 3745 35.75 36.6 35.35 35.1 35.80 39.614:04:33 3745 36 36.75 35.7 35.4 36.05 39.614:05:33 3745 364 3645 36 35.7 36.26 39.714:06:33 3745 364 3&9 3645 3545 36.38 39.7514:07:33 37.4 36.45 37.05 36.4 36.05 36.54 39.714:08:33 37.4 3645 37.1 364 3644 36.65 39414:09:33 37.45 364 374 3645 3645 36.72 39.9514:10:33 37.45 3645 37.25 36.65 36.4 36.78 39.9514:11:33 37.45 36.7 374 36.7 36.5 36.84 39.9514:12:33 37.5 36.75 37.35 36.75 3645 3649 40.114:13:33 37.5 364 37.4 3645 36.55 3649 40.0514:14:33 37.6 364 37.4 3645 36.6 3644 40.114:15:33 3T6 36.7 37.4 3645 3665 3643 40.214:16:33 37.65 36.75 37.45 3&9 36.7 3648 40.1514:17:33 37.65 36.75 37.45 36.95 36.75 37.00 40.214:18:33 37.75 364 37.5 37 364 37.05 40.2Equipment malfunction
Subject 6
Reproduced with permission of the copyright owner. Further reproduction prohibited without permission.
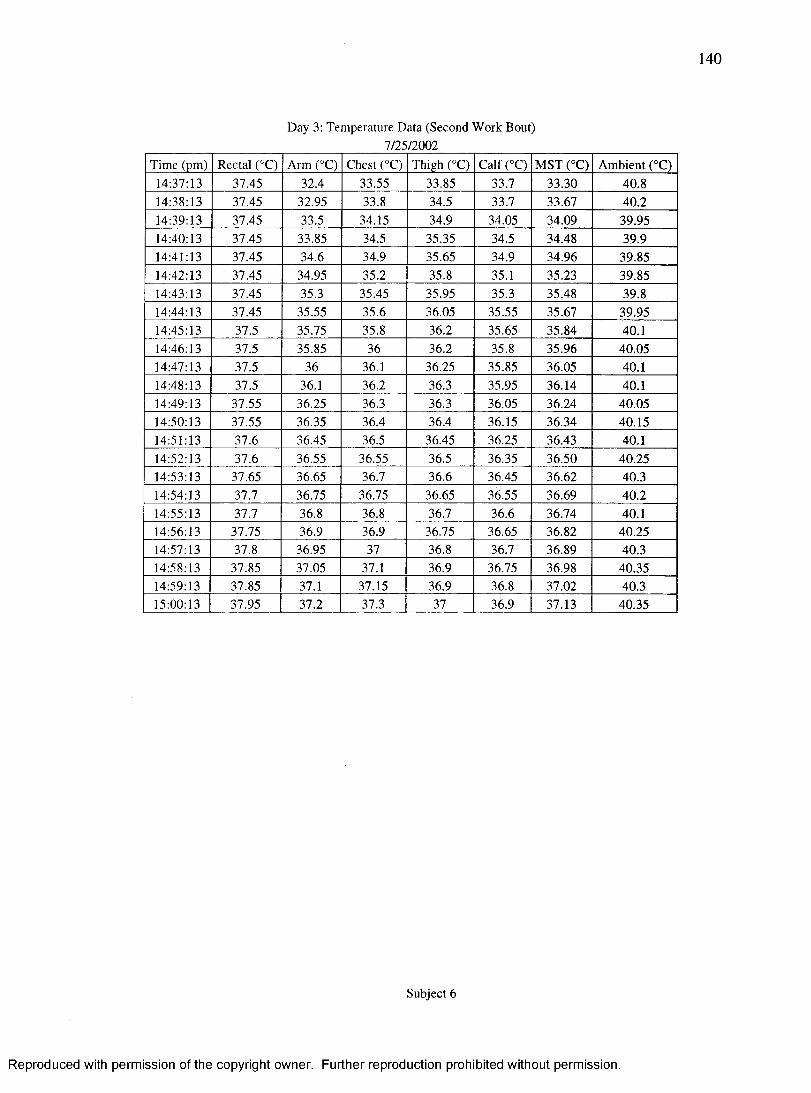
140
Day 3: Temperature Data (Second Work Bout)7/25/2002
Time (pm) Rectal (°C) Arm CC) Chest (°C) Thigh CC) CalfCC) MST (°C) Ambient (°C)14:37:13 37.45 324 33.55 3335 332 33.30 40.814:38:13 37.45 32.95 333 34.5 332 33.67 40.214:39:13 37.45 33.5 3435 34.9 34.05 34.09 39.9514:40:13 37.45 33.85 34.5 35.35 34.5 34.48 39.914:41:13 37.45 34^ 34.9 35.65 34.9 34.96 39.8514:42:13 37.45 34.95 35.2 353 35.1 35.23 39.8514:43:13 37.45 353 35.45 35.95 353 35.48 3&814:44:13 37.45 3535 35.6 36.05 35.55 35.67 39.9514:45:13 37.5 35.75 353 3&2 35.65 35.84 40.114:46:13 37.5 35.85 36 3&2 353 35.96 40.0514:47:13 37.5 36 36.1 36.25 3535 36.05 40.114:48:13 37.5 36.1 363 363 35.95 36.14 40.114:49:13 37.55 3635 363 363 36.05 36.24 40.0514:50:13 37.55 3635 36.4 36.4 36.15 36.34 40.1514:51:13 37.6 36.45 36.5 36.45 3625 36.43 40.114:52:13 37.6 36.55 3635 36.5 3635 36.50 40.2514:53:13 37.65 36.65 36.7 36.6 36.45 36.62 40.314:54:13 37.7 36.75 36.75 36.65 36.55 36.69 40.214:55:13 37.7 363 363 36.7 363 36.74 40.114:56:13 37.75 3&9 369 36.75 3635 36.82 40.2514:57:13 3T8 3&95 37 363 362 36.89 40.314:58:13 37.85 37.05 37.1 369 36.75 36.98 40.3514:59:13 3285 37.1 37.15 3&9 363 37.02 40.315:00:13 37.95 37.2 37.3 37 3&9 37.13 40.35
Subject 6
Reproduced with permission of the copyright owner. Further reproduction prohibited without permission.
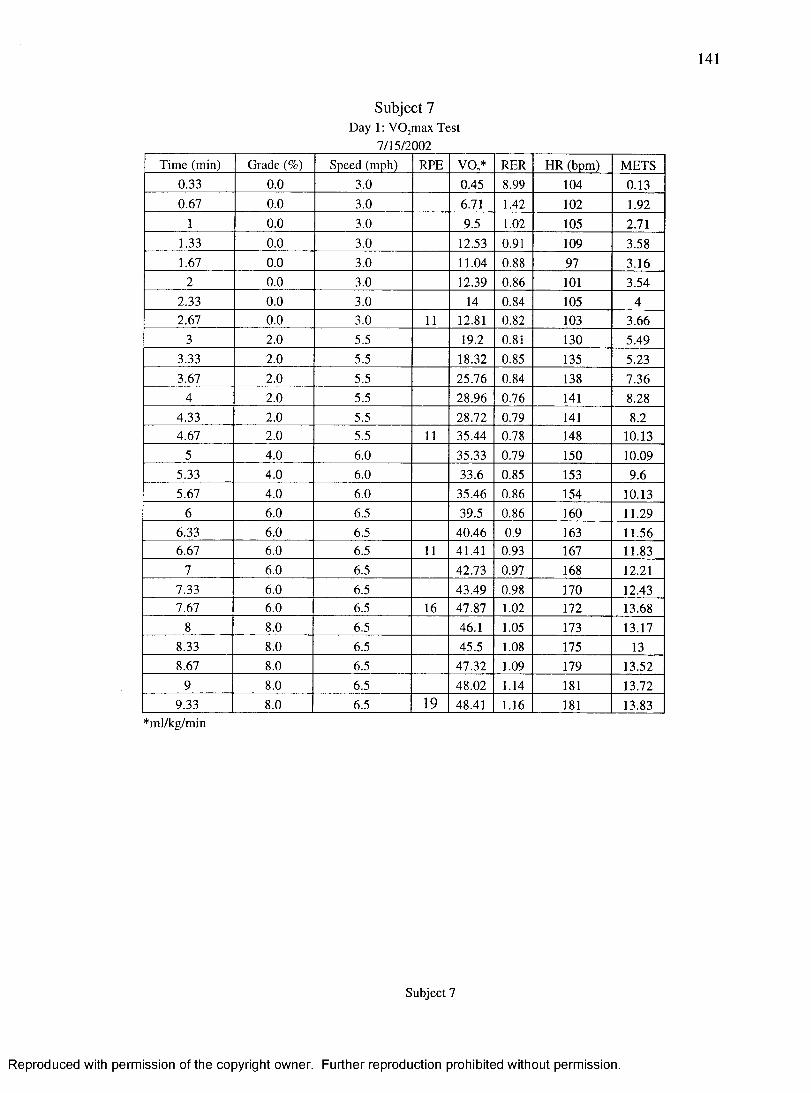
141
"ml/kg/min
Subject 7Day 1: VO^max Test
7/15/2002Time (min) Grade (%) Speed (mph) RPE VO^ RER HR (bpm) METS
0.33 0.0 3.0 0.45 839 104 0.130.67 0.0 3.0 6.71 1.42 102 1.92
1 0.0 3.0 9.5 1.02 105 2.711.33 0.0 3.0 12.53 0.91 109 3.581.67 0.0 3.0 11.04 0.88 97 3.16
2 0.0 3.0 12.39 036 101 3.54233 0.0 3.0 14 0.84 105 42^7 0.0 3.0 11 12.81 032 103 3.66
3 2.0 5.5 19.2 0.81 130 5.49333 2.0 5.5 18.32 0.85 135 5.233^7 2.0 5.5 25.76 0.84 138 7.36
4 2.0 5.5 28.96 0.76 141 8J3433 2.0 5.5 28.72 0.79 141 8.24.67 2.0 5.5 11 35.44 0.78 148 10.13
5 4.0 6.0 3533 0.79 150 10.09533 4.0 6.0 33^ 0,85 153 9.65.67 4.0 6.0 35.46 0.86 154 10.13
6 6.0 6.5 39.5 0.86 160 11.29633 6.0 6.5 40.46 0.9 163 11.56667 6.0 6.5 11 41.41 0.93 167 11.83
7 6.0 6.5 42.73 0.97 168 12.217.33 6.0 6.5 43.49 038 170 12.437.67 6.0 6.5 16 47.87 1.02 172 13.68
8 8.0 6.5 46.1 1.05 173 13.17833 8.0 6.5 45.5 1.08 175 138.67 8.0 6.5 47.32 1.09 179 13.52
9 8.0 6.5 4832 1.14 181 13.72933 8.0 6.5 19 48.41 1.16 181 13.83
Subject 7
Reproduced with permission of the copyright owner. Further reproduction prohibited without permission.
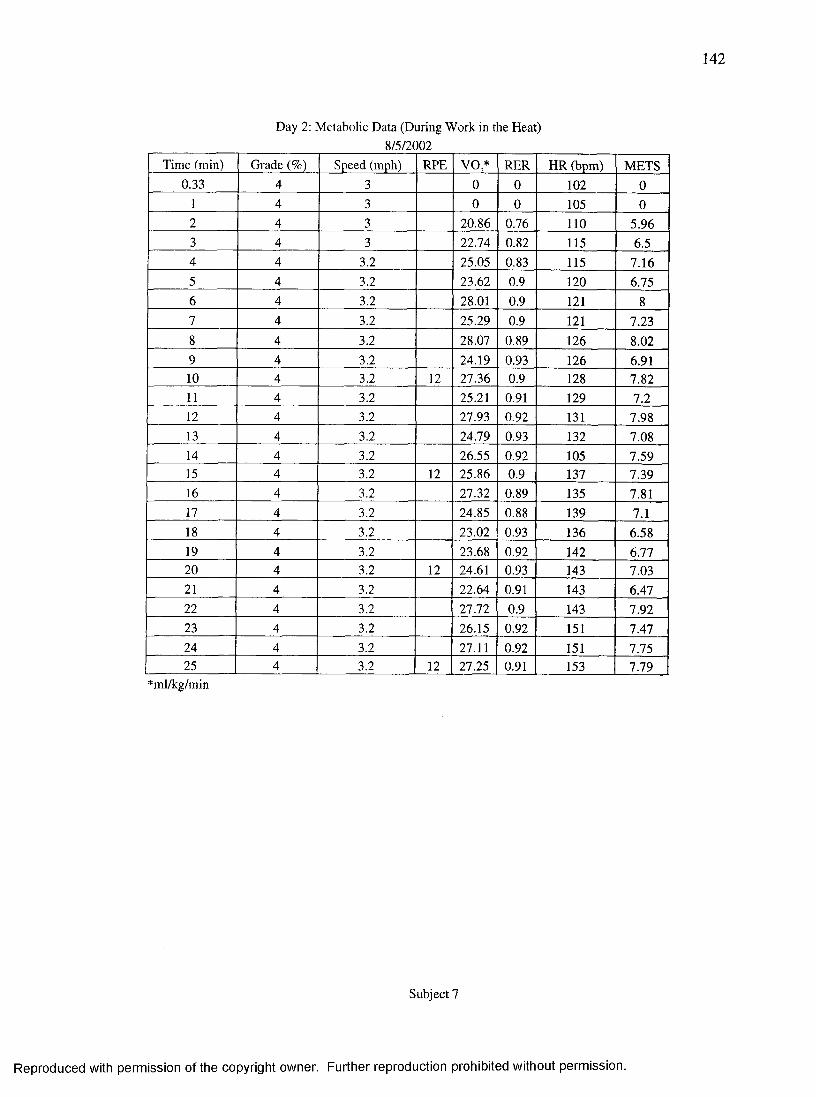
142
*ml/kg/min
Day 2: Metabolic Data (During Work in the Heat)8/5/2002
Time (min) Grade (%) Speed (mph) RPE VO^ RER HR (bpm) METS0.33 4 3 0 0 102 0
1 4 3 0 0 105 02 4 3 2&86 0.76 110 5.963 4 3 22.74 0.82 115 6.54 4 3.2 25.05 0.83 115 7.165 4 3.2 23^2 0.9 120 6.756 4 3.2 28.01 0.9 121 87 4 3.2 25.29 0.9 121 7.238 4 3.2 28.07 0^9 126 8.029 4 3.2 24.19 043 126 6.9110 4 3.2 12 0.9 128 7.8211 4 3.2 25.21 0.91 129 7.212 4 3.2 27.93 0.92 131 7.9813 4 3.2 24.79 0.93 132 7.0814 4 3.2 26.55 0.92 105 7.5915 4 3.2 12 25.86 0.9 137 7.3916 4 3.2 27.32 0.89 135 7.8117 4 3.2 24^5 0.88 139 7.118 4 3.2 23.02 0.93 136 6.5819 4 3.2 23.68 0.92 142 6.7720 4 3.2 12 24.61 0.93 143 7.0321 4 3.2 22.64 0.91 143 6.4722 4 3.2 27.72 0.9 143 7.9223 4 3.2 26.15 0.92 151 7.4724 4 3.2 27.11 0.92 151 7.75
. . . 2 5 4 3.2 12 27.25 0.91 153 7.79
Subject 7
Reproduced with permission of the copyright owner. Further reproduction prohibited without permission.
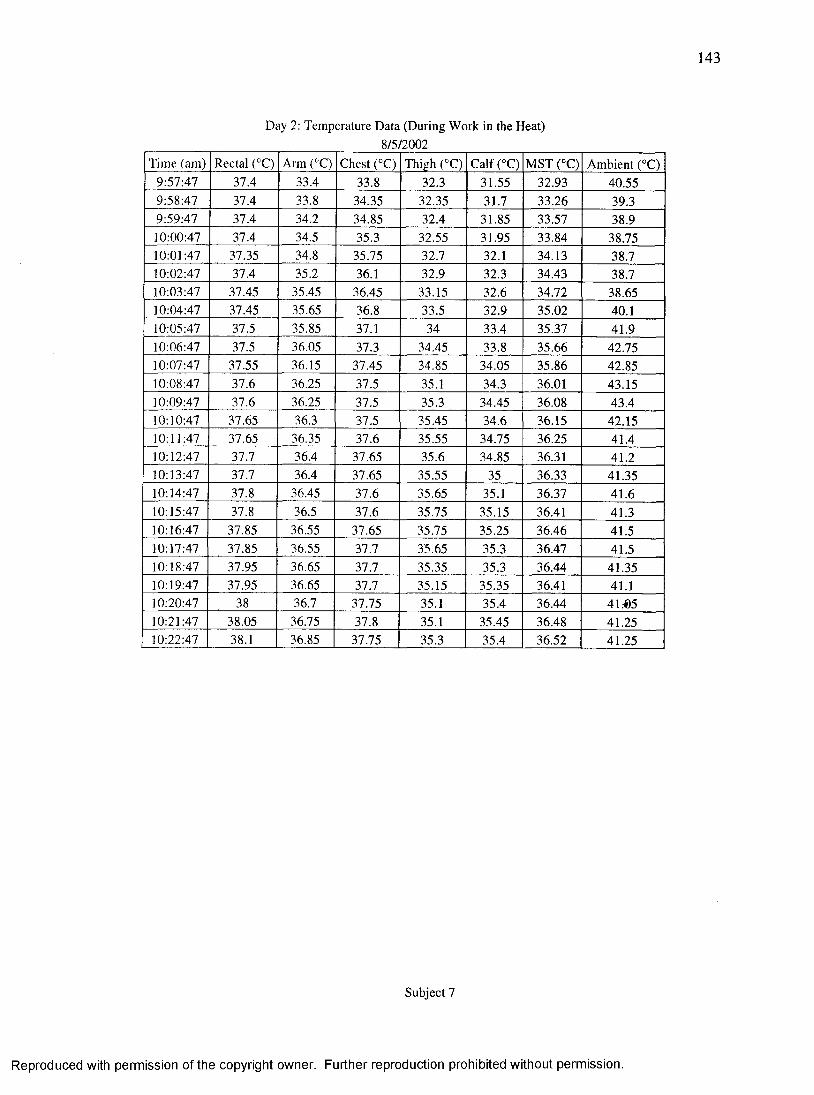
143
Day 2; Temperature Data (During Work in the Heat)8/5/2002
Time (am) Rectal (°C) Arm (°C) Chest (°C) Thigh (°C) Calf(°C) MST (°C) Ambient (°C)9:57:47 37.4 331 333 323 31.55 32.93 40.559:58:47 37.4 333 3435 32 35 31.7 3326 3939:59:47 37.4 34^ 34.85 321 31.85 33.57 38.910:00:47 37.4 34.5 35.3 32.55 31.95 33.84 38.7510:01:47 3735 343 35.75 323 32.1 34.13 38.710:02:47 37.4 35^ 36.1 329 323 34.43 38.710:03:47 37.45 35.45 36.45 33.15 323 34.72 38.6510:04:47 37.45 35.65 363 33.5 329 35.02 40.110:05:47 37.5 35 35 37.1 34 331 35.37 41.910:06:47 37.5 36.05 37.3 34.45 333 35.66 42.7510:07:47 37.55 36.15 37.45 3435 34.05 3386 42.8510:08:47 37.6 3&25 37.5 35.1 343 36.01 43.1510:09:47 37.6 3&25 37.5 35.3 34.45 3608 43110:10:47 37.65 363 37.5 35.45 343 36.15 42.1510:11:47 37.65 36 35 37.6 35.55 34.75 36.25 41110:12:47 37.7 36.4 37.65 35.6 34.85 36.31 41.210:13:47 37.7 361 37.65 35.55 35 3633 41.3510:14:47 373 3615 37.6 35.65 35.1 36.37 41.610:15:47 373 36.5 37.6 35.75 35.15 3611 41.310:16:47 3735 3635 37.65 35.75 35.25 3616 41.510:17:47 37.85 3655 37.7 3535 35.3 36.47 41.510:18:47 37.95 3635 37.7 3535 35.3 36.44 41.3510:19:47 37.95 3635 37.7 35.15 3535 3611 41.110:20:47 38 36.7 37.75 35.1 351 36.44 41.0510:21:47 38.05 36.75 373 35.1 35.45 3618 41.2510:22:47 381 3635 37.75 353 351 36.52 41.25
Subject 7
Reproduced with permission of the copyright owner. Further reproduction prohibited without permission.
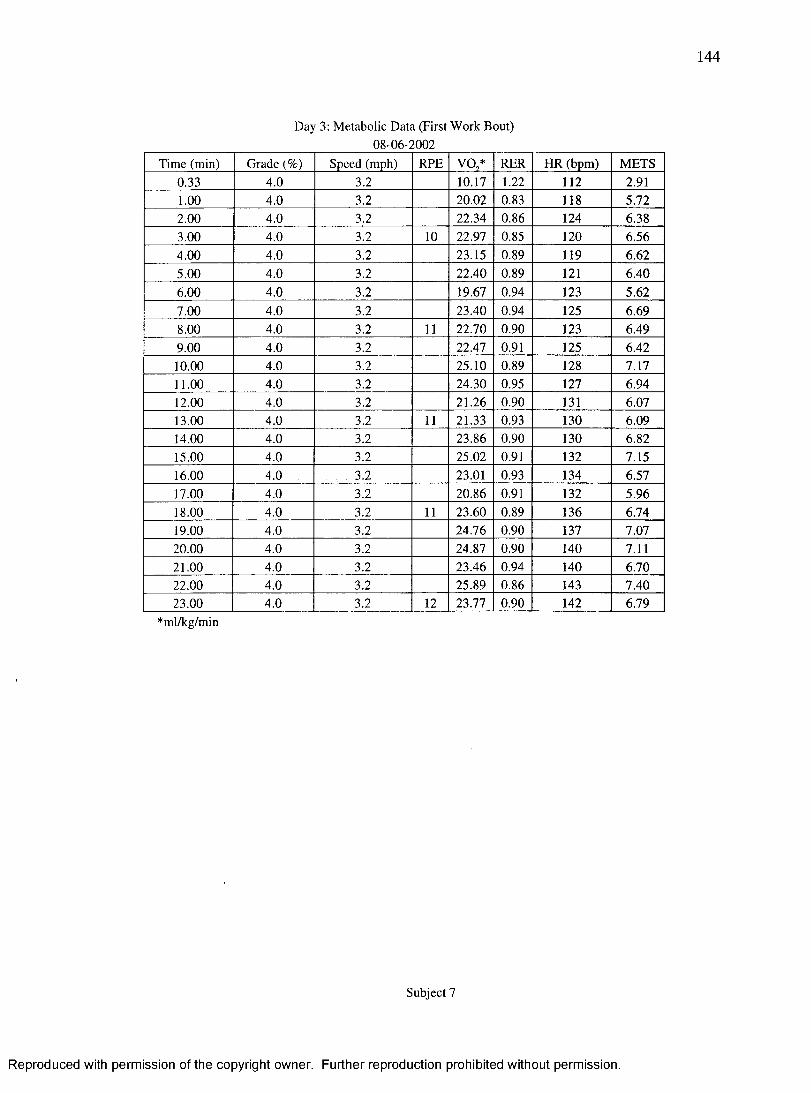
144
*ml/kg/min
Day 3: Metabolic Data (First Work Bout)08-06-2002
Time (min) Grade (%) Speed (mph) RPE VO,* RER HR (bpm) METS0.33 4.0 3.2 10.17 1.22 112 2.911.00 4.0 3.2 20.02 0.83 118 5.722.00 4.0 3.2 2234 0.86 124 6.383.00 4.0 3.2 10 22.97 085 120 6.564.00 4.0 3.2 23.15 0.89 119 6.625.00 4.0 3.2 22.40 0.89 121 6.406.00 4.0 3.2 19.67 0.94 123 5.627.00 4.0 3.2 23.40 0.94 125 6.698.00 4.0 3.2 11 22.70 0.90 123 6.499.00 4.0 3.2 22.47 0.91 125 6.4210.00 4.0 3.2 25.10 089 128 7.1711.00 4.0 3.2 24.30 0.95 127 6.9412.00 4.0 3.2 21.26 0.90 131 6.0713.00 4.0 3.2 11 21.33 0.93 130 6.0914.00 4.0 3.2 23.86 0.90 130 6.8215.00 4.0 3.2 25.02 0.91 132 7.1516.00 4.0 3.2 23.01 0.93 134 6.5717.00 4.0 3.2 0.91 132 5.9618.00 4.0 3.2 11 23.60 0.89 136 6.7419.00 4.0 3.2 24.76 0.90 137 7.0720.00 4.0 3.2 24.87 0.90 140 7.1121.00 4.0 3.2 23.46 0.94 140 6.7022.00 4.0 3.2 25.89 086 143 7.4023.00 4.0 3.2 12 23.77 0.90 142 6.79
Subject 7
Reproduced with permission of the copyright owner. Further reproduction prohibited without permission.
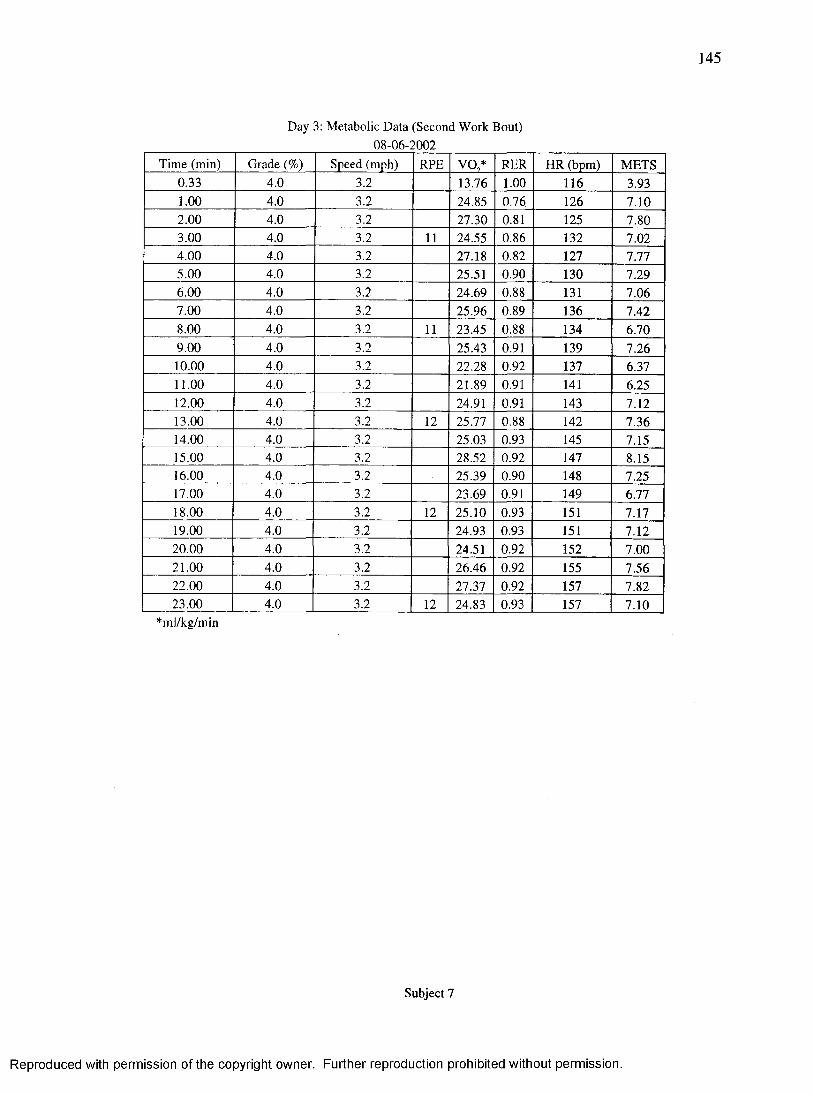
145
*ml/kg/min
Day 3: Metabolic Data (Second Work Bout)08-06-2002
Time (min) Grade (%) Speed (mph) RPE VO,* RER HR (bpm) METS0.33 4.0 3.2 13.76 1.00 116 3431.00 4.0 3.2 24.85 0.76 126 7.102.00 4.0 3.2 27.30 0.81 125 7.803.00 4.0 3.2 11 24.55 0.86 132 7.024.00 4.0 3.2 27.18 0^2 127 7.775.00 4.0 3.2 25.51 0.90 130 7.296.00 4.0 3.2 24.69 088 131 7.067.00 4.0 3.2 25.96 0.89 136 7.428.00 4.0 3.2 11 23.45 088 134 6.709.00 4.0 3.2 2 5 .4 ^ 0.91 139 7.2610.00 4.0 3.2 22.28 0.92 137 6.3711.00 4.0 3.2 21.89 0.91 141 6.2512.00 4.0 3.2 24.91 0.91 143 7.1213.00 4.0 3.2 12 25.77 0.88 142 7.3614.00 4.0 3.2 25.03 0.93 145 7.1515.00 4.0 3.2 2&52 0.92 147 8.1516.00 4.0 3.2 25.39 0.90 148 7.2517.00 4.0 3.2 23 69 0.91 149 6.7718.00 4.0 3.2 12 25.10 0.93 151 7.1719.00 4.0 3.2 24.93 0.93 151 7.1220.00 4.0 3.2 24.51 0.92 152 7.0021.00 4.0 3.2 26.46 042 155 7.5622.00 4.0 3.2 27.37 042 157 7.8223.00 4.0 3.2 12 24.83 0.93 157 7.10
Subject 7
Reproduced with permission of the copyright owner. Further reproduction prohibited without permission.
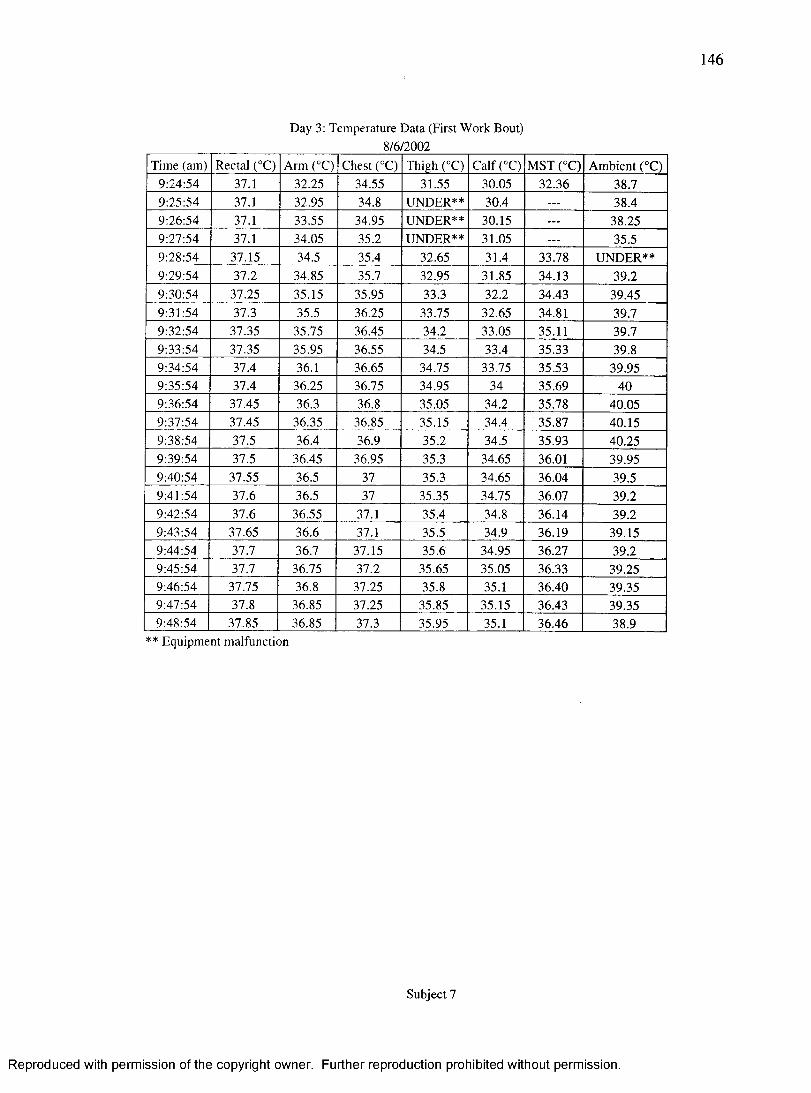
146
Day 3: Temperature Data (First Work Bout)8/6/2(X)2
Time (am) Rectal (°C) Arm (°C) Chest (°C) Thigh (°C) Calf(°C) MST (°C) Ambient (°C)9:24:54 37.1 32.25 34.55 31.55 30.05 32.36 38.79:25:54 37.1 32.95 343 UNDER** 30.4 -- 38.49:26:54 37.1 33.55 34.95 UNDER** 30.15 -- 38.259:27:54 37.1 34.05 353 UNDER** 31.05 -- 35.59:28:54 37.15 34.5 35.4 32.65 31.4 3178 UNDER**9:29:54 37.2 34.85 35.7 3245 31.85 34.13 39.29:30:54 37.25 35.15 35.95 333 3Z2 34.43 39.459:31:54 373 35.5 3635 3335 32.65 34.81 39.79:32:54 37.35 35.75 36.45 34.2 33.05 35.11 39.79:33:54 3735 35.95 36.55 34.5 314 35.33 39.89:34:54 37.4 36.1 36.65 34.75 33.75 35.53 39.959:35:54 37.4 3625 36.75 34.95 34 35.69 409:36:54 37.45 363 363 35.05 34.2 35.78 40.059:37:54 37.45 3635 36.85 35.15 34.4 35.87 40.159:38:54 373 36.4 364 35.2 34.5 35.93 40.259:39:54 37.5 36.45 36.95 35.3 34.65 36.01 39.959:40:54 37.55 36.5 37 35.3 34.65 36.04 39.59:41:54 373 363 37 35.35 34.75 36.07 39.29:42:54 37.6 3635 37.1 35.4 34.8 36.14 39.29:43:54 37.65 366 37.1 35.5 34.9 36.19 39.159:44:54 37.7 363 37.15 35.6 34.95 36.27 39.29:45:54 37.7 36.75 37.2 35.65 35.05 36.33 39.259:46:54 37.75 363 37.25 353 35.1 36.40 39.359:47:54 373 3635 37.25 35.85 35.15 36.43 39.359:48:54 3735 3635 37.3 35.95 35.1 36.46 319■ Equipment malfunction
Subject 7
Reproduced with permission of the copyright owner. Further reproduction prohibited without permission.
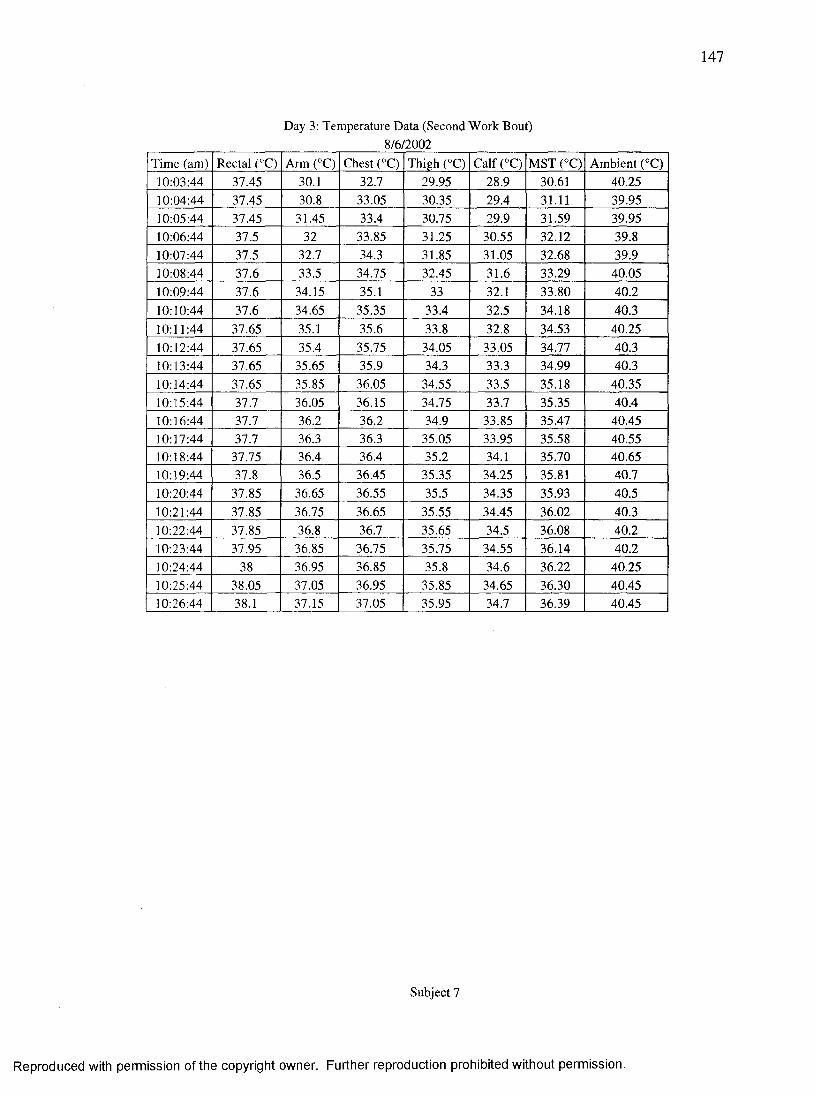
147
Day 3: Temperature Data (Second Work Bout)8/6/2002
Time (am) Rectal (°C) Arm (°C) Chest (°C) Thigh (°C) Calf(°C) MST (°C) Ambient (°C)10:03:44 37.45 30.1 32.7 29.95 28.9 30.61 40.2510:04:44 37.45 3&8 33.05 30.35 29.4 31.11 39.9510:05:44 37.45 31.45 33.4 30.75 294 31.59 39.9510:06:44 37.5 32 3335 3135 30.55 32.12 39410:07:44 37.5 32.7 343 31.85 31.05 3268 39.910:08:44 37.6 3 3 j 34.75 32A5 31.6 33.29 40.0510:09:44 37.6 34.15 35.1 33 32.1 33.80 40.210:10:44 37.6 34.65 35.35 314 323 34.18 40.310:11:44 37.65 35.1 353 333 323 34.53 40.2510:12:44 37.65 35.4 35.75 34.05 33.05 34.77 40.310:13:44 37.65 35 65 35.9 343 333 34.99 40.310:14:44 37.65 35 85 36.05 34.55 33.5 35.18 40.3510:15:44 37.7 36.05 36.15 34.75 33.7 35.35 40.410:16:44 37.7 3&2 363 34.9 3335 35.47 40.4510:17:44 37.7 363 363 35.05 3345 35.58 40.5510:18:44 37.75 36.4 36.4 35.2 34.1 35.70 40.6510:19:44 3T8 363 36.45 3535 3435 35.81 40.710:20:44 37.85 3635 36.55 35.5 3435 35.93 40.510:21:44 3T85 36.75 36.65 35.55 34.45 36.02 40.310:22:44 3T85 363 36.7 35.65 34.5 36.08 40.210:23:44 3T95 3635 36.75 35.75 34.55 36.14 40.210:24:44 38 3&95 3635 353 34.6 3&22 40.2510:25:44 3&05 37.05 36.95 35 35 34.65 36.30 40.4510:26:44 38T 37.15 37.05 35.95 34.7 3649 40.45
Subject 7
Reproduced with permission of the copyright owner. Further reproduction prohibited without permission.
BIBLIOGRAPHY
Abeles, F.J., Del Vecchio,R.J., & Himel, V.H. (1973). A fire fighter’s integrated life protection system. Phase 1: Design and performance requirements. New York: Grumman Aerospace Corporation.
Adams, T.D., Yanowitz, F.G., Chandler, S., Specht, P., Lockwood, R., & Yeh, M.P. (1986). A study to evaluate and promote total fitness among fire fighters.Journal of Sports Medicine & Physical Fitness. 26(4), 337-345.
Adolf, E.F., & Associates. (1947). Physiology of Man in the Desert. New York: Interscience.
Agostoni, P.G., Wasserman, K., Perego, B.P., Guazzi, M., Cattadori, G., Palermo, P., Lauri, G., & Marenzi, G. (2000). Non-invasive measurement of stroke volume during exercise in heart failure patients. Clinical Science. 98, 545-551.
Anderson, G.S., Ward, R., & Mekjavic, I B. (1995). Gender differences in physiological reactions to thermal stress. European Journal of Applied Physiology and Occupational Physiology, 71(2-3), 95-101.
Aoyagi, Y., McLellan, T.M., & Shepard, R.J. (1995). Determination of body heat storage in clothing: Calorimetry vs. thermometry. European Journal of Applied Physiology. 71. 197-206.
Aoyagi, Y., McLellan, T.M., & Shephard, R.J. (1998). Effects of endurance training and heat acclimation on psychological strain in exercising men wearing protective clothing. Ergonomics. 41(3). 328-357.
Aoyagi, Y., McLellan, T.M., & Shephard, R.J. (1995). Effects of 6 versus 12 days of heat acclimation on heat tolerance in lightly exercising men wearing protective clothing. European Journal of Applied Physiology. 71. 187-196.
Armstrong, L.E., Hubbard, R.W, Szlyk, P.C., Matthew, W.T, & Sills, I.V. (1985). Voluntary dehydration and electrolyte losses during prolonged exercise in the heat. Aviation. Space, and Environmental Medicine. 56. 765-770.
Astrand, P.O. (1952). Experimental studies of working capacity in relation to sex and age. Copenhagen: Munksgaard, pp. 1-171.
Bahrke, M.S., McSwain, J.A., & O’Connor, J.S. (1981). Eitness program made mandatory. Fire Command. 47. 14-15.
148
Reproduced with permission of the copyright owner. Further reproduction prohibited without permission.

149
Baker, F.C., Mitchell, D., & Driver, H.S. (2001). Oral contraceptives alter sleep and raise body temperature in young women. Pluegers Arch-European Journal of Physiology. 442(5). 729-737.
Baker, S.J., Grice, J., Roby, L., & Matthews, C. (2000). Cardiorespiratory and thermoregulatory response of working in fire-fighter protective clothing in a temperate environment. Ergonomics. 43(9). 1350-1358.
Barnard, R.J. (1975). Fire Fighters: A fit population with ischemic heart disease. Sports Medical Bulletin. 10. 7-8.
Barnard, R.J., & Anthony, D.F. (1980). Effect of health maintenance programs on Los Angeles city firefighters. Journal of Occupational Medicine. 22, 667-669.
Barnard, R.J.,& Duncan, H.W. (1975). Heart rate and ECG responses of fire fighters. Journal of Occupational Medicine. 17(4). 247-250.
Barnard, R.J., Gardner, G.W., Diaco, N.V., MacAlpin, R.N., & Kattus, A. (1973). Cardiovascular responses to sudden strenuous exercise- heart rate, blood pressure and ECG. Journal of Applied Physiology. 34(6). 833-837.
Barnard, R.J., Gardner, G.W., & Diaco, N.V. (1976). “Ischemic” heart disease in fire fighters with normal coronary arteries. Journal of Occupational Medicine. 18(12), 818-820.
Barnard, R.J., Gardner, G.W., Diaco, N.V., & Kattus, A.A. (1975). Near-maximal ECG stress testing and coronary artery disease risk factor analysis in Los Angeles city fire fighters. Journal of Occupational Medicine. 17(11). 693-695.
Bates, J.T. (1987). Coronary artery disease deaths in the Toronto fire department. Journal of Occupational Medicine. 29(2). 132-135.
Bilzont, J.L., Scarpello, E.G., Smith, C.V., Ravenhill, N.A., & Rayson, M.P. (2001). Characterization of the metabolic demands of simulated shipboard royal navy fire-fighting tasks. Ergonomics. 44(8). 766-780.
Bittel, J., & Henane, R. (1975). Comparison of thermal exchanges in men and women under neutral and hot conditions. Journal of Physiology. 250. 475-489.
Blanoff, T. (1976). Firefighter mortality report. Washington DC: International Association of Firefighters.
Boon, D.J., & Marotta, S.F. (1964). Environmental stresses and femoral arterial blood flow. Journal of Physiology. 19(3). 472-478.
Reproduced with permission of the copyright owner. Further reproduction prohibited without permission.
150
Borg, G. (1998). Borg’s perceived exertion and pain scales. Champaign, IL; Human Kinetics.
Borg, G. (1970). Perceived exertion as an indicator of somatic stress. Scandinavian Journal of Rehabilitative Medicine, 2-3, 92-98.
Brandt-Rauf, P.W., Fallon, L.F., Jr., Tarantini, J., Idema, C., & Andrews, L. (1988). Health hazards of fire fighters: Exposure assessment. British Journal of Industrial Medicine. 45(9), 606-612.
Brickman, C.P., Jr. (1999). Fit-testing for firefighters. Occupational Health and Safety. 68(1). 56-58.
Brouha, L., Smith, P.E. Jr., DeLanne, R., & Max field, M.E. (1961). Physiological reactions of men and women during muscular activity and recovery in various environments. Journal of Applied Physiology. 16, 133-140.
Brown, W., & Sargent U, F. (1965). Hidromeiosis. Archives of Environmental Health. 11. 422-453.
Brownlie, L., Brown, S., Diewert, G , Good, P., Holman, G., Laue, G., & Banister, E. (1985). Cost-effective selection of fire fighter recruits. Medicine & Science in Sports & Exercise. 17. 661-666.
Burse, R. (1979). Sex differences in human thermoregulatory response to heat and cold stress. Human Factors. 21(6). 687-699.
Buskirk, E.R., lampietro, P.F., & Bass, D.E. (1958). Work performance after dehydration: effects of physical conditioning and heat acclimation. Journal of Applied Physiology. 12. 189-194.
Byrd, R., & Collins, M. (1980). Physiologic characteristics of fire fighters.American Corrective Therapy Journal. 34(4). 106-109.
Cadarette, B.S., Sawka, M.N., Toner, M.M., & Pandolf, K.B. (1984). Aerobicfitness and the hypohydration response to exercise-heat stress. Aviation. Space & Environmental Medicine. 55(6). 507-512.
Cady, L.D., Bischoff, D.P., O’Connell, E.R., Thomas, P.C., & Allan, J.H. (1979). Strength and fitness and subsequent back injuries in firefighters. Journal of Occupational Medicine, 21. 269-272.
Cady, L.D., Thomas, P.C., & Karwasky, R.J. (1985). Program for increasing health and physical fitness of fire fighters. Journal of Occupational Medicine. 27(2). 110-114.
Reproduced with permission of the copyright owner. Further reproduction prohibited without permission.
151
Calvert, G.M., Merling, J.W., & Burnett, C.A. (1999). Ischemic heart disease mortality and occupation among 16- to 60-year old males. Journal of Occupational and Environmental Medicine. 41(11). 960-966.
Carter, J.B., Banister, E.W., & Morrison, J.B. (1999). Effectiveness of rest pauses and cooling in alleviation of heat stress during simulated fire fighting activity. Ergonomics. 42(2). 299-313.
Cheung, S.S., & McLellan, T.M. (1998a). Influence of heat acclimation, aerobic fitness and hydration effects on tolerance during uncompensable heat stress. Journal of Applied Phvsiologv. 84(5). 1731-1739.
Cheung, S.S., & McLellan, T.M. (1998b). Influence of hydration status and fluid replacement on heat tolerance while wearing NBC protective clothing. European Journal of Applied Physiology, 77, 139-148.
Cheung, S.S., McLellan, T.M.,& Tenaglia, S. (2000). The thermophysiology of uncompensable heat stress. Sports Medicine. 29(5). 329-359.
Choi, B.C. (2000). A technique to re-assess epidemiologic evidence in light of the health worker effect: the case of fire fighting and heart disease. Journal of Occupational & Environmental Medicine. 42(10). 1021-1034.
Cohen, J.S., & Gisolfi, C.V. (1982). Effects of interval training on work-heattolerance of young women. Medicine and Science in Sports and Exercise. 14(1). 46-52.
Consolazio, C., Matoush, L., Nelson, R., Torres, J., & Issac, G. (1963).Environmental temperature and energy expenditures. Journal of Applied Phvsiologv, 18. 65-68.
Considine, W., Misner, J.E, Boileau R.A., Pounian, C., Cole, J., & Abbatiello, A. (1976). Developing a physical performance test battery for screening Chicago firefighter applicant. Public Personnel Management. 7-14.
Costill, D.L. (2001). Gastric emptying of fluids during exercise. In: Gisolfi, C.V., & Lamb, D R. (Eds.), Perspectives in exercise and sports medicine, vol. 3: Eluid Homeostasis During Exercise (pp. 97-127). Indianapolis, IN: Benchmark Press.
Costill, D.L. (1977). Sweating: its composition and effects on body fluids. In: The Marathon: Physiological, Medical. Epidemiological and Psychological Studies. Milvy, P. (ed.). New York: New York Academy of Sciences, 160-174.
Costill, D.L. (1984). Water and electrolyte requirements during exercise. Clinics Sports Medicine. 3. 639-648.
Reproduced with permission of the copyright owner. Further reproduction prohibited without permission.
152
Costill, D.L., & Saltin, B. (1974). Factors limiting gastric emptying during rest and exercise. Journal of Applied Phvsiologv. 37, 679-683.
Cotter, J.D., Sleivert, G.G., Roberts, W.S., & Febbraio, M.A. (2001). Effect of precooling, with and without thigh cooling, on strain and endurance exercise performance in the heat. Comparative Biochemistry & Physiology Part A.128(4). 667-677.
Coyle, E.E., & Hamilton, M. (2001). Eluid replacement during exercise: Effects on physiological homeostasis and performance. In: Gisolfi, C.V., & Lamb, D R. (Eds.), Perspectives in exercise and sports medicine. Vol. 3: Fluid homeostasis during exercise (pp. 281-302). Indianapolis, IN: Benchmark Press.
Coyle, E.F., & Montain, S.J. (2001). Thermal and cardiovascular responses to fluid replacement during exercise. In: Gisolfi, C.V., & Lamb, D R. (Eds.), Perspectives in exercise and sports medicine, vol. 6: Exercise. Heat, and Thermoregulation (pp. 179-224). Indianapolis, IN: Benchmark Press.
Craig, E.N., & Cummings, E.G. (1966). Dehydration and muscular work. Journal of Applied Physiology, 21, 670-674.
Davis, J.A., & Wilmore, J.H. (1979). Validation of a bench stepping test forcardiorespiratory fitness classification of emergency service personnel. Journal of Occupational Medicine, 21. 671-673.
Davis, P.O., Biersner, R.J., Barnard, R.J., & Schamadan, J. (1982). Medical evaluation of fire fighters: How fit are they for duty? Postgraduate Medicine. 72(2), 241-245, 248.
Davis, P.O., & Curtis, A.V. (1982). The fire fighters survival manual: A guide to physical fitness, p.3. National Fire Protective Association, Batterymarch Park, Quincy, MA 02269.
Davis, P.O., & Dotson, C O. (1987). Job performance testing: an alternative to age discrimination. Medicine & Science in Sports & Exercise. 19(2). 179-185.
Davis, P.O., & Dotson, C.O. (1987). Physiological aspects of fire fighting. Eire Technology. 23. 280-291.
Davis, P.O., Dotson, C O., & Santa Maria, D.L. (1978). The physical requirements of fire fighters. Eire Command, p.36-38.
Davis, P.O., Dotson, C O., & Santa Maria, D.L. (1982). Relationship between simulated fire fighting tasks and physical performance measures. Medicine & Science in Sports & Exercise. 14(1). 65-71.
Reproduced with permission of the copyright owner. Further reproduction prohibited without permission.
153
Davis, P.O., & Stark, A.R. (1980). Excess body fat - not age viewed as a greater culprit in the fitness decline. Eire Engineering, 13, 33-37.
Dawson, B. (1994). Exercise training in sweat clothing in cool conditions to improve heat tolerance. Sports Medicine. 17(4). 233-244.
Dibbs, E., Thomas, H E. Jr., Weiss, S.T., & Sparrow, D. (1982). Eire fighting and coronary heart disease. Cireulation, 65(5), 943-946.
Dill, D.B., Hall, E.G., & Edwards, H.T. (1938). American Journal of Phvsiologv. 123.412-419.
Donovan, K.J., & McConnell, A.K. (1999). Do fire-fighters develop specificventilatory responses in order to cope with exercise whilst wearing self-contained breathing apparatus? European Journal of Applied Phvsiologv & Occupational Phvsiologv. 80(2). 107-112.
Doolittle, T.L. (1979). Validation of physical requirements for firefighters. Seattle: Seattle Eire Department.
DuBois, D., & DuBois, E.E. (1916). A formula to estimate the approximate surface area if height and weight be known. Archives of Internal Medicine. 17. 863-871.
Duncan, H.W., Gardner, G.W., & Barnard, R.J. (1979). Physiological responses of men working in fire fighting equipment in the heat. Ergonomics. 22, 521-527.
Faff, J., & Tutak, T. (1989). Physiological responses to working with firefighting equipment in the heat in relation to subjective fatigue. Ergonomics. 32. 629-638.
Febbraio, M.A., Snow, R.J., Hargraves, M., Stathis, C.G., Martin, I.K., & Carey, M.F. (1994). Muscle metabolism during exercise and heat stress in trained men: effect of acclimation. Journal of Applied Phvsiologv. 76(2). 589-597.
Fein, J.T., Haymes, E.M., & Buskirk, E.R. (1975). Effects of daily and intermittent exposures on heat acclimation of women. International Journal of Biometeorology, 19(1). 41-52.
Einberg, G.P., Katz, M., Gazit, H., & Berlyne, G.M. (1974). Plasma renin activity after acute heat exposure in nonacclimatized and naturally acclimatized man. Journal of Applied Phvsiologv. 36(5), 519-523.
Foss, M.L., & Keteyian, S.J. (1998). Fox’s physiological basis for exercise and sport. Boston: Mc-Graw Hill.
Fox, R.H., Goldsmith, R., Hampton, R.G., & Hunt, T.J. (1967). Heat acclimatization by controlled hyperthermia in hot-dry and hot-wet climates. Journal of Applied Phvsiologv. 22(1). 39-46.
Reproduced with permission of the copyright owner. Further reproduction prohibited without permission.
154
Fox, R.H., Lofstedt, B E., Woodward, P.M., Eriksson, E., & Werkstrom, B. (1969). Comparison of thermoregulatory function in men and women. Journal of Applied Phvsiologv. 26(4). 444-453.
Foxdal, P., Sjodin, A., Ostman, B., & Sjodin, B. (1991). The effect of different blood sampling sites and analyses on the relationship between exercise intensity and 4.0 mmol/L blood lactate concentrations. European Journal of Applied Phvsiologv and Occupational Phvsiologv. 63(1). 52-54.
Eranklin, B.A., Whaley, M.H., & Howley, E.T. (Eds.). (2000). American College of Sports Medicine Guidelines for Exercise Testing and Prescription (6*'’ ed.). Philadelphia: Lippincott Williams & Wilkins.
Freedman, R.R. Physiology of hot flashes. (2001). American Journal of Human Biology. 13(4). 453-464.
Friel, J.K., & Stones, M. (1992). Firefighters and heart disease. American Journal of Public Health. 82(8). 1175-1176.
Ftaiti, F., Duflot, J.C., Nicol, C., & Grelot, L. (2001). Tympanic temperature and heart rate changes in firefighters during treadmill runs performed with different fireproof jackets. Ergonomics. 44(5). 502-512.
Fritzsche, R.G., Switzer, T.W., Hodgkinson, B.J., & Coyle, E.F. (1999). Stroke volume decline during prolonged exercise is influenced by the increase in heart rate. Journal of Applied Phvsiologv. 86(3). 799-805.
Frye, A.J., & Kamon, E. (1983). Sweating efficiency in acclimated men and women exercising in humid and dry heat. Journal of Applied Phvsiologv, 54. 972-977.
Gatorade Sports Science Institute. (2002). Gatorade: Beverage Comparison Chart [Pamphlet]. Chicago: Stokely-Van Camp, Inc.
Gavhed, C., & Holmer, I. (1989). Thermoregulatory responses of firemen to exercise in the heat. European Journal of Applied Phvsiologv. 59. 115-122.
Geladas, N., & Banister, E.W. (1988). Effect of cold gas inhalation on core temperature in exercising subjects under heat stress. Journal of Applied Phvsiologv. 64. 2381-2387.
Gerace, T.A., & George, V.A. (1996). Predictors of weight increases over 7 years: fire-fighters and paramedics. Preventive Medicine. 25(5). 593-600.
Gerkin, D. (1995). Firefighters: fitness for duty. Occupational Medicine. 10(4). 871-876.
Reproduced with permission of the copyright owner. Further reproduction prohibited without permission.

155
Givoni, B., & Goldman, F. (1972). Predicting rectal temperature response to work, environment, and clothing. Journal of Applied Physiology. 32, 812-822.
Gisolfi, C.V. (1991). Effects of cycle exercise on intestinal absorption in humans. Journal of Applied Physiology, 71(6). 2518-2527.
Gledhill, N., & Jamnik, V.K. (1992). Characterization of the physical demands of firefighting. Canadian Journal of Sport Sciences. 17(3). 207-113.
Gledhill, N., & Jamnik, V.K. (1992). Development and validation of a fitnessscreening protocol for firefighter applicants. Canadian Journal of Sport Sciences. 17(3), 199-206.
Glueck, C.J., Kelley, W., Wang, P., Gartside, P.S., Black, D., & Tracy, T. (1996). Risk factors for coronary heart disease among firefighters in Cincinnati.American Journal of Industrial Medicine. 30(3). 331 -340.
Gonzalez-Alonso, J., Calbet, J.A.L., & Nielsen, B. (1999a). Metabolic and thermodynamic responses to dehydration-induced reductions in muscle blood flow in exercising humans. Journal of Phvsiologv. 520. 577-589.
Gonzalez-Alonso, J., Mora-Rodriquez, R. & Coyle, E. (1999b). Supine exercise restores arterial blood pressure and skin blood flow despite dehydration and hyperthermia. American Journal of Phvsiologv. 277. H576-H583.
Gonzalez-Alonso, J., Teller, C., Andersen, S.L., Jensen, E.B., Hyldig, T., & Nielsen, B. (1999c). Influence of body temperature on the development of fatigue during prolonged exercise in the heat. Journal of Applied Phvsiologv. 86(3). 1032-1039.
Gonzalez-Alonso, J., Mora-Rodriquez, R., & Coyle, E. (2000). Stroke volume during exercise: Interaction of environment and hydration. American Journal of Phvsiologv. 278. H321-H330.
Green, J.S., & Crouse, S.F. (1991). Mandatory exercise and heart disease risk in fire fighters. International Archives of Occupational & Environmental Health. 63(1). 51-55.
Griggs, T.R. (1977). The role of exertion as a determinant of carboxyhemoglobin accumulation in firefighters. Journal of Occupational Medicine. 19(11). 759-761.
Guidotti, T.L. (1992a). Absence experience of career firefighters reachingmandatory retirement age. Journal of Occupational Medicine. 34(10). 1018-1022.
Guidotti, T.L. (1992b). Human factors in fire fighting: ergonomic-,cardiopulmonary-, and psychogenic stress-related issues. International Archives of Occupational & Environmental Health. 64(1). 1-12.
Reproduced with permission of the copyright owner. Further reproduction prohibited without permission.
156
Guyton, A.C., & Hall, J.E. (2000). Textbook of medical phvsiologv (10* ed.). Philadelphia; W.B. Saunders Company.
Hagan, R.D., Rarrish, G., & Licciardone, J.C. (1991). Physical fitness is inversely related to heart disease risk; a factor analytic study. American Journal of Preventive Medicine, 7(4). 237-243.
Hamilton, M.T., Alonso, J.G., Montain, S.J., & Coyle, E.F. (1991). Fluidreplacement and glucose infusion during exercise prevents cardiovascular drift. Journal of Applied Phvsiologv, 71. 871-877.
Harvey, O., & Crockett, H E. (1932). Individual differences in temperature changes of women during the course of the menstrual cycle. Human Biology. 4. 453-468.
Haslag, W.M., & Hertzman, A.B. (1965). Temperature regulation in young women. Journal of Applied Phvsiologv. 20. 1283-1288.
Havenith, G., Coenen, J., Kistemaker, L., & Kenney, W.L. (1998). Relevance of individual characteristics for human heat stress response is dependent on exercise intensity and climate type. European Journal of Applied Phvsiologv. 77. 231-241.
Haymes, E.M., Buskirk, E.R., Hodgson, J.L., Lundegren, H.M., & Nicholas, W.C. (1974). Heat tolerance of exercising lean and heavy prepubertal girls. Journal of Applied Phvsiologv. 36. 566-571.
Hocking, C., Silberstein, R.B., Lau, W.M., Stough, C., & Roberts, W. (2001). Evaluation of cognitive performance in the heat by functional brain imaging and psychometric testing. Comparative Biochemistry & Phvsiologv Part A. 128(4). 719-734.
Holmer I. (1995). Protective clothing and heat stress. Ergonomics. 38(1). 166-182.
Hopper, M., Coggan, A., & Coyle, E. (1988). Exercise stroke volume relative to plasma-volume expansion. Journal of Applied Phvsiologv. 64. 404-408.
Horvath, S.M., & Drinkwater, B E. (1982). Thermoregulation and the menstrual cycle. Aviation. Space & Environmental Medicine. 53(8). 790-794.
Horvath, S.M. & Horvath, E C. (1973). The Harvard Fatigue Laboratory: Its history and contributions. Englewood, New Jersey: Prentice-Hall, 149-150.
Hunt, J.N., & Knox, M.T. (1969). Regulation of gastric emptying. In: Handbook of Phvsiologv. IV: Alimentary Canal. Washington D C., American Physiological Society.
Reproduced with permission of the copyright owner. Further reproduction prohibited without permission.
157
Hurley, B.F., Classer, S.P., Phelps, C.P., Anderson, D., Blair, R.C., & Riggs, C.E., Jr.(1980). Cardiovascular and sympathetic responses to in-flight emergency responses among base fire fighters. Aviation, Space & Environmental Medicine. 51(8), 788-792.
Ide, C.W. (2000). A longitudinal study of the evolution of some cardiovascular risk factors during the careers of male firefighters retiring from Strathclyde Fire Brigade from 1985-1994. Scottish Medicine Journal, 45(3), 79-83.
Ide, C.W. (1998). Failing firefighters: a survey of causes of death and ill-health retirement in serving firefighters in Strathclyde, Scotland from 1985-1994. Occupational Medicine (London). 48(6). 381-388.
Dmarinen, R., & Makinen, H. (1992). Heat strain fire-fighting drills. In: W.A. Lotens & G. Havenith (Eds.). Proceedings of the Fifth International Conference on Environmental Ergonomics (pp. 90-91). TNG Institute for Perception, Maastricht.
International Personnel Protection, Inc., Austin, TX. (1998). Eield evaluation of protective clothing effects on fire fighter phvsiologv: predictive capability of total heat loss test. Submitted to lAFF.
Jackson, A.S., Pollock, M L., & Ward, A. (1980). Generalized equations forpredicting body density of women. Medicine and Science of Sports and Exercise. 12,175-182.
Kales, S.N., Aldrich, J.M., Polyhronopoulos, G.N., Leitao, E.G., Artzerounian, D., Gassert, T.H., Hu, H., Kelsey, K.T., Sweet, C., & Christiani, D C. (1999). Correlates of fitness for duty in hazardous material firefighters. American Journal of Industrial Medicine. 36(6). 618-629.
Kales, S.N., & Christiani, D C. (2000). Cardiovascular fitness in firefighters.Journal of Gccupational & Environmental Medicine. 42(5). 467-468.
Kales, S.N., Pentiuc, F., & Christiani, D C. (1994). Pseudoelevation ofcarboxyhemoglobin levels in firefighters. Journal of Gccupational Medicine. 36(7), 752-756.
Kamon, E., & Avellini, B.A. (1976). Physiological limits to work in the heat and evaporative coefficient for women. Journal of Applied Phvsiologv. 41. 71-76.
Kamon E., & Belding, H.S. (1971). Heart rate & rectal temperature relationships during work in hot and humid environments. Journal of Applied Phvsiologv. 31. 472-477.
Reproduced with permission of the copyright owner. Further reproduction prohibited without permission.
158
Kay, B.F., Lund, M.M., Taylor, P.N., & Herbold, N.H. (2001). Assessment of firefighters’ cardiovascular disease-related knowledge and behaviors. Journal of the American Dietetic Association, 101(7), 807-809.
Kenney, W.L. (1985). A review of comparative responses of men and women to heat stress. Environmental Research, 37(1), 1-11.
Kenney, W.L. (1998). Heat flux and storage in hot environments. International Journal of Sports Medicine. 19(2), S92-S95.
Kenney, W.L. (2001). Sports Science Exchange Roundtable; Why don’t athletes drink enough during exercise, and what can be done about it? Gatorade Sport Science Institute. 12(1), 2.
Kenney, W.L, & Anderson, R.K. (1998). Responses of older and younger women to exercise in dry and humid heat without fluid replacement. Medicine and Science in Sports and Exercise. 20(2), 155-160.
Kenney, W.L., Hyde, D.E., & Bernard, T.E. (1993). Physiological evaluation of liquid-barrier, vapor-permeable protective clothing ensembles for work in hot environments. Ameriean Industrial Hvgiene Association. Journal, 54(7). 397- 402.
Kenney, W.L., Lewis, D.A., Armstrong, C.G., Hyde, D.E., Dyksterhouse, T.S.,Fowler, S R., & Williams, D.A. (1998). Psychrometric limits to prolonged work in protective clothing ensembles. American Industrial Hygiene Association. Journal. 49(8). 390-395.
Kenney, W.L., Lewis, D.A., & Hyde, D.E. (1987). Physiologically derived critical evaporative coefficients for protective clothing ensembles. Journal of Applied Physiology. 63(3). 1095-1099.
Kenney, W.L., Mikita, D.J., Havenith, G., Puhl, S.M., & Crosby, P. (1993). Simultaneous derivation of clothing-specific heat exchange coefficients.Medicine and Science in Sports and Exercise. 25(2), 283-289.
Kenney, W.L., Tanersley, C.G., Newswanger, D.L., Hyde, D.E., Phyl, S.M., & Turnera, N.L. (1990). Age and hypohydration independently influence the peripheral vascular response to heat stress. Journal of Applied Phvsiologv. 8. 1902-1908.
Kilbom, A. (1980). Physical work capacity of firemen, with special reference to demands during fire fighting. Scandinavian Journal of Work. Environment & Health. 6(1). 48-57.
Klausen, K., Dill, D.B., Phillips, E.E., Jr., & McGregor, D. (1967). Metabolic reactions to work in the desert. Journal of Applied Phvsiologv. 22(3). 5292-296.
Reproduced with permission of the copyright owner. Further reproduction prohibited without permission.
159
Kranning, K. H, & Gonzalez, R. (1991). Physiological consequences of intermittent exercise during compensable and uncompensable heat stress. Journal of Applied Phvsiologv, 71(6), 2138-2145.
Kuorinka, I., & Korhonen, O. (1981). Firefighters’ reaetion to alarm: an ECG and heart rate study. Journal of Oeeupational Medicine, 23, 762-766.
Ladell, W.S. (1965). Water and salt (sodium chloride) intakes. In: The Phvsiologv of Human Survival, Edholm, O., and Bacharach, A. (Eds.). New York: Academic Press, 235-299).
Leedy, H E., Ismail, A.H., Kessler, W.V., & Christian, J.E. (1965). Relationships between physical performance items and body composition. Research Quarterlv, 3 ^ 158-163.
Lemon, P.W., & Hermiston, R.T. (1977). The human energy cost of fire fighting. Journal of Occupational Medicine. 19(8), 558-62.
Lemon, P.W., & Hermiston, R.T. (1977). Physiological profile of professional fire fighters. Journal of Occupational Medicine. 19(5), 337-340.
Lind, A.R., & Bass, D.E. (1963). Optimal exposure time for development of acclimatization to heat. Fed. Proc.. 22, 704-708.
Loke, J., Farmer, W.C., Matthay, R.A., Virgulto, J.A., & Bouhuys, A. (1976). Carboxyhemoglobin levels in fire fighters. Lung. 154(1). 35-39.
Louhevaara, V., Toumi, T., Korhonen, O., & Jaakkola, J. (1984). Cardiorespiratory effects of respiratory protective devices during exercise in well-trained men. European Journal of Applied Phvsiologv & Oeeupational Phvsiologv. 52. 340- 345.
Louhevaara, V., Toumi, T., Smolander, J., Korhonen, O., Tossavainen, A., & Jaakkola, J. (1985). Cardiorespiratory strain in jobs that require respiratory protection. International Archives of Occupational and Environmental Health. 55, 195-206.
Louhevaara, V., Smolander, J., Tuomi, T., Korhonen, O., & Jaakkola, J. (1985). Effects of an SCBA on breathing pattern, gas exchange and heart rate during exercise. Journal of Occupational Medicine. 27. 213-216.
Louhevaara, V., Smolander, J., Korhonen, O., & Toumi, T. (1986). Effects of industrial respirators on breathing pattern at different work levels. European Journal of Applied Phvsiologv & Occupational Phvsiologv. 55. 142-146.
Louhevaara, V., Smolander, J., Korhonen, O., & Toumi, T. (1986). Maximalworking times with a self-contained breathing apparatus. Ergonomics, 29. 77-85.
Reproduced with permission of the copyright owner. Further reproduction prohibited without permission.
160
Louhevaara, V., Soukainen, J., Lusa, S., Tulppo, M., Tuomi, P., & Kajaste, T.(1994). Development and evaluation of a test drill for assessing physical work capacity of firefighters. International Journal of Industrial Ergonomics, 13, 139- 146.
Louhevaara, V., Umarenen, R., Griefahn, B., Kunemund, C., & Makinen, H. (1995). Maximal physical work performance with European standard based fire- protective clothing system and equipment in relation to individual characteristics. European Journal of Applied Phvsiologv & Occupational Physiology, 71, 223- 229.
Lusa, S., Louhevaara, V., & Kinnunen, K. (1994). Are the job demands on physical work capacity equal for young and aging firefighters? Journal of Occupational Medicine. 36. 70-74.
Lusa, S., Louhevaara, V., Smolander, J., Kivimaki, M., & Korhonen, O. (1993). Physiological responses of fire fighting students during simulated smoke-diving in the heat. American Industrial Hvgiene Association Journal, 54(5). 228-231.
Malley, K.S., Goldstein, A.M., Aldrich, T.K., Kelly, K.J., Weiden, M., Coplan, N., Karwa, M.L., & Prezant, DJ. (1999). Effects of firefighting uniform (modem, modified modern, and traditional) design changes on exercise duration in New York City firefighters. Journal of Occupational and Environmental Medicine. 41(12), 1104-1115.
Manning, J.E., & Griggs, T.R. (1983). Heart rates in fire fighters using light and heavy breathing equipment: similar near-maximal exertion in response to multiple workload conditions. Journal of Occupational Medicine. 25(3), 215-218.
Marcus, E. (1962). Problems in fluid and electrolyte imbalance and their management. The Surgical Clinics of North America, 42, 35-54.
Mastromatteo, E. (1959). Mortality in city firemen. I: A review. Archives of Industrial Health. 20,1-7.
Mastromatteo, E. (1959). Mortality in city firemen. H: A study of mortality in firemen of a city fire department. Archives of Industrial Health. 20. 227-233.
Matticks, C.A., Westwater, J.J., Himel, H.N., Morgan, R.E., & Edlich, R.F. (1992). Health risks to fire fighters. Journal of Burn Care & Rehabilitation. 13(2 pt 1), 223-235.
Maxfield, M E., & Brouha, L. (1963). Validity of heart rate as an indicator of cardiac strain. Journal of Applied Phvsiologv, 18. 1099-1104.
McArdle, W.D., Katch, F.I., & Karch, V.L. (1999). Sports & exercise nutrition. Baltimore: Lippincott Williams & Wilkins.
Reproduced with permission of the copyright owner. Further reproduction prohibited without permission.

161
McLellan, T.M. (2001). The importance of aerobic fitness in determining tolerance to uncompensable heat stress. Comparative Biochemistry & Phvsiologv Part A, 128(4), 691-700.
McLellan, T.M. (1998). Sex-related differences in thermoregulatory responses while wearing protective clothing. European Journal of Applied Phvsiologv and Occupational Phvsiologv. 78(1). 28-37.
McLellan, T.M. & Aoyagi, Y. (1996). Heat strain in protective clothing following hot-wet or hot-dry heat acclimation. Canadian Journal of Applied Phvsiologv. 21(2), 90-108.
Melius, J. (1995). Cardiovascular disease among firefighters. Occupational Medicine. 10(4). 821-827.
Menze, R., McMullen, M.J., White, L.J., & Dougherty, J.M. (1996). Core temperature monitoring of fire fighting during hazardous material training sessions. Prehospital Disaster Medicine. 11(2). 108-111.
Meyer, P., Baro-or, O., MacDougall, D., & Heigenhauser, G. (1992). Sweat electrolyte loss during exercise in the heat; effects of gender and maturation. Medicine and Science in Sports and Exercise. 24. 776-781.
Misner, J.E., Boileau, R.A., Plowman, S.A., Elmore, B.G., Gates, M.A., Gilbert, J.A., & Horswill, C. (1988). Leg power characteristics of female firefighter applicants. Journal of Occupational Medicine. 30(5). 433-437.
Montain, S.J., & Coyle, E.E. (1992). The influence of graded dehydration on hyperthermia and cardiovascular drift during exercise. Journal of Applied Phvsiologv. 73(4). 1340-1350.
Montain, S.J., Sawka, M.N., Cadarette, B.S., Quigley, M.D. & McKay, J.M. (1994). Physiological tolerance to uncompensable heat stress: effects of exercise intensity, protective clothing, and climate. Journal of Applied Phvsiologv, 77. 216-222.
Montain, S.J., Smith, S.A., Matott, R.P., Zientara, G.P., Jolesz, E.A., & Sawka, M.N. (1998). Hypohydration effects on skeletal muscle performance and metabolism:A ^'P MRS study. Journal of Applied Phvsiologv, 84. 1889-1894
Mooneyham, B.J. (1974). What added Weight? Eiremen’s Grapevine, p. 12.
Moran, D.S., Shapiro, Y., Laor, A., Izraeli, S., & Pandolf, K.B. (1999). Can gender differences during exercise-heat stress be assessed by the physiological strain index? American Journal of Phvsiologv. 276 (6 pt 2). R1798-R1804.
Reproduced with permission of the copyright owner. Further reproduction prohibited without permission.
162
Morimoto, T., Slabochova, Z„ Naman, R.K., & Sargent, F. n. (1967). Sex differences in physiological reactions to thermal stress. Journal of Applied Phvsiologv, 22(3). 526-532.
Murray, R. (1995). Fluid needs in hot and cold environments. International Journal of Sport Nutrition. 5. S62-S73.
Nadel, E.R., Mack, G.W., & Nose, H. (2001). Influence of fluid replacement beverages on body fluid homeostasis during exercise and recovery. In: Perspectives in Exercise and Sports Medicine, vol. 3: Fluid Homeostasis during exercise. Gisolfi, C.V., Lamb, D R. (Eds.). Indianapolis, IN: Benchmark Press, 181-198.
Nadel, E.R., Mack, G.W., Nose, H., & Tripathi, A. (1987). Tolerance to severe heat and exercise peripheral vascular responses to body fluid changes. In: Heat stress, phvsical exertion and environment. Hales, J R.S., & Richards, DAB. (Eds.) Amsterdam: Excertpa Medica.
Nadel, E.R., Mack, G.W., & Takamata, A. (2001). Thermoregulation, exercise, and thirst: Interrelationships in humans. In: Perspectives in Exercise and Sports Medicine. Vol. 6: Exercise. Heat, and Thermoregulation. Gisolfi, C.V., Lamb,D R., Nadel, E.R. (Eds.). Traverse City, Ml: Cooper Publishing Group.
Nadel, E.R., Pandolf, K.B., Roberts, M.F., & Stolwijk, J.A. (1974). Mechanisms of thermal acclimation to exercise and heat. Journal of Applied Phvsiologv. 37(4). 515-520.
National Fire Protection Association. (1987). NFPA 1501: Standard on fire department safety officer (1987 ed.). Cincinnati, Ohio: NFPA.
National Fire Protection Association. (1987). NFPA 1500: Standard on fire department occupational safety and health program. Quincy, MA: NFPA.
National Fire Protection Association. (1995). The recommended practice for fire fighting phvsical performance and assessment. Draft Report #158; Quincy: National Fire Protection Association.
Neufer, P.D., Young, A.J., Sawka, M.N. (1989). Gastric emptying during exercise: Effects of heat stress and dehydration. European Journal of Applied and Occupational Phvsiologv. 5 8 ,433-439.
Nielsen, B. (1998). Heat acclimation - Mechanisms of adaptation to exercise in the heat. International Journal of Sports Medicine. 19. S 154-8156.
Nielsen, B., Kubica, R., Bonnesen, A., Rassmussen, I B., Stoklosa, J., & Wilk, B.(1981). Physical work capacity after dehydration and hyperthermia: a comparison of the effect of exercise versus passive heating and sauna and diuretic dehydration. Scandinavian Journal of Sport Science. 3. 2-10.
Reproduced with permission of the copyright owner. Further reproduction prohibited without permission.
163
Nielsen, B., Savard, G., Richter, E.A., Hargreaves, M., & Saltin, B. (1990). Muscle blood flow and muscle metabolism during exercise and heat stress. Journal of Applied Physiology, 69(3), 1040-1046.
Noakes, T.D. (1993). Fluid replacement during exercise. Exercise and Sport Sciences Reviews, 21, 297-330.
Nunneley, S.A. (1978). Physiological responses of women to thermal stress: a review. Medicine and Science in Sports. 10(4). 250-255.
Nose, H., Mack, G.W., Shi, X., Nadel, E.R. (1988). The role of osmolality and plasma volume during rehydration in humans. Journal of Applied Phvsiologv. M (l), 325-331.
O’Connell, E.R., Thomas, P.C., Cady, L.D., & Karwasky, R.J. (1986). Energy costs of simulated stair climbing as a job-related task in fire fighting. Journal of Occupational Medicine. 28(4), 282-284.
Pandolf, K.B. (1998). Time course of heat acclimation and its decay. International Journal of Sports Medicine. 19. S157-S160.
Pandolf, K.B., Cadarette, B.S., Sawka, M.N., Young, A.J., Erancesconi, R.P., & Gonzalez, R.R. (1988). Thermoregulatory responses of middle-aged and young men during dry-heat acclimation. Journal of Applied Phvsiologv. 65(1). 65-71.
Pascoe, D.D., Bellingar, T.A., & McCluskey, B.S. (1994). Clothing and exercise. H. Influence of clothing during exercise/work in environmental extremes. Sports Medicine. 18(2). 94-108.
Payne, W.R., Portier, B., Fairweather, I., Zhou, S., & Snow, R. (1994).Thermoregulatory response to wearing encapsulated protective clothing during simulated work in various thermal environments. American Industrial Hvgiene Association. Journal. 55(6). 529-536.
Pelot, R.P., Dwyer, J.W., Deakin, J.M., & McCabe, J.F. (1999). The design of a simulated forcible entry test for fire fighters. Applied Ergonomics. 30(2). 137- 146.
Piwonka, R.W., & Robinson, S. (1967). Acclimatization of highly trained men to work in severe heat. Journal of Applied Phvsiologv. 22(3), 9-12.
Petrofsky, J.S., & Lind, A.R. (1975). The relationship of body fat content to deep muscle temperature and isometric endurance in man. Clin. Sci. Mol. Med.. 48. 405-412.
Reproduced with permission of the copyright owner. Further reproduction prohibited without permission.
164
Piwonka, R.W., Robinson, S., Gay, V.L., & Manalis, R.S. (1965).Preacclimatization of men to heat by training. Journal of Applied Physiology. 20(3), 379-384.
Prezant, D.J., Kelly, K.J., Malley, K.S., Karwa, M.L., McLaughlin, M.T., Hirschom, R., & Brown, A. (1999). Impact of a modem fire fighting protective uniform on the incidence and severity of bum injuries in New York City fire fighters. Joumal of Occupational and Environmental Medicine. 41, 469-479.
Ramanathan, N.L. (1964). A new weighting system for mean surface temperature of the human body. Journal of Applied Phvsiologv. 19(3). 531-533.
Raven, P.B., Davis, T.O., Shafer, C.L., & Linneburg, A C. (1977). Maximal stress test performance while wearing a self-contained breathing apparatus. Journal of Occupational Medicine. 19. 802-806.
Razmjou, S., & Kjellberg, A. (1992). Sustained attention and serial responding in heat: Mental effort in the control of performance. Aviation. Space and Environmental Medicine. 63. 594-601.
Regan, J.M., Macfarlane, D.J., & Taylor, N.A. (1996). An evaluation of the role of skin temperature during heat adaptation. Acta Phvsiologica Scandinavica. 158, 365-375.
Reindeau, R.P., Welch, B E., Crisp, C.E., Crowley, L.V., Griffin, P.E., & Brockett, J.E. (1958). Relationships of body fat to motor fitness test scores. Research Quarterly, 29, 200-203.
Riklis, E., & Quastel, J. (1958). Effects of cations on sugar absorption by isolated surviving guinea pig intestine. Canadian Journal of Biochemistry and Physiology, 36, 347-362.
Robinson, S. (1949). Physiological adjustments to heat. In: Phvsiologv of Heat Regulation and the Science of Clothing. Philadelphia: Saunders, pp. 193-231.
Robinson, S., & Robinson, A.H. (1954). Chemical Composition of Sweat. Physiological Reviews. 34. 202-220.
Robinson, S., Gerking, S.D., Turrell, E.S., & Kincaid, R.K. (1950). Joumal of Applied Phvsiologv. 2. 654-662.
Rodahl, K., & Guthe, T. (1998). Physiological limitations of human performance in hot environments, with particular reference to work in heat-exposed industry. In: Mekjavic, I B., Banister, E.W., & Morrison, J.B. (Eds.). Environmental Ergonomics, (pp. 227-266). Indianapolis, IN: Benchmark Press.
Reproduced with permission of the copyright owner. Further reproduction prohibited without permission.
165
Romet, T.T., & Frim, J. (1987). Physiological responses to fire fighting activities. European Journal of Applied Phvsiologv & Occupational Phvsiologv. 56(6). 633- 638.
Rowell, L.B. (1986). Circulatory adjustments to dynamic exercise and heat stress: competing controls. In: Human Circulation During Phvsical Stress (pp. 363-406). New York: Oxford University Press, Inc.
Rowell, L.B. (1993). Central circulatory adjustments to dynamic exercise. In: Human cardiovascular control (pp. 187-190). New York: Oxford University Press, Inc.
Rowell, L.B., Blackmon, J R., Martin, R.H., Mazzarella, J.A., & Bruce, R.A. (1965). Hepatic clearance of indocyanine green in man under thermal and exercise stresses. Joumal of Applied Phvsiologv. 20(3). 384-394.
Rowell, L.B., Kraning, K.K., U, Kennedy, J.W., & Evans, T O. (1967). Central circulatory responses to work in dry heat before and after acclimatization. Joumal of Applied Phvsiologv. 22(3), 509-518.
Sanden, A., & Axelsson, A. (1981). Comparison of cardiovascular responses in noise-resistant and noise-sensitive workers. Acta Otolarvngologica.Supplementation [Stockholm!. 377. 75-100.
Sargent, E. U, & Weinman, K.P. (1966). Eccrine sweat gland activity during the menstmal cycle. Journal of Applied Phvsiologv. 21. 1685-1687.
Sawicki, J.C. (1987). OSHA, NEPA firefighter rules require equipment that saves lives. Occupational Health & Safety. 56(9). 30-31.
Sawaski, N., Iwase, S., & Mano, T. (2001). Effect of skin sympathetic response to local or systemic cold exposure on thermoregulatory functions in humans. Autonomic Neuroscience: Basic and Clinical. 87(2-3). 274-281.
Sawka, M.N. (1992). Physiological consequences of hydration: exerciseperformance and thermoregulation. Medicine and Science in Sports and Exercise. 24,657-670.
Sawka, M.N., Convertino, V.A., Eichner, E.R., Schnieder, S.M., & Young, A.J. (2000). Blood volume: importance and adaptations to exercise training, environmental stresses, and trauma/sickness. Medicine and Science in Sports and Exercise. 32(2), 332-348.
Sawka, M.N., Latza, W.A., Montain, S.J., Cadarette, B.S., Kolka, M.A., Kranning, K.K., n, & Gonzalez, R.R. (2001). Physiologic tolerance to uncompensable heat: intermittent exercise, field vs. laboratory. Medicine & Science in Sports & Exercise. 33(3). 422-430.
Reproduced with permission of the copyright owner. Further reproduction prohibited without permission.
166
Sawka, M.N., Montain, S.J., & Latzka, W.A. (2001). Review: Hydration effects on thermoregulation and performance in the heat. Comparative Biochemistry & Physiology Part A. 128(4). 679-690.
Sawka, M.N., & Pandolf, K.B. (1990). Effects of body water loss on physiological function and exercise performance. In: Perspectives in Exereise and Sports Medieine. vol. 3: Fluid Homeostasis during exercise. Gisolfi, C.V., Lamb, D R. (Eds.). Indianapolis, IN: Benchmark Press, 1-38.
Sawka, M.N., Toner, M.M., Eraneesconi, R.P., & Pandolf, K.B. (1983).Hypohydration and exercise effects of heat acclimation, gender and environment. Journal of Applied Physiology. 55, 1147-1153.
Schedl, H P., & Clifton, J.A. (1963). Solute and water absorption by the human small intestine. Nature, 199, 1264-1267.
Schonfeld, B.R., Doerr, D.F., & Convertino, V.A. (1990). An occupational performance test validation program for fire fighters at the Kennedy Space Center. Journal of Occupational Medieine, 32(7), 638-643.
Schoenfeld, Y., Udassin, R., Shapiro, Y., Ohri, A., & Sohar, E. (1978). Age and sex differenees in response to short exposure to extreme dry heat. Journal of Applied Physiology, 44(11, 1-4.
Schultz, S.G., & Curran, P.P. (1970). Coupled transport of sodium and organic solutes. Physiological Review, 50, 637-718.
Selala, M.I., Coucke, V., Daelemans, E., Musuku, A., Jorens, P., Beaucourt, L., & Schepens, P.J. (1993). Eire fighting: How safe are firefighters? Bulletin of Environmental Contamination & Toxicology, 51(3), 325-332.
Selkirk, G.A. (2000). The influence of aerobic fitness and body fatness on tolerance to uneompensable heat stress. MS. Thesis. University of Toronto.
Senay, E C. Jr. (1968). Relationship of evaporative rate to serum [Na" ], [K'*'] and osmolality in acute heat stress. Journal of Applied Physiology, 25, 149-152.
Senay, E C. Jr. (1986). An inquiry into the role of cardiac filling pressure in acclimatization to heat. Yale Journal of Biological Medicine, 59(31, 247-256.
Senay, E C. Jr., & Christensen, M L. (1965). Cutaneous circulation during dehydration and heat stress. Journal of Applied Physiology, 20(2), 278-282.
Senay, E C. Jr., & Fortney, S. (1975). Untrained females: effects of submaximal exercise and heat on body fluids. Journal of Applied Physiology, 39, 643-647.
Reproduced with permission of the copyright owner. Further reproduction prohibited without permission.
167
Senay, L.C. Jr., Mitchell, D., & Wyndham, C.H. (1976). Acclimatization in a hot, humid environment: body fluid adjustments. Journal of Applied Physiology, 40, 786-796.
Shapiro, Y., Moran, D., & Epstein, Y. (1998). Acclimatization strategies: Preparing for exercise in the heat. International Journal of Sports Medicine 19, S161-S163.
Shapiro, Y., Pandolf, K.B., Avellini, B.A., Pimentai, N.A., & Goldman, R.F. (1980). Physiological responses of men and women to humid and dry heat. Journal of Applied Physiology, 49(1), 1-8.
Sharkey, B.J. (1977). Fitness and work capacity testing, p. 1. Forest Service, US Department of Agriculture.
Shirreffs, Suasan M. “The composition of sweat: Implications for rehydration strategies,” American College of Sports Medicine 49th Annual Meeting, St. Louis, 30 May 2002.
Shvartz, E., Magazanik, A., & Gliek, Z. (1974). Thermal responses during training in a temperate climate. Journal of Applied Physiology, 36, 572-576.
Skoldstrom, B. (1987). Physiological responses of fire fighters to workload and thermal stress. Ergonomics, 30(11), 1589-1597.
Sleivert, G.G., Cotter, J.D., Roberts, W.S., & Febbraio, M.A. (2001). The influence of whole-body vs. torso pre-eooling on physiological strain and performance of high-intensity exercise in the heat. Comparative Biochemistry & Physiology Part A, 128(4), 657-666.
Smith, D.L., Manning, T.S., & Petruzzello, S.J. (2001). Effect of strenuous live-fire drills on cardiovascular and psychological responses of recruit firefighters. Ergonomics, 44(3), 244-254.
Smith, D.L., & Petruzzello, S.J. (1998). Selected physiological and psychological responses to live fire drills in different configurations of fire fighting gear. Ergonomics, 41(8), 1141-1154.
Smith, D.L., Petruzzello, S.J., Kramer, J.M., & Misner, J.E. (1997). The effects of different thermal environments on the physiological and psychological responses to firefighters to a training drill. Ergonomics, 40(4), 500-510.
Smith, D.L., Petruzzello, S.J., Kramer, J.M., & Misner, J.E. (1996). Physiological, psychophysical and psychological responses of firefighters to fire fighting training drills. Aviation, Space & Environmental Medicine, 67(11), 1063-1068.
Reproduced with permission of the copyright owner. Further reproduction prohibited without permission.