Embed Size (px)
Citation preview
Determination of the Refractive Index Increment (dn/dc) of
molecule and macromolecule solutions by Surface Plasmon
Resonance
Tathyana Tumolo 1, Lucio Angnes 2 and Mauricio S. Baptista1*
1 Departamento de Bioquímica, Instituto de Química, Universidade de São
Paulo, Brazil
2 Departamento de Química Fundamental, Instituto de Química, Universidade
de São Paulo, Brazil
to whom correspondence should be addressed: e-mail:[email protected];
Fax: (xx5511)3815-5579
Abbreviations used: SPR, surface plasmon resonanse; FIG, flow injection
gradient; MC, mixing chamber.
Category: Physical Techniques
ABSTRACT
An automated method for dn/dc determination using a surface plasmon
resonance equipament in tandem with a flow injection gradient system (FIG-
SPR) is proposed. dn/dc determinations of small molecule and biomolecule,
surfactant, polymer and biopolymer solutions with precision around 1-2% and
good accuracy were performed utilizing this method. dn/dc measurements
were also carried out manually on a conventional SPR equipment with similar
accuracy and precision. The FIG-SPR instrument is inexpensive and could be
easily coupled to commercially available SPR and liquid chromatography
equipments in order to obtain several properties of the solutions, which are
based on measurements of refractive index.
2
INTRODUCTION
The change in refractive index of solutions as a function of solute
concentration (dn/dc, also called refractive index increment) is an essential
parameter to several physical and analytical techniques that are based in
optical measurements (1). For example, it is necessary to know dn/dc in order
to: i) characterize the sizes, shapes, molecular weights, and the virial
coefficients of polymers, macromolecules and surfactant aggregates through
light scattering methods (2), ii) calculate solute concentration based in
refractive index measurements in any kind of column chromatography (3), and
iii) obtain concentration and kinetics of molecules adsorbing on surfaces
through optical methods like Surface Plasmon Resonance (SPR) and
ellipsometry (4).
dn/dc corresponds to the slope of the dependence of the refractive
index (n) of a solution as a function of the solute concentration (c). The search
for refractometers with high precision (1x10⁻⁶ refractive index units, RIU) and
the capability of measuring dn/dc led to the development of the differential
refractometers (DR) (5,6). In fact, most of the dn/dc values reported in the
literature were measured using DR, including low molecular weight
compounds (7) block copolymers (8), agarose (9), poly(thiocarbonate)s and
poly(carbonate)s (10), and surfactants (11). Other refractometers like the
Zeiss interferometer and the Mach-Zehnder interferometer (6) have also been
used to obtain dn/dc of segmented poly(ester urethane)s
polymethylmethacrylate (PMMA) in different solvents (12).
SPR is a surface sensitive method that measures the reflectance
intensity as a function of incident angle θ of a light beam incident on a thin
3
metal film. It has been extensively used to evaluate properties of thin films
self-assembled on gold, to study the adsorption of molecules at surfaces and
to characterize intermolecular interactions in general (13). The application of
SPR to study intermolecular interactions in high throughput screening essays
using combinatorial libraries opened a wide window for its application in
mutation detections, genomics, proteomics and drug development (14).
In order to obtain the concentration of molecules adsorbing over
surfaces (C) by the response of a SPR instrument (∆θ, where θ is the SPR
angle) in the linear regime (small refractive index variations) (15) it is
necessary to know the instrument calibration constant (X) and refractive index
increment of the ligand (dn/dc)ligand (16)
[1] C
Xligand dndC ligand
=∆θ
.( )
Accurate values of dn/dc were not fundamental in many SPR
applications because most of the studies were done with compounds that
have similar dn/dc values (17). However, it becomes extremely important in
the combinatorial libraries investigations where a wide range of different
compounds is tested, whose values of dn/dc can vary from 0.1 to 0.3 cm3g-1 ,
thus affecting directly the interpretation of the results (7). Accurate values of
dn/dc for ligands are also important when studying the interactions of common
molecules (like DNA-protein interactions) with stoichiometries different than
1:1 (7,18). It also enables for the calculation of bulk refractive index of
compounds (n), which is necessary in order to estimate film thickness and
surface coverage (16,19).
4
Because the SPR technique measures refractive index variations that
occur up to 400nm above the dielectric thin film (usually gold or silver thin
films), its signal is sensitive to the adsorption of molecules at the gold surface
(functionalized or not) and to the presence and concentration of molecules in
the liquid above the interface (13,16). In theory the value of dn/dc of ligand
solutions could be estimated from any equation fitting a SPR angle versus
reflection data (16). However, parameter compensation during the fitting
prevents accurate calculation of all other parameters, and it is usually
necessary to obtain the value of dn/dc from one of the independent
techniques cited above, which increases severely the time of the
measurements and hinders the more extensive application of SPR to high
through screening techniques. Therefore, it is desirable to develop a method
in which the dn/dc values of ligands could be calculated directly using the
SPR equipment. Also, this method should be easily automated to facilitate its
use in high through screening assays.
The variation of the SPR signal as a function of solute concentration in
the regime of small refractive index variations provides directly the ratio of
∆n/∆c, where ∆n is the difference of refractive indexes related with a
difference in solute concentration (∆c) (1,2). This is also true for the case in
which there is the formation of a thin film at the interface, below the fluid in
which the dn/dc determination is being performed, as far as the thickness of
this film is small (<50nm) compared with the decay length of the evanescent
field (~360nm in our instrument) (16). In fact, in order to calculate precisely
adsorption and desorption of surfactants in functionalized gold films, Sigal at
5
al were able to successfully calculate values of dn/dc of surfactant solutions
using SPR (20).
In this work we set up an instrument in which the SPR chip is
connected to a flow injection gradient (FIG) system (21,22).1 With the FIG
technique, a mixing chamber (MC) is used as a device to generate
reproducible concentration gradients whose refractive indexes are monitored
continuously in the SPR chip. The obtained concentration profiles not only can
replace the manual preparation and the measurement of several solutions
with different concentrations of the reactants but also can increase the
velocity keeping the high precision and accuracy of the determinations (21-
23). The dn/dc determination of several compounds was performed using
clean gold film with and without a mixing chamber. Therefore, we describe an
automated method to obtain the dn/dc of polymer, surfactant, macromolecule
and small molecule solutions using a SPR instrument.
1
1 Patent application under consideration
6
Experimental Section
Samples
All reagents used were at least of analytical grade. Solutions of Alanine
(Aldrich), Bovine Serum Albumin (BSA) (Acros Organics),
Cetyltrimethylammonium bromide (CTAB, Acros Organics), DNA sodium salt
Type I from calf Thymus (Sigma), Guanidine (Sigma), Heparin (Sigma), 3-(N-
Hexadecyl-N,N-dimethylammonium)propanesulfonate (HPS, Sigma), Lactose
(J.T. Baker), glucose (Vetec, Brazil), maltose (Merck), Poly(ethylene glycol)
4000 (PEG 4000, Polysciences Inc.), Poly(ethylene glycol) 6000 (PEG 6000,
Fluka), Polyvinylpirrolidone (PVP K90) (Acros Organics), Sodium Chloride
(Synth, Brazil), Sodium dodecyl sulfate (SDS, Merck), Spermine (Acros
Organics), Sucrose (Synth, Brazil), Tartaric acid (Aldrich) Urea (Cinética
Química, Brazil), were prepared with Milli-Q water. SDS, HPS, sodium
chloride, CTAB and Urea solutions were stirred for 5 minutes, heparin for 1
hour and PEG 4000 and 6000 for 3 hours. PVP was dried in oven for 3 days
previously to weighting and its aqueous solution was left mixing for 2 days.
BSA solution was warmed at 32 oC for better solubilization and left mixing for
10 minutes.
To determine dn/dc without the mixing chamber, solutions were
prepared with different concentrations in g.cm-3: BSA (0.005, 0.010, 0.015,
0.020, 0.025, 0.030, 0.035, 0.040, 0.045, 0.050), CTAB (0.006, 0.009, 0.012,
0.015, 0.018, 0.021, 0.024, 0.027), Heparin (0.005, 0.010, 0.015, 0.020,
0.025, 0.030, 0.035, 0.040, 0.045), HPS (0.00391, 0.00587, 0.00783,
0.00979, 0.01175, 0.01566, 0.01762, 0.01958), PEG 4000 (0.0040, 0.0081,
0.0121, 0.0161, 0.0201, 0.0242, 0.0282, 0.0322, 0.0363, 0.0403), SDS
7
(0.0053, 0.0064, 0.0073, 0.0079, 0.0087, 0.0116, 0.0131, 0.0145), Sucrose
(0.0104, 0.0207, 0.0415, 0.0518, 0.0622, 0.0726, 0.0830, 0.1037).
To determine the dn/dc with the mixing chamber, the concentrations
(g.cm-3) of the stock solutions used were: Alanine (0.1354), BSA (0.0100),
CTAB (0.01795), DNA (0.00329), Glucose (0.0117), Guanidine (0.01785),
Heparin (0.0206), HPS (0.0085), Lactose (0.0111), Maltose (0.0097), PEG
4000 (0.0504), PEG 6000 (0.0405), PVP (0.0448), SDS (0.0183), spermine
(0.0043), Sucrose (0.0718), Tartaric acid (0.0119) Urea (0.1201).
In the case of surfactant solutions, the value of concentration used in
the dn/dc determination was expressed as the total surfactant concentration
minus the critical micelle concentration (cmc), because we aimed to
determine the value of dn/dc of micellized surfactant solutions (11). This
correction was performed both when using and when not using the mixing
chamber.
Instrumentation
Refractive index values were obtained with a miniature integrated SPR
sensing system (Spreeta Sensor, Texas Instruments), which uses a near-
infrared light emitting diode (840 nm) to excite surface plasmon in a 50 nm
thickness gold film. This sensor is interfaced with a 8-Bit Interface Box (I/F
Box). The data acquisition and instrument control was performed by a
Pentium 2 microcomputer. The flow cell was constituted by a Teflon piece
fixed over the SPR device. Between these two parts was positioned a Teflon
spacer defining the volume of the flow cell (25 µL). The solutions were
propelled by a peristaltic pump ( Isco Inc. Model Tris, USA) utilizing a flow rate
8
of 2.7 cm3.min-1. With this equipment one can expect detection limits of in the
order of 10-6 R.I.U, which is equivalent to the best classical methods available
(5,6). dn/dc determinations were carried out in two different ways: i) under
steady state conditions, in which each stock solution with known
concentration was injected in triplicate and the refractive indexes were
measured independently; ii) using FIG line with a home-made MC with an
internal volume of 1.50 cm3 and magnetic stirrer. The value of θSPR (angle of
minimum reflectance) was obtained by fitting the data with the polynomial
method. All analyses were performed in a thermostatized room (23±1 oC).
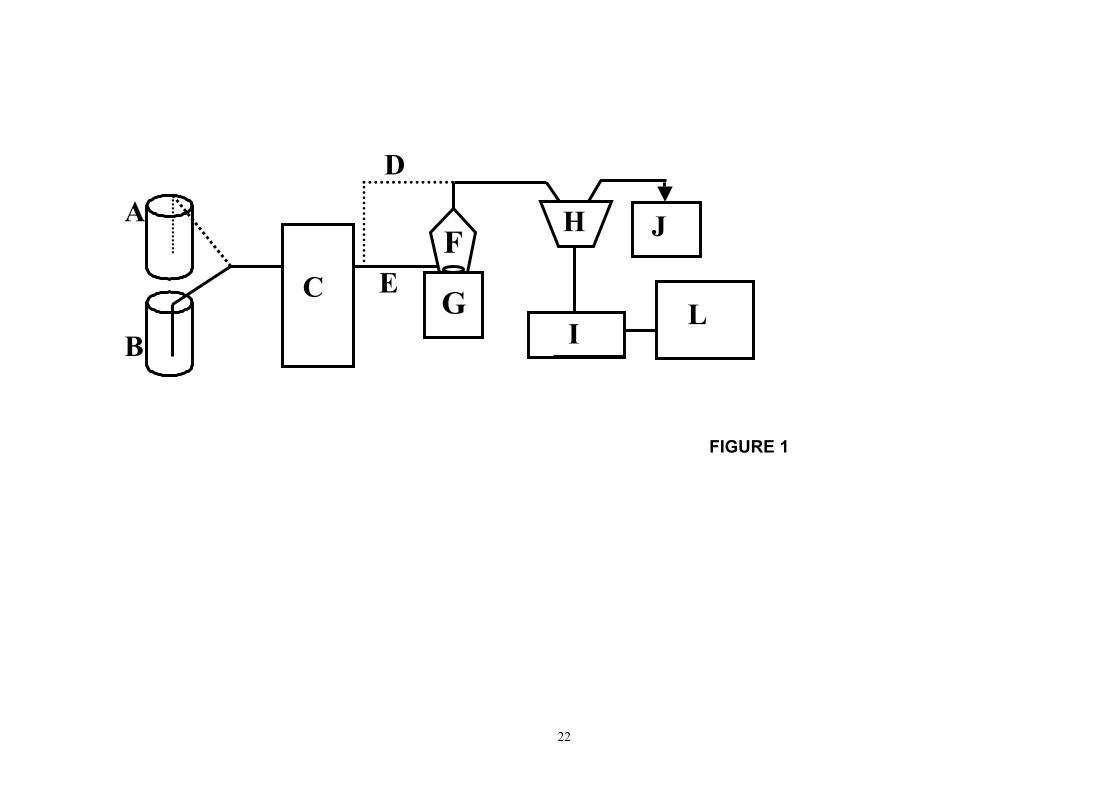
<FIGURE 1>
Before beginning the analysis, the gold surface of the sensor was
cleaned with isopropyl alcohol and Kodak lens cleaning paper, rinsed with
Milli-Q water and calibrated in air (n=1) and in water (n=1,3330) To clean-up
the sensor surface after each analysis a 50mM SDS solution was injected in
the cell, followed by an excess of water sufficient to obtain the value of n
measured previously for pure water.
RESULTS AND DISCUSSION dn/dc determination without the mixing chamber
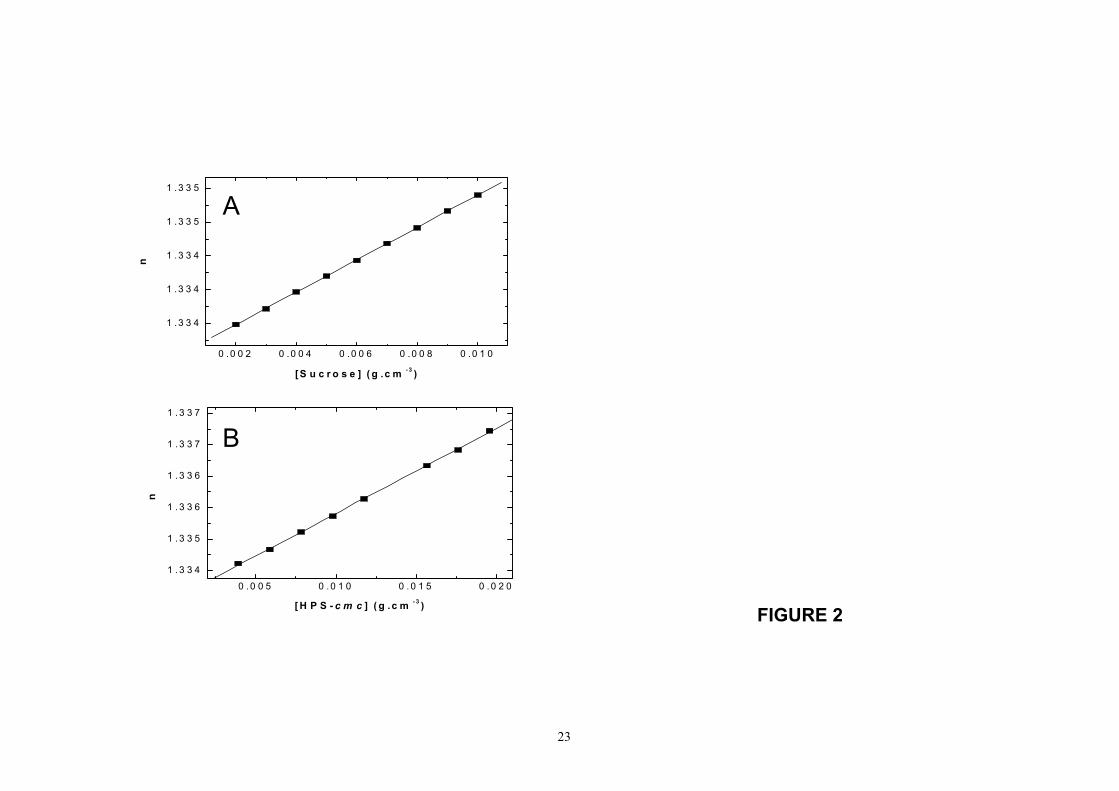
The plots of n as a function of c for sucrose and micellized HPS are
shown in Figure 2. It can be observed an excellent linearity of both curves
(r>0.999), in agreement with the assumption that at these low concentration
conditions there is a linear relationchip between n and c. The slope of this
curve is the value of dn/dc in cm3.g-1.
<FIGURE 2>
9
<TABLE 1>
Table 1 shows the dn/dc values for several compounds obtained by
SPR and the literature values. Standard deviations around 1 to 2% in dn/dc
were obtained for this series of compounds attesting the good precision of the
method. The comparison of the dn/dc values obtained by SPR and those from
the literature shows differences smaller than 10% indicating that the accuracy
of these measurements is also good. The main causes of divergences among
the values obtained by SPR and those from the literature are likely to be the
different experimental conditions, such as differences in wavelength,
temperature and reagent purity.
dn/dc determination with the FIG-SPR instrument
In order to calculate the dn/dc with this method it is necessary to
generate curves of refractive index as a function of solute concentration. This
can be done by using a calibrated MC, as in the conventional flow gradient
technique (21,22). In the MC occurs the rapid dilution of the stock solutions,
and a gradient of solute concentrations is generated. Initially a curve of
refractive index as a function of time after injecting a specific solution in the
MC is obtained. The concentration as a function of time profile of the injected
compound was obtained by calibrating the system with sucrose. Both curves
n versus t e c versus t were used to plot the n versus c curve allowing the
dn/dc calculation.
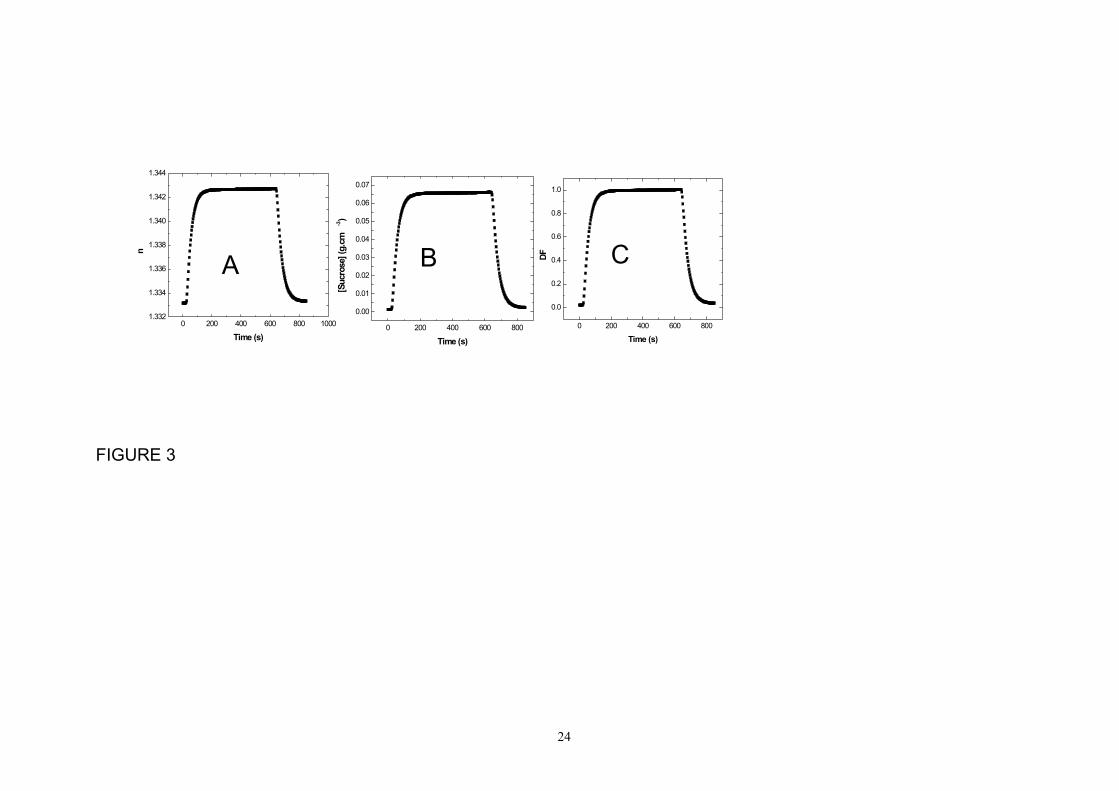
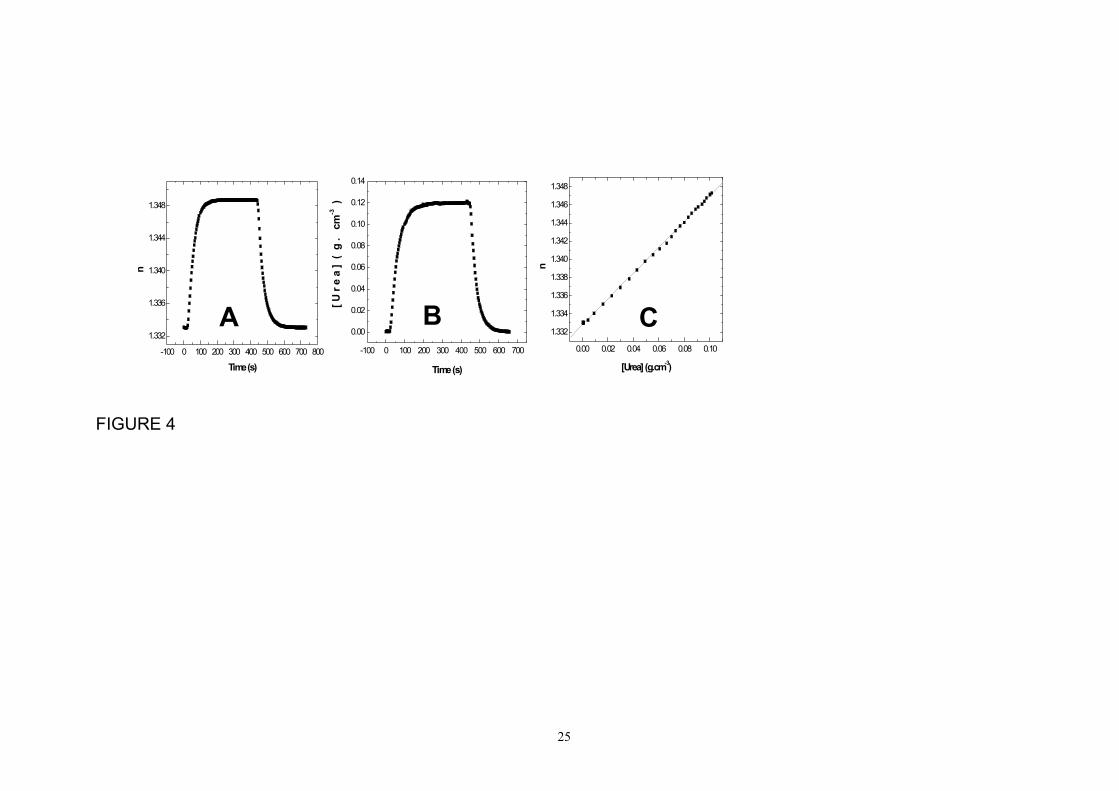
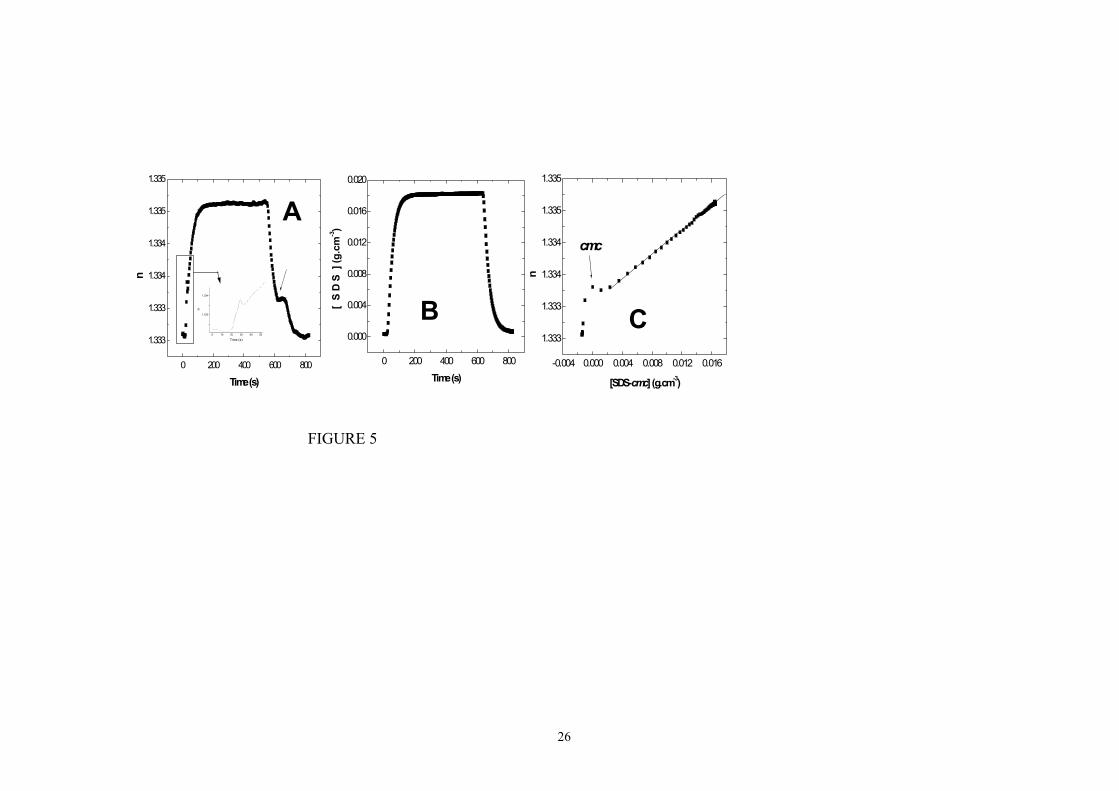
The refractive index versus time curves of sucrose, urea and SDS are
shown in Figure 3A, 4A and 5A, respectively. Note that after the injection of
stock solutions in the MC, an increase is observed in the value of n. For
10
sucrose and urea there is a continuous increase while for SDS there is a
small bump around 10s after injection that is likely to be due to surfactant
adsorption on gold and self-aggregation (Figure 5A, inset). This phenomenon
will be further discussed in this manuscript. Refractive index reaches a
constant value ~200 seconds after the injection. The increase in solute
concentration in the SPR flow cell reflects an increase in the refractive index,
and the flat region indicates that the concentration of solute in the mixing
chamber is equal to the solute concentration in the stock solution. 600
seconds after the injection, water or buffer instead of solute was injected in
the MC and a dilution profile was observed with the respective decrease in the
refractive index. In the case of SDS there is an evident bump in the dilution
gradient. The concentration onset of this bump is ~ 7mM, which is exactly the
value of the cmc of SDS (27). We are investigating whether or not these
refractive indexes changes from linearity can be used to study surfactant-
polymer interactions and adsorption processes in general.
By using a molecule whose relationship between refractive index and
concentration is well established, one can transform the refractive index
versus time curve into concentration versus time curve, i.e. to calibrate the
MC. Sucrose was chosen as standard, because its dn/dc is well known, its
solutions are easy to prepare accurately and it does not adsorb on the gold
film. Figure 3B shows the concentration versus time curve of sucrose,
indicating that its concentration increases, flats up and decreases as
mentioned before. The numeric values of these sucrose concentrations are
dependent on both the concentration of the injected stock solution and the
instrument characteristics. In order to calculate a parameter that is
11
independent from the concentration of the stock solution, the dilution factor
(DF), which is the calculated concentration at specific times after injection
divided by the concentration of stock solution, was calculated by Eq. [2]
(Figure 3C). Note that after the stock solution is injected, DF increases from
zero to one, showing that the concentration increases and reaches the same
concentration as the stock solution (DF=1) (Figure 3C). We have previously
established that by injecting the stock solution for 200 seconds in the MC
previously filled with water, is enough to obtain the same value n as by
injecting the stock solution directly in the SPR cell.
DF tC tCSTOCK
( )( )
= [2]
Where: DF(t) is the dilution factor, C(t) is the solute concentration monitored
as a function of time, CSTOCK is the concentration of the stock solution.
As far as the speed of the peristaltic pump and the volume of the MC
are unchanged this temporal DF profile will be the same for all compounds
injected. Therefore, one can easily obtain the concentration at specific times
after injection in the MC for any molecule simply by multiplying the
concentration of the stock solution by DF, as it is shown for urea and SDS in
Figures 4B and 5B, respectively. Consequently, one can convert the refractive
index versus time curves into refractive index versus concentration curves
(Figures 4C and 5C) with the dn/dc values being the slopes of these curves.
The increasing concentration portion of the curve was chosen for these
calculations, although the decreasing portions also works well. Therefore, it is
12
possible to calculate dn/dc without the cumbersome work of manually
preparing a series of solutions with different concentrations.
Note that in the case of urea, the refractive index versus concentration
curve (Figure 4C) is linear in all concentration profile, facilitating the dn/dc
determination. This is due to the fact that urea does not have the tendency to
adsorb on the gold thin film. However, in the case of SDS, the curve was not
linear at low concentrations (Figure 5C). This effect was observed for all
molecules that have the tendency to adsorb on the interface (surfactants and
polymers). In order to calculate dn/dc in these cases, we first obtained the
derivative graph of the refractive index versus concentration curve, observed
in which concentration range the derivative is linear, and then obtained the
dn/dc considering this range. Because the thickness of the self-assembled
film of surfactants or biopolymers is extremely thin (<20nm) the SPR response
is still linear as a function of solute concentration.
<FIGURE 3>
<FIGURE 4>
<FIGURE 5>
The dn/dc values of an extended list of substances was obtained and
they are shown in table 2. Note that the values of dn/dc vary almost 100%
among the compounds tested (compare Spermine and Guanidine with SDS
and Tartaric acid), demonstrating the necessity of obtaining accurate values
of dn/dc in order to correctly exploit SPR data.
As observed in the continuous injection method, the results obtained
with FIG-SPR are also in agreement with the literature values of dn/dc.
Differences smaller than 5% are observed when compared to literature data.
13
This difference is ascribed to the different experimental conditions related to
temperature, wavelength and reagent purity. Note that in the case of Heparin
and HPS, whose conditions are the same as ours, the difference in the dn/dc
is smaller.
Compared to the continuous injection method (Table 1) the automated
FIG technique presented similar accuracy and precision, with the advantage
of being less time-consuming. This is in accordance with the conclusions of
Shank-Retzlaff and Sliger that studied protein-protein interactions, by using an
HPLC pump coupled to an home made SPR device (23). Linear concentration
gradients were generated and used to calculate equilibrium constants and
kinetic data of these interactions. The authors attested that several limitations
of usual SPR devices, i.e. long-time analysis and need for surface
regeneration, were relaxed in their instrument.
Conclusions
The elaboration of the method of dn/dc determination with the
concentration gradient eliminated the stage of preparing several samples with
different concentrations. Using only one stock solution it is possible to obtain
hundreds of refractive index versus concentration data points, allowing the
precise and accurate calculation of dn/dc. The MC is a simple and
inexpensive apparatus that could be included in commercially available SPR
instruments. Also, a SPR chip could be used in any kind of polymer
chromatography methodology, replacing more expensive refractomers, to
obtain refractive index and dn/dc on line. When compared to other SPR
14
methods, the present FIG-SPR technique may also be of advantage to
characterize intermolecular interactions of biomolecules.
ACKNOWLEDGEMENTS: The authors would like to thank FAPESP, CNPq and
PRP-USP for financial support and D. Briotto for technical assistance. We also
would like to thank M.J.Politi and E.Barbieri for helpful discussions. T.T. is a
graduate student supported by FAPESP fellowship.
15
Bibliographic References 1. M.B. Huglin, Specific refractive index increments of polymers in dilute solution, in: J. Brandrup, E. H. Immergut (Eds.) Polymer Handbook, New York, 1991, pp. VII/409-VII/471. 2. P. Kratochvíl, Classical Light Scattering from Polymer Solutions, Elsevier, New York, 1987. 3. H. Catalgil-Giz, A. Giz, A.M. Alb, W.F. Reed, Absolute Online monitoring of acrylic acid polymerization and the effect of salt and pH on reaction kinetics, J. Appl. Polym. Sci. 91 (2004) 1352-1359. 4. (a) C. Pearson, J. Nagel, M.C. Petty, Metal ion sensing using ultrathin organic films prepared by the layer-by-layer adsorption technique, J. Phys. D.: Appl. Phys. 34 (2001) 285-291. (b) J.A. de Feijter, J. Benjamins, F.A. Veer, Ellipsometry as a tool to study the adsorption of synthetic and biopolymers at the air-water Interface, Biopolymers 17 (1978) 1759-1772. 5. T.A. Wilson, W.F. Reed, Low cost, interferometric differential refractometer, Am. J. Phys. 61 (1993) 1046-1048. 6. J. Dyson, Interferometers, in: J. Strong (Eds.) Concepts of Classical Optics, Freeman, New York, 1958. 7. T.M. Davis, W.D. Wilson, Determination of the Refractive index increment of small molecules for correction of surface plasmon resonance data, Anal. Biochem. 284 (2000) 348-353. 8. (a) A. Bello, G.M. Guzman, Specific refractive index increments of polymers and copolymers in several solvents, European Polymer Journal 2 (1) (1966) 85-91. (b) M.J. Fabre, L.H. Tagle, L. Gargallo, D. Radic, I. Hernandez-Fuentes, Partial specific volume and specific refractive index increment of some poly(carbonate)s and poly(thiocarbonate)s, Eur. Polym. J. 25(12) (1989) 1315-1317. 9. J. Podesva, O. Prochazka, A. Medin, Studies on agaroses: 1.Specific refractive index increments in dimethyl sulfoxide and in water at various wavelenghts and temperatures, Polymer 36(26) (1995) 4967-4970. 10. I. Baltog, C. Ghita, L. Ghita, Interferometric measurements of refractive index increment of polymers solutions, Eur. Polym. J. 6 (9) (1970) 1299-1303. 11. M.S. Baptista, I. Cuccovia, H. Chaimovich, M.J. Politi, W.F. Reed, Electrostatic Properties of Zwitterionic Micelles, J. Phys. Chem. 96 (1992) 6442-6449. 12. R. Ghazy, B. El-Baradie, A. El-Shaer, F. El-Mekawey, Measurements of the refractive indixes and refractive index increment of a synthetic PMMA solutions at 488 nm, Optics & Laser Technology 31 (1999) 335-340.
16
13. (a) M. Malmqvist, Biospecific interaction analysis using biosensor technology, Nature 361 (1993) 186-187. (b) A.G. Frutos, R.M. Corn, SPR of Ultrathin Organic Films, Anal. Chem. 70 (1998) 449A-455A. 14. (a) E. Lopez-Crapez, T. Livache, J. Marchand, J. Grenier, K-ras mutation detection by hybridization to a polypyrrole DNA chip, Clin. Chem. 47 (2001) 186-194. (b) M.A. Cooper, Label-free screening of bio-molecular interactions, Anal. Bioanal. Chem. 377 (2003) 834-842. (c) E.H. Kerns, L. Di, Pharmaceutical profiling in drug discovery, Drug Discov. Today 8 (2003) 316-323. (d) D. Nedelkov, R.W. Nelson, Trends Biotechnol. 21 (2003) 301-305. 15. B. Liedberg, I. Lundstrom, E. Stenberg, Principles of Biosensing with an extended coupling matrix and surface-plasmon resonance, Sens. Actuators B 11 (1993) 63-72. 16. L.S. Jung, C.T. Campbell, T.M. Chinowsky, Mimi N. Mar, S.S. Yee, Quantitative interpretation of the response of surface plasmon resonance sensors to adsorbed films, Langmuir 14 (1998) 5636-5648. 17. (a) E.-M. Erb, X. Chen, S. Allen, C.J. Roberts, S.J.B. Tendler, M.C. Davies, S. Forsén, Characterization of the surfaces generated by liposome binding to the modified dextran matrix of a surface plasmon resonance sensor chip,. Anal. Biochem. 280 (2000) 29-35. (b) M.A. Cooper, A. Hansson, S. Löfås, D.H. Williams, A vesicle capture sensor chip for kinetic analysis of interactions with membrane-bound receptors, Anal. Biochem. 277 (2000), 196-205. 18. L. Wang, C. Bailly, K. Arvind, D. Ding, M. Bajic, D.W. Boykin, W.D. Wilson Specific molecular recognition of mixed nucleic acid sequences: An aromatic dication that binds in the DNA minor groove as a dimer, Proc. Natl. Acad. Sci. USA 97 (2000) 12-16. 19. E. Stenberg, B. Persson, H. Roos, C. Urbaniczky, Quantitative Determination of Surface Concentration of Protein with Surface Plasmon Resonance Using Radiolabeled Proteins, J. Coll. Interf. Sci. 143 (1991) 513-526. 20. G. B. Sigal, M. Mrksich, G. M. Whitesides, Using Surface Plasmon Resonance to measure the association of detergents with self-assembled monolayers of hexadecanethiolate on gold, Langmuir 13 (1997) 2749-2755. 21. C.D. Tran, M.S. Baptista, T. Tomooka, Determination of binding constants by flow injection gradient technique, Langmuir 14 (1998) 6886-6892. 22. M.E. Georgiou, C.A. Georgiou, M.A. Koupparis, Flow injection gradient technique in spectrophotometric determination of formation constants of macromolecule-cyclodextrin complexes, Anal. Chem. 67(1) (1995) 114-123.
17
23. M.L. Shank-Retzlaff, S.G. Sligar, Analyte gradient-surface plasmon resonance: a one-step method for determining kinetic rates and macromolecules binding affinities, Anal. Chem. 72 (2000) 4212-4220. 24. E.M. Furst, E.S. Pagac, R.D. Tilton, Coadsorption of polylysine and the cationic surfactant cetyltrimethylammonium bromide on silica, Ind. Eng. Chem. Res. 35(5) (1996) 1566-1574 25. J.E. Knobloch, P.N. Shaklee, Absolute Molecular Weight Distribution of Low-Molecular-Weight Heparins by Size-Exclusion Chromatography with Multiangle Laser Light Scattering Detection, Anal. Biochem. 245 (1997) 231-241. 26. R.C. Weast, M.J. Astle (Eds.) CRC Handbook of Chemistry and Physics, 61st ed., CRC Press, Florida, 1980, pp. D229-D274. 27. Junqueira, H.C.; Severino, D.; Dias, L.G. ; Gugliotti, M. ; Baptista, M.S., Modulation of the Methylene Blue Photochemical Properties Based on the Adsorption at Aqueous Micelle Interfaces, Phys. Chem. Chem. Phys. 4 (2002) 2320-2328.
18
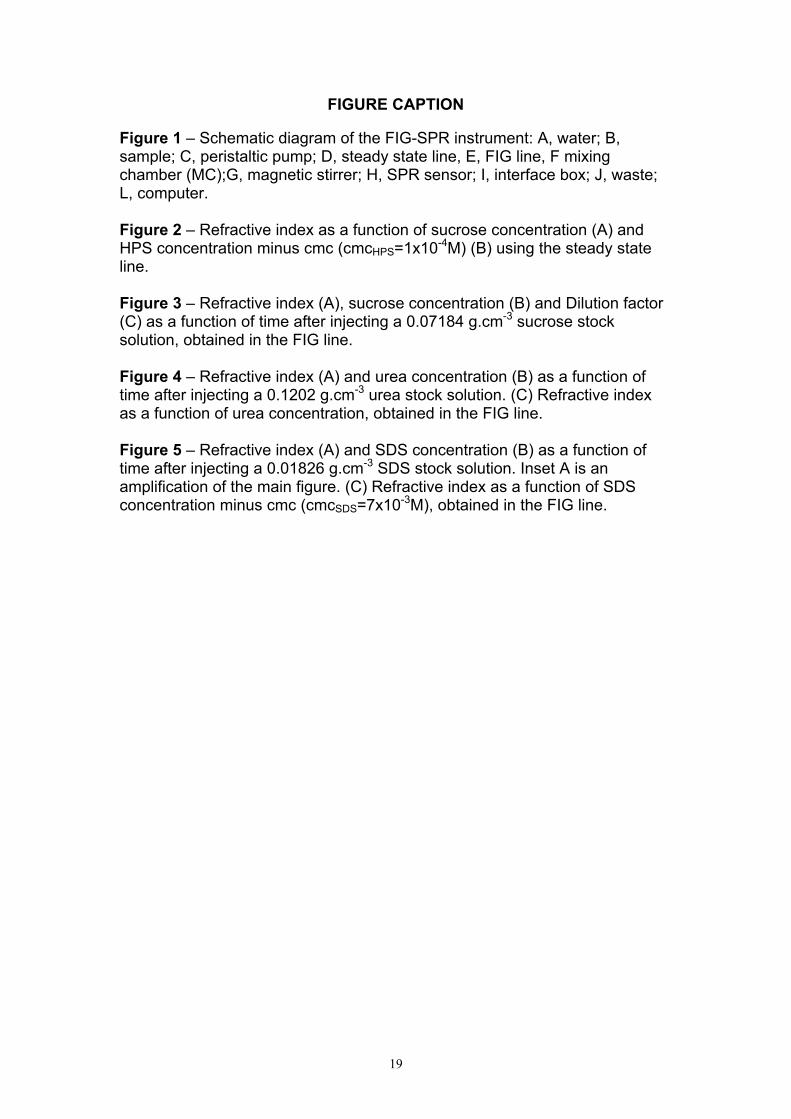
FIGURE CAPTION Figure 1 – Schematic diagram of the FIG-SPR instrument: A, water; B, sample; C, peristaltic pump; D, steady state line, E, FIG line, F mixing chamber (MC);G, magnetic stirrer; H, SPR sensor; I, interface box; J, waste; L, computer. Figure 2 – Refractive index as a function of sucrose concentration (A) and HPS concentration minus cmc (cmcHPS=1x10⁻⁴M) (B) using the steady state line. Figure 3 – Refractive index (A), sucrose concentration (B) and Dilution factor (C) as a function of time after injecting a 0.07184 g.cm-3 sucrose stock solution, obtained in the FIG line. Figure 4 – Refractive index (A) and urea concentration (B) as a function of time after injecting a 0.1202 g.cm-3 urea stock solution. (C) Refractive index as a function of urea concentration, obtained in the FIG line. Figure 5 – Refractive index (A) and SDS concentration (B) as a function of time after injecting a 0.01826 g.cm-3 SDS stock solution. Inset A is an amplification of the main figure. (C) Refractive index as a function of SDS concentration minus cmc (cmcSDS=7x10⁻³M), obtained in the FIG line.
19
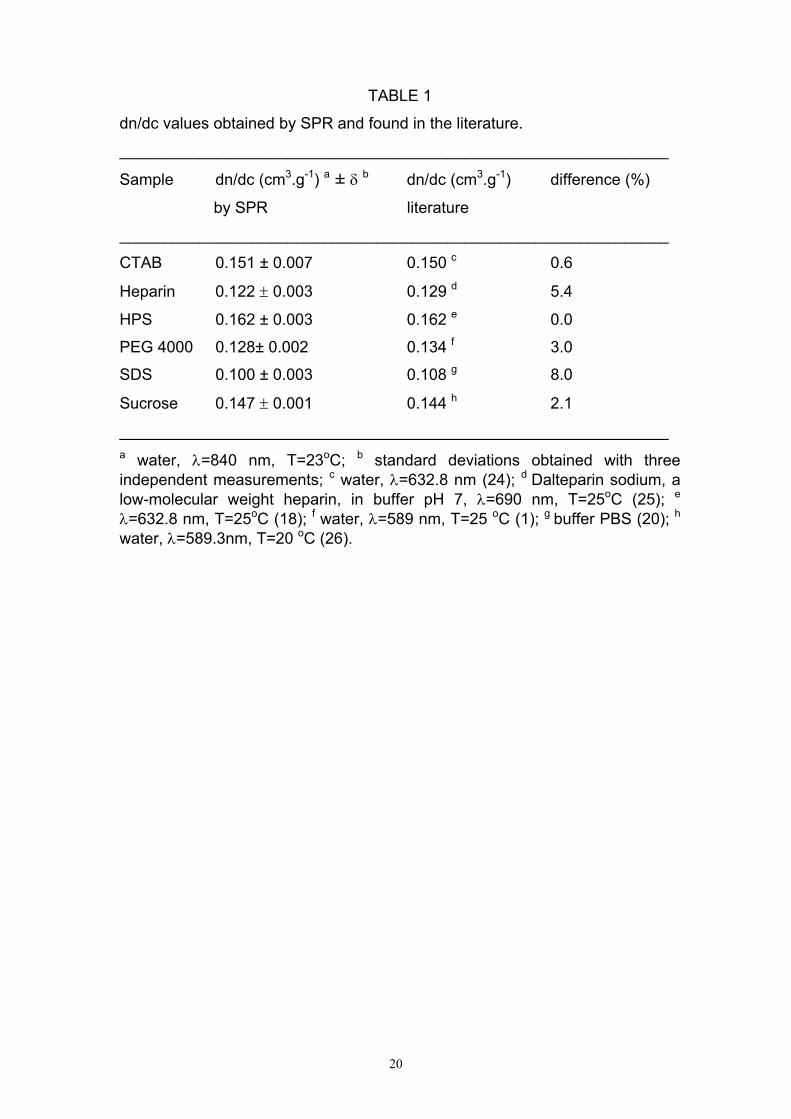
TABLE 1
dn/dc values obtained by SPR and found in the literature.
______________________________________________________________
Sample dn/dc (cm3.g-1) a ± δ b dn/dc (cm3.g-1) difference (%)
by SPR literature
______________________________________________________________
CTAB 0.151 ± 0.007 0.150 c 0.6
Heparin 0.122 ± 0.003 0.129 d 5.4
HPS 0.162 ± 0.003 0.162 e 0.0
PEG 4000 0.128± 0.002 0.134 f 3.0
SDS 0.100 ± 0.003 0.108 g 8.0
Sucrose 0.147 ± 0.001 0.144 h 2.1
______________________________________________________________ a water, λ=840 nm, T=23oC; b standard deviations obtained with three independent measurements; c water, λ=632.8 nm (24); d Dalteparin sodium, a low-molecular weight heparin, in buffer pH 7, λ=690 nm, T=25oC (25); e λ=632.8 nm, T=25oC (18); f water, λ=589 nm, T=25 oC (1); g buffer PBS (20); h
water, λ=589.3nm, T=20 oC (26).
20
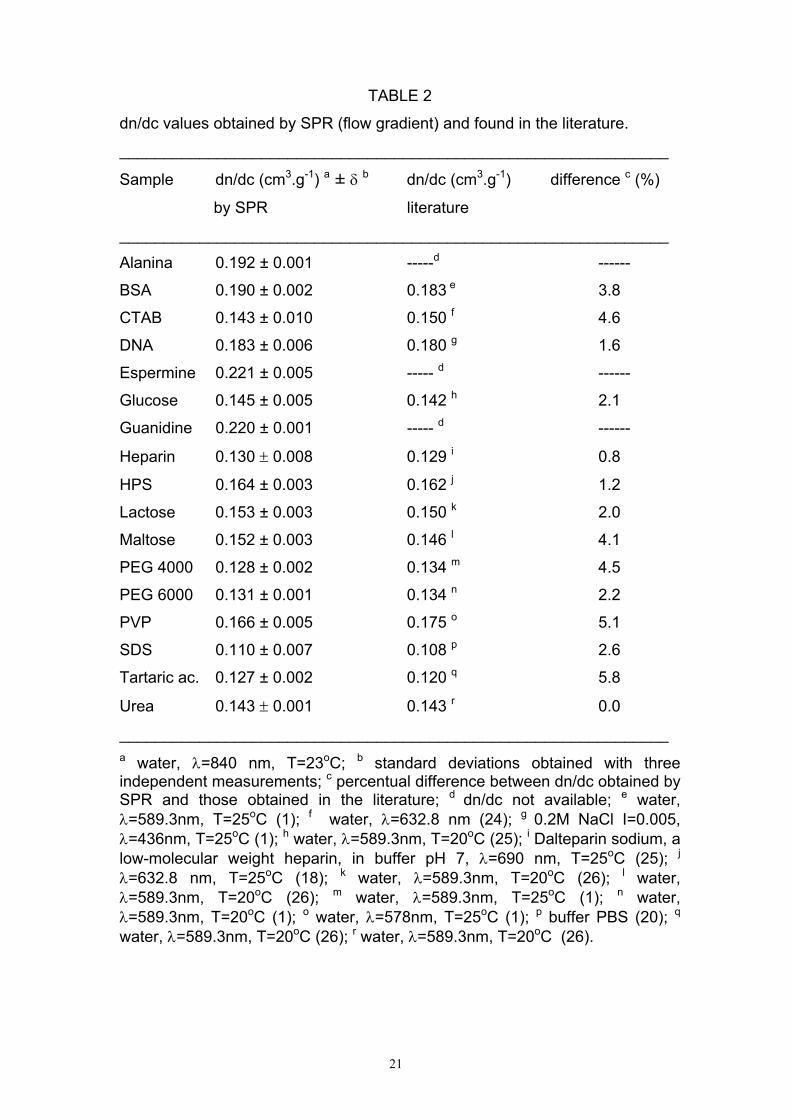
TABLE 2
dn/dc values obtained by SPR (flow gradient) and found in the literature.
______________________________________________________________
Sample dn/dc (cm3.g-1) a ± δ b dn/dc (cm3.g-1) difference c (%)
by SPR literature
______________________________________________________________
Alanina 0.192 ± 0.001 -----d ------
BSA 0.190 ± 0.002 0.183 e 3.8
CTAB 0.143 ± 0.010 0.150 f 4.6
DNA 0.183 ± 0.006 0.180 g 1.6
Espermine 0.221 ± 0.005 ----- d ------
Glucose 0.145 ± 0.005 0.142 h 2.1
Guanidine 0.220 ± 0.001 ----- d ------
Heparin 0.130 ± 0.008 0.129 i 0.8
HPS 0.164 ± 0.003 0.162 j 1.2
Lactose 0.153 ± 0.003 0.150 k 2.0
Maltose 0.152 ± 0.003 0.146 l 4.1
PEG 4000 0.128 ± 0.002 0.134 m 4.5
PEG 6000 0.131 ± 0.001 0.134 n 2.2
PVP 0.166 ± 0.005 0.175 o 5.1
SDS 0.110 ± 0.007 0.108 p 2.6
Tartaric ac. 0.127 ± 0.002 0.120 q 5.8
Urea 0.143 ± 0.001 0.143 r 0.0
______________________________________________________________ a water, λ=840 nm, T=23oC; b standard deviations obtained with three independent measurements; c percentual difference between dn/dc obtained by SPR and those obtained in the literature; d dn/dc not available; e water, λ=589.3nm, T=25oC (1); f water, λ=632.8 nm (24); g
0.2M NaCl I=0.005, λ=436nm, T=25oC (1); h water, λ=589.3nm, T=20oC (25); i Dalteparin sodium, a low-molecular weight heparin, in buffer pH 7, λ=690 nm, T=25oC (25); j λ=632.8 nm, T=25oC (18); k water, λ=589.3nm, T=20oC (26); l water, λ=589.3nm, T=20oC (26); m water, λ=589.3nm, T=25oC (1); n water, λ=589.3nm, T=20oC (1); o water, λ=578nm, T=25oC (1); p buffer PBS (20); q
water, λ=589.3nm, T=20oC (26); r water, λ=589.3nm, T=20oC (26).
21
L
A
B
E F
I
J
D
H
G C
FIGURE 1
22
B
A
0 .0 0 2 0 .0 0 4 0 .0 0 6 0 .0 0 8 0 .0 1 0
1 .3 3 4
1 .3 3 4
1 .3 3 4
1 .3 3 5
1 .3 3 5
n
[ S u c r o s e ] ( g .c m - 3 )
0 .0 0 5 0 .0 1 0 0 . 0 1 5 0 .0 2 0
1 .3 3 4
1 .3 3 5
1 .3 3 6
1 .3 3 6
1 .3 3 7
1 .3 3 7
n
[ H P S - c m c ] ( g .c m - 3 )
FIGURE 2
23
0 200 400 600 800
0.0
0.2
0.4
0.6
0.8
1.0
DF
Time (s)0 200 400 600 800
0.00
0.01
0.02
0.03
0.04
0.05
0.06
0.07
[Suc
rose
] (g.
cm-3)
Time (s)
0 200 400 600 800 10001.332
1.334
1.336
1.338
1.340
1.342
1.344
n
Time (s)
CBA
FIGURE 3
24
[ U r
e a
] (
g .
cm
-3 )
CBA
0.00 0.02 0.04 0.06 0.08 0.10
1.332
1.334
1.336
1.338
1.340
1.342
1.344
1.346
1.348
n
[Urea] (g.cm-3)-100 0 100 200 300 400 500 600 700 800
1.332
1.336
1.340
1.344
1.348
n
Time (s)-100 0 100 200 300 400 500 600 700
0.00
0.02
0.04
0.06
0.08
0.10
0.12
0.14
Time (s)
FIGURE 4
25
[ S
D S
] (g
.cm
-3)
0 10 20 30 40 50
1.333
1.334
n
Time (s)
CB
A
-0.004 0.000 0.004 0.008 0.012 0.016
1.333
1.333
1.334
1.334
1.335
1.335
cmc
n
[SDS-cmc] (g.cm-3)
0 200 400 600 800
0.000
0.004
0.008
0.012
0.016
0.020
Time (s)0 200 400 600 800
1.333
1.333
1.334
1.334
1.335
1.335
n
Time (s)
FIGURE 5
26
![Brainf*ck Lexical Analysis - GitHub Pages€¦ · Brainf*ck Lexical Analysis Program: ++[>+[+]]. Program Tokens: INCREMENT INCREMENT LOOP_HEADER MOVE_RIGHT INCREMENT LOOP_HEADER INCREMENT](https://img.pdfslide.net/doc/110x75/5f98faba31b4de6080596e95/brainfck-lexical-analysis-github-pages-brainfck-lexical-analysis-program-.jpg)


![Study the Effective a Temperature and Concentration on ... · instrument used know Abbe refractometer [5], there is also by analysis of dn/dc The dn/dc, also called differential refractive](https://img.pdfslide.net/doc/110x75/5fa10c2cbbed9b3d087b8f68/study-the-effective-a-temperature-and-concentration-on-instrument-used-know.jpg)