Embed Size (px)
Citation preview
1
Determining Causes and Severity of End-User Frustration
Irina Ceaparu1, Jonathan Lazar2, Katie Bessiere3, John Robinson3 and Ben Shneiderman1
1Department of Computer Science, Human-Computer Interaction Laboratory, Institute for Advanced Computer Studies & Institute for Systems Research
University of Maryland, College Park, Maryland 20742
2Department of Computer and Information Sciences & Center for Applied Information Technology
Towson University, Towson, Maryland, 21252
3Department of Sociology University of Maryland, College Park, Maryland 20742
([email protected], [email protected], [email protected],
[email protected], [email protected])
Draft: May 12th, 2002 Keywords: user frustration, user interfaces, user experience, errors, user perception, helpdesk Abstract While computers are beneficial to individuals and society, frequently, users encounter frustrating experiences when using computers. This study attempts to measure, through 111 subjects, the frequency, cause, and the level of severity of frustrating experiences. The data showed that frustrating experiences happen on a frequent basis. The applications in which the frustrating experiences happened most frequently were web browsing, e-mail, and word processing. The most-cited causes of the frustrating experiences were error messages, dropped network connections, long download times, and hard-to-find features. The time lost due to the frustrating experiences ranged from 30.5% of time spent on the computer to 45.9% of time spent on the computer. These disturbing results should be a basis for future study.
2
Introduction
Computers have many beneficial impacts, but unfortunately, frustration is a universal experience for computer users. The annoyance of losing work when a crash occurs, struggling to understand an error message, or spending too much time to clear spam and viruses have become symbolic of the struggles with modern technologies. Computers can be the cause of many problems, and usually at the worst time possible.
Some problems stem from the users’ lack of knowledge, poor training, or unwillingness to read instructions or take tutorials. Often these problems result from flaws in the computer hardware, software, networking, troubling interactions among components supplied by diverse manufacturers, or the result of malicious actions by other users.
A number of preliminary research steps are necessary before we can attempt to work on the goal of making computer usage less frustrating for users. Our first step is to gain a better understanding of what frustrates users of computers. Then we can develop taxonomies of frustrating experiences and find a way to measure their severity and frequency. These steps should lead us to solutions with enough supporting evidence so that requests for improvements will be well received by all parties involved. Background Research
The research literature on user frustration is just emerging, but there are a number of research directions related to errors, time delays, and emotional reactions to problematic situations. Errors Errors can certainly be frustrating for users. While there is no clear definition for an error, it seems that an error could be broadly defined as when users perceive that something in the computing system is not operating appropriately and the users are therefore unable to reach their task goals. This might be due to a hardware or software failure (such as a crash), which is not directly due to the actions of the users. Alternatively, an error might be caused by the actions of users, for example, users either choose the wrong commands to reach their task goals, or choose the correct commands, but enter those commands in an incorrect manner (such as spelling error or a mode error) (Norman, 1983).
Errors can be especially frustrating experiences for novice users, who are unable to fully understand the cause of the error, are unable to understand how to appropriately respond to the error, and therefore, may perform actions that compound the severity of the error (Carroll and Carrithers, 1984; Lazar and Norcio, 2000). In addition, error messages tend to be inconsistent, unclear and confusing, which do not help the users respond to the error, but more likely frustrate them (Shneiderman, 1998; Lazar and Huang, 2003). Certainly, there is a lot of overlap in the areas of errors and frustration, as users do tend to find errors to be very frustrating. However, frustration is a broader topic than errors, as errors are when users perceive that something is in an incorrect state, regardless of the cause (Lazar and Norcio, 2002). There are many things that could cause
3
users to be frustrated, even if a computer is operating in a correct state (such as pop-up advertisements, viruses, and spam mail), and the users perceive that the computer is operating in a correct state. However, since errors are a major cause of user frustration, the research on errors can provide useful background literature for research on frustration. Time Delays
While users generally prefer a shorter response time, the appropriate response time is related to the users’ past experiences, the users’ knowledge level related to technology, the cost of an error, and outside time pressures. For instance, novice users may be willing to wait longer than expert users for the computer to respond (Shneiderman, 1998). In addition, the importance of the task and the related time pressure to complete a task may influence the user’s expectation and frustration related to time delays (Shneiderman, 1998). A goal is the end or aim of an action, in this case the completion of a task, and research indicates that individuals are more committed to goals when the goal is important to them than when it is not (Locke, 1996). For this reason, users were asked to record their frustrations during a time when they would be using the computer for their own personal use as opposed to specific tasks assigned to them. We hypothesize that frustration may be enhanced by the importance of the task or goal because individuals will be more committed to completing the goal.
Frustration can be reduced when delays are predictable and the users are made aware of the estimated time until they can move on with their task. Recent research on time delays has focused on the web environment. Time delays are especially frustrating on the web, when users are typically requesting content from a remote site. In these situations, the delay can be caused by numerous factors and components (Sears and Jacko, 2000), and is inherently unpredictable (Johnson, 1995; Johnson, 1998). A number of studies have found that time delays are problematic on the web. As the time delay from when the users send a request increases, users may find the content less interesting (Ramsay, Barbesi, and Preece, 1998), and of a lower quality (Jacko, Sears, and Borella, 2000). A long time delay can make it harder for users to remember what they were doing, and the related context in which they had made the request (Shubin and Meehan, 1997). In addition, web pages that take a very long time to load may also cause users to believe that an error has occurred, because the computer has not responded in an appropriate amount of time (Lazar and Norcio, 2000; Lazar and Norcio, 2002). Emotional Reactions
Another related area of research is that of emotional reactions to computing technology. Schleifer and Amick conducted a study that analyzed the effects of computer system response time (slow vs. rapid) and method of pay (incentive vs. nonincentive) on mood disturbances and somatic discomfort (Schleifer and Amick, 1989). Regardless of method of pay, slow response time generated higher ratings of frustration and impatience than did rapid response time. In addition, ratings of rush and tension were higher with incentive pay than without incentive pay, regardless of system response time. Mood disturbances and somatic discomfort increased linearly with the amount of time spent performing the data entry task over the course of the workday. This effect was independent of system response time or method of pay. The results indicate that computer
4
systems which incorporate features such as rapid response times reduce work stress, while the motivational advantages of computer-based incentive pay programs must be balanced against the stress effects of this method of pay.
Another study had as goal the development of a computer system trained to sense a user's emotional state via the recognition of physiological signals (Riseberg, Klein, Fernandez, and Picard, 1998). The researchers designed a controlled study in which subjects participated in a vision-oriented computer game using a (seemingly) traditional graphical user interface. The game consisted of a series of puzzles. The researchers created incentives (a $100 prize) for the subjects to play the game as fast as possible and achieve a good score. They also created seemingly random obstacles to attaining a good score in the game (at specific, but irregular intervals during the game play, they designed the software interface to simulate the mouse failing or “sticking”), so that the subjects would experience frustration. The study found a correlation between the psychological signal patterns (skin conductivity, blood volume pressure and muscle tension) and the game events. The method used proved efficient in solving some of the problems in building a computer that can recognize affect.
Overall, emotions do play a role in the end-user experience with information technology. Universal usability of information technology is currently impeded by system complexity and poorly-crafted interfaces, which lead to emotions such as confusion, frustration, and failure (Baecker, Booth, Jovicic, McGrenere, and Moore, 2000). One of the key challenges is to bridge the gap between what users know and what they need to know for a more successful, less frustrating user experience. User Satisfaction and Frustration
User satisfaction has been utilized in previous studies as a dependent variable, being used as an affective measure of the success of a technology (Olaniran, 1996; Zviran, 1992; Collins et. al., 1999). From the socio-psychological literature, satisfaction is also defined as the completion of a goal or task, and goal directed behavior is aimed at the satisfaction of some need, desire, or want. Frustration occurs at an interruption or inhibition of the goal-attainment process, where a barrier or conflict is put in the path of the individual (Dollard et al., 1939). Sigmund Freud defined frustration as both external and internal barriers to goal attainment and internal obstacles blocking satisfaction (Freud, in Strachey 1958). In other words, a person is frustrated if they are prevented from achieving an expected satisfying result (Berkowitz, 1978). However, users can still achieve satisfaction in their tasks despite the presence of frustration in the path of the task achievement. The Technology Acceptance Model identifies usefulness and ease of use as the two biggest influences on the user acceptance of technology (Davis, 1993). This model suggests that, even with a computer application that is not easy to use, the users will persevere in their attempts to reach a task goal if it is important to them.
One large study of user frustration was sponsored by Compaq. A survey of 1,255 workers in the United Kingdom assessed their frustrations with information technology (Compaq, 2001). Of those who had their own personal computers at work, nearly half have felt frustrated or stressed by the amount of time it takes to solve problems. Two in five blame computer jargon for exacerbating their frustration, while three quarters of respondents who suffer daily problems with their computers say that their colleagues “swear at their monitors” out of frustration. The survey also analyzed the business cost of
5
computer frustration. Nearly a quarter (23%) of respondents said that their work was interrupted daily due to computer crashes and other faults. Two in five who suffer daily breakdowns claim that this delay has caused them to miss deadlines, while one in ten have felt like bad mouthing their company to clients as well as friends because of frustration with the ineptness of their information technology departments. This is despite the fact that one in six admit that their problems are normally down to their own lack of knowledge and understanding. How Users Respond to Frustrating Experiences
Some of the current methods for users to overcome frustrating experiences with computer technology are helpdesks, knowledge bases, online help and bug tracking tools.
Help desks, as departments within a company or institution that responds to user's technical questions, usually handle problems like installation and configuration of software and hardware, assistance or resolution of computing problems. For an example of a help desk, view the University of Maryland help desk at http://www.helpdesk.umd.edu Knowledge bases are fast web-based databases of technical information used to optimize information collection, organization, and retrieval for all users. They are alternative support mechanisms to helpdesks or service lines, and they provide easy, web-based access to complete solutions.
For an example of a knowledge base, view Adobe Acrobat knowledge base at http://www.adobe.com/support/products/acrobat.html
Online help systems are designed to provide help external to the application (web page, tutorial CD) or internal to the application (wizards, context sensitive help).
For an example of a large online help system see Microsoft MSDN Library at http://msdn.microsoft.com/library/
Bug tracking tools are tools for managing and tracking computer program problem reports, or "bugs". These tools don't actually do the work of fixing the software, just keep track of the reports accounting and offer possible resolutions based on their own knowledge base.
An important contribution to the collection and analysis of software defects (bugs and crashes) has been made by Bugtoaster (www.bugtoaster.com). The Bugtoaster software consists of a client program installed on your computer and a web site that work in concert to capture, track and display information about the crashes that affect you. Normally Bugtoaster sits silently on the user’s system and waits for an application to crash. When it does, it captures the details relating to the crash. The details of the crash are packaged up and stored on the user’s computer hard disk. Periodically, the crash details are sent to the Bugtoaster database server where they are compared and correlated with the crashes of other Bugtoaster community members. Summaries of the crashes can be viewed live on the web site, along with large collections of statistical data regarding top 50 applications that cause crashes, which operating systems and which vendors are involved in most crashes, and which bugs have been solved so far.
6
Research Methodology
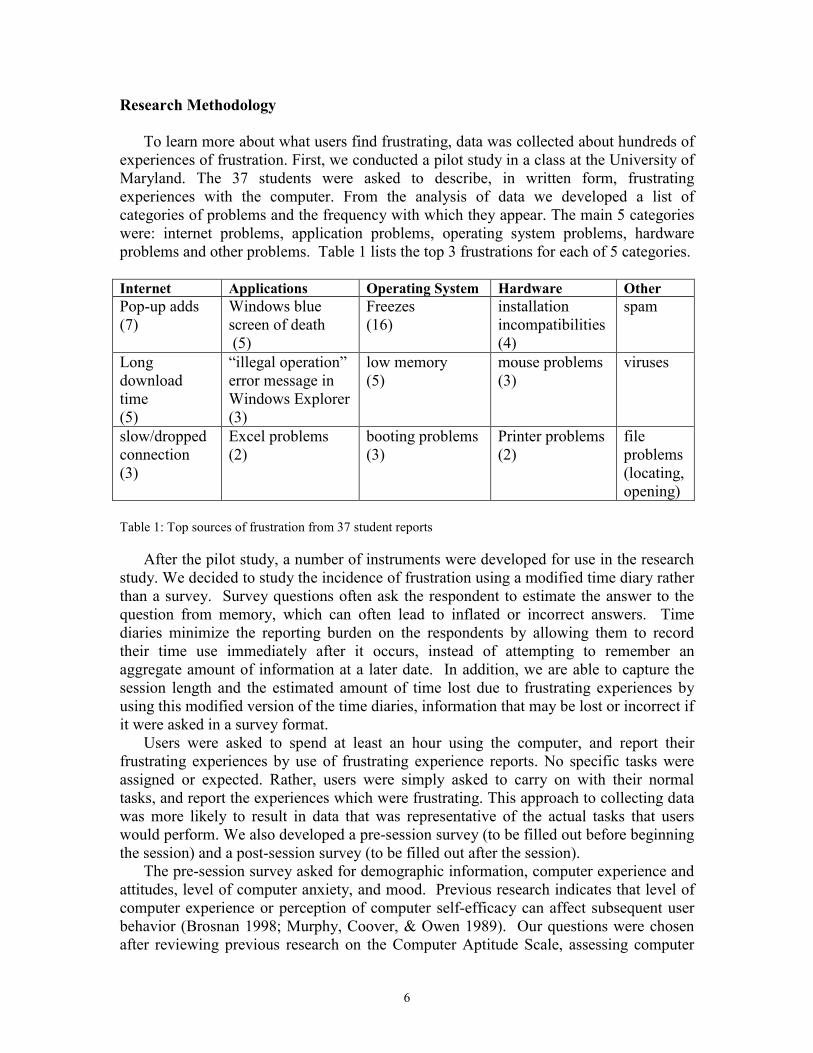
To learn more about what users find frustrating, data was collected about hundreds of experiences of frustration. First, we conducted a pilot study in a class at the University of Maryland. The 37 students were asked to describe, in written form, frustrating experiences with the computer. From the analysis of data we developed a list of categories of problems and the frequency with which they appear. The main 5 categories were: internet problems, application problems, operating system problems, hardware problems and other problems. Table 1 lists the top 3 frustrations for each of 5 categories.
Internet Applications Operating System Hardware Other Pop-up adds (7)
Windows blue screen of death (5)
Freezes (16)
installation incompatibilities (4)
spam
Long download time (5)
“illegal operation” error message in Windows Explorer (3)
low memory (5)
mouse problems (3)
viruses
slow/dropped connection (3)
Excel problems (2)
booting problems (3)
Printer problems (2)
file problems (locating, opening)
Table 1: Top sources of frustration from 37 student reports
After the pilot study, a number of instruments were developed for use in the research study. We decided to study the incidence of frustration using a modified time diary rather than a survey. Survey questions often ask the respondent to estimate the answer to the question from memory, which can often lead to inflated or incorrect answers. Time diaries minimize the reporting burden on the respondents by allowing them to record their time use immediately after it occurs, instead of attempting to remember an aggregate amount of information at a later date. In addition, we are able to capture the session length and the estimated amount of time lost due to frustrating experiences by using this modified version of the time diaries, information that may be lost or incorrect if it were asked in a survey format.
Users were asked to spend at least an hour using the computer, and report their frustrating experiences by use of frustrating experience reports. No specific tasks were assigned or expected. Rather, users were simply asked to carry on with their normal tasks, and report the experiences which were frustrating. This approach to collecting data was more likely to result in data that was representative of the actual tasks that users would perform. We also developed a pre-session survey (to be filled out before beginning the session) and a post-session survey (to be filled out after the session).
The pre-session survey asked for demographic information, computer experience and attitudes, level of computer anxiety, and mood. Previous research indicates that level of computer experience or perception of computer self-efficacy can affect subsequent user behavior (Brosnan 1998; Murphy, Coover, & Owen 1989). Our questions were chosen after reviewing previous research on the Computer Aptitude Scale, assessing computer
7
attitudes, computer anxiety/confidence, and computer liking (Loyd & Gressard 1984; Nash & Moroz 1997). We agreed that prior experience and level of perceived knowledge would affect an individuals’ level of frustration as well. Therefore, the overall state of our subjects were assessed with three questions dealing with life satisfaction, general mood, and how often the individual gets upset. The post session survey consisted of five questions to assess mood after the session, how frustrated overall the individual was after the session, how these frustrations affect the rest of the day, and the frequency and typical nature of the frustrating experiences during the session. The pre- and post-session surveys were then tested with students and with a number of people in the HCI field to improve the clarity of questions.
Once the surveys and frustrating experience report had been developed on paper, they were implemented on the web. A database-driven web site on user frustration was developed (http://e3.se.fit.edu:5335/ufs/) to collect the pre-session and post-session surveys, as well as the frustrating experience report. The web is an accepted method for collecting surveys for research, and there are established ways to enhance the validity of data collected (Lazar and Preece, 2001). The scenario for data collection included:
1. Users go to the FIT web site, register, and fill out the pre-session survey 2. Users perform their typical tasks for an hour or more 3. When users encounter a frustrating experience, they fill out a paper copy of the
frustrating experience report (note: for the users to fill out the frustrating experience report on-line at this time would take more time, and at the same time, the users would be more distracted from the task at hand. We felt that it more likely model the task environment if the users were less distracted, and was able to quickly fill out a paper form and continue with their tasks)
4. After completing an hour or more, the users would log into the FIT web site, and fill out the post-session survey.
After completing the post-session survey, the users would transfer their paper-based frustrating experience reports onto the web-based database. This specifically takes place outside of the pre-or-post-session surveys, as well as the hour-long session.
We required two data collection phases: self-report diaries and observation of another
user. Students at the University of Maryland and Towson University took part in both phases.
8
Self-report phase In the self-report phase, 33 computer science undergraduate students at the University
of Maryland and 26 computer information systems undergraduate students at Towson University reported personal frustrating experiences.. As discussed in the research methodology section, the subjects had to go to the User Frustration Project web site and register. They filled out a pre-session survey on demographic data and their experience with computers. Once the registration was completed, they spent a minimum of an hour noting the frustrations that took place when they were performing their common tasks. Then they had to login to the web site, and answer a short post-session questionnaire intended to capture their mood after the frustrating experiences and fill out the form for each frustrating experience. Almost half of the users spent an hour or a little longer, but 31 users spent between 100 and 450 minutes looking for frustrating experiences. Observation phase
In the observation phase, the students observed someone performing their usual computer tasks, and asked the person to fill out the pre-session survey, note their frustrations, and fill out the post-session survey. Essentially, the method for the observation phase was the same as the method for the self-reporting phase of the study. They had to ask the person they observed to go to the User Frustration Project web site (http://e3.se.fit.edu:5335/ufs/) and register. The person observed had to fill out a pre-questionnaire regarding some demographic data and their experience with computers. Once the registration was completed, the students had to stand beside the person observed and fill out (on paper) at least 3 frustrating experience reports. The students were asked to encourage the persons observed to think out loud and describe what they are trying to do and to ask questions if they were not sure if the person was experiencing frustration. When they were done with the observation, they had to ask the person observed to login to the web site and fill out a post-questionnaire form intended to capture their mood after the frustrating experiences.
The students were responsible for transferring the frustrating experience reports from paper to the online database. For this phase, the students from Maryland observed 31 subjects, and the students from Towson observed 21 subjects. Half of the users spent an hour or a little longer, but 26 users spent between 100 and 515 minutes looking for frustrating experiences.
9
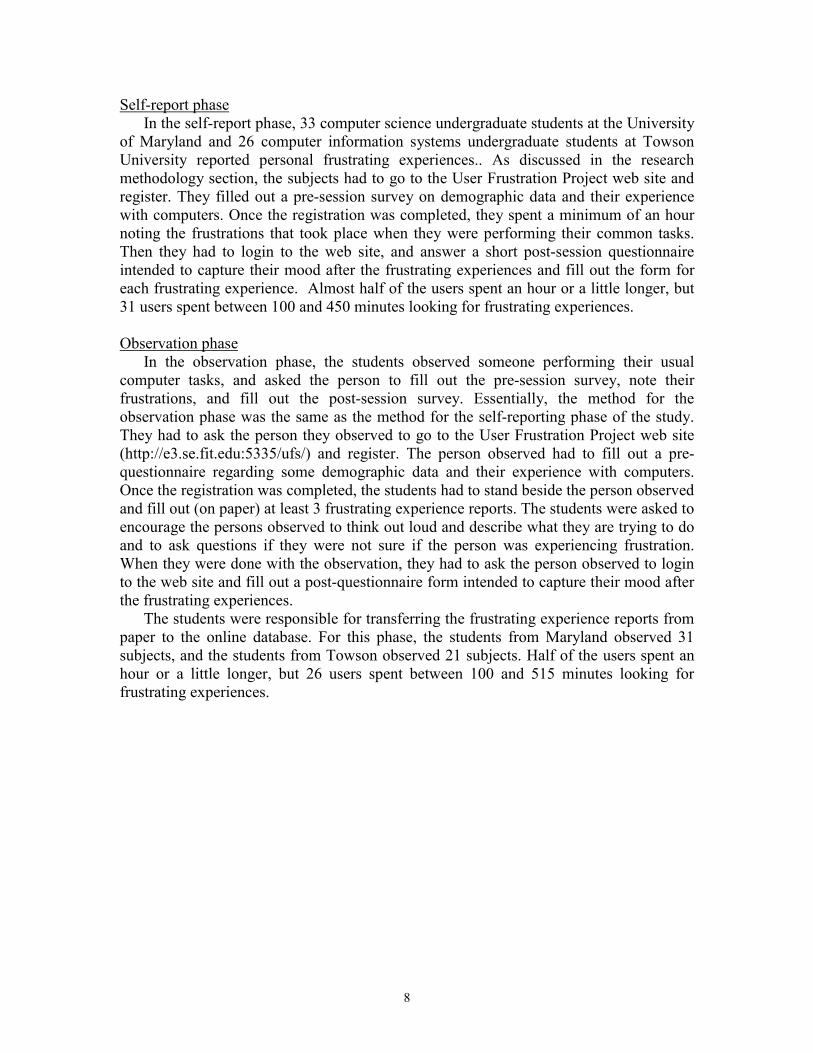
Results
Tables 2 and 3 contain the data collected from the self-reports and observations in terms of problem source and solution taken:
Frequency Problem source Self
UMD N=33,FE=120
Observation UMD N=31, FE=108
Self Towson N=26, FE=79
Observation Towson N=21, FE=66
Total
Web browsing 34 32 31 25 122 email 14 18 9 8 49 system (OS) 14 11 1 4 30 other internet use 12 4 6 4 26 video/audio software 10 6 4 0 20 word processing 5 20 10 10 45 chat and instant messaging
7 6 5 1 19
file browsers 7 2 1 0 10 programming tools 7 4 4 3 18 spreadsheet programs 2 2 1 3 8 graphic design programs 4 0 2 4 10 presentation software 1 1 2 1 5 database programs 2 0 2 0 4 hardware 1 2 1 3 7 Table 2: Problem source for self-reports and observations for Maryland and Towson universities (N=number of subjects, FE=number of frustrating experiences)
Frequency Solution taken
Self UMD N=33,FE=120
Observation UMD N=31,FE=108
Self Towson N=26,FE=79
Observation Towson N=21, FE=66
Total
I knew how to solve it because it happened before
44 36 11 11 102
I figured out a way to fix it myself
17 17 12 7 53
I was unable to solve it 16 18 16 10 60 I ignored the problem or found an alternative
16 8 9 9 42
I tried again 7 5 6 6 24 I restarted the program 3 4 3 4 14 I consulted online help 5 2 3 3 13 I asked someone for help 8 13 9 10 40 I rebooted 3 5 10 4 22 I consulted a manual or a book
1 0 0 2 3
Table 3: Solution taken for self-reports and observations for Maryland and Towson universities (N=number of subjects, FE=number of frustrating experiences)
10
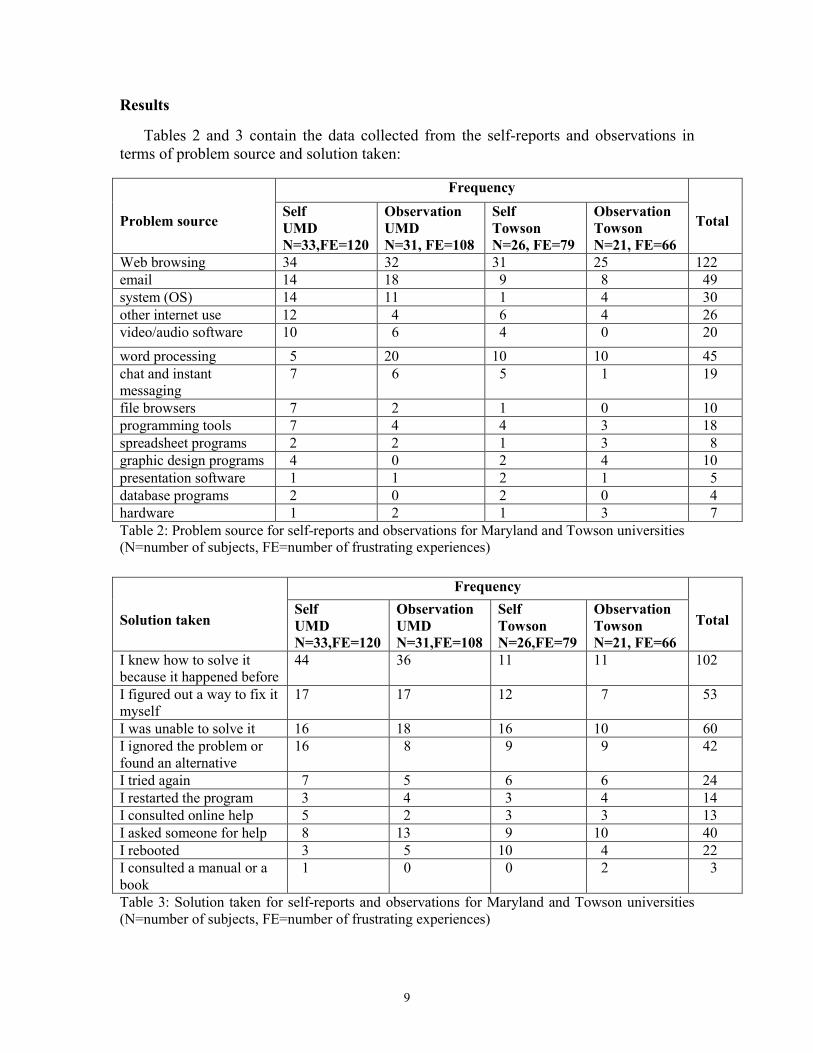
The analysis of data confirmed the first findings from the one-minute papers and helped better define the categories of problems, frequency with which they appear, cost they involve, and frustration they provoke.
The main 5 categories (internet, applications, system, hardware, other) appeared both in the self-reports and in the observation reports. However, we were able to define subcategories that might be helpful in finding specific solutions to specific problems (Table 4).
Internet Applications Operating System Hardware Other timed out/dropped/ refused connections (32)
error messages (35)
crashes (16) installation/update incompatibilities (8)
typing errors (4)
long download time (23)
freezes (24) wrong response (10)
mouse problems (5)
spam
web page/site not found (17)
missing/ hard to find features (23)
slow response (8)
printer problems (5)
email (15) crashes (13) unexpected message boxes (6)
pop-up adds (13) not opening/ closing (13)
low resources (4)
wrong response (13)
missing software (4)
annoying features (12)
unexpected/ improper shutdowns (3)
unexpected message boxes (6)
virus problems (2)
unrecognized file type (4)
upgrading software
“blue screen of death” (3)
insufficient help
Table 4: The main 5 categories of problems with their subcategories
11
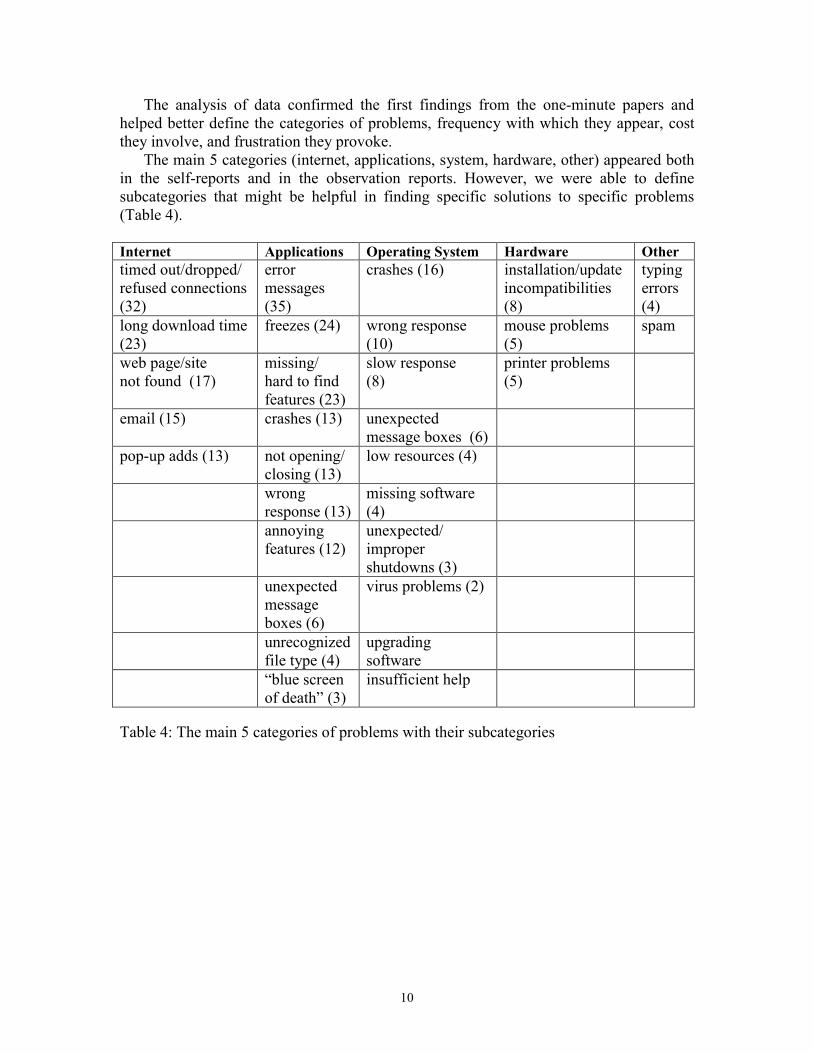
The frequency chart (Figure1) indicates that most frustrating experiences had happened before, as frequently as several times a month, week, or even several times a day.
Frequency of problems
0
5
10
15
20
25
30
35
first time morethan
once aday
severaltimes aweek
severaltimes amonth
one timea day
severaltimes a
year
once aweek
once amonth
UMD-Self
UMD-Observation
Towson-Self
Towson-Observation
Figure 1. Frequency with which problems occurred for the 4 groups of subjects studied.
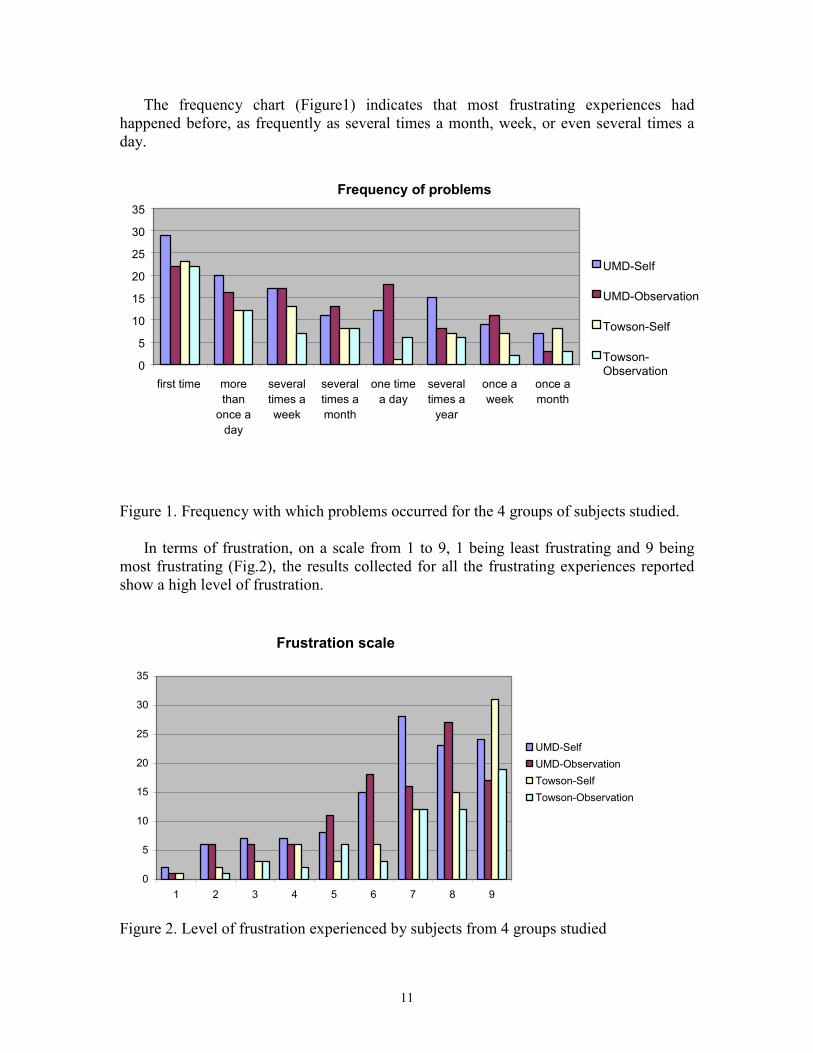
In terms of frustration, on a scale from 1 to 9, 1 being least frustrating and 9 being most frustrating (Fig.2), the results collected for all the frustrating experiences reported show a high level of frustration.
Frustration scale
0
5
10
15
20
25
30
35
1 2 3 4 5 6 7 8 9
UMD-SelfUMD-ObservationTowson-SelfTowson-Observation
Figure 2. Level of frustration experienced by subjects from 4 groups studied
12
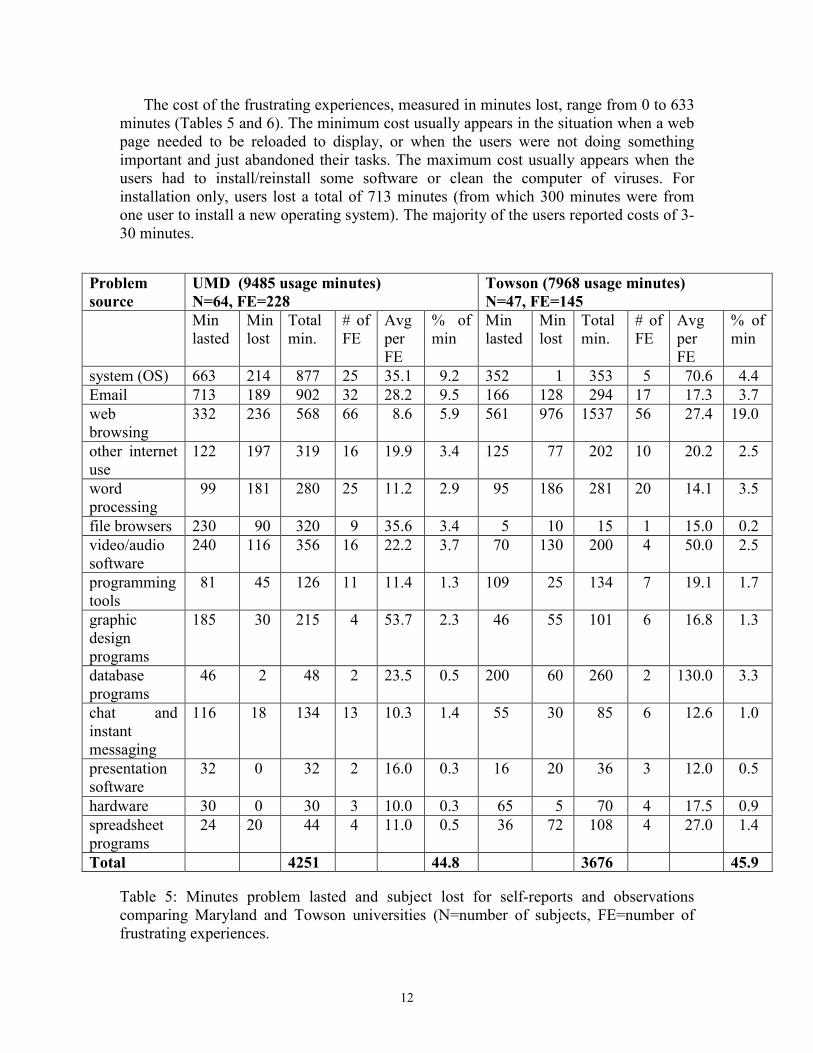
The cost of the frustrating experiences, measured in minutes lost, range from 0 to 633 minutes (Tables 5 and 6). The minimum cost usually appears in the situation when a web page needed to be reloaded to display, or when the users were not doing something important and just abandoned their tasks. The maximum cost usually appears when the users had to install/reinstall some software or clean the computer of viruses. For installation only, users lost a total of 713 minutes (from which 300 minutes were from one user to install a new operating system). The majority of the users reported costs of 3-30 minutes.
Problem source
UMD (9485 usage minutes) N=64, FE=228
Towson (7968 usage minutes) N=47, FE=145
Min lasted
Min lost
Total min.
# of FE
Avg per FE
% of min
Min lasted
Min lost
Total min.
# of FE
Avg per FE
% of min
system (OS) 663 214 877 25 35.1 9.2 352 1 353 5 70.6 4.4 Email 713 189 902 32 28.2 9.5 166 128 294 17 17.3 3.7 web browsing
332 236 568 66 8.6 5.9 561 976 1537 56 27.4 19.0
other internet use
122 197 319 16 19.9 3.4 125 77 202 10 20.2 2.5
word processing
99 181 280 25 11.2 2.9 95 186 281 20 14.1 3.5
file browsers 230 90 320 9 35.6 3.4 5 10 15 1 15.0 0.2 video/audio software
240 116 356 16 22.2 3.7 70 130 200 4 50.0 2.5
programming tools
81 45 126 11 11.4 1.3 109 25 134 7 19.1 1.7
graphic design programs
185 30 215 4 53.7 2.3 46 55 101 6 16.8 1.3
database programs
46 2 48 2 23.5 0.5 200 60 260 2 130.0 3.3
chat and instant messaging
116 18 134 13 10.3 1.4 55 30 85 6 12.6 1.0
presentation software
32 0 32 2 16.0 0.3 16 20 36 3 12.0 0.5
hardware 30 0 30 3 10.0 0.3 65 5 70 4 17.5 0.9 spreadsheet programs
24 20 44 4 11.0 0.5 36 72 108 4 27.0 1.4
Total 4251 44.8 3676 45.9 Table 5: Minutes problem lasted and subject lost for self-reports and observations comparing Maryland and Towson universities (N=number of subjects, FE=number of frustrating experiences.
13
Problem source
Self (10658 usage minutes) N=59, FE=199
Observations (6795 usage minutes) N=52, FE=174
Min lasted
Min lost
Total min.
# of FE
Avg per FE
% of min
Min lasted
Min lost
Total min.
# of FE
Avg per FE
% of min
System (OS) 574 39 613 15 40.9 5.7 441 176 617 15 41.1 9.1 Email 388 149 537 23 23.3 5.0 491 168 659 26 25.3 9.7 web browsing
553 855 1408 65 21.7 13.2 340 357 697 57 12.2 10.2
other internet use
182 202 384 18 21.3 3.6 65 72 137 8 17.1 2.0
word processing
75 184 259 15 17.2 2.4 119 183 302 30 10.0 4.4
file browsers 220 100 320 8 40.0 3.0 15 0 15 2 7.5 0.2 video/audio software
120 176 296 14 21.1 2.7 190 70 260 6 43.3 3.8
programming tools
159 35 194 11 17.6 1.8 31 35 66 7 9.4 1.0
graphic design programs
217 40 257 6 42.8 2.4 14 45 59 4 14.7 0.9
database programs
246 62 308 4 77.0 2.9 0 0 0 0 0.0 0.0
chat and instant messaging
94 28 122 12 10.2 1.1 77 20 97 7 13.8 1.4
presentation software
8 5 13 3 4.3 0.1 40 15 55 2 27.5 0.8
hardware 35 0 35 2 17.5 0.3 60 5 65 5 13.0 0.9 spreadsheet programs
16 40 56 3 18.7 0.5 44 52 96 5 19.2 1.4
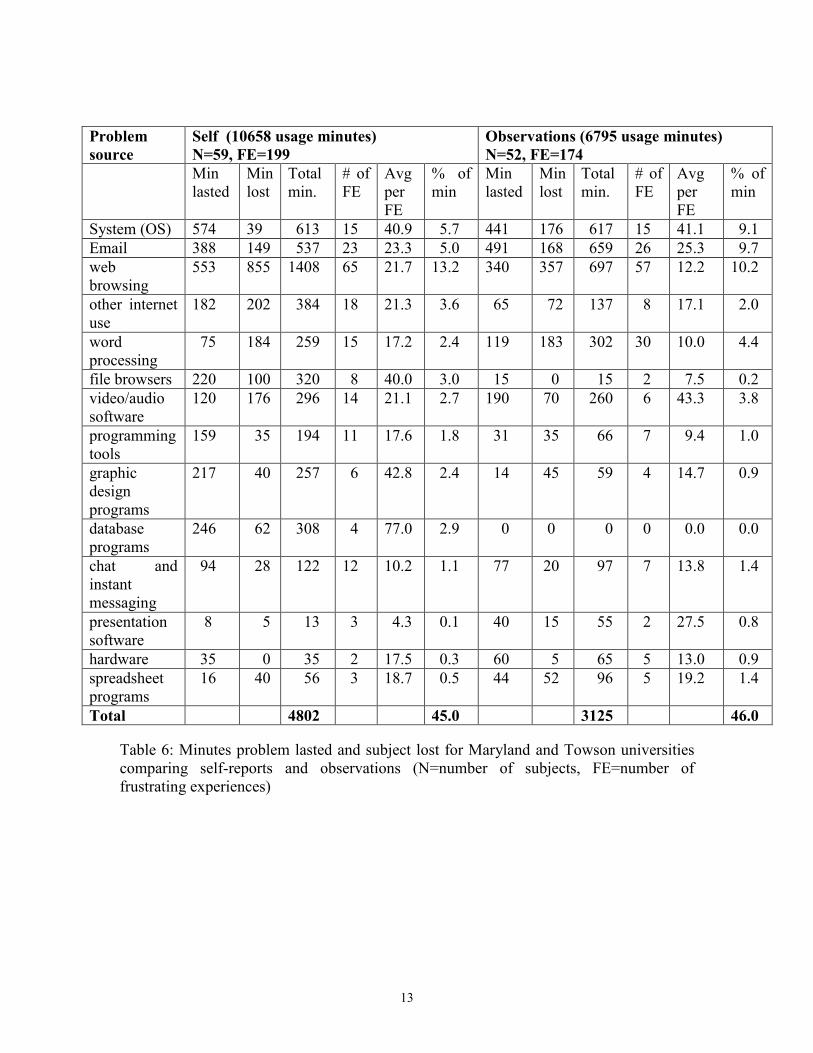
Total 4802 45.0 3125 46.0 Table 6: Minutes problem lasted and subject lost for Maryland and Towson universities comparing self-reports and observations (N=number of subjects, FE=number of frustrating experiences)
14
Discussion of the results
There are a number of interesting findings from the research data. These findings can be discussed in three broad topic areas: Causes of frustration, frequency of frustration, and time lost. Causes of Frustration The three tasks applications that were the cause of the most frustrating experiences were web browsing (122 frustrating experiences), e-mail (49 frustrating experiences), and word processing (44 frustrating experiences). This by itself does not necessarily identify the greatest causes of frustration in general, nor does it identify these applications as the greatest offenders, but rather, this reflects some of the most popular task applications for the users. We felt that it was more powerful to let users perform tasks that were relevant and important to the users themselves, rather than pre-assigned tasks chosen by the researchers. With pre-assigned tasks, users might not correctly identify the level of true frustration, since the users might view the pre-assigned tasks as unimportant. The specific causes of frustration may cross task applications, and are important to look at, for a discussion of possible solutions. The specific causes of frustration most often cited (from Table 3) were error messages (35), timed out/dropped/refused connections (32), freezes (24), long download time (23), and missing/hard-to-find features (23). Some of these frustrating problems are challenging to solve (such as freezes and dropped connections). However, some of these frustrating problems are well-documented, and the pathway to improvement is clear. Guidelines for clear, positive error messages appear in the research literature as early as 1982 (Shneiderman, 1982), however, many computer applications continue to incorporate error messages that are poorly-worded and confusing. Long download times can be improved by having the web designers write web pages that are smaller and have fewer graphics, and by having users upgrade their personal connection speeds to the Internet (Lazar, 2001). Improved interface design can assist in helping users find features that are not immediately obvious. Frequency of Frustration Frustration is a common event. The data indicates that frustrating experiences happen on a regular basis (Figure 1). Most subjects indicated that the frustration experience had occurred before (277/373 frustrating experiences had occurred before), as frequently as several times a month (40/373), week (54/373), or even several times a day (60/373). This illuminates the fact that users must deal with frustrating experiences on a frequent basis.
In terms of how to respond to frustrating experiences, subjects most frequently indicated that they “knew how to solve it because it happened before” (102/373), they “were unable to solve it” (60/373), or “figured out a way to fix it myself” (53/373). The subjects indicated that these frustrating experiences are not new, but rather, these same events have occurred before. This supports the previous data, reporting that in many cases, the same events repeatedly cause users frustration. For those that did not indicate a previous familiarity with how to respond, the subjects needed to either (1) spend time to figure out an appropriate response, or (2) were unable to solve the problem and therefore could not continue with their tasks. This might partially explain the high levels of
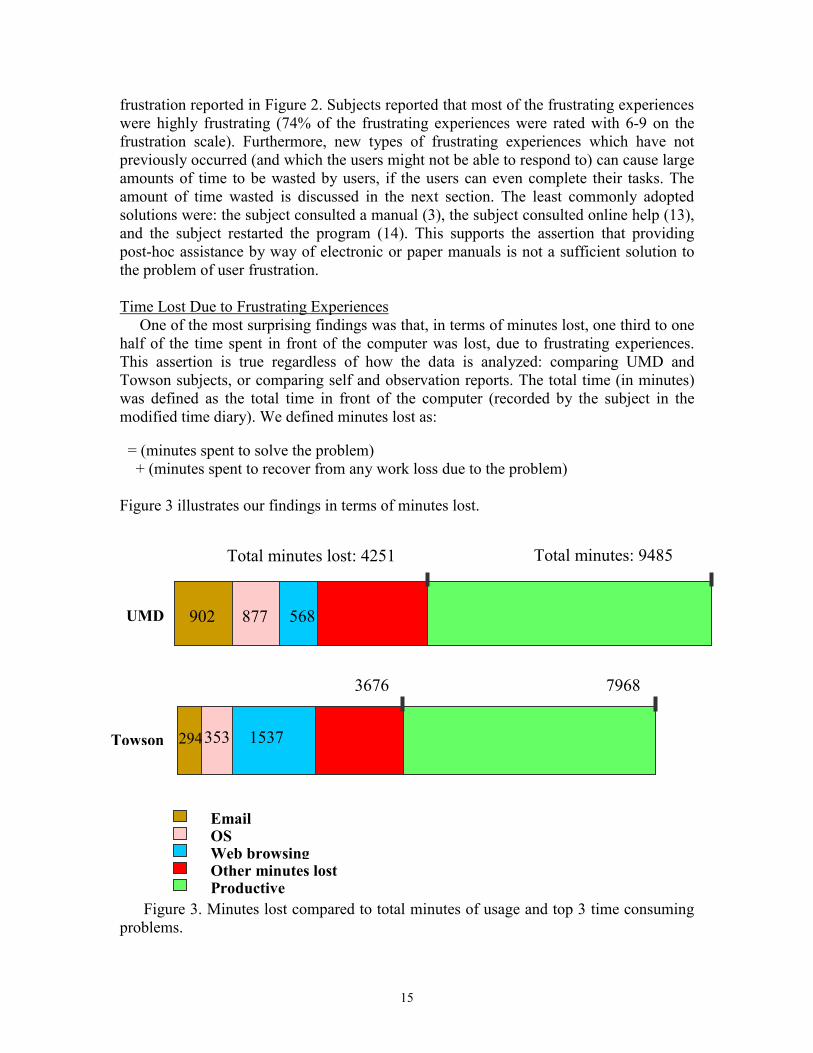
frustration reported in Figure 2. Subjects reported that most of the frustrating experiences were highly frustrating (74% of the frustrating experiences were rated with 6-9 on the frustration scale). Furthermore, new types of frustrating experiences which have not previously occurred (and which the users might not be able to respond to) can cause large amounts of time to be wasted by users, if the users can even complete their tasks. The amount of time wasted is discussed in the next section. The least commonly adopted solutions were: the subject consulted a manual (3), the subject consulted online help (13), and the subject restarted the program (14). This supports the assertion that providing post-hoc assistance by way of electronic or paper manuals is not a sufficient solution to the problem of user frustration. Time Lost Due to Frustrating Experiences One of the most surprising findings was that, in terms of minutes lost, one third to one half of the time spent in front of the computer was lost, due to frustrating experiences. This assertion is true regardless of how the data is analyzed: comparing UMD and Towson subjects, or comparing self and observation reports. The total time (in minutes) was defined as the total time in front of the computer (recorded by the subject in the modified time diary). We defined minutes lost as: = (minutes spent to solve the problem) + (minutes spent to recover from any work loss due to the problem)
Figure 3 illustrates our findings in terms of minutes lost.
Figure 3. Minutes los
problems.
Total minutes: 9485 Total minutes lost: 4251
n 4
l
568
UMD 902 8777968 3676
1537
Towso 353 29Emai
O S Web browsin gOther minutes lost
Productive15
t compared to total minutes of usage and top 3 time consuming
16
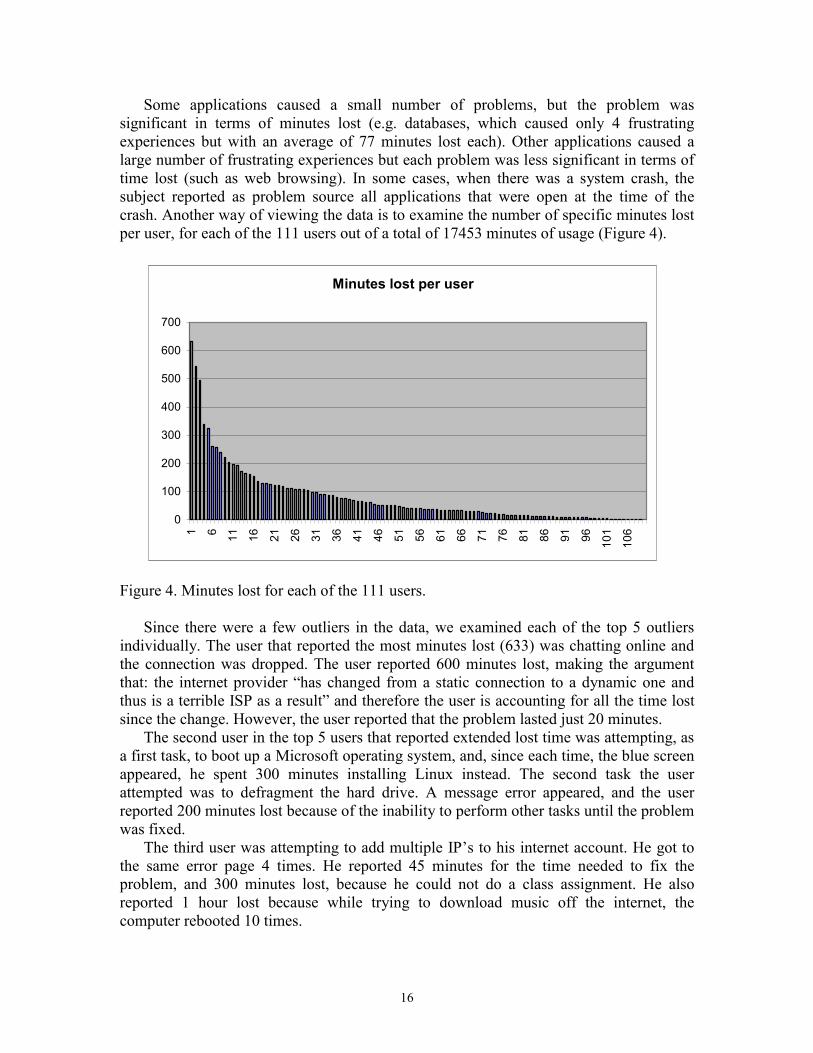
Some applications caused a small number of problems, but the problem was significant in terms of minutes lost (e.g. databases, which caused only 4 frustrating experiences but with an average of 77 minutes lost each). Other applications caused a large number of frustrating experiences but each problem was less significant in terms of time lost (such as web browsing). In some cases, when there was a system crash, the subject reported as problem source all applications that were open at the time of the crash. Another way of viewing the data is to examine the number of specific minutes lost per user, for each of the 111 users out of a total of 17453 minutes of usage (Figure 4).
Minutes lost per user
0
100
200
300
400
500
600
700
1 6 11 16 21 26 31 36 41 46 51 56 61 66 71 76 81 86 91 96 101
106
Figure 4. Minutes lost for each of the 111 users.
Since there were a few outliers in the data, we examined each of the top 5 outliers individually. The user that reported the most minutes lost (633) was chatting online and the connection was dropped. The user reported 600 minutes lost, making the argument that: the internet provider “has changed from a static connection to a dynamic one and thus is a terrible ISP as a result” and therefore the user is accounting for all the time lost since the change. However, the user reported that the problem lasted just 20 minutes.
The second user in the top 5 users that reported extended lost time was attempting, as a first task, to boot up a Microsoft operating system, and, since each time, the blue screen appeared, he spent 300 minutes installing Linux instead. The second task the user attempted was to defragment the hard drive. A message error appeared, and the user reported 200 minutes lost because of the inability to perform other tasks until the problem was fixed.
The third user was attempting to add multiple IP’s to his internet account. He got to the same error page 4 times. He reported 45 minutes for the time needed to fix the problem, and 300 minutes lost, because he could not do a class assignment. He also reported 1 hour lost because while trying to download music off the internet, the computer rebooted 10 times.
17
The fourth user reported 240 minutes lost while trying to get rid of a computer virus, and another 60 minutes because the internet was not working anymore, and he had to wait for a friend to come and fix it.
Finally, the fifth user reported 240 minutes lost because, in trying to access a site that was important for one of the school assignments, he forgot the password, and the site had no retrieving password function, so he had to go home and look through his notes to find the password.
After discarding the 5 users with the highest lost times reported, the numbers for the minutes lost changes in the following way: for the UMD groups, the percentage of overall time lost drops from 44.8% to 30.5%, and for the Towson groups, the percentage of time lost drops from 45.9% to 39.2%.
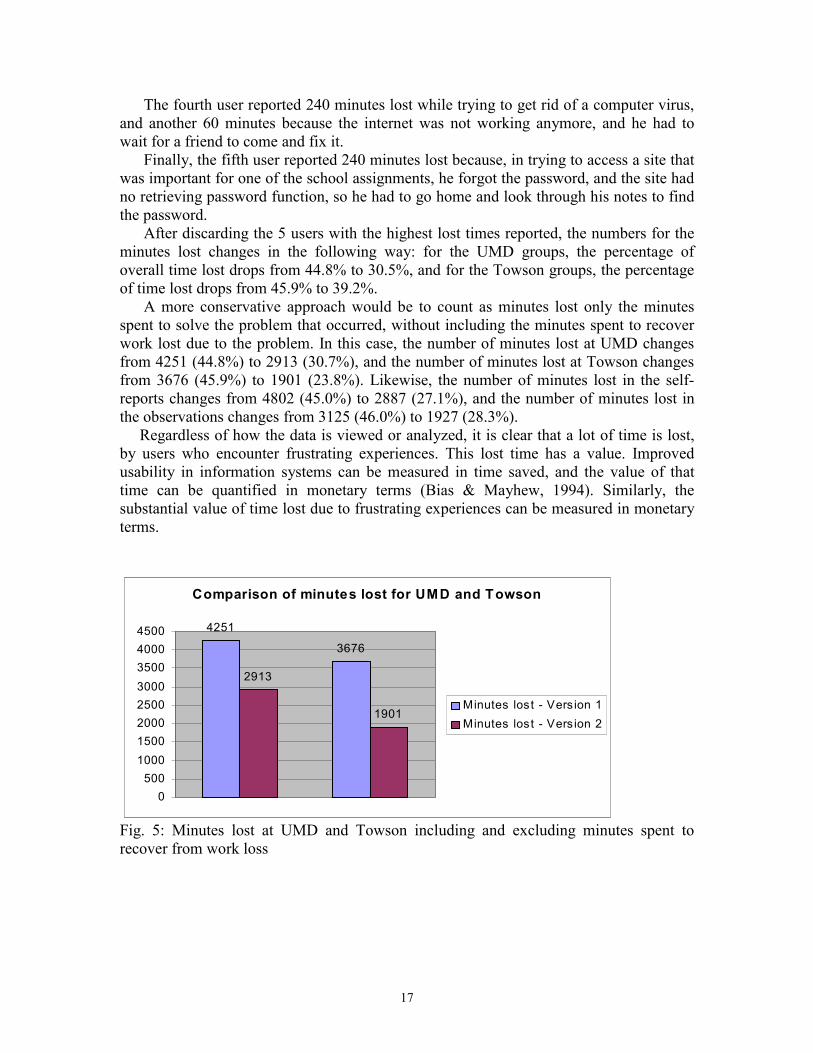
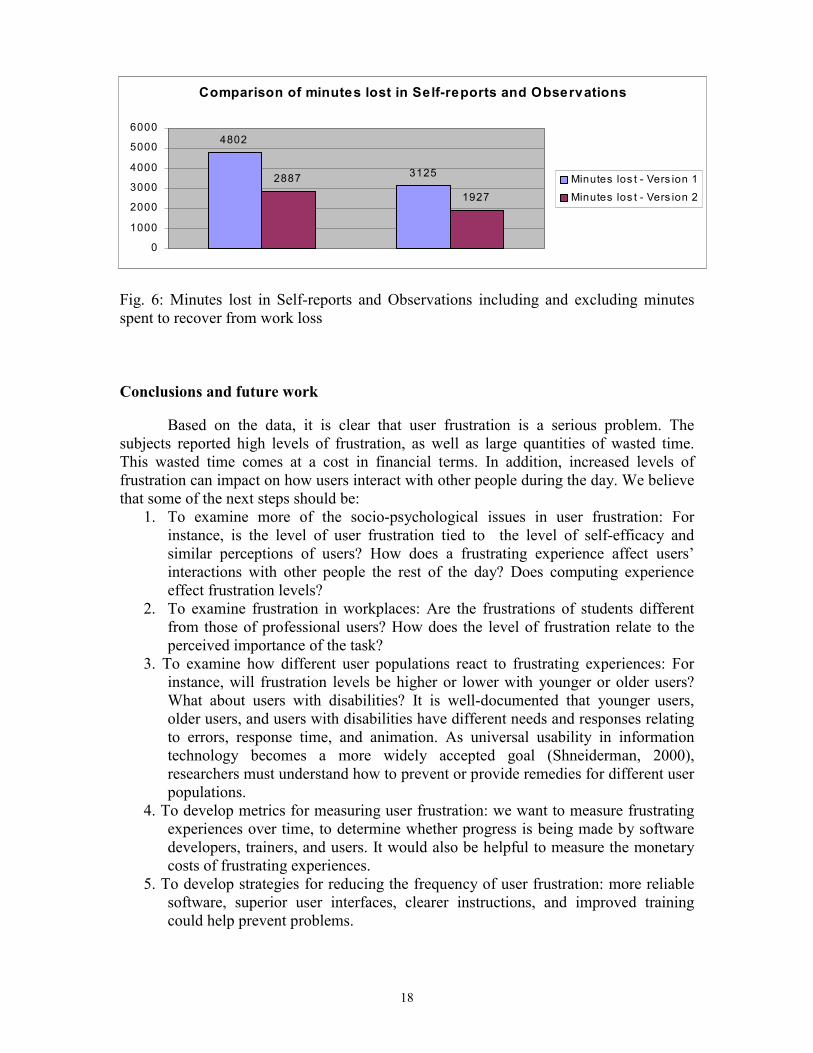
A more conservative approach would be to count as minutes lost only the minutes spent to solve the problem that occurred, without including the minutes spent to recover work lost due to the problem. In this case, the number of minutes lost at UMD changes from 4251 (44.8%) to 2913 (30.7%), and the number of minutes lost at Towson changes from 3676 (45.9%) to 1901 (23.8%). Likewise, the number of minutes lost in the self-reports changes from 4802 (45.0%) to 2887 (27.1%), and the number of minutes lost in the observations changes from 3125 (46.0%) to 1927 (28.3%). Regardless of how the data is viewed or analyzed, it is clear that a lot of time is lost, by users who encounter frustrating experiences. This lost time has a value. Improved usability in information systems can be measured in time saved, and the value of that time can be quantified in monetary terms (Bias & Mayhew, 1994). Similarly, the substantial value of time lost due to frustrating experiences can be measured in monetary terms.
Fig. 5: Minutes lost at UMD and Towson including and excluding minutes spent to recover from work loss
Comparison of minutes lost for UMD and Towson
4251
3676
2913
1901
0500
10001500200025003000350040004500
Minutes lost - Vers ion 1Minutes lost - Vers ion 2
18
Fig. 6: Minutes lost in Self-reports and Observations including and excluding minutes spent to recover from work loss Conclusions and future work
Based on the data, it is clear that user frustration is a serious problem. The subjects reported high levels of frustration, as well as large quantities of wasted time. This wasted time comes at a cost in financial terms. In addition, increased levels of frustration can impact on how users interact with other people during the day. We believe that some of the next steps should be:
1. To examine more of the socio-psychological issues in user frustration: For instance, is the level of user frustration tied to the level of self-efficacy and similar perceptions of users? How does a frustrating experience affect users’ interactions with other people the rest of the day? Does computing experience effect frustration levels?
2. To examine frustration in workplaces: Are the frustrations of students different from those of professional users? How does the level of frustration relate to the perceived importance of the task?
3. To examine how different user populations react to frustrating experiences: For instance, will frustration levels be higher or lower with younger or older users? What about users with disabilities? It is well-documented that younger users, older users, and users with disabilities have different needs and responses relating to errors, response time, and animation. As universal usability in information technology becomes a more widely accepted goal (Shneiderman, 2000), researchers must understand how to prevent or provide remedies for different user populations.
4. To develop metrics for measuring user frustration: we want to measure frustrating experiences over time, to determine whether progress is being made by software developers, trainers, and users. It would also be helpful to measure the monetary costs of frustrating experiences.
5. To develop strategies for reducing the frequency of user frustration: more reliable software, superior user interfaces, clearer instructions, and improved training could help prevent problems.
Comparison of minutes lost in Self-reports and Observations
4802
31252887
1927
0
1000
2000
3000
4000
5000
6000
Minutes los t - Vers ion 1Minutes los t - Vers ion 2
19
6. To develop methods for coping with user frustration so that the time wasted is reduced: these include help desks, knowledge bases, online help, and social forms of help by email, chat, instant messaging or online communities.
Acknowledgements We appreciate partial support from National Science Foundation grant for Information Technology Research (#0086143) Understanding the Social Impact of the Internet: A Multifaceted Multidisciplinary Approach. We appreciate the devoted efforts of Prof. Shirley Anne Becker of the Florida Institute of Technology and her students Ali Al-Badi and Madhan Thirukonda in preparing the website for data entry. References Adams, W., Brown, J., Rapeepun, D., Williams, W. (2001). The Effectiveness of Online Help Systems. Downloaded on April 9, 2002. Working paper available at: http://www.otal.umd.edu/SHORE2001/help/index.html. Baecker, R., Booth, K., Jovicic, S., McGrenere, J. and Moore, G. (2000). Reducing the Gap Between What Users Know and What They Need to Know. Proceedings of the ACM 2000 International Conference on Intelligent User Interfaces, 17-23. Berkowitz, L. (1978). Whatever Happened to the Frustration-Aggression Hypothesis? American Behavioral Scientist, 21(5), 691-708. Bias, R., and Mayhew, D. (1994). (eds.) Cost-Justifying Usability. San Francisco: Academic Press. Brosnan, M. (1998). The Impact of Computer Anxiety and Self-Efficacy Upon Performance. Journal of Computer Assisted Learning, 3(14), 223-234. Carroll, J.,and Carrithers, C. (1984). Training Wheels in a User Interface. Communications of the ACM, 27(8), 800-806. Collins, C., Caputi, P., Rawstorne, P., & Jayasuriya, R. (1999). Correlates of End-User Performance and Satisfaction with the Implementation of a Statistical Software Package. Proceedings of the 10th Australasian Conference on Information Systems. Compaq, Inc. (2001). Rage Against the Machine – a Compaq survey. Downloaded on: April 9, 2002. Available at: http://www.compaq.presscentre.co.uk/corp/Releases/release.asp?ReleaseID=485&NID=Research Davis, F. (1993). User acceptance of information technology: system characteristics, user perceptions, and behavioral impacts. International Journal of Man-Machine Studies, 38, 475-487.
20
Dollard, J., Doob, L., Miller, N., Mowrer, O., & Sears, R. (1939). Frustration and Aggression. New Haven: Yale University Press. Freud, S. Types of Onset of Neurosis, in James Strachey, ed. (1958). The Standard Edition of the Complete Psychological Works of Sigmund Freud vol. 12. London: Hogarth Press. Jacko, J., Sears, A., & Borella, M. (2000). The effect of network delay and media on user perceptions of web resources. Behaviour and Information Technology, 19(6), 427-439. Johnson, C. (1995). Time and the Web: Representing and Reasoning about Temporal Properties of Interaction with Distributed Systems Time and Space. Proceedings of the HCI'95 Conference on People and Computers, 39-50. Johnson, C. (1998). Electronic Gridlock, information saturation, and the unpredictability of information retrieval over the World Wide Web. In P. Palanque and F. Paterno (eds.) Formal Methods in Human-Computer Interaction (pp. 261-282) London: Springer. Lazar, J. (2001). User-Centered Web Development. Sudbury, MA: Jones and Bartlett Publishers. Lazar, J. and Huang, Y. (2003,in press). Improved Error Message Design in Web Browsers. In J. Ratner (ed.). Human Factors and Web Development (2nd ed.). Mahwah, NJ: Lawrence Erlbaum Associates. Lazar J., and Norcio, A. (2002). Novice User Perception of Error on the Web: Experimental Findings. Paper under review. Lazar, J., & Norcio, A. (2000). System and Training Design for End-User Error. In S. Clarke & B. Lehaney (Eds.), Human-Centered Methods in Information Systems: Current Research and Practice (pp. 76-90). Hershey, PA: Idea Group Publishing. Lazar, J., & Preece, J. (2001). Using Electronic Surveys to Evaluate Networked Resources: From Idea to Implementation. In C. McClure & J. Bertot (Eds.), Evaluating Networked Information Services: Techniques, Policy, and Issues . Medford, NJ: Information Today, 137-154. Lloyd, B.H. & Gressard, C. (1984). Reliability and Factorial Validity of Computer Attitude Scales. Educational and Psychological Measurement, 44, 501-505. Murphy, C., Coover, D., & Owen, S. (1989). Development and Validation of the Computer Self-efficacy Scale. Educational and Psychological Measurement, 49, 893-899.
21
Nash, J.B. & Moroz, P.A. (1997). An examination of the factor structures of the Computer Attitude Scale. Journal of Educational Computing Research, 17(4), 341-356. Norman, D. (1983). Design rules based on analyses of human error. Communications of the ACM, 26(4), 254-258. Olaniran, B. (1996). A Model of Group Satisfaction in Computer-Mediated-Communication and Face-to-Face Meetings. Behavior and Technology, 15(1), 24-36. Ramsay, J., Barbesi, A., & Preece, J. (1998). A psychological investigation of long retrieval times on the World Wide Web. Interacting with Computers, 10, 77-86. Riseberg, J., Klein, J., Fernandez, R., and Picard, R. (1998) Frustrating the User On Purpose: Using Biosignals in a Pilot Study to Detect the User's Emotional State. Proceedings of ACM 1998 CHI: Conference on Human Factors in Computing Systems, 227-228. Schleifer, L. and Amick, B. (1989). System Response Time and Method of Pay: Stress Effects in Computer-Based Tasks Articles. International Journal of Human-Computer Interaction 1(1), 23-39. Sears, A., & Jacko, J. (2000). Understanding the relation between network quality of service and the usability of distributed multimedia documents. Human-Computer Interaction, 15(1), 43-68. Shubin, H., and Meehan, M. (1997). Navigation in web applications. Interactions, 4(6), 13-17. Shneiderman, B. (2000). Universal Usability: Pushing Human-Computer Interaction Research to Empower Every Citizen. Communications of the ACM, 43(5), 84-91. Shneiderman, B. (1998). Designing the User Interface: Strategies for Effective Human-Computer Interaction. (3rd ed.). Reading, MA: Addison-Wesley. Shneiderman, B. (1982). System message design: Guidelines and experimental results. In A. Badre and B. Shneiderman (eds). Directions in Human/Computer Interaction. Norwood, NJ: Ablex Publishing, 55-78. Zviran, M. (1992). Evaluating User Satisfaction in a Hospital Environment: An Exploratory Study. Health Care Management Review, 17(3), 51-62.