Embed Size (px)
Citation preview
G1335 • Index: Soil ManagementFertility • 2006, Revised December 2015
Determining Crop Available Nutrients from Manure
Charles A. Shapiro, Soil Scientist, Crop NutritionLeslie Johnson, Animal Manure Management Project Coordinator
Amy Millmier Schmidt, Livestock Bioenvironmental EngineerRichard K. Koelsch, Extension Specialist
NebGuideResearch-Based Information That You Can UseNebraska Extension
This NebGuide discusses the availability and use of ma-nure nutrients for field crop production.
When managed correctly, nutrients in livestock ma-nure can be a valuable resource. When managed improp-erly, however, these same nutrients represent a potential environmental pollutant. Accurate crediting of manure nu-trients within a total crop nutrient program is fundamental to utilizing manure as a resource. This NebGuide illustrates how to estimate the crop available manure nutrients (part c, Figure 1) and calculate an agronomically based manure application rate. There are other tools available that do the calculations for you. This NebGuide will explain each step of the process. After understanding how and why these cal-culations are made, the tools offer fast and accurate ways to work with multiple fields and manure sources. To illustrate the calculations, an example calculation is provided and a worksheet is included, allowing you to determine manure availability for your situation.
To accurately credit crop available manure nutrients, three pieces of information are needed:
1. Manure nutrient of concentration at time of land application— the concentration of individual nutrients in manure measured as pounds of nutrient per unit of manure (ton, 1,000 gallons, or acre- inch).
2. Manure application rate— the rate at which manure is applied to the land measured as tons, 1,000 gallons, or acre- inches.
3. Manure nutrient availability factors— the percentage of nutrients in manure available to the crop in a given year.
Estimating Manure Nutrient Concentration
Knowing the concentration of nutrients in manure is as crucial as knowing those facts about commercial fertil-izer. Table 1 provides estimates of typical manure nutrient concentrations. Because manure nutrient content can vary with livestock species, manure moisture, livestock diet, and collection and storage losses, a manure analysis is prefer-able to using table values for an accurate estimate. Where manure is stored outdoors, sampling on a seasonal basis (when significant quantities of manure are land applied) is recommended.
a) Total ManureNutrientsProduced
b) ManureNutrients AfterStorage Losses
c) Crop Available ManureNutrients
Figure 1. Three key estimates needed to use manure nutrients as a resource.
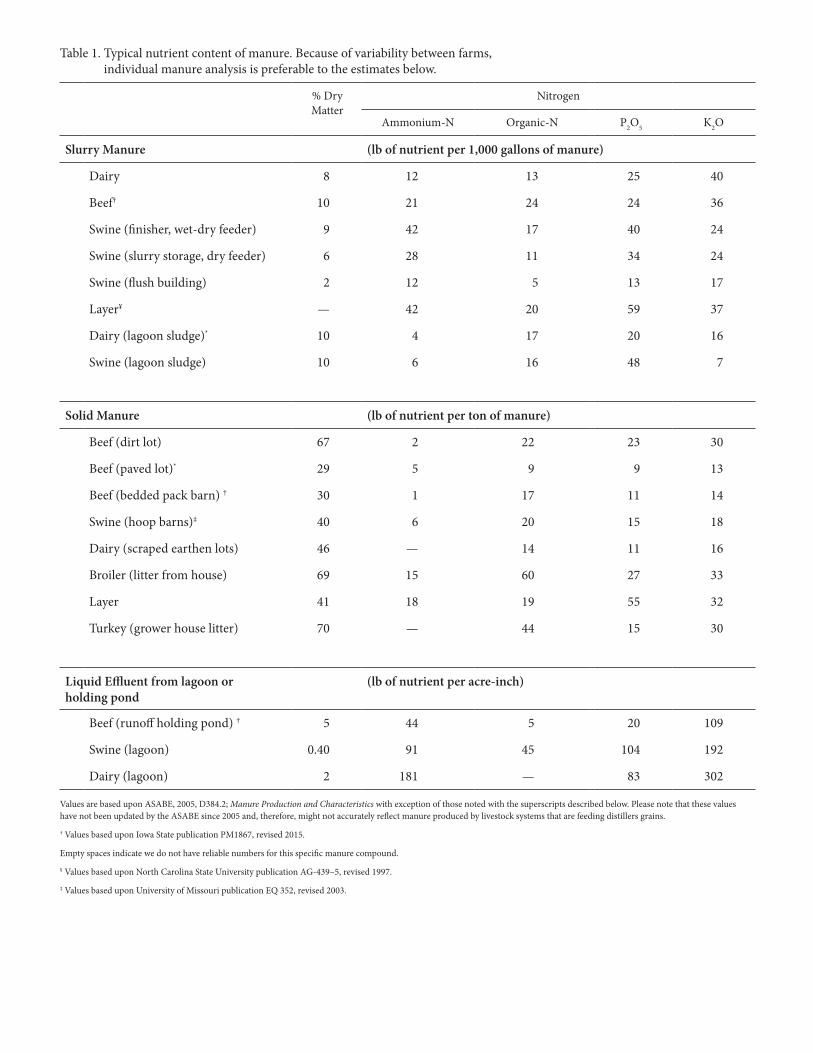
Table 1. Typical nutrient content of manure. Because of variability between farms, individual manure analysis is preferable to the estimates below.
% Dry Matter
Nitrogen
Ammonium- N Organic- N P2O5 K2O
Slurry Manure (lb of nutrient per 1,000 gallons of manure)
Dairy 8 12 13 25 40
Beef† 10 21 24 24 36
Swine (finisher, wet- dry feeder) 9 42 17 40 24
Swine (slurry storage, dry feeder) 6 28 11 34 24
Swine (flush building) 2 12 5 13 17
Layer¥ — 42 20 59 37
Dairy (lagoon sludge)* 10 4 17 20 16
Swine (lagoon sludge) 10 6 16 48 7
Solid Manure (lb of nutrient per ton of manure)
Beef (dirt lot) 67 2 22 23 30
Beef (paved lot)* 29 5 9 9 13
Beef (bedded pack barn) † 30 1 17 11 14
Swine (hoop barns)‡ 40 6 20 15 18
Dairy (scraped earthen lots) 46 — 14 11 16
Broiler (litter from house) 69 15 60 27 33
Layer 41 18 19 55 32
Turkey (grower house litter) 70 — 44 15 30
Liquid Effluent from lagoon or holding pond
(lb of nutrient per acre- inch)
Beef (runoff holding pond) † 5 44 5 20 109
Swine (lagoon) 0.40 91 45 104 192
Dairy (lagoon) 2 181 — 83 302
Values are based upon ASABE, 2005, D384.2; Manure Production and Characteristics with exception of those noted with the superscripts described below. Please note that these values have not been updated by the ASABE since 2005 and, therefore, might not accurately reflect manure produced by livestock systems that are feeding distillers grains.
† Values based upon Iowa State publication PM1867, revised 2015.
Empty spaces indicate we do not have reliable numbers for this specific manure compound.
¥ Values based upon North Carolina State University publication AG- 439– 5, revised 1997.
‡ Values based upon University of Missouri publication EQ 352, revised 2003.
A manure analysis should include:• Both ammonium- nitrogen and organic- nitrogen (or
total nitrogen). Knowing two of the three values means you can calculate the third.
Total- N = Ammonium- N + Organic- NNitrogen is excreted in two forms (Figure 2). About one- half of the excreted nitrogen is a stable organic- nitrogen present in the feces. The other half is excreted as urea in urine, which decomposes rapidly to ammonium- N (NH4+).
• Phosphorus and potassium as P2O5 and K2O equivalents.
• Nutrients in the same units of measure as you calibrate your manure application system. If manure application is measured by tons per acre, request the analysis be reported as pounds of nutrient per ton.
• Nutrients on a “wet” or “as is” basis since you are cali-brating application equipment on a wet manure basis. Because laboratories may use different methods to determine nutrient availability on a “wet” basis, using the “as- is” values on your manure analysis report to calculate nutrient availability, using the method in this publication is recommended. Storage and handling methods may affect the moisture content, which makes the manure appear more variable than it is. When comparing repeat samples, the dry matter basis analy-sis might give more insight into any changes over time.
Additional information on manure sampling is avail-able in Manure Testing for Nutrient Content (NebGuide G1450).
Estimating Manure Application Rate
If manure nutrients are to be managed as a nutrient resource, the application equipment must be managed as a fertilizer applicator. Knowledge of manure application rate, like knowledge of fertilizer application rate, is key to managing nutrients applied to crops. Manure application rate can be estimated by one of the following:
1. Using one of the calibration methods detailed at go.unl.edu/calibration.
2. Maintaining a record of total manure applied to a field (i.e., total number of loads × average capacity ÷ the field’s area). The Nutrient Management Record Keep-ing Calendar is a helpful tool for record keeping. More information about the calendar can be found at: go.unl.edu/ec136.
Estimating Crop Available Nutrients
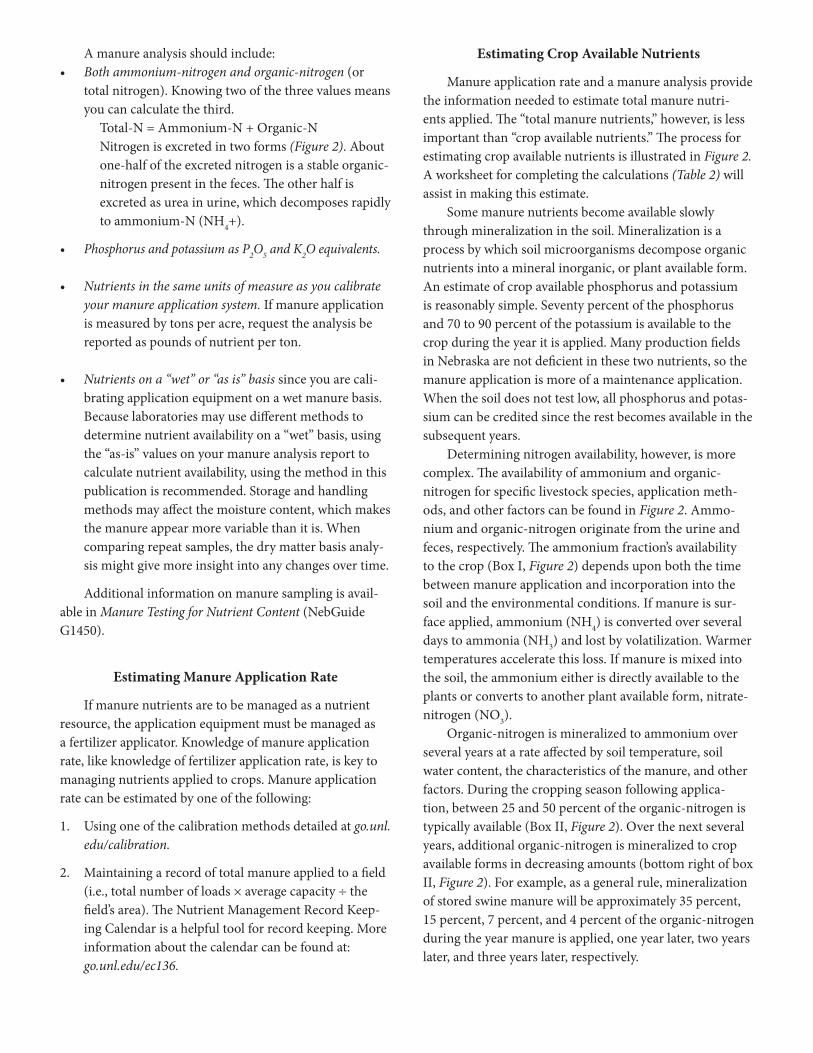
Manure application rate and a manure analysis provide the information needed to estimate total manure nutri-ents applied. The “total manure nutrients,” however, is less important than “crop available nutrients.” The process for estimating crop available nutrients is illustrated in Figure 2. A worksheet for completing the calculations (Table 2) will assist in making this estimate.
Some manure nutrients become available slowly through mineralization in the soil. Mineralization is a process by which soil microorganisms decompose organic nutrients into a mineral inorganic, or plant available form. An estimate of crop available phosphorus and potassium is reasonably simple. Seventy percent of the phosphorus and 70 to 90 percent of the potassium is available to the crop during the year it is applied. Many production fields in Nebraska are not deficient in these two nutrients, so the manure application is more of a maintenance application. When the soil does not test low, all phosphorus and potas-sium can be credited since the rest becomes available in the subsequent years.
Determining nitrogen availability, however, is more complex. The availability of ammonium and organic- nitrogen for specific livestock species, application meth-ods, and other factors can be found in Figure 2. Ammo-nium and organic- nitrogen originate from the urine and feces, respectively. The ammonium fraction’s availability to the crop (Box I, Figure 2) depends upon both the time between manure application and incorporation into the soil and the environmental conditions. If manure is sur-face applied, ammonium (NH4) is converted over several days to ammonia (NH3 ) and lost by volatilization. Warmer temperatures accelerate this loss. If manure is mixed into the soil, the ammonium either is directly available to the plants or converts to another plant available form, nitrate- nitrogen (NO3).
Organic- nitrogen is mineralized to ammonium over several years at a rate affected by soil temperature, soil water content, the characteristics of the manure, and other factors. During the cropping season following applica-tion, between 25 and 50 percent of the organic- nitrogen is typically available (Box II, Figure 2). Over the next several years, additional organic- nitrogen is mineralized to crop available forms in decreasing amounts (bottom right of box II, Figure 2). For example, as a general rule, mineralization of stored swine manure will be approximately 35 percent, 15 percent, 7 percent, and 4 percent of the organic- nitrogen during the year manure is applied, one year later, two years later, and three years later, respectively.
Soil Testing and Crop Monitoring
The previous procedures have provided a “calculated” estimate of nutrient availability from manure. Soil testing provides a “field measurement” of residual nutrients. For a producer who regularly soil tests, is this calculated nitrogen availability in subsequent years estimate necessary? Yes, it is. The reasoning follows:
A deep soil test measures soil nitrate- N at the time of sampling. The above calculations estimate organic and ammonium nitrogen accessible to the crop during the growing season and in future years. Although most manure nitrogen will eventually be converted to nitrate nitrogen, this has not happened at the time soil samples are typically taken (fall, winter, or early spring). A soil test for nitrate nitrogen will not account for the future nitrogen available from manure. Thus, the “field measured” and “calculated” values are independent sources of nitrogen and should be added together. In the future we might have soil tests that accurately predict “mineralizable nitrogen,” but to date these have not been proven to be accurate under all field conditions.
The amount of nitrogen provided by the manure nitrogen credit is an estimate based on average conditions. An alternative strategy is the presidedress nitrate test (PSNT), which may provide a more accurate prediction of when manure released nitrogen is sufficient to produce maximum yields in corn. The PSNT test is a one- foot soil sample taken in early June or at the six to eight leaf stage. The soil is analyzed for nitrates. By this time of the growing season, manure nitrogen is mineralizing to nitrate, and this test will help determine if there is enough nitrogen avail-able. In Iowa and other states a soil nitrate level of over 25 ppm is usually sufficient for maximum corn production.
Calculating Crop Available Nutrients
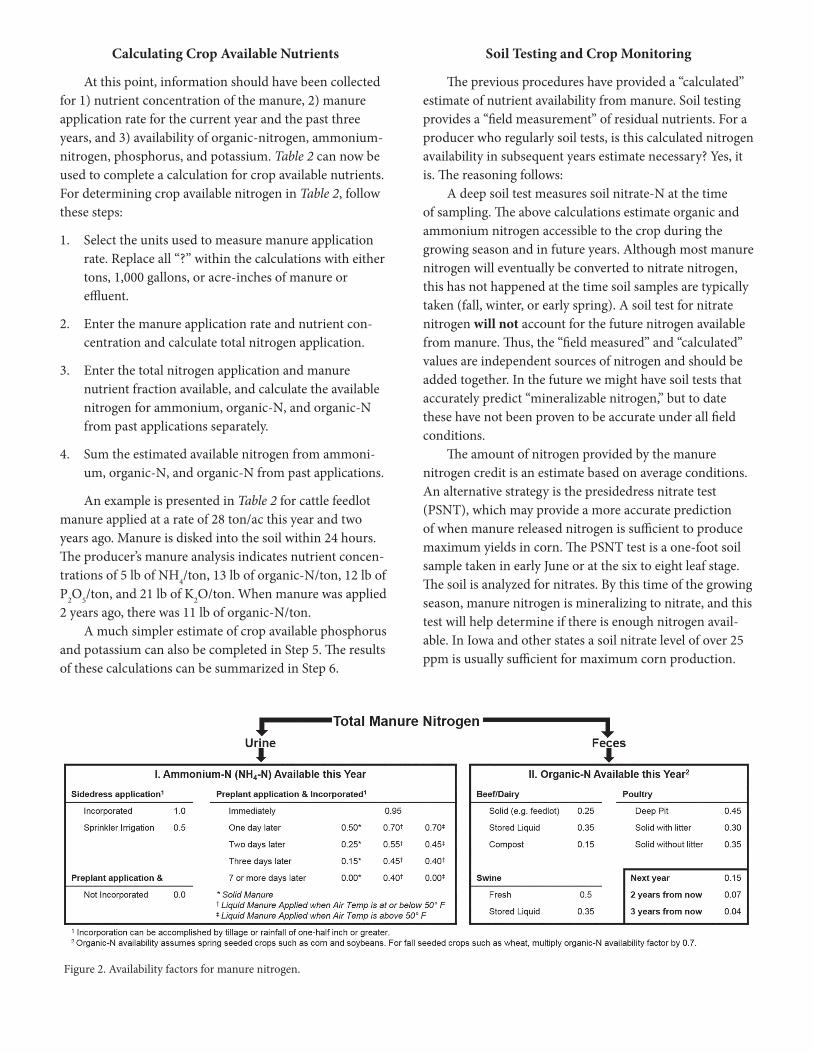
At this point, information should have been collected for 1) nutrient concentration of the manure, 2) manure application rate for the current year and the past three years, and 3) availability of organic- nitrogen, ammonium- nitrogen, phosphorus, and potassium. Table 2 can now be used to complete a calculation for crop available nutrients. For determining crop available nitrogen in Table 2, follow these steps:
1. Select the units used to measure manure application rate. Replace all “?” within the calculations with either tons, 1,000 gallons, or acre- inches of manure or effluent.
2. Enter the manure application rate and nutrient con-centration and calculate total nitrogen application.
3. Enter the total nitrogen application and manure nutrient fraction available, and calculate the available nitrogen for ammonium, organic- N, and organic- N from past applications separately.
4. Sum the estimated available nitrogen from ammoni-um, organic- N, and organic- N from past applications.
An example is presented in Table 2 for cattle feedlot manure applied at a rate of 28 ton/ac this year and two years ago. Manure is disked into the soil within 24 hours. The producer’s manure analysis indicates nutrient concen-trations of 5 lb of NH4/ton, 13 lb of organic- N/ton, 12 lb of P2O5/ton, and 21 lb of K2O/ton. When manure was applied 2 years ago, there was 11 lb of organic-N/ton.
A much simpler estimate of crop available phosphorus and potassium can also be completed in Step 5. The results of these calculations can be summarized in Step 6.
Figure 2. Availability factors for manure nitrogen.
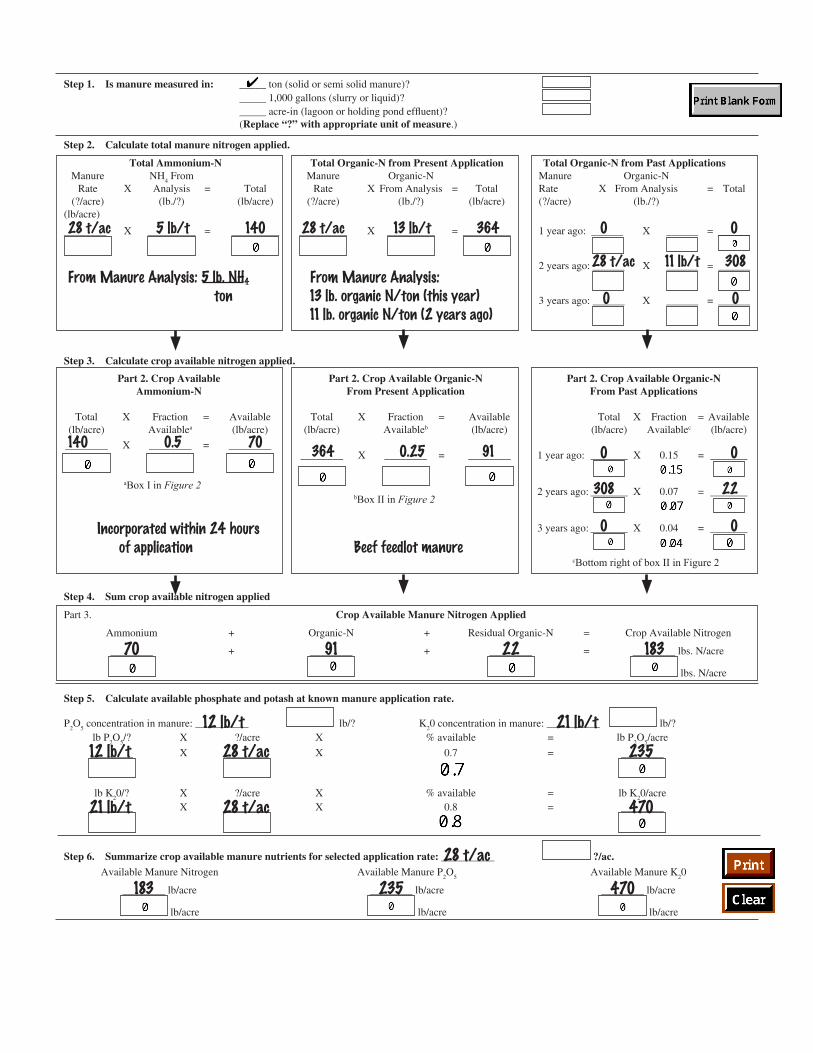
28 t/ac 5 lb/t 140 28 t/ac 13 lb/t 364 0 0
From Manure Analysis: 5 lb. NH4 From Manure Analysis:ton 13 lb. organic N/ton (this year)
11 lb. organic N/ton (2 years ago)
140 0.5 70 364 0.25 91 0 0
308 22
Incorporated within 24 hours 0 0
of application Beef feedlot manure
Part 2. Crop Available Organic-NFrom Past Applications
Total X Fraction = Available(lb/acre) Availablec (lb/acre)
1 year ago: _______ X 0.15 = _______
2 years ago: _______ X 0.07 = _______
3 years ago: _______ X 0.04 = _______
cBottom right of box II in Figure 2
Part 2. Crop Available Organic-NFrom Present Application
Total X Fraction = Available(lb/acre) Availableb (lb/acre)
________ X ________ = ________
bBox II in Figure 2
Step 1. Is manure measured in: _____ ton (solid or semi solid manure)? _____ 1,000 gallons (slurry or liquid)? _____ acre-in (lagoon or holding pond effluent)? (Replace “?” with appropriate unit of measure.)
Step 2. Calculate total manure nitrogen applied.
Total Ammonium-N Total Organic-N from Present Application Total Organic-N from Past ApplicationsManure NH4 From Manure Organic-N Manure Organic-N
Rate X Analysis = Total Rate X From Analysis = Total Rate X From Analysis = Total(?/acre) (lb./?) (lb/acre) (?/acre) (lb./?) (lb/acre) (?/acre) (lb./?)
(lb/acre)
________ X _________ = _________ _________ X _________ = _________ 1 year ago: ______ X ______ = ______
2 years ago: ______ X ______ = ______
3 years ago: ______ X ______ = ______
Step 3. Calculate crop available nitrogen applied.
Step 4. Sum crop available nitrogen applied
Part 3. Crop Available Manure Nitrogen Applied
Ammonium + Organic-N + Residual Organic-N = Crop Available Nitrogen
________ + ________ + ________ = ________ lbs. N/acre
lbs. N/acre
Step 5. Calculate available phosphate and potash at known manure application rate.
P2O5 concentration in manure: __________ lb/? K20 concentration in manure: __________ lb/?lb P2O5/? X ?/acre X % available = lb P2O5/acre
________ X ________ X 0.7 = ________
lb K20/? X ?/acre X % available = lb K20/acre________ X ________ X 0.8 = ________
Step 6. Summarize crop available manure nutrients for selected application rate: __________ ?/ac.Available Manure Nitrogen Available Manure P2O5 Available Manure K20
________ lb/acre ________ lb/acre ________ lb/acre
lb/acre lb/acre lb/acre
Part 2. Crop AvailableAmmonium-N
Total X Fraction = Available(lb/acre) Availablea (lb/acre)
________ X ________ = ________
aBox I in Figure 2
28 t/ac 11 lb/t 308
0 0
70 91 22 183
12 lb/t 21 lb/t
12 lb/t 28 t/ac 235
21 lb/t 28 t/ac 470
28 t/ac
183 235 470
Nebraska has not published recommendations for this test, but refers people to the Iowa publications.
Corn can be monitored to determine if a nitrogen deficiency is developing by use of a chlorophyll meter or other canopy sensor. Several sensors are available commer-cially. What is still unknown is whether their calibrations are adequate for manured fields since there might be more future N available than under non- manured fields. Under irrigated conditions, producers have the option of apply-ing additional nitrogen when needed through fertigation. Under rainfed conditions, additional N is difficult to apply after the 11- leaf stage unless high clearance ground appli-cation is used.
Phosphorus and potassium application needs can be determined by soil testing. Regular soil testing of fields receiving manure will document phosphorus and potassi-um status.
Using any one of these techniques or a combination will allow more accurate crediting of manure nutrients with confidence. The “calculated” estimate of manure nitrogen will remain an important pre- growing season planning tool for manure nutrient sources.
This publication has been peer- reviewed.UNL Extension publications are available online at http://extension.unl.edu/publications.
Extension is a Division of the Institute of Agriculture and Natural Resources at the University of Nebraska— Lincoln cooperating with the Counties and the United States
Department of Agriculture.
University of Nebraska— Lincoln Extension educational programs abide with the non-discrimination policies of the University of Nebraska— Lincoln and the United States
Department of Agriculture.
© 2006– 2016, The Board of Regents of the University of Nebraska on behalf of the University of Nebraska— Lincoln Extension. All rights reserved.
Once the available nutrients are determined, the next step is to fit this information into a nutrient management plan. Extension Circular EC117, Fertilizer Suggestions for Corn, details how to determine the total nutrient needs based on soil tests and yield expectation. The Nutrient Management for Agronomic Crops in Nebraska, EC155 (re-vised 2014) provides nutrient recommendations for many Nebraska crops. Calculating the Value of Manure for Crop Production, G1519 assists in calculating the fertilizer value of the nutrients to be applied to a particular field.
Additional Resources
All University of Nebraska— Lincoln resources for ma-nure nutrient management planning can be found online at manure.unl.edu and soil testing and nutrient recommenda-tions can be found at cropwatch.unl.edu/soils. The manure website contains software tools, sample records, regulatory information, and other tools associated with nutrient man-agement planning.