Embed Size (px)
Citation preview

Determining H0 and q0 from Supernova Data
Mian Wang Henan Normal University, P.R. China
Baolian Cheng Los Alamos National Laboratory
PANIC11, 25 July, 2011,MIT, Cambridge, MA
LA-UR-11-03930
Abstract
Since 1929 when Edwin Hubble showed that the Universe is expanding, extensive observations of redshifts and relative distances of galaxies have established the form of expansion law. Mapping the kinematics of the expanding universe requires sets of measurements of the relative size and age of the universe at different epochs of its history. There has been decades effort to get precise measurements of two parameters that provide a crucial test for cosmology models. The two key parameters are the rate of expansion, i.e., the Hubble constant (H0) and the deceleration in expansion (q0). These two parameters have been studied from the exceedingly distant clusters where redshift is large. It is indicated that the universe is made up by roughly 73% of dark energy, 23% of dark matter, and 4% of normal luminous matter; and the universe is currently accelerating. Recently, however, the unexpected faintness of the Type Ia supernovae (SNe) at low redshifts (z<1) provides unique information to the study of the expansion behavior of the universe and the determination of the Hubble constant. In this work, We present a method based upon the distance modulus redshift relation and use the recent supernova Ia data to determine the parameters H0 and q0 simultaneously. Preliminary results will be presented and some intriguing questions to current theories are also raised.

Outline
1. Introduction 2. Model and data analysis 3. Discussion

1. Introduction
Cosmology: the search for two numbers:
• The Hubble constant H0 --- describing how fast the universe is expanding
• The deceleration parameter q0 --- measuring the fate and age of the universe
€
H(t) =˙ a (t)a(t)
,
€
q(t) = −˙ ̇ a (t) /a(t)
H 2 = −(1+˙ H
H 2 ) =12
(1+ 3w)
a(t) = the cosmic scale factor
w=p/ρ is the equation of state of the universe
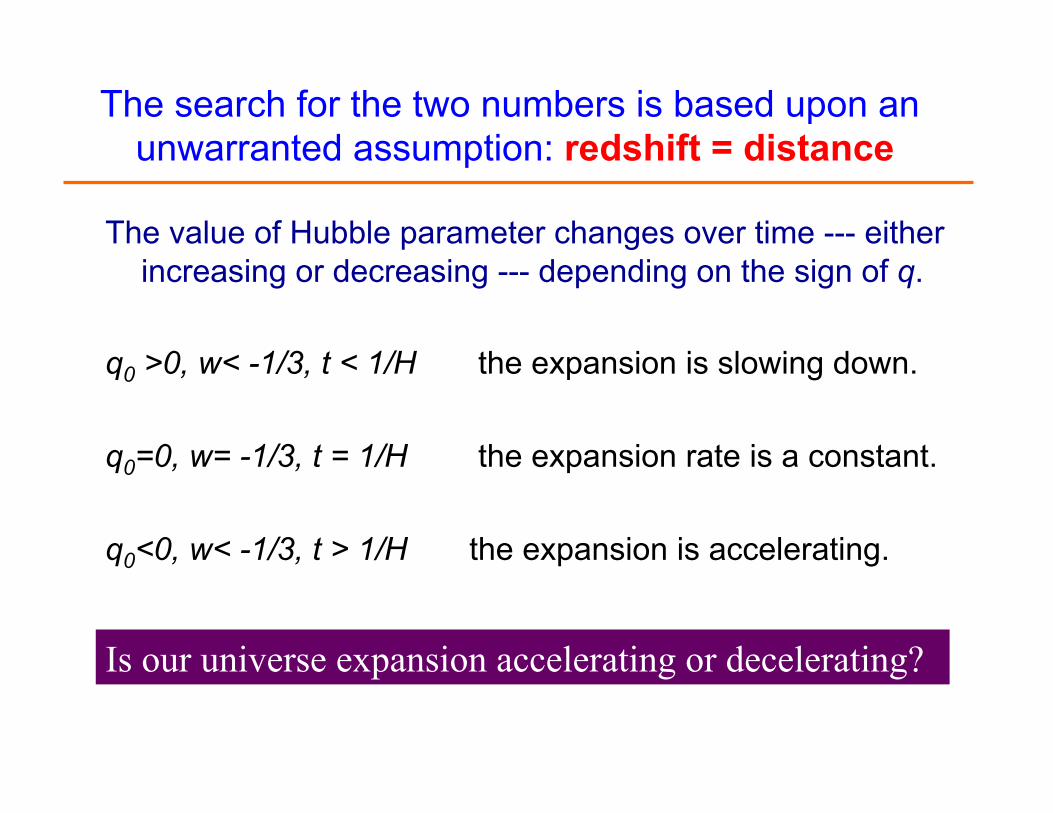
The search for the two numbers is based upon an unwarranted assumption: redshift = distance
The value of Hubble parameter changes over time --- either increasing or decreasing --- depending on the sign of q.
q0 >0, w< -1/3, t < 1/H the expansion is slowing down.
q0=0, w= -1/3, t = 1/H the expansion rate is a constant.
q0<0, w< -1/3, t > 1/H the expansion is accelerating.
Is our universe expansion accelerating or decelerating?
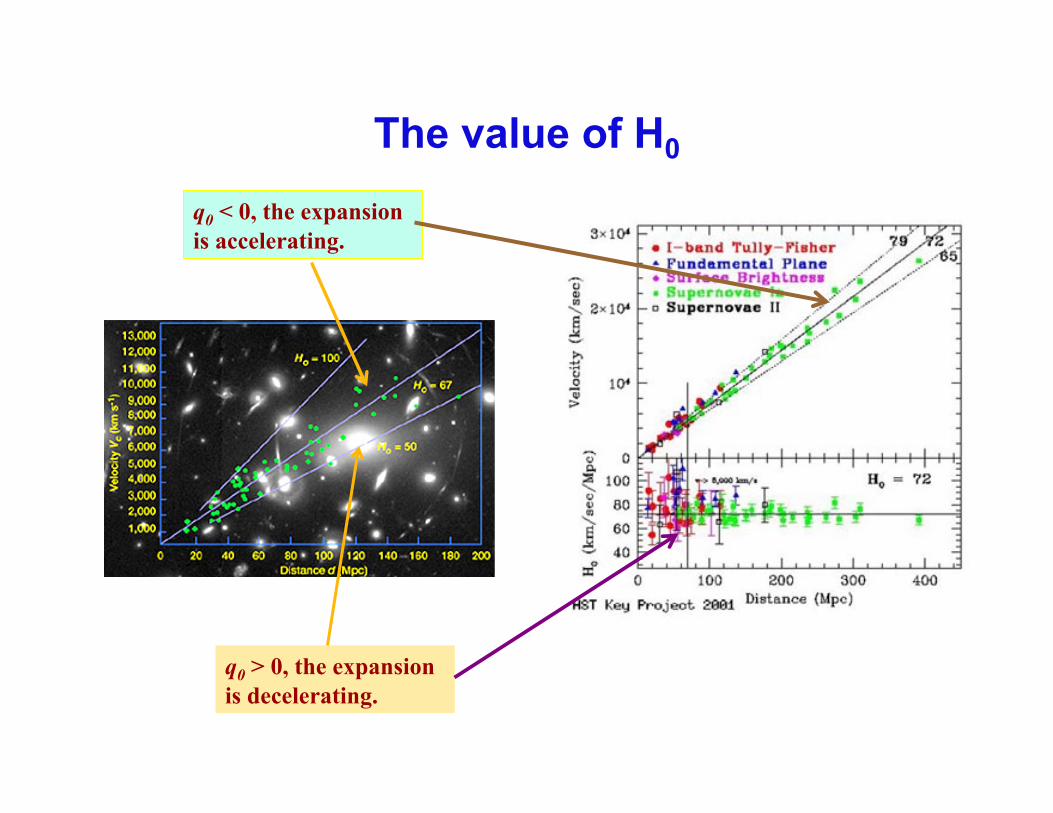
The value of H0
q0 < 0, the expansion is accelerating.
q0 > 0, the expansion is decelerating.

The history of H0 value since 1996
€
˙ H > 0⇒ q0 < 0
H0=72
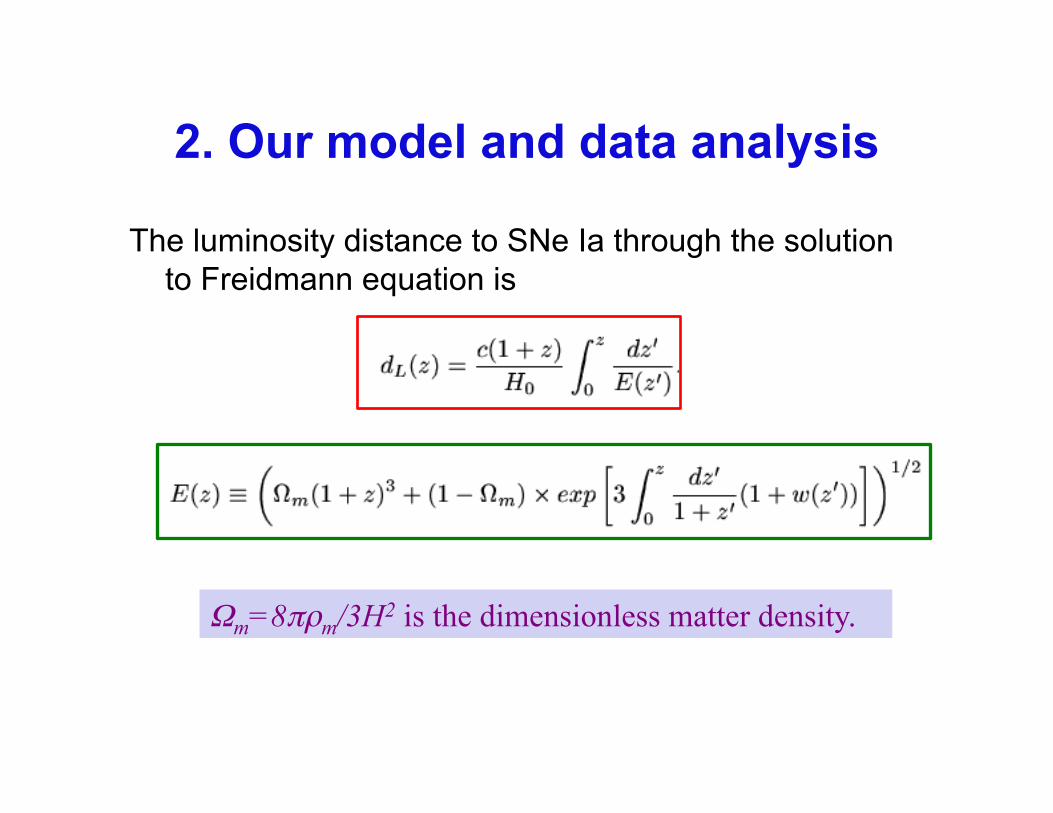
2. Our model and data analysis
The luminosity distance to SNe Ia through the solution to Freidmann equation is
Ωm=8πρm/3H2 is the dimensionless matter density.

Taylor expanding the equation of state around the current epoch
The scale factor a(t) with Taylor expansion around t0
Thus, the distance
is the jerk parameter
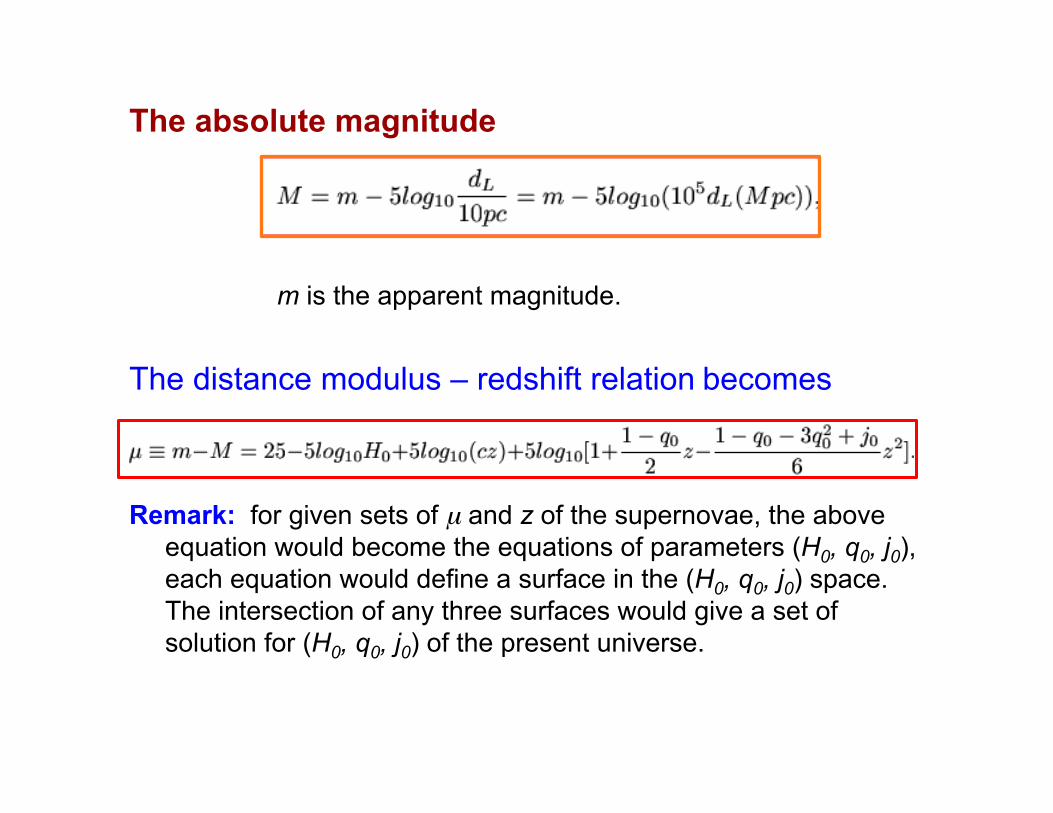
The absolute magnitude
m is the apparent magnitude.
The distance modulus – redshift relation becomes
Remark: for given sets of µ and z of the supernovae, the above equation would become the equations of parameters (H0, q0, j0), each equation would define a surface in the (H0, q0, j0) space. The intersection of any three surfaces would give a set of solution for (H0, q0, j0) of the present universe.
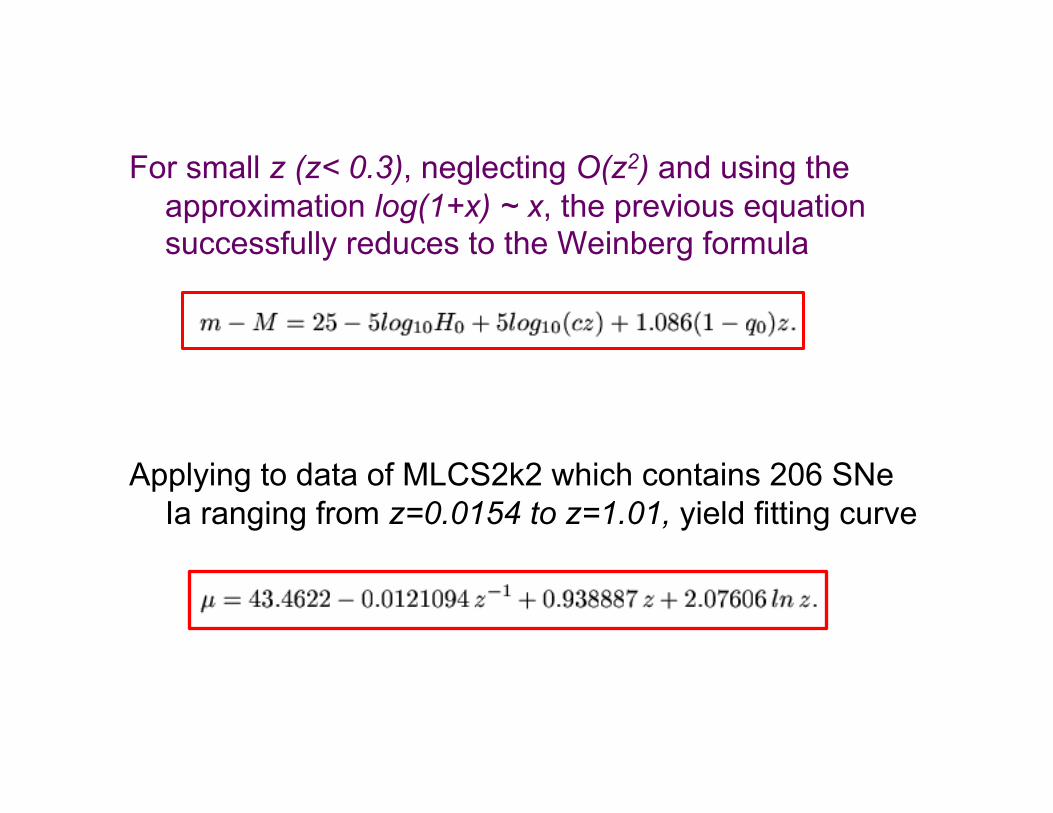
For small z (z< 0.3), neglecting O(z2) and using the approximation log(1+x) ~ x, the previous equation successfully reduces to the Weinberg formula
Applying to data of MLCS2k2 which contains 206 SNe Ia ranging from z=0.0154 to z=1.01, yield fitting curve

µ-z plot of data MLCS2k2 (206 SNe Ia ) and fitting curve µ=43.4622-0.0121094z-1+0.938887z+2.07606lnz

Preliminary results The solutions (H0, q0, j0) calculated from the fitting function
of data MLCS2k2
Average values:

Similarly, applying to the SALT data, the fitting curve is
The average values from this fitting are
Then the average result from two fittings is
Data MLCS2k2 indicates H0< 60 km/sec/Mpc, q0>0

3. Discussion A. H0, q0
This analysis on data MLCS2k2 gives H0< 60, q0>0, which is inconsistent with the current quoted values
H0~ 72, q0< 0 Is the expansion at present time accelerating or decelerating?
B. w? Substituting q0 ~ 0.32 into w gives
w ~ - 0.12 Implication: there is only 12% dark energy in present universe –
inconsistent with current ΛCDM model (w < - 0.7). What makes the rest in a nearly flat universe (w = -1)?
What and where are wrong here?

Recent data and future plan
ACT data and models, Conley et al, APJS 192, 10, 1088/0067-0049, 2011
Sherwin et al, PRL 107, 8 July, 2011
W=-0.91+0.16-0.20
To Include more data: SDSS, SNLS, SiFTO, SALT2,…in our analysis
Thank YOU!