Embed Size (px)
Citation preview

p. 140 - 159
Vol. I No. 2 - August 2020
E-ISSN: 2722-0842 | P-ISSN: 2721-8309
Available online at
http://journal.pusbindiklatren.bappenas.go.id/
ARTICLE INFO
Received: June 10, 2020 Received in revised form: July 13, 2020
Accepted: July 15, 2020
doi: 10.46456/jisdep.v1i2.59 © 2020 The Author
JISDeP - The Journal of Indonesia
Sustainable Development Planning Published by Centre for Planners’ Development, Education, and Training (Pusbindiklatren), Ministry of National Development Planning/ National Development Planning Agency (Bappenas), Republic of Indonesia
Address: Jalan Proklamasi 70,
Central Jakarta, Indonesia 10320 Phone: +62 21 31928280/3192828 Fax: +62 21 31928281 E-mail: [email protected]
Supported by Indonesian Development Planners Association (PPPI)
140
Determining Leading Economic Sectors, by Large Distribution or
Extreme Growth? (The Case of Tulungagung Regency, Province of East
Java)
Alfian Rosiadi
Regional Development Planning Agency of Tulungagung Regency, Tulungagung, Indonesia [email protected]
Abstract
The leading economic sectors of Tulungagung Regency are determined by their contributions to the GRDP. The sectors are expected to boost economic growth. However, in the last 12 years, economic growth in Tulungagung Regency still has been slower than the entire Province of East Java. The aim of this study is to determine alternative leading economic sectors not only by contributions. Analyses of SLQ and DLQ, average contributions, growth rate, shift-share, and net shift were performed to observe the contributions, competitiveness, and progressive growth of economic sectors. Based on the assessment by criteria scoring, the economic sectors were ranked to determine the leading ones. The assessment showed that Education Services ranked first, followed by Information and Communication. Meanwhile, the traditional leading economic sectors of Processing Industry, Large and Retail Trade & Car and Motorcycle Repair, and Agriculture, Forestry, and Fishery only ranked fourth, sixth, and ninth respectively.
Keywords: economic sector, LQ analysis, regional economies, shift-share, Tulungagung
Research Paper

JISDeP – The Journal of Indonesia Sustainable Development Planning (p. 140 - 159) Vol. I No. 2 - August 2020
Rosiadi 141
1. Introduction
Economic development is one of the development goals of a nation. Economic development is not only for improving welfare, but is also believed to be able to reduce inequality and disparity at both the regional and national levels. After World War II, when many new nations became independent and attempted to catch up in economic development, many heated discussions about economic development occurred among developed countries. A classical question that appeared then was how a nation with abundant resources can instead have a lower economic growth than nations with poor resources, which was often the case (Ackah et al., 2019; Attah, 2015; Gylfason, 2001; Obeng-Odoom, 2013; Sachs & Warner, 1999).
Many indicators were utilized to measure success in economic development, including economic
growth, income per capita, poverty rate, and others (Chisadza & Bittencourt, 2019). To establish a set of targets that can be applied universally and measured to balance the three dimensions of sustainable development – which are the environment, society, and economy – in 2012, all 195 member states of the United Nations committed to create a unified framework of 17 sustainable development goals (SDGs) and their 169 targets, after a significant theme in the 2005 review of the MDGs (Anasi et al., 2018; Imaz & Sheinbaum, 2017; Raub & Martin-Rios, 2019), with regional planning considered as media that can communicate regional development goals to external and internal stakeholders (Chimhowu et al., 2019).
Regional planning has traditionally been associated with guidance of spatial development and
reduction of socioeconomic disparities (Galland, 2012). In recent times, decentralization, which is called “regional autonomy” in Indonesia, has given authority and freedom to regional governments for developing their regions. In Indonesia, the national development planning system is divided into three layers of planning: national planning, provincial planning, and regency/city planning. The transformation of regional planning has demanded local governments worldwide to possess more commitment to bring innovative and integrated policies together with collaborative approaches on regional planning to achieve development goals (Castán Broto, 2017; Frantzeskaki et al., 2014; Hölscher et al., 2019; Huang-Lachmann & Lovett, 2016). Consequently, development actors are not only national authorities, but also regional and local governments, local communities, businesses, and research institutes or universities (Anasi et al., 2018; Burch et al., 2016; Frantzeskaki et al., 2014; Galland, 2012; Hölscher et al., 2019). Yet, decentralization policies that are not properly addressed can bring about greater regional disparity and inequality. The uneven distribution of resources creates regional disparity in the rate of economic growth among regions. Inequality of resources reflected on economic activities concentration which occurred in certain regions only (Devkota & Upadhyay, 2016). Thus, economic growth and reduction of inequality was established as the eighth and tenth SDG goals respectively (United Nations, 2015).
Tulungagung Regency has had a unique phenomenon of economic growth. From 2008-2019, the
economic growth of Tulungagung Regency, indicated by the Gross Domestic Regional Product (GRDP) value, was greater than the average Gross Domestic Product (GDP) growth of Indonesia, but was less than the GRDP growth of the Province of East Java. In other words, it was less than the average economic growth of other regencies or cities. Furthermore, the economic growth was less than the 7% target of SDGs (Bappenas, 2018). This phenomenon showed that something was wrong with the economic development in Tulungagung Regency, which lagged behind other regencies or cities in the Province of East Java.
The plan and strategy for economic development is focused on the development of leading economic
sectors. This condition is based on the argument that improvement and growth of leading economic sectors affect economic growth (D. Achmad & Hamzani, 2015). The economic sectors that are established as leading economic sectors for Tulungagung Regency are Agriculture, Forestry, and Fishery; Processing Industry; and Large and Retail Trade & Car and Motorcycle Repair. These sectors were determined as leading economic sectors based on their contributions to the GDRP (-, 2019).
Indeed, the contributions of economic sectors that were determined as leading economic sectors for
Tulungagung Regency are very dominant. In 2008, the contributions of the three leading economic sectors made up 63.55% of the GRDP total value. This tended to be stable from 2008-2019 at a value of greater

JISDeP – The Journal of Indonesia Sustainable Development Planning (p. 140 - 159) Vol. I No. 2 - August 2020
142 Rosiadi
than 60%, although there has been a change in that the contributions of Processing Industry since 2017 and Large and Retail Trade & Car and Motorcycle Repair since 2018 have surpassed that of Agriculture, Forestry, and Fishery. This dominance is also supported by land use in Tulungagung Regency (Figure 1). The sector of Agriculture, Forestry and Fishery dominates land use by 74.88% (-, 2012).
Problems then arose from 2008-2019; the growth of the sector of Agriculture, Forestry, and Fishery
as one of the leading economic sectors became depressed six times in 2010, 2013, 2014, 2016, 2017, and 2018. In 2018, this sector even became depressed to a negative growth rate of -0.63%. After dominating the GRDP distribution from 2008 to 2016, the Agriculture, Forestry, and Fishery sector began to lag behind the two other leading economic sectors. Although the Large and Retail Trade & Car and Motorcycle Repair sector could maintain its position as one of the top three for the GRDP, the sector also became depressed after its growth rate of 8.46% in 2011 fell to only 5.80% in 2019, although not as bad as the Agriculture, Forestry, and Fishing sector. The other leading economic sector of Processing Industry was still stable with an average growth of 6.11% from 2008-2019.
Meanwhile, the growth rates of non-leading economic sectors are of interest. The average growth
rates of economic sectors for the GRDP from 2008-2019 showed that the top five sectors with the highest average growth rates were Information and Communication (9.99%); Accommodations & Food and Drink Services (8.36%); Health Services and Social Activities (8.34%); Financial and Insurance Services (7.83%); and Education Services (7.48%). The leading economic sectors with the highest average growth rates were Large and Retail Trade & Car and Motorcycle Repair (6.34%), which only ranked ninth, and Processing Industry (5.90%), which ranked tenth. Incredibly, the Agriculture, Forestry, and Fishing sector was the slowest sector of the 17 sectors for the GRDP with an average growth rate of 2.55%.
Figure 1. Land Use Map of Tulungagung Regency (Source: RTRW Tulungagung, 2012-2032)
Further questions about the roles of leading economic sectors to economic growth can be asked. From
2008-2019, when Agriculture, Forestry, and Fishery became depressed six times, the overall economic growth of Tulungagung Regency increased four times, and in 2015, when Agriculture, Forestry, and Fishery increased, economic growth became depressed. The same conditions also occurred for the sectors of Processing Industry and Large and Retail Trade & Car and Motorcycle Repair. This condition leads to questions about the roles and contributions of leading economic sectors in boosting the economic growth of Tulungagung Regency, in that the leading economic sectors still could not support economic growth.

JISDeP – The Journal of Indonesia Sustainable Development Planning (p. 140 - 159) Vol. I No. 2 - August 2020
Rosiadi 143
Therefore, is it true that leading economic sectors boost economic growth? Does structural transformation have more impact on economic growth? On the other hand, is the real problem the incorrect decision to determine leading economic sectors by just their contributions?
Nevertheless, it is too early to conclude that economic transformation had happened and the leading
economic sectors had changed. Yet, leading economic sectors have to be evaluated, because superior sectors often have slow growth even though they dominate the economic activities of people. Meanwhile, sectors with higher growth still contribute less to the GRDP. Therefore, there is the opinion that leading economic sectors must be selected from those that are strongly competitive. Regional competitiveness is one of the measuring instruments of sustainable development. Regional competitiveness also has a positive relationship to the welfare of people (Khusaini, 2015).
Researchers and scholars have presented many theories on economic development, especially on
developing economic sectors. However, on a practical level, a certain problem in economic development strategies is determining the leading economic sector by only one perspective, their contributions to the GRDP. This occurred not only for Tulungagung Regency, but also for many other regions. Whereas, determining the leading economic sector requires in-depth review and analysis, and this decision particularly requires sufficient and consistent information observed over the long term.
In Indonesia, there are many previous studies on determining the leading economic sectors. Yet many
weaknesses were apparent in these studies. First is the use of short time-series data (2-5 years), which allows bias to occur. Second, the research only focused on the competitive advantages of economic sectors to larger reference areas (province/national), with the assumption that greater competitiveness of regions means greater welfare of people (Khusaini, 2015), without consideration of sector dominance to economic activity or GRDP. Third and finally, to draw conclusions, most of the studies utilized quadrant models (Klassen typology, overlay analysis, and so on), which can make many economic sectors appear to be leading economic sectors. The result is that the leading economic sector, as the most superior one, was unclear. To solve this problem, some researchers created lists of criteria to determine the leading economic sector. One research conducted by Achmad (2018) utilized several criteria to measure and give scores to economic sectors in order to find out the leading economic sector (Z. Achmad, 2018).
From the background above, the aim of this study is to determine the leading economic sector based
on three criteria that focus on specific aspects. First is by the contribution to the GRDP, to show which economic sectors have dominant roles on economic activities of the people (Z. Achmad, 2018; Aryee, 2001); second is by competitive advantage to a larger reference area, to find which sectors improve regional economic competitiveness (Andhyka, 2019; Budd & Hirmis, 2004; Harmono & Nirwanto, 2016; Khusaini, 2015); and third is by the growth rate of the sectors, for their development in the future (Vadlamannati, 2008). This study was conducted for Tulungagung Regency because not many studies were found to have been conducted for this region and no studies have yet to utilize criteria scoring to draw conclusions, as well as to find out the economic sectors that have less growth and are less competitive. This study utilized time-series data of a period of 12 years, longer than most previous studies that only utilized time series data of periods of 2-5 years, and this becomes a novelty of this study.
2. Methodology
Many previous studies for determining leading economic sectors utilized location quotient (LQ) or shift-share (SS) analysis. However, many of them generally utilized short time-series data. LQ requires time-series data of longer periods to avoid bias. The advantage of using LQ analysis is the ability to detect the true superiority of economic sector contributions to the GRDP. Previous studies in economics have utilized LQ analysis, for example, on the trade sector (S. H. Chiang, 2009), industry concentration (Billings & Johnson, 2012), carbon emissions (Trappey et al., 2013), the marine sector (Morrissey, 2014), economic development (Alhowaish, 2015), toll road project development (Berawi et al., 2017), determining development strategies for water, energy, and food (Purwanto et al., 2018), and changing import commodity (Mo et al., 2020). Meanwhile, shift-share analysis is a well-known and often applied method to decompose growth rates into structural and competitive components (Khusaini, 2015). This method is utilized to observe economic structure and its shift through the growth of regional economic sectors in

JISDeP – The Journal of Indonesia Sustainable Development Planning (p. 140 - 159) Vol. I No. 2 - August 2020
144 Rosiadi
comparison to similar sectors on larger areas, for example province to national, regency or city to province, district to regency, or village to district. Overall, shift-share analysis is a good and simple method in providing information about regional or sectoral economic policy (S. hen Chiang, 2012; Dogru & Sirakaya-Turk, 2017; Márquez et al., 2009; Mo et al., 2020; Oyewole, 2016), although this analysis cannot sufficiently show detailed information, particularly on sector role and economic policy (Tervo & Okko, 1983). Some previous studies also utilized shift-share analysis to find out the relationship of structural transformation to economic growth (de Vries et al., 2012; Maroto-Sánchez & Cuadrado-Roura, 2009; Maudos et al., 2008).
For the conceptual framework of this study, determining the leading economic sector was carried out
with three criteria and the usage of several methods. First, the sector would have a significant distribution to the GRDP total value, indicating that the sector dominates the economic activities of people. Second, the sector would have a better growth ratio as well as a larger area for the GRDP and therefore a positive value of net shift. Third, the sector would have a competitive advantage to a similar sector in the reference area, here the Province of East Java. This indicates that the sector has competitiveness for the regional economy (Figure 2). This is necessary to prevent economic development from being stuck in a traditional paradigm, and this is directed to further development in the future. For determining the leading economic sector in line with this concept, assessment by scoring was conducted for each economic sector, a modification from the study performed by Achmad (2018).
Figure 2. Method to Determine Leading Economic Sectors
Details of the criteria scoring to determine the leading sectors are shown in Table 1 below.
Table 1: Criteria Scoring of Economic Sectors
Criteria Score 5 4 3 2 1
Contribution Ranks 1-3 Ranks 4-7 Ranks 8-11 Ranks 12-14 Ranks 15-17 SLQ Analysis Ranks 1-3 Ranks 4-7 Ranks 8-11 Ranks 12-14 Ranks 15-17
Average Growth
Ranks 1-3 Ranks 4-7 Ranks 8-11 Ranks 12-14 Ranks 15-17
DLQ Analysis Ranks 1-3 Ranks 4-7 Ranks 8-11 Ranks 12-14 Ranks 15-17 Local Share
Growth Ranks 1-3 Ranks 4-7 Ranks 8-11 Ranks 12-14 Ranks 15-17
Net Shift Ranks 1-3 Ranks 4-7 Ranks 8-11 Ranks 12-14 Ranks 15-17
Source: Author
Leading Economic
Sectors
Contribution to GRDP
Average Contribution
Growth
Average Growth
Net Shift
DLQ Analysis
Competiveness
SLQ Analysis
Local Share Growth
JISDeP – The Journal of Indonesia Sustainable Development Planning (p. 140 - 159) Vol. I No. 2 - August 2020
Rosiadi 145
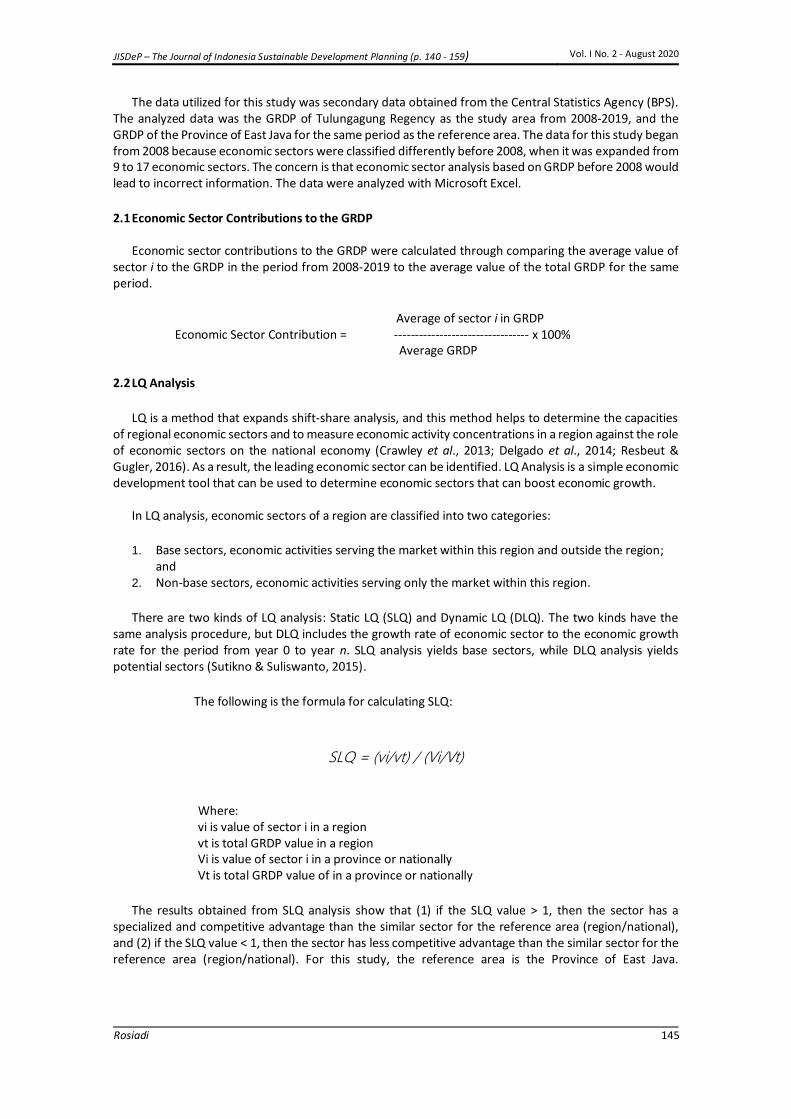
The data utilized for this study was secondary data obtained from the Central Statistics Agency (BPS). The analyzed data was the GRDP of Tulungagung Regency as the study area from 2008-2019, and the GRDP of the Province of East Java for the same period as the reference area. The data for this study began from 2008 because economic sectors were classified differently before 2008, when it was expanded from 9 to 17 economic sectors. The concern is that economic sector analysis based on GRDP before 2008 would lead to incorrect information. The data were analyzed with Microsoft Excel.
2.1 Economic Sector Contributions to the GRDP
Economic sector contributions to the GRDP were calculated through comparing the average value of sector i to the GRDP in the period from 2008-2019 to the average value of the total GRDP for the same period.
Average of sector i in GRDP Economic Sector Contribution = --------------------------------- x 100%
Average GRDP
2.2 LQ Analysis
LQ is a method that expands shift-share analysis, and this method helps to determine the capacities of regional economic sectors and to measure economic activity concentrations in a region against the role of economic sectors on the national economy (Crawley et al., 2013; Delgado et al., 2014; Resbeut & Gugler, 2016). As a result, the leading economic sector can be identified. LQ Analysis is a simple economic development tool that can be used to determine economic sectors that can boost economic growth.
In LQ analysis, economic sectors of a region are classified into two categories:
1. Base sectors, economic activities serving the market within this region and outside the region; and
2. Non-base sectors, economic activities serving only the market within this region.
There are two kinds of LQ analysis: Static LQ (SLQ) and Dynamic LQ (DLQ). The two kinds have the same analysis procedure, but DLQ includes the growth rate of economic sector to the economic growth rate for the period from year 0 to year n. SLQ analysis yields base sectors, while DLQ analysis yields potential sectors (Sutikno & Suliswanto, 2015).
The following is the formula for calculating SLQ:
SLQ = (vi/vt) / (Vi/Vt)
Where: vi is value of sector i in a region vt is total GRDP value in a region Vi is value of sector i in a province or nationally Vt is total GRDP value of in a province or nationally
The results obtained from SLQ analysis show that (1) if the SLQ value > 1, then the sector has a specialized and competitive advantage than the similar sector for the reference area (region/national), and (2) if the SLQ value < 1, then the sector has less competitive advantage than the similar sector for the reference area (region/national). For this study, the reference area is the Province of East Java.
JISDeP – The Journal of Indonesia Sustainable Development Planning (p. 140 - 159) Vol. I No. 2 - August 2020
146 Rosiadi
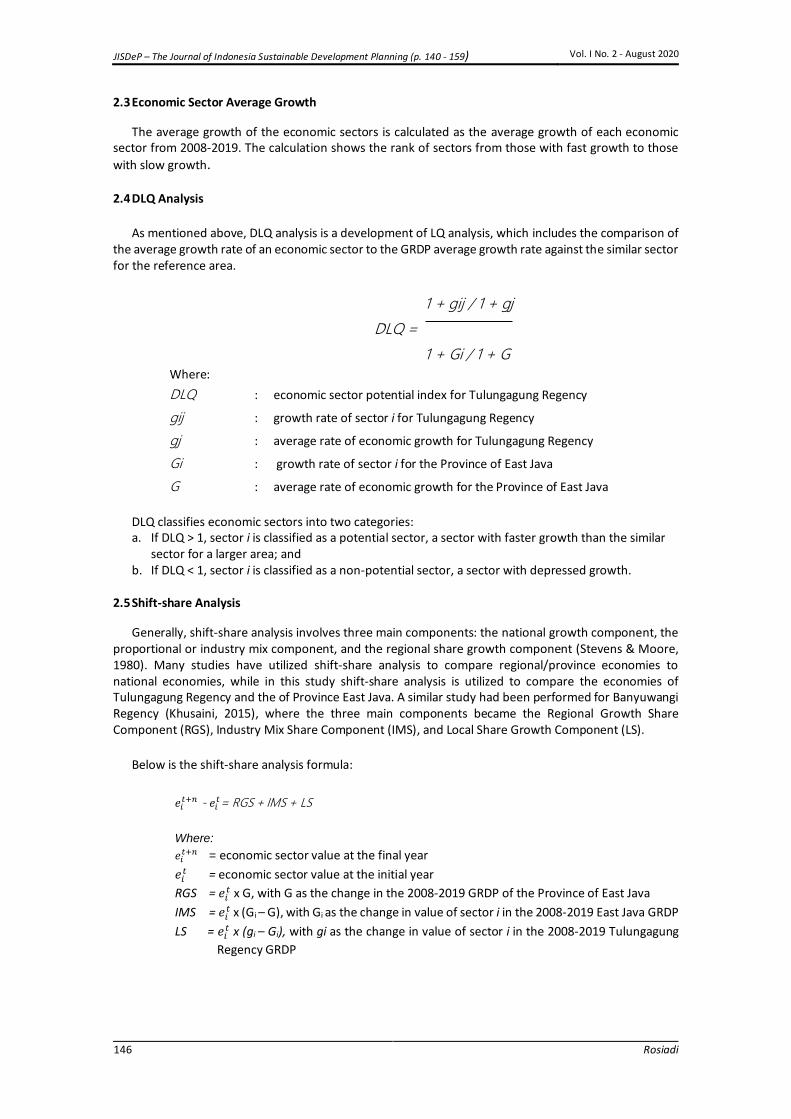
2.3 Economic Sector Average Growth
The average growth of the economic sectors is calculated as the average growth of each economic sector from 2008-2019. The calculation shows the rank of sectors from those with fast growth to those
with slow growth.
2.4 DLQ Analysis
As mentioned above, DLQ analysis is a development of LQ analysis, which includes the comparison of the average growth rate of an economic sector to the GRDP average growth rate against the similar sector for the reference area.
1 + gij / 1 + gj
DLQ =
1 + Gi / 1 + G Where:
DLQ : economic sector potential index for Tulungagung Regency
gij : growth rate of sector i for Tulungagung Regency
gj : average rate of economic growth for Tulungagung Regency
Gi : growth rate of sector i for the Province of East Java
G : average rate of economic growth for the Province of East Java
DLQ classifies economic sectors into two categories: a. If DLQ > 1, sector i is classified as a potential sector, a sector with faster growth than the similar
sector for a larger area; and b. If DLQ < 1, sector i is classified as a non-potential sector, a sector with depressed growth.
2.5 Shift-share Analysis
Generally, shift-share analysis involves three main components: the national growth component, the proportional or industry mix component, and the regional share growth component (Stevens & Moore, 1980). Many studies have utilized shift-share analysis to compare regional/province economies to national economies, while in this study shift-share analysis is utilized to compare the economies of Tulungagung Regency and the of Province East Java. A similar study had been performed for Banyuwangi Regency (Khusaini, 2015), where the three main components became the Regional Growth Share Component (RGS), Industry Mix Share Component (IMS), and Local Share Growth Component (LS).
Below is the shift-share analysis formula:
𝑒𝑖𝑡+𝑛 - 𝑒𝑖
𝑡= RGS + IMS + LS
Where:
𝑒𝑖𝑡+𝑛 = economic sector value at the final year
𝑒𝑖𝑡 = economic sector value at the initial year
RGS = 𝑒𝑖𝑡 x G, with G as the change in the 2008-2019 GRDP of the Province of East Java
IMS = 𝑒𝑖𝑡 x (Gi – G), with Gi as the change in value of sector i in the 2008-2019 East Java GRDP
LS = 𝑒𝑖𝑡 x (gi – Gi), with gi as the change in value of sector i in the 2008-2019 Tulungagung
Regency GRDP

JISDeP – The Journal of Indonesia Sustainable Development Planning (p. 140 - 159) Vol. I No. 2 - August 2020
Rosiadi 147
Shift-share analysis results in two pieces of information: first, the development of an economic sector in a region compared to a similar sector, and second, the development of a region compared to a larger area. Shift-share analysis can be reformulated into Net Shift (NS) as the sum of IMS and LS to identify regional growth or sectoral growth in a region (Khusaini, 2015). Shift-share analysis results are utilized in two assessment criteria: first, the LS value that indicates sector competitiveness, and second, the net shift that indicates the growth rate of the sector (progressive or depressed).
3. Results and Discussion
3.1 Economic Sector Contributions to the GRDP
The 2008-2019 average GRDP of Tulungagung Regency at constant price is 20,806.730 billion rupiahs (-, 2020a). The 2008-2019 GRDP of Tulungagung Regency was dominated by contributions of three sectors: Agriculture, Forestry, and Fishery; Processing Industry; and Large and Retail Trade & Car and Motorcycle Repair. Agriculture, Forestry, and Fishery had an average GRDP value of 4,138.867 billion rupiahs, while Processing Industry had a value of 4,361.310 billion rupiahs and Large and Retail Trade & Car and Motorcycle Repair had a value of 4,427.994 billion rupiahs (Table 2). The total contribution of the three sectors in 2008 was 63.55% and slowed down in 2019 to 61.96%, while the average contribution of the three sectors from 2008-2019 was 62.78% of the total value of the GRDP.
As such, within the period, the three sectors dominated economic sector contributions to the GRDP
of Tulungagung Regency, exceeding the sectors of Construction, Information and Communication, and Education Services. Agriculture, Forestry, and Fishery ranked first with an average contribution of 21.44%, Processing Industry ranked second with 21.03%, and Large and Retail Trade & Car and Motorcycle Repair ranked third with 20.31%. The top ten economic sectors with the highest average contributions to the 2008-2019 GRDP can be seen in Table 3.
Table 2: Average GRDP of Tulungagung Regency from 2008-2019 (in billions of rupiahs)
Code Sector Avg. GRDP
A Agriculture, Forestry, and Fishery 4,138.867
B Mining and Excavation 803.473
C Processing Industry 4,361.310
D Electricity and Gas Services 9.573
E Water Supply, Trash and Waste Management, and Recycling Services 19.110
F Construction 1,884.529
G Large and Retail Trade & Car and Motorcycle Repair 4,427.994
H Transportation and Warehousing 438.475
I Accommodations & Food and Drink Services 384.136
J Information and Communication 1,293.261 K Financial and Insurance Services 446.144
L Real Estate 440.273 M, N Company Services 75.498
O Government Administration, Defense, and Compulsory Social Security
707.489
P Education Services 869.807 Q Health Services and Social Activities 220.357
R, S, T, U Other Services 286.434 Gross Regional Domestic Product 20,806.730
Gross Regional Domestic Product without Oil and Gas 20,806.730
Source: BPS of Tulungagung (2020)

JISDeP – The Journal of Indonesia Sustainable Development Planning (p. 140 - 159) Vol. I No. 2 - August 2020
148 Rosiadi
Table 3: Top Ten Highest Contributing Sectors to the GDRP
Rank Code Sector Avg. Contribution
1 A Agriculture, Forestry, and Fishery 21.44
2 C Processing Industry 21.03
3 G Large and Retail Trade & Car and Motorcycle Repair 20.31
4 F Construction 9.26
5 J Information and Communication 5.38
6 P Education Services 4.13 7 B Mining and Excavation 3.99
8 O Government Administration, Defense, and Compulsory Social Security
3.60
9 K Financial and Insurance Services 2.14 10 H Transportation and Warehousing 2.03
Source: BPS of Tulungagung, processed
Based on the table above, it can be seen that the dominance of the three leading economic sectors in contributing to the GRDP far exceeded the other economic sectors. Among the sectors of Agriculture, Forestry, and Fishery; Processing Industry; and Large and Retail Trade & Car and Motorcycle Repair, the differences are only 1.13%. Below the sector of Large and Retail Trade & Car and Motorcycle Repair, the contributions of economic sectors to the GRDP are only of percentages of single digits. This data showed that economic activities in Tulungagung Regency are dominated by these three sectors, and this is the basis of why these sectors became considered as leading economic sectors in Tulungagung Regency development plan documents.
3.2 Base and Non-Base Sectors
The average value of the GRDP of the Province of East Java at constant prices from 2008-2019 was 1,239,729.95 billion rupiahs (-, 2020b), while the GRDP without oil and gas from 2008-2019 was 1,194,421.42 billion rupiahs. Similar to Tulungagung Regency, the sectors that dominated the GRDP of the Province of East Java from 2008-2019 are Agriculture, Forestry, and Fishery; Processing Industry; and Large and Retail Trade & Car and Motorcycle Repair. In contrast to Tulungagung, Processing Industry more dominated the Province of East Java GRDP with an average contribution of 29.50%, followed by Large and Retail Trade & Car and Motorcycle Repair with 17.76% and Agriculture, Forestry, and Fishery sector with 13.14% (Table 4).
Table 4: Average GRDP of the Province of East Java from 2008-2019 at Constant Price (in billions of rupiahs)
Code Sector Avg. GRDP Avg.
Contribution
A Agriculture, Forestry, and Fishery 150,451.02 13.14
B Mining and Excavation 63,545.16 4.70 C Processing Industry 367,350.56 29.50
D Electricity and Gas Services 4,376.27 0.39 E Water Supply, Trash and Waste Management, and
Recycling Services 1,258.24 0.10
F Construction 113,693.43 9.29 G Large and Retail Trade & Car and Motorcycle Repair 225,733.81 17.76 H Transportation and Warehousing 35,628.64 3.12
I Accommodations & Food and Drink Services 62,922.28 5.21
J Information and Communication 65,939.36 4.62 K Financial and Insurance Services 30,572.22 2.54
L Real Estate 21,115.06 1.64
M, N Company Services 9,626.67 0.80

JISDeP – The Journal of Indonesia Sustainable Development Planning (p. 140 - 159) Vol. I No. 2 - August 2020
Rosiadi 149
O Government Administration, Defense, and Compulsory Social Security
29,150.00 2.51
P Education Services 32,154.23 2.61
Q Health Services and Social Activities 7,803.42 0.60 R, S, T, U Other Services 18,409.58 1.47
Gross Regional Domestic Product 1,239,729.95 Gross Regional Domestic Product without Oil and Gas 1,194,421.42
Source: BPS of East Java (2020), processed SLQ analysis results showed that of the 17 economic sectors in Tulungagung Regency, seven sectors
could be identified as base sectors (SLQ > 1). The seven sectors are Health Services and Social Activities (1.65); Agriculture, Forestry, and Fishery (1.63); Education Services (1.58); Government Administration, Defense, and Compulsory Social Security (1.44); Real Estate (1.23); Information and Communication (1.16); and Large and Retail Trade & Car and Motorcycle Repair (1.14%). Surprisingly, the sector of Processing Industry, which is often considered as a leading economic sector, was evidently identified as a non-base sector (0.71). This is because the Processing Industry sector for the GRDP of the Province of East Java had an average contribution of 29.50% (-, 2020a), greater than the average contribution by the sector for Tulungagung (21.03%).
The seven base sectors by their SLQ values for Tulungagung Regency can be seen in Table 5.
Table 5: Base Sectors by SLQ Values for Tulungagung, 2008-2019
Code Sector Avg. Distribution of GDRP
SLQ Criteria Tulungagung East Java
Q Health Services and Social Activities
0.99 0.60 1.65 Base Sector
A Agriculture, Forestry, and Fishery
21.44 13.14 1.63 Base Sector
P Education Services 4.13 2.61 1.58 Base Sector
O Government Administration, Defense, and Compulsory Social Security
3.60 2.51 1.44 Base Sector
L Real Estate 2.02 1.64 1.23 Base Sector J Information and
Communication 5.38 4.62 1.16 Base Sector
G Large and Retail Trade & Car and Motorcycle Repair
20.31 17.76 1.14 Base Sector
Source: BPS of Tulungagung, processed
3.3 Average Growth of Economic Sectors
The GRDP of Tulungagung Regency has had continuous growth since 2008 with a value of 15,145.943 billion rupiahs to 27,299.802 billion rupiahs in 2019. The growth rate of the Tulungagung Regency GRDP at that period fluctuated with an average growth of 5.50%. There were 11 economic sectors that grew more rapidly than the average growth of the Tulungagung Regency GRDP. Uniquely, the leading economic sectors had average growths that were not promising. Large and Retail Trade & Car and Motorcycle Repair ranked ninth with an average growth of 6.34%, while Processing Industry ranked tenth with an average growth of 5.90%. Ironically, the sector of Agriculture, Forestry, and Fishery had the lowest average growth among the 17 sectors, with an average growth of 2.47%. Indeed, this sector recorded negative growth in 2018 with a value of -0.63%.
The top ten economic sectors with the highest average growth for 2008-2019 were Information and Communication (9.99%); Accommodations & Food and Drink Services (8.36%); Health Services and Social

JISDeP – The Journal of Indonesia Sustainable Development Planning (p. 140 - 159) Vol. I No. 2 - August 2020
150 Rosiadi
Activities (8.34%); Financial and Insurance Services (7.83%); Education Services (7.48%); Transportation and Warehousing (7.41%); Real Estate (6.45%); Company Services (6.43%); Large and Retail Trade & Car and Motorcycle Repair (6.34%); and Processing Industry (5.90%).
Table 6: Top Ten Economic Sectors with the Highest Average Growth from 2008-2019
Rank Code Sector Avg. Growth
1 J Information and Communication 9.99
2 I Accommodations & Food and Drink Services 8.36
3 Q Health Services and Social Activities 8.34
4 K Financial and Insurance Services 7.83
5 P Education Services 7.48 6 H Transportation and Warehousing 7.41
7 L Real Estate 6.45 8 M, N Company Services 6.43
9 G Large and Retail Trade & Car and Motorcycle Repair 6.34
10 C Processing Industry 5.90 Source: BPS of Tulungagung, processed
3.4 Potential Sectors by DLQ Analysis
The 2008-2019 GRDP of the Province of East Java had an average growth of 5.81%, higher than the average growth for the GRDP of Tulungagung Regency (5.50%). For the Province of East Java, the sectors that had the highest average growths were Information and Communication (9.81%), Health Services and Social Activities (8.35%), and Accommodations & Food and Drink Services (7.69%).
DLQ analysis for Tulungagung Regency economic sectors was similar to the Province of East Java
economic sectors for 2008-2019, resulting in some potential economic sectors. There were 14 economic sectors with DLQ > 1, which showed that Tulungagung Regency economic sectors have great potential to grow and be competitive, compared to similar economic sectors for the Province of East Java. All leading economic sectors had DLQ > 1. Nevertheless, one leading economic sector did not make the top ten of DLQ values, which was Large and Retail Trade & Car and Motorcycle Repair. The top ten DLQ values can be seen in Table 7.
Table 7: Top Ten DLQ Values of Tulungagung Regency Economic Sectors, 2008-2019
Rank Code Sector DLQ Value
1 D Electricity and Gas Services 1.38326475 2 H Transportation and Warehousing 1.17778974
3 K Financial and Insurance Services 1.140130781
4 I Accommodations & Food and Drink Services 1.127715828
5 P Education Services 1.113119492 6 C Processing Industry 1.094542238
7 M, N Company Services 1.093992131
8 L Real Estate 1.080914999 9 J Information and Communication 1.064479752
10 A Agriculture, Forestry, and Fishery 1.060076537 Source: BPS of Tulungagung, processed
3.5 Shift-Share Analysis
Shift-share analysis for the economy of Tulungagung Regency was performed with the economic sector variables of the 2008-2019 GRDP of both Tulungagung Regency and the Province of East Java. The GRDP values of these two areas can be seen in Tables 8 and 9.

JISDeP – The Journal of Indonesia Sustainable Development Planning (p. 140 - 159) Vol. I No. 2 - August 2020
Rosiadi 151
Table 8: Tulungagung Regency GRDP at Constant Price, 2008-2019 (in billions of rupiahs)
Code Sector 2008 2019 Change
Value %
A Agriculture, Forestry, and Fishery 3,511.56 4,588.75 1,077.19 30.68
B Mining and Excavation 641.74 917.31 275.56 42.94
C Processing Industry 3,182.75 5,974.29 2,791.55 87.71
D Electricity and Gas Services 7.66 11.65 3.99 52.14 E Water Supply, Trash and Waste
Management, and Recycling Services 15.09 24.38 9.29 61.59
F Construction 1,396.65 2,535.62 1,138.97 81.55 G Large and Retail Trade & Car and
Motorcycle Repair 3,083.59 6,049.07 2,965.48 96.17
H Transportation and Warehousing 294.84 645.90 351.06 119.07
I Accommodations & Food and Drink Services
233.68 565.15 331.47 141.85
J Information and Communication 678.62 1,916.39 1,237.77 182.40 K Financial and Insurance Services 265.91 605.92 340.01 127.87
L Real Estate 304.69 605.34 300.65 98.67
M, N Company Services 51.46 101.93 50.47 98.08
O Government Administration, Defense, and Compulsory Social Security
556.31 844.50 288.18 51.80
P Education Services 556.99 1,230.00 673.01 120.83
Q Health Services and Social Activities 132.57 316.95 184.37 139.07
R, S, T, U Other Services 231.83 366.65 134.81 58.15
Gross Regional Domestic Product 15,145.94 27,299.80 12,153.86 80.25
Gross Regional Domestic Product without Oil and Gas
15,145.94 27,299.80 12,153.86 80.25
Source: BPS of Tulungagung, processed
Table 9: Province of East Java GRDP at Constant Price, 2008-2019 (in billions of rupiahs)
Code Sector 2008 2019 Change
Value % A Agriculture, Forestry, and Fishery 127,404.03 165,665.39 38,261.36 30.03
B Mining and Excavation 38,971.01 83,770.52 44,799.51 114.96 C Processing Industry 274,406.12 498,875.23 224,469.11 81.80
D Electricity and Gas Services 3,474.73 4,561.03 1,086.30 31.26
E Water Supply, Trash and Waste Management, and Recycling Services
986.67 1,588.35 601.68 60.98
F Construction 81,246.74 153,689.59 72,442.85 89.16 G Large and Retail Trade & Car and
Motorcycle Repair 156,581.88 307,838.27 151,256.39 96.60
H Transportation and Warehousing 24,338.33 48,471.40 24,133.07 99.16
I Accommodations & Food and Drink Services
40,614.70 91,711.07 51,096.37 125.81
J Information and Communication 34,983.22 97,070.64 62,087.42 177.48
K Financial and Insurance Services 19,538.12 41,398.81 21,860.69 111.89
L Real Estate 14,674.77 28,441.50 13,766.73 93.81
M, N Company Services 6,845.25 13,128.02 6,282.77 91.78
JISDeP – The Journal of Indonesia Sustainable Development Planning (p. 140 - 159) Vol. I No. 2 - August 2020
152 Rosiadi
Code Sector 2008 2019 Change
Value %
O Government Administration, Defense, and Compulsory Social Security
22,430.26 34,984.34 12,554.08 55.97
P Education Services 20,999.26 44,018.96 23,019.70 109.62
Q Health Services and Social Activities
4,695.30 11,277.80 6,582.50 140.19
R, S, T, U Other Services 14,615.49 23,652.24 9,036.75 61.83
Gross Regional Domestic Product 1,650,143.15 763,337.27 86.08
Gross Regional Domestic Product without Oil and Gas
1,588,058.98 726,894.31 84.41
Source: BPS of East Java, processed
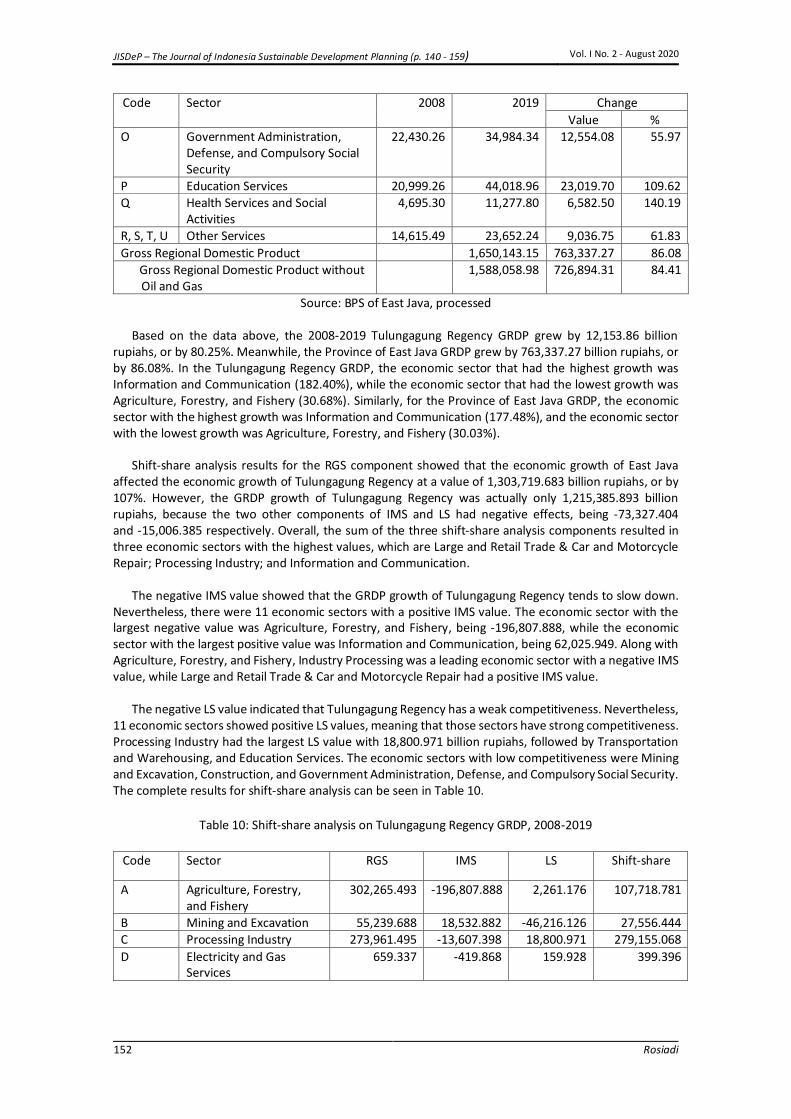
Based on the data above, the 2008-2019 Tulungagung Regency GRDP grew by 12,153.86 billion rupiahs, or by 80.25%. Meanwhile, the Province of East Java GRDP grew by 763,337.27 billion rupiahs, or by 86.08%. In the Tulungagung Regency GRDP, the economic sector that had the highest growth was Information and Communication (182.40%), while the economic sector that had the lowest growth was Agriculture, Forestry, and Fishery (30.68%). Similarly, for the Province of East Java GRDP, the economic sector with the highest growth was Information and Communication (177.48%), and the economic sector with the lowest growth was Agriculture, Forestry, and Fishery (30.03%).
Shift-share analysis results for the RGS component showed that the economic growth of East Java
affected the economic growth of Tulungagung Regency at a value of 1,303,719.683 billion rupiahs, or by 107%. However, the GRDP growth of Tulungagung Regency was actually only 1,215,385.893 billion rupiahs, because the two other components of IMS and LS had negative effects, being -73,327.404 and -15,006.385 respectively. Overall, the sum of the three shift-share analysis components resulted in three economic sectors with the highest values, which are Large and Retail Trade & Car and Motorcycle Repair; Processing Industry; and Information and Communication.
The negative IMS value showed that the GRDP growth of Tulungagung Regency tends to slow down.
Nevertheless, there were 11 economic sectors with a positive IMS value. The economic sector with the largest negative value was Agriculture, Forestry, and Fishery, being -196,807.888, while the economic sector with the largest positive value was Information and Communication, being 62,025.949. Along with Agriculture, Forestry, and Fishery, Industry Processing was a leading economic sector with a negative IMS value, while Large and Retail Trade & Car and Motorcycle Repair had a positive IMS value.
The negative LS value indicated that Tulungagung Regency has a weak competitiveness. Nevertheless,
11 economic sectors showed positive LS values, meaning that those sectors have strong competitiveness. Processing Industry had the largest LS value with 18,800.971 billion rupiahs, followed by Transportation and Warehousing, and Education Services. The economic sectors with low competitiveness were Mining and Excavation, Construction, and Government Administration, Defense, and Compulsory Social Security. The complete results for shift-share analysis can be seen in Table 10.
Table 10: Shift-share analysis on Tulungagung Regency GRDP, 2008-2019
Code Sector RGS IMS LS Shift-share
A Agriculture, Forestry, and Fishery
302,265.493 -196,807.888 2,261.176 107,718.781
B Mining and Excavation 55,239.688 18,532.882 -46,216.126 27,556.444
C Processing Industry 273,961.495 -13,607.398 18,800.971 279,155.068
D Electricity and Gas Services
659.337 -419.868 159.928 399.396

JISDeP – The Journal of Indonesia Sustainable Development Planning (p. 140 - 159) Vol. I No. 2 - August 2020
Rosiadi 153
Code Sector RGS IMS LS Shift-share
E Water Supply, Trash and Waste Management, and Recycling Services
1,298.812 -378.676 9.249 929.385
F Construction 120,219.675 4,311.255 -10,633.753 113,897.177
G Large and Retail Trade & Car and Motorcycle Repair
265,426.586 32,444.772 -1,323.569 296,547.789
H Transportation and Warehousing
25,378.796 3,856.326 5,870.902 35,106.023
I Accommodations & Food and Drink Services
20,114.096 9,284.014 3,749.257 33,147.368
J Information and Communication
58,413.396 62,025.949 3,337.485 123,776.830
K Financial and Insurance Services
22,889.032 6,863.273 4,249.125 34,001.430
L Real Estate 26,226.850 2,356.802 1,481.544 30,065.196 M, N Company Services 4,429.588 293.622 323.884 5,047.094
O Government Administration, Defense, and Compulsory Social Security
47,885.753 -16,749.310 -2,318.042 28,818.401
P Education Services 47,943.798 13,113.868 6,243.335 67,301.001
Q Health Services and Social Activities
11,411.502 7,174.348 -148.594 18,437.256
R, S, T, U Other Services 19,955.787 -5,621.376 -853.157 13,481.253 Gross Regional Domestic Product 1,303,719.683 -73,327.404 -15,006.385 1,215,385.893
Source: BPS of Tulungagung, processed
While LS showed the competitiveness of economic sectors or the GRDP, net shift (NS) showed the growth of economic sectors or an area. The NS value of Tulungagung Regency is -88,333.789, which indicates that Tulungagung Regency has a position of slow growth. However, there are 10 economic sectors with progressive growth. Those sectors are Information and Communication (65,363.434), Large and Retail Trade & Car and Motorcycle Repair (31,121.203), Education Services (19,357.203), Accommodations & Food and Drink Services (13,033.272), Financial and Insurance services (11,112.398), Transportation and Warehousing (9,727.228), Health Services and Social Activities (7,025.754), Processing Industry (5,193.573), Real Estate (3,838.347), and Company Services (617.506). The sector of Agriculture, Forestry, and Fishery is the only leading economic sector with a negative NS value as well as the slowest economic sector (-194,546.711).
Table 11: Tulungagung Regency Net Shift (Largest to smallest)
Code Sector IMS LS Net Shift
J Information and Communication 62,025.949 3,337.485 65,363.434
G Large and Retail Trade & Car and Motorcycle Repair
32,444.772 -1,323.569 31,121.203
P Education Services 13,113.868 6,243.335 19,357.203
I Accommodations & Food and Drink Services
9,284.014 3,749.257 13,033.272
K Financial and Insurance Services 6,863.273 4,249.125 11,112.398 H Transportation and Warehousing 3,856.326 5,870.902 9,727.228
Q Health Services and Social Activities
7,174.348 -148.594 7,025.754

JISDeP – The Journal of Indonesia Sustainable Development Planning (p. 140 - 159) Vol. I No. 2 - August 2020
154 Rosiadi
Code Sector IMS LS Net Shift
C Processing Industry -13,607.398 18,800.971 5,193.573
L Real Estate 2,356.802 1,481.544 3,838.347 M, N Company Services 293.622 323.884 617.506
D Electricity and Gas Services -419.868 159.928 -259.941
E Water Supply, Trash and Waste Management, and Recycling Services
-378.676 9.249 -369.427
F Construction 4,311.255 -10,633.753 -6,322.498
R, S, T, U Other Services -5,621.376 -853.157 -6,474.533 O Government Administration,
Defense, and Compulsory Social Security
-16,749.310 -2,318.042 -19,067.352
B Mining and Excavation 18,532.882 -46,216.126 -27,683.244
A Agriculture, Forestry, and Fishery -196,807.888 2,261.176 -194,546.711 Gross Regional Domestic Product -73,327.404 -15,006.385 -88,333.789
Source: BPS of Tulungagung, processed
3.6 Discussion
Studies on determining leading economic sectors have been performed by many researchers or scholars, including in Indonesia. LQ analysis and shift-share analysis become popular and well-known analysis methods for the studies. To draw conclusions, most researchers have utilized overlay quadrant or Klaasen typology to categorize economic sectors as superior leading, potential, or depressed sectors. As previously mentioned in the background, the concept for this study is different from most studies, and Achmad (2018) previously implemented it to determine economic sectors in East Kalimantan. In this study, the economic sectors are given scores for all criteria. The top ten economic sectors with the highest total scores and recommended to be leading economic sectors can be seen in Table 12.
Table 12: Top Ten Economic Sectors
Rank Code Sector Avg. Cont.
LQ Avg. Growth
DLQ LS Net Shift
Total
1 P Education Services 4 5 4 4 5 5 27
2 J Information and Communication
4 4 5 3 4 5 25
3 H Transportation and Warehousing
3 2 4 5 5 4 23
4 C Processing Industry 5 2 3 4 5 3 22
5 K Financial and Insurance Services
3 2 4 5 4 4 22
6 G Large and Retail Trade & Car and Motorcycle Repair
5 3 3 2 2 5 20
7 I Accommodations & Food and Drink Services
2 1 5 4 4 4 20
8 Q Health Services and Social Activities
2 5 5 2 2 3 19
9 A Agriculture, Forestry, and Fishery
5 5 1 3 3 1 18
10 L Real Estate 2 4 3 3 3 3 18
The results surprisingly indicated that the sector of Education Services ranked first, followed by
Information and Communication. The sector of Education Services has strong competitiveness and
JISDeP – The Journal of Indonesia Sustainable Development Planning (p. 140 - 159) Vol. I No. 2 - August 2020
Rosiadi 155
progressive growth. Its competitiveness is indicated by a high Local Share Growth (LS) value, as well as competitive advantage to the similar sector in the East Java GRDP. Yet this sector only has an average contribution to the Tulungagung Regency GRDP of less than 5%, and this is an important consideration. Information and Communication likewise has the same issue with Education Services. Ranking just below the two sectors is the Transportation and Warehousing sector, which has progressive growth but also less contribution to the GRDP.
Some assumptions about the phenomenon can be made from the findings. The dominance of
Education Services sector in this assessment could be supported by the expansion of the State Islamic Institute at Tulungagung (IAIN Tulungagung) since 2013. The growth of the sectors of Information and Communication as well as Transportation and Warehousing is part of the global phenomenon of Industrial Revolution 4.0, in which trade and economic activity become more supported by the usage of information technology, such as in online shopping.
The findings also have some consequences for regional and spatial planning, as most of the land use
in Tulungagung Regency is allotted to agricultural, forestry, and plantation activities. First, these findings provide a basis for reviewing land use plans, regional planning at the regency and provincial level, and certainly regional spatial plans (RTRW). This means that Tulungagung, East Java, and Indonesia must prepare for structural transformation. They may also need to modernize agriculture, forestry, and fishery to increase sectoral growth in the future.
4. Conclusion
Based on Tulungagung Regency regional development plan documents, the economic sectors that are established as leading economic sectors are Agriculture, Forestry, and Fishery; Processing Industry; and Large and Retail Trade & Car and Motorcycle Repair. These sectors have the biggest contributions to the Tulungagung Regency GRDP value from 2008-2019.
Based on growth criteria, the sector of Agriculture, Forestry, and Fishery was the leading economic
sector with the lowest growth among 17 economic sectors. Meanwhile, for the other two leading economic sectors, Large and Retail Trade & Car and Motorcycle Repair ranked ninth in average growth, and Processing Industry ranked tenth. The economic sectors with the highest average growths were Information and Communication, Accommodations & Food and Drink Services, and Health Services and Social Activities. From DLQ analysis results, 14 economic sectors were found to have great potential for growth and competition than the similar economic sectors for the Province of East Java, for which all the leading economic sectors dominated. Based on net shift analysis, the economy of Tulungagung Regency has a position of slow growth, although there are 10 economic sectors with progressive growth. Two leading economic sectors, being Large and Retail Trade & Car and Motorcycle Repair as well as Processing Industry, had positive net shift values, while Agriculture, Forestry, and Fishery had a negative and the lowest net shift value. The three sectors with the largest net shift values were Information and Communication; Large and Retail Trade & Car and Motorcycle Repair; and Education Services.
From the results of LQ analysis, seven sectors were classified as base sectors. Processing Industry was
the only leading economic sector that was classified as a non-base sector. Shift-share analysis through the LS component showed that the economy of Tulungagung Regency has weak competitiveness, but 11 economic sectors have strong competitiveness. Large and Retail Trade & Car and Motorcycle Repair was the leading economic sector with weak competitiveness. Processing Industry was the sector with the strongest competitiveness, followed by Transportation and Warehousing, and then Education Services. The economic sectors with the highest total scores and recommended to be new leading economic sectors are Education Services, Information and Communication, Transportation and Warehousing, Processing Industry, and Financial and Insurance Services. Two of the other traditional leading economic sectors placed in the top ten, although they were only sixth and ninth.
This study opens the opportunity for further research. Its finding is of interest, in that the sector of
Education Services is ranked first. In the context of Tulungagung, this could be affected by the expansion of the State Islamic Institute at Tulungagung since 2013. However, this conjecture needs to be reviewed

JISDeP – The Journal of Indonesia Sustainable Development Planning (p. 140 - 159) Vol. I No. 2 - August 2020
156 Rosiadi
further, and this may be a possible further research agenda, in addition to expanding the criteria for determining sectors. Furthermore, advanced analysis can be performed by reviewing sub-sectors of the economic sectors. For example, it may be possible that a sub-sector of Agriculture, Forestry, and Fishery has progressive growth or strong competitiveness compared to the larger economic sector. Based on this process of determining and identifying leading economic sectors, there are several strategies and policies that can be implemented by local governments. The combination of these new leading economic sectors can lead to new city branding. Then, traditional economic sectors can be modernized to increase their growth.
Acknowledgments
Our gratitude goes to the head of the regional development planning agency of Tulungagung Regency and all staff, for all the support that has been given in completing this study.
References
-. (2012). Rencana Tata Ruang Wilayah Kabupaten Tulungagung 2012-2032 [Regional Spatial Planning of Tulungagung Regency, 2012-2032].
-. (2019). RPJMD Kabupaten Tulungagung 2018-2023 []. Bappeda Kabupaten Tulungagung.
-. (2020a). PDRB Kabupaten Tulungagung 2008-2019 [GRDP of Tulungagung Regency, 2008-2019]. BPS.
-. (2020b). PDRB Provinsi Jawa Timur Atas Dasar Harga Konstan 2008-2019 [GRDP of the Province of East Java, 2008-2019]. BPS.
Achmad, D., & Hamzani, U. (2015). The Role of Regional Superior Sectors in Creating GDP Value Added, Employment Opportunity, Regional Productivity and Human Development Index. Procedia - Social and Behavioral Sciences, 211, 953–959. https://doi.org/10.1016/j.sbspro.2015.11.126
Achmad, Z. (2018). Determination of economic sector in East Kalimantan, Indonesia. Journal of Chinese Economic and Foreign Trade Studies, 11(3), 182–201. https://doi.org/10.1108/jcefts-01-2018-0001
Ackah, I., Osei, E., Dery Tuokuu, F. X., & Bobio, C. (2019). Oiling the wheels of sub-national development: An overview of development plan implementation in the Western region of Ghana. Extractive Industries and Society, 6(2), 343–357. https://doi.org/10.1016/j.exis.2018.12.002
Alhowaish, A. K. (2015). Location Quotient Technique and Economy Analysis of Regions: Tabuk Province of Saudi Arabia as a Case Study. International Journal of Science and Research (IJSR), 4(12), 1756–1761. https://doi.org/10.21275/v4i12.nov152375
Anasi, S. N., Ukangwa, C. C., & Fagbe, A. (2018). University libraries-bridging digital gaps and accelerating the achievement of sustainable development goals through information and communication technologies. World Journal of Science, Technology and Sustainable Development, 15(1), 13–25. https://doi.org/10.1108/wjstsd-11-2016-0059
Andhyka, M. (2019). The Development of Region Learning Concept in Increasing Regional Competitiveness. Eurasia: Economics & Business, 2(20), 113–124. https://doi.org/doi.org/10.18551/econeurasia.2019-02
Aryee, B. N. A. (2001). Ghana’s mining sector: Its contribution to the national economy. Resources Policy, 27(2), 61–75. https://doi.org/10.1016/S0301-4207(00)00042-8
Attah, A. (2015). Book Review. The Extractive Industries and Society, 2, 603–604. https://doi.org/10.1016/j.exis.2015.03.003
Bappenas. (2018). Tujuan Pembangunan Berkelanjutan - Sustainable Development Goals. sdgs.bappenas.go.id

JISDeP – The Journal of Indonesia Sustainable Development Planning (p. 140 - 159) Vol. I No. 2 - August 2020
Rosiadi 157
Berawi, M. A., Zagloel, T. Y., Miraj, P., & Mulyanto, H. (2017). Producing Alternative Concept for the Trans-sumatera Toll Road Project Development using Location Quotient Method. Procedia Engineering, 171, 265–273. https://doi.org/10.1016/j.proeng.2017.01.334
Billings, S. B., & Johnson, E. B. (2012). The location quotient as an estimator of industrial concentration. Regional Science and Urban Economics, 42(4), 642–647. https://doi.org/10.1016/j.regsciurbeco.2012.03.003
Budd, L., & Hirmis, A. K. (2004). Conceptual framework for regional competitiveness. Regional Studies, 38(9), 1015–1028. https://doi.org/10.1080/0034340042000292610
Burch, S., Andrachuk, M., Carey, D., Frantzeskaki, N., Schroeder, H., Mischkowski, N., & Loorbach, D. (2016). Governing and accelerating transformative entrepreneurship: exploring the potential for small business innovation on urban sustainability transitions. Current Opinion in Environmental Sustainability, 22, 26–32. https://doi.org/10.1016/j.cosust.2017.04.002
Castán Broto, V. (2017). Urban Governance and the Politics of Climate change. World Development, 93, 1–15. https://doi.org/10.1016/j.worlddev.2016.12.031
Chiang, S. H. (2009). Location quotient and trade. Annals of Regional Science, 43(2), 399–414. https://doi.org/10.1007/s00168-008-0218-y
Chiang, S. hen. (2012). Shift-share analysis and international trade. Annals of Regional Science, 49(3), 571–588. https://doi.org/10.1007/s00168-011-0465-1
Chimhowu, A. O., Hulme, D., & Munro, L. T. (2019). The “New” national development planning and global development goals: Processes and partnerships. World Development, 120, 76–89. https://doi.org/10.1016/j.worlddev.2019.03.013
Chisadza, C., & Bittencourt, M. (2019). Economic development and democracy: The modernization hypothesis in sub-Saharan Africa. Social Science Journal, 56(2), 243–254. https://doi.org/10.1016/j.soscij.2018.10.007
Crawley, A., Beynon, M., & Munday, M. (2013). Making Location Quotients More Relevant as a Policy Aid in Regional Spatial Analysis. Urban Studies, 50(9), 1854–1869. https://doi.org/10.1177/0042098012466601
de Vries, G. J., Erumban, A. A., Timmer, M. P., Voskoboynikov, I., & Wu, H. X. (2012). Deconstructing the BRICs: Structural transformation and aggregate productivity growth. Journal of Comparative Economics, 40(2), 211–227. https://doi.org/10.1016/j.jce.2012.02.004
Delgado, M., Porter, M. E., & Stern, S. (2014). Clusters, convergence, and economic performance. Research Policy, 43(10), 1785–1799. https://doi.org/10.1016/j.respol.2014.05.007
Devkota, S. C., & Upadhyay, M. P. (2016). How does education inequality respond to policy? A method and application to survey data from Albania and Nepal. Journal of Economic Studies, 43(2), 14. https://doi.org/DOI 10.1108/JES-09-2014-0156
Dogru, T., & Sirakaya-Turk, E. (2017). Engines of tourism’s growth: An examination of efficacy of shift-share regression analysis in South Carolina. Tourism Management, 58, 205–214. https://doi.org/10.1016/j.tourman.2016.10.021
Frantzeskaki, N., Wittmayer, J., & Loorbach, D. (2014). The role of partnerships in “realising” urban sustainability in Rotterdam’s City Ports Area, the Netherlands. Journal of Cleaner Production, 65, 406–417. https://doi.org/10.1016/j.jclepro.2013.09.023
Galland, D. (2012). Is regional planning dead or just coping? The transformation of a state sociospatial project into growth-oriented strategies. Environment and Planning C: Government and Policy, 30(3), 536–552. https://doi.org/10.1068/c11150

JISDeP – The Journal of Indonesia Sustainable Development Planning (p. 140 - 159) Vol. I No. 2 - August 2020
158 Rosiadi
Gylfason, T. (2001). Natural resources, education, and economic development. European Economic Review, 45(4–6), 847–859. https://doi.org/10.1016/S0014-2921(01)00127-1
Harmono, ., & Nirwanto, N. (2016). Development of Regional Innovation System Model-Based Economic, Science and Technology, Social and Cultural Factors to Improve Regional Competitiveness in Malang East Java Province – The Republic of Indonesia. Mediterranean Journal of Social Sciences, 7(3), 415–423. https://doi.org/10.5901/mjss.2016.v7n3s1p415
Hölscher, K., Frantzeskaki, N., McPhearson, T., & Loorbach, D. (2019). Capacities for urban transformations governance and the case of New York City. Cities, 94(March 2018), 186–199. https://doi.org/10.1016/j.cities.2019.05.037
Huang-Lachmann, J. T., & Lovett, J. C. (2016). How cities prepare for climate change: Comparing Hamburg and Rotterdam. Cities, 54, 36–44. https://doi.org/10.1016/j.cities.2015.11.001
Imaz, M., & Sheinbaum, C. (2017). Science and technology in the framework of the sustainable development goals. World Journal of Science, Technology and Sustainable Development, 14(1), 2–17. https://doi.org/10.1108/wjstsd-04-2016-0030
Khusaini, M. (2015). A Shift-share Analysis on Regional Competitiveness - A Case of Banyuwangi District, East Java, Indonesia. Procedia - Social and Behavioral Sciences, 211, 738–744. https://doi.org/10.1016/j.sbspro.2015.11.097
Maroto-Sánchez, A., & Cuadrado-Roura, J. R. (2009). Is growth of services an obstacle to productivity growth? A comparative analysis. Structural Change and Economic Dynamics, 20(4), 254–265. https://doi.org/10.1016/j.strueco.2009.09.002
Márquez, M. A., Ramajo, J., & Hewings, G. J. D. (2009). Incorporating sectoral structure into shift-share analysis. Growth and Change, 40(4), 594–618. https://doi.org/10.1111/j.1468-2257.2009.00502.x
Maudos, J., Pastor, J. M., & Serrano, L. (2008). Explaining the US-EU productivity growth gap: Structural change vs. intra-sectoral effect. Economics Letters, 100(2), 311–313. https://doi.org/10.1016/j.econlet.2008.02.017
Mo, S. W., Lee, K. B., Lee, Y. J., & Park, H. G. (2020). Analysis of import changes through shift-share, location quotient and BCG techniques: Gwangyang Port in Asia. Asian Journal of Shipping and Logistics, 1–12. https://doi.org/10.1016/j.ajsl.2020.01.001
Morrissey, K. (2014). Producing regional production multipliers for Irish marine sector policy: A location quotient approach. Ocean and Coastal Management, 91, 58–64. https://doi.org/10.1016/j.ocecoaman.2014.02.006
Nations, U. (2015). Sustainable Development Goals. Sustainable Development Goals. https://www.un.org/sustainabledevelopment/sustainable-development-goals/
Obeng-Odoom, F. (2013). Resource curse or blessing in Africa’s oil cities? Empirical evidence from Sekondi-Takoradi, West Africa. City, Culture and Society, 4(4), 229–240. https://doi.org/10.1016/j.ccs.2013.07.001
Oyewole, P. (2016). Regional Competition in the International Market for Services: A Shift-Share Analysis. Journal of Global Marketing, 29(1), 3–14. https://doi.org/10.1080/08911762.2015.1119918
Purwanto, A., Sušnik, J., Suryadi, F. X., & de Fraiture, C. (2018). Determining strategies for water, energy, and food-related sectors in local economic development. Sustainable Production and Consumption, 16(xxxx), 162–175. https://doi.org/10.1016/j.spc.2018.08.005
Raub, S. P., & Martin-Rios, C. (2019). “Think sustainable, act local” – a stakeholder-filter-model for translating SDGs into sustainability initiatives with local impact. International Journal of Contemporary Hospitality Management, 31(6), 2428–2447. https://doi.org/10.1108/IJCHM-06-2018-0453

JISDeP – The Journal of Indonesia Sustainable Development Planning (p. 140 - 159) Vol. I No. 2 - August 2020
Rosiadi 159
Resbeut, M., & Gugler, P. (2016). Impact of clusters on regional economic performance. Competitiveness Review, 26(2), 188–209. https://doi.org/10.1108/cr-09-2015-0078
Sachs, J. D., & Warner, A. M. (1999). The big push, natural resource booms and growth. Journal of Development Economics, 59(1), 43–76. https://doi.org/10.1016/S0304-3878(99)00005-X
Stevens, B. H., & Moore, C. L. (1980). A Critical Review of Literature on Shift-Share a S a Forecasting Technique. 20(4), 419–437. https://doi.org/https://doi.org/10.1111%2Fj.1467-9787.1980.tb00660.x
Sutikno, & Suliswanto, M. S. W. (2015). The Development of Manufacturing Industry Cluster as an Effort of Economic Improvement Expansion in East Java. Procedia - Social and Behavioral Sciences, 211, 992–998. https://doi.org/10.1016/j.sbspro.2015.11.132
Tervo, H., & Okko, P. (1983). a Note on Shift‐Share Analysis As a Method of Estimating the Employment Effects of Regional Economic Policy. Journal of Regional Science, 23(1), 115–121. https://doi.org/10.1111/j.1467-9787.1983.tb00788.x
Trappey, A. J. C., Trappey, C. V, Liu, P. H. Y., Hsiao, C. T., Ou, J. J. R., & Chen, K. W. P. (2013). Concurrent Engineering Approaches for Sustainable Product Development in a Multi-Disciplinary Environment. Concurrent Engineering Approaches for Sustainable Product Development in a Multi-Disciplinary Environment. https://doi.org/10.1007/978-1-4471-4426-7
Vadlamannati, K. C. (2008). Do Insurance Sector Growth and Reforms Affect Economic Development? Empirical Evidence from India. Margin, 2(1), 43–86. https://doi.org/10.1177/097380100700200102