Embed Size (px)
Citation preview

Indicator Properties of Hydrangea Extract (1090-050) 1
Determining the Acid/Alkali and Color Properties of the Anthocyanin
Delphinidin-3-Monoglucoside in Hydrangea Macrophylla
Josh Hurwitz 1090-050 Riverview High School Sarasota, FL., USA Chemistry 3992 Words
Indicator Properties of Hydrangea Extract (1090-050) 2
Abstract
Hydrangea macrophylla, commonly known as ‘big-leaf’ hydrangea, is known for its two
distinct colors. The same plant can exhibit brilliant pink leaves, and at the same time, another
next to it can display deep blue sepals. Sometimes the plants can switch colors, depending on soil
conditions. The mechanism for this change, and also the original pigmentation, is credited to
anthocyanins, water-soluble pigments with three conjugated carbon rings. In this investigation,
two hydrangea macrophylla (grown in closed soil conditions) were used to determine the
acid/alkali indicator properties of the anthocyanins in red and blue hydrangea macrophylla
sepals. Extracts were obtained by heating the sepals in ethanol, and measurements were taken.
Ultimately, it was found that the red color in hydrangea macrophylla is the result of protonated
anthocyanins—the concentration of acidic pigments was nearly twice the concentration of the
blue extract. The deep blue color was determined to be the result of chelation with Al3+ ions,
which require the presence of the alkali anhydride of the anthocyanin, which formed at a pH of
7.98. An attempt was then made to reverse the colors of the sepals, using an Al2(SO4)3 additive to
the soil of the red plants; the blue plants, because of Al3+ soil depletion, naturally lost their color.
However, the sepal colors did not fully reverse—both plants yielded green flowers. Because the
colors remained unchanging for a week, new extracts were obtained, tested, and found to have a
decrease in pH difference between the red and blue extracts. This suggests that the anthocyanins
in the sepals were advancing towards a color reversal, but had not fully completed changing.
These findings were ultimately inconclusive and deserve further study. However, the
observations made on the original extracts confirmed the sensitivity of anthocyanins in hydrangea
macrophylla to acidity and Al3+ availability.
299 Words

Indicator Properties of Hydrangea Extract (1090-050) 3
Contents Introduction to the Experiment..............................................................................4
Methods and Materials............................................................................................8
Results and Data Obtained .....................................................................................10 Qualitative Observations before Color Change ......................................10 Quantitative Data before Color Change .................................................11 Qualitative Observations after Color Change.........................................17 Quantitative Data after Color Change ....................................................17
Data Analysis............................................................................................................25 Qualitative Data ......................................................................................25 Quantitative Data before Color Change .................................................28 Comparison to Known Values .................................................................30 Quantitative Data after Color Change ....................................................32 Limitations and Uncertainties .................................................................34
Conclusion ...............................................................................................................36
Appendices................................................................................................................38 History of Anthocyanins...........................................................................38 Effect of Soil pH on Hydrangea Salt Absorption .....................................40 Common Acid/Alkali Indicators...............................................................41
References.................................................................................................................42

Indicator Properties of Hydrangea Extract (1090-050) 4
Introduction to the Experiment
Anthocyanins are water-soluble flavonoid pigments
that are found in many plants. They have been studied and
used for thousands of years (see Appendix One: History of
Anthocyanins) and are known to contribute to flower colors
across the visible spectrum; the only color yet to be recorded
is green. In hydrangea macrophylla, there is one prominent
compound in the sepals that gives the plant its pigmentation.
Delphinidin-3-monoglucoside, a three-ringed molecule with
a sugar bonded to an sp3 hybridized carbon atom in the second ring, is responsible for the red/blue
color of the plant. One study identified 43 different types of anthocyanins in four wild forms of
garden iris, and concluded, “There was no particular relationship between the type of pigment
present, and the flower color,” (Tsutomu Yabuya, 1990). This suggests that plant colors (and
changes) are the result of structural changes the anthocyanins undergo.
However, the mechanism of this color change is widely disputed, and conflicting
opinions litter the botany and gardener literature. Most agree that acidity plays a role in the color
change, because soil pH has been measured around hydrangea bushes—blue is usually associated
with acidic soils—but the way pH affects the plant color is not well known. The University of
Georgia documents on it’s agricultural website that the presence of Al3+ ions determines sepal
color, and that differing soil pH affects the plant’s ability to absorb salt compounds (see Appendix
Two: Effect of Soil pH on Hydrangea Salt Absorption).
Since Al3+ ions do not typically display blue color properties in solutions, they could
react with a compound in the flower to reflect a blue light, which would explain why adding
Al2(SO4)3 to the soil would blue the flowers. In one study, biochemists added Al3+ to cut Chinese
Bellflowers, and observed that it rapidly made the sepals bluer. The study concluded that the
Structure of delphinidin-3-monoglucoside

Indicator Properties of Hydrangea Extract (1090-050) 5
color change in Chinese Bellflowers was due to the chelation of anthocyanin with Al3+ (Susumu
Maekawa, Noboru Inagaki and Motoichi Terabun, 1983).
Chelation occurs when a metal ion is bonded
with multiple sigma bonds, and this formation
requires specific conditions. Primarily, metal
chelation with anthocyanins requires a pH above the
pKa of the anthocyanin’s phenolic group, which is
the part of the pigment that bonds with the metal.
Chelation occurs frequently in plants to assist in
nutrient intake. Metal ions that would otherwise
bind with other chemicals to make insoluble compounds are chelated with organic compounds to
assist in the plant’s intake of nutrients, and help prevent excess solid forming in the sepals.
Additionally, because bonded ions are much more stable than non-bonded ions, chelation
facilitates the plant’s direction of nutrient-ions.
However, in laboratory conditions,
anthocyanins can also act as pH indicators. Indicators
change colors because of structural changes the
compound undergoes in solutions of differing acidity.
Physically, confining electrons to a smaller space makes
the light they absorb bluer (reflect redder). Adding an H+
ion to acid/alkali indicators—an acidic solution—will
confine electrons to a single sigma bond with the H+ ion, causing a bathochromic (red) shift in the
indicator. Conversely, removing H+ ion(s) from the indicator—an alkaline solution—will allow
electrons to spread out in non-bonding orbitals, resulting in a hypsochromic (blue) shift.
Magnesium chelated in chlorophyll, the compound responsible for photosynthesis and the green color of most plants.
Universal Indicator (UI) in solutions of varying pH. More values are listed in Appendix Three: Common Acid/Alkali Indicators.
Indicator Properties of Hydrangea Extract (1090-050) 6
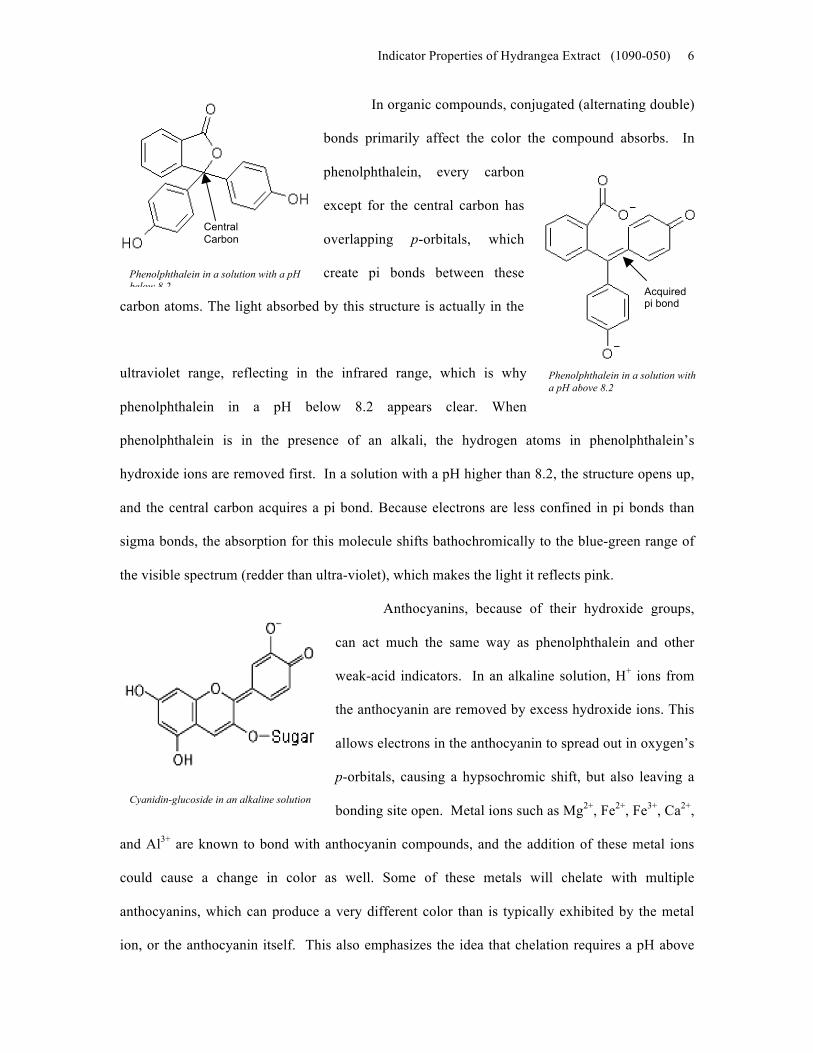
In organic compounds, conjugated (alternating double)
bonds primarily affect the color the compound absorbs. In
phenolphthalein, every carbon
except for the central carbon has
overlapping p-orbitals, which
create pi bonds between these
carbon atoms. The light absorbed by this structure is actually in the
ultraviolet range, reflecting in the infrared range, which is why
phenolphthalein in a pH below 8.2 appears clear. When
phenolphthalein is in the presence of an alkali, the hydrogen atoms in phenolphthalein’s
hydroxide ions are removed first. In a solution with a pH higher than 8.2, the structure opens up,
and the central carbon acquires a pi bond. Because electrons are less confined in pi bonds than
sigma bonds, the absorption for this molecule shifts bathochromically to the blue-green range of
the visible spectrum (redder than ultra-violet), which makes the light it reflects pink.
Anthocyanins, because of their hydroxide groups,
can act much the same way as phenolphthalein and other
weak-acid indicators. In an alkaline solution, H+ ions from
the anthocyanin are removed by excess hydroxide ions. This
allows electrons in the anthocyanin to spread out in oxygen’s
p-orbitals, causing a hypsochromic shift, but also leaving a
bonding site open. Metal ions such as Mg2+, Fe2+, Fe3+, Ca2+,
and Al3+ are known to bond with anthocyanin compounds, and the addition of these metal ions
could cause a change in color as well. Some of these metals will chelate with multiple
anthocyanins, which can produce a very different color than is typically exhibited by the metal
ion, or the anthocyanin itself. This also emphasizes the idea that chelation requires a pH above
Phenolphthalein in a solution with a pH below 8.2
Central Carbon
Cyanidin-glucoside in an alkaline solution
Phenolphthalein in a solution with a pH above 8.2
Acquired pi bond

Indicator Properties of Hydrangea Extract (1090-050) 7
the pKa of the phenolic group, because the H+ ions need to be removed for the metal ion(s) to
have an open bonding site. Because the acidified anthocyanins are generally accepted as red in
color, deprotonated anthocyanins must be present either alone, or chelated with certain metal ions
to change the color.
The following experiment will investigate the acid/alkali and color properties of the
anthocyanin delphinidin-3-monoglucoside, found in hydrangea macrophylla, and attempt to
answer the following questions:
• How do the anthocyanins in blue and red hydrangea macrophylla sepal
extracts differ with respect to pH and concentration?
• Is Al3+ directly responsible for hypsochromic shifts in the anthocyanins, or
does it trigger another bluing mechanism in the plant?
• How effective is delphinidin-3-monoglucoside as a pH indicator, and what is
its pKa?
• How are the concentrations and/or chemical properties of the anthocyanins in
red or blue sepals changed when the colors are reversed?
Qualitative tests will be performed on extracts to determine the color changing
mechanism. Since anthocyanins are weak acids, titrations with NaOH will be performed to
determine the concentration of acidic anthocyanins and the pKa of delphinidin-3-monoglucoside.
Using the qualitative data obtained, the sepal colors will be reversed, and the tests will then be
repeated to note any changes in the properties of the anthocyanins.

Indicator Properties of Hydrangea Extract (1090-050) 8
Methods and Materials
Two commercially grown hydrangea macrophylla were obtained from a nursery. The
blue and red petals were stripped from the flower stalk at the bud, so as not to include a
significant amount of chlorophyll pigment, which might interfere with the anthocyanin
concentration. 10 .002g of petals were added to 100 .05cm3 of ethyl alcohol (ethanol), which
included a methanol-denaturing agent. The 250cm3 beaker containing the petals and ethanol
solution was then placed inside a 500cm3 beaker of distilled water, and set on a hot plate at 50°C.
Floating the beaker containing the sepals provided equal distribution of heat to the solution. The
sepals were heated until they were translucent, indicating a substantial amount of pigment had
been removed from the sepals. The extract was then collected, and the petals discarded. The
ethanol left in the solution was assumed not to affect the acid/alkali color properties of the
anthocyanins. The pH of the extracted solution was measured with an electronic pH meter.
Qualitative tests with HCl, NaOH, AlCl3(aq), FeCl3(aq), Ca(NO3)2(aq), and Mg(NO3)2(aq) were then
performed to determine the color change mechanism of the ethanolic extract.
A stock solution of .01moldm-3 NaOH was prepared by adding .253 .002g of NaOH to
500 .05cm3 of distilled water in a graduated cylinder. 50 .05cm3 of red extract was measured
in a 50cm3-graduated cylinder, and titrated with the stock solution of NaOH in a plastic burette
with an error of .05cm3. The titrations operated on the rule that the equivalence point is
reached when the moles of alkali equals the moles of acid, which would determine the
concentration of weak acids if a known amount of alkali was added. The titrations were
performed in triplicate on red and blue sepal extracts that had been obtained separately. The pKa
was calculated from the generated titration curve.
The colors of the red and blue hydrangea macrophylla were treated in the following
manner: Because of Al3+ soil depletion, the blue flowered plants required no additive to change
colors. The red plants received an Al2(SO4)3 additive in their soil. Enough additive was added to

Indicator Properties of Hydrangea Extract (1090-050) 9
regulate the soil pH at 5.0. Both plants were treated as stated for one week, and sepal color was
noted. When the color of the newly grown sepals had changed and remained stable for one week,
the same measurements were taken.
The sepals were then extracted in the same manner as before, and titrated with the same
NaOH stock solution. Like the first titrations, three tests were performed on each color flower,
and pKa and concentration was calculated.
All titration points were uploaded into a calculator, and a logistics, , or sine,
, function was used to approximate the curve, depending on the amount of
deviation the generated curves had around the values near the equivalence points. The inflection
point on each graph (where the second derivative equaled zero) was used to determine the
equivalence point. The functions generated were also used to more precisely determine other
quantitative measurements taken, such as the pH values at those points and the pKa of the system.

Indicator Properties of Hydrangea Extract (1090-050) 10
Results and Data Obtained
Qualitative Observations before Color Change
The unaltered extract was consistently one color, a pale pink similar to white wine (which
does contain ethanol and anthocyanins). Preliminary qualitative tests suggested that the
anthocyanin in an alkaline solution produced a slightly yellow color. Adding excess NaOH to the
solution made a very yellow color, and adding similar amounts of HCl turned the solution clear. It
was unclear at this point if the HCl actually added extra H+ ions back to the anthocyanin, or if the
excess water created from the bonding of H+ ions from the acid and hydroxide ions from the base
diluted the solution to the point where the color was not visible in small quantities. In all
instances, adding any chemical to the system produced very small bubbles. Since such a small
amount of bubbles were evolved, however, the produced gas was deemed negligible.
The alkaline anthocyanin in
solution also reacted with two metal
ions to produce different colors.
Excess Al3+ ions added in the form of
AlCl3(aq) turned the solution blue, and
it appeared that the chelation of the
aluminum was directly responsible
for the blue tint in the flower. In this
model, the Al3+ ion chelates with
anthocyanins in a 2:1 mole ratio. Adding excess Fe3+ in the form of FeCl3(aq) produced a very
dark green that had to be diluted in distilled water to accurately qualify it as green, not black. The
addition of Ca2+ in the form of Ca(NO3)2(aq) and Mg2+ in Mg(NO3)2(aq) made no visible color
change.
Aluminum ion chelated in a 2:1 mole ratio with anthocyanin pigments. It was assumed that iron (III) ions behaved similarly.

Indicator Properties of Hydrangea Extract (1090-050) 11
Quantitative Data before Color Change
The following titration data was obtained before the color of the sepals was artificially
changed. All titrations were carried out with the same stock solution, and with the same burette.
Titrations were stopped at 45cm3 or if the pH of the system exceeded 12. All titration points
obtained were equated to a logistic or sine function (depending on the amount of deviation), and
inflection points were obtained by approximating or ,
depending on the parent function to which the points were equated.
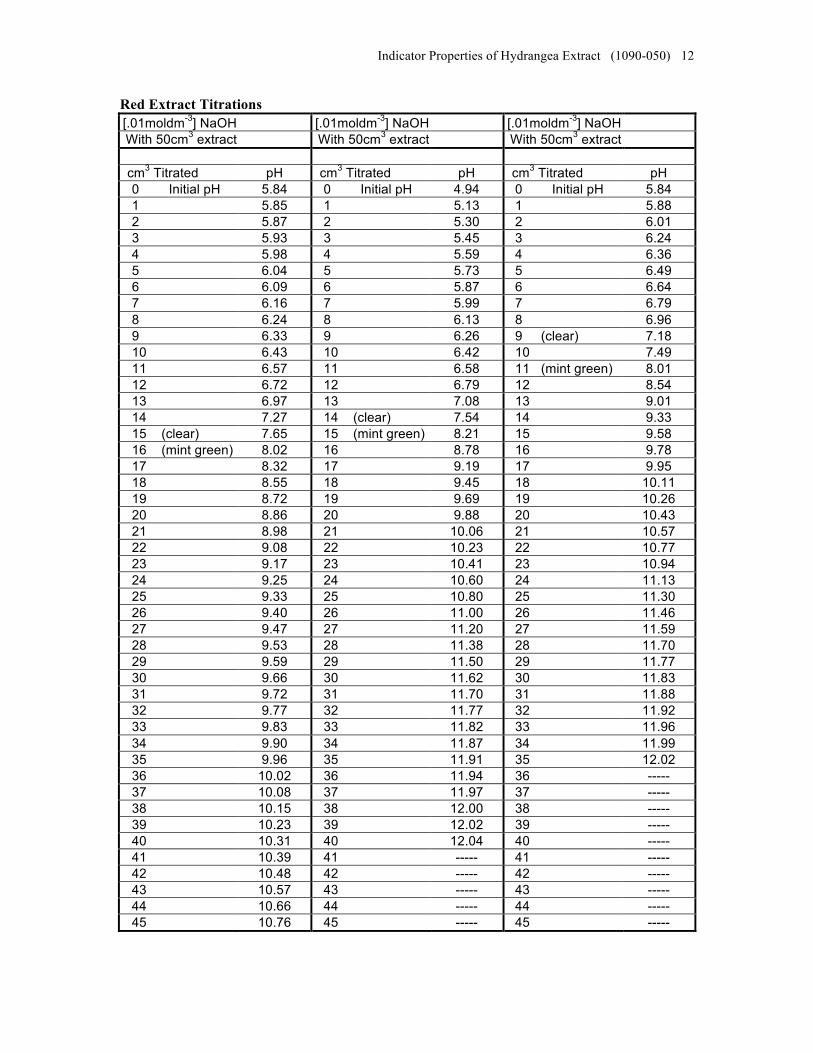
Indicator Properties of Hydrangea Extract (1090-050) 12
Red Extract Titrations [.01moldm-3] NaOH [.01moldm-3] NaOH [.01moldm-3] NaOH With 50cm3 extract With 50cm3 extract With 50cm3 extract
cm3 Titrated pH cm3 Titrated pH cm3 Titrated pH
0 Initial pH 5.84 0 Initial pH 4.94 0 Initial pH 5.84 1 5.85 1 5.13 1 5.88 2 5.87 2 5.30 2 6.01 3 5.93 3 5.45 3 6.24 4 5.98 4 5.59 4 6.36 5 6.04 5 5.73 5 6.49 6 6.09 6 5.87 6 6.64 7 6.16 7 5.99 7 6.79 8 6.24 8 6.13 8 6.96 9 6.33 9 6.26 9 (clear) 7.18 10 6.43 10 6.42 10 7.49 11 6.57 11 6.58 11 (mint green) 8.01 12 6.72 12 6.79 12 8.54 13 6.97 13 7.08 13 9.01 14 7.27 14 (clear) 7.54 14 9.33 15 (clear) 7.65 15 (mint green) 8.21 15 9.58 16 (mint green) 8.02 16 8.78 16 9.78 17 8.32 17 9.19 17 9.95 18 8.55 18 9.45 18 10.11 19 8.72 19 9.69 19 10.26 20 8.86 20 9.88 20 10.43 21 8.98 21 10.06 21 10.57 22 9.08 22 10.23 22 10.77 23 9.17 23 10.41 23 10.94 24 9.25 24 10.60 24 11.13 25 9.33 25 10.80 25 11.30 26 9.40 26 11.00 26 11.46 27 9.47 27 11.20 27 11.59 28 9.53 28 11.38 28 11.70 29 9.59 29 11.50 29 11.77 30 9.66 30 11.62 30 11.83 31 9.72 31 11.70 31 11.88 32 9.77 32 11.77 32 11.92 33 9.83 33 11.82 33 11.96 34 9.90 34 11.87 34 11.99 35 9.96 35 11.91 35 12.02 36 10.02 36 11.94 36 ----- 37 10.08 37 11.97 37 ----- 38 10.15 38 12.00 38 ----- 39 10.23 39 12.02 39 ----- 40 10.31 40 12.04 40 ----- 41 10.39 41 ----- 41 ----- 42 10.48 42 ----- 42 ----- 43 10.57 43 ----- 43 ----- 44 10.66 44 ----- 44 ----- 45 10.76 45 ----- 45 -----

Indicator Properties of Hydrangea Extract (1090-050) 13
Blue Extract Titrations [.01moldm-3] NaOH [.01moldm-3] NaOH [.01moldm-3] NaOH With 50cm3 extract With 50cm3 extract With 50cm3 extract cm3 Titrated pH cm3 Titrated pH cm3 Titrated pH
0 Initial pH 6.24 0 Initial pH 6.42 0 Initial pH 6.47 1 6.32 1 6.56 1 6.54 2 6.50 2 6.70 2 6.67 3 6.64 3 6.84 3 6.77 4 6.77 4 (clear) 6.99 4 6.91 5 6.93 5 7.16 5 7.04 6 7.12 6 7.41 6 7.18 7 (clear) 7.36 7 (yellowish) 7.73 7 (clear) 7.42 8 (mint green) 7.69 8 (mint green) 8.21 8 (yellowish) 7.87 9 8.20 9 8.70 9 (mint green) 8.45 10 8.62 10 9.06 10 9.06 11 9.00 11 9.35 11 9.53 12 9.24 12 9.58 12 9.86 13 9.50 13 9.77 13 10.09 14 9.66 14 9.96 14 10.30 15 9.84 15 10.13 15 10.48 16 9.97 16 10.26 16 10.65 17 10.08 17 10.32 17 10.81 18 10.21 18 10.45 18 10.98 19 10.35 19 10.60 19 11.11 20 10.45 20 10.72 20 11.24 21 10.57 21 10.86 21 11.35 22 10.68 22 10.95 22 11.44 23 10.80 23 11.08 23 11.54 24 10.87 24 11.17 24 11.63 25 10.98 25 11.27 25 11.71 26 11.09 26 11.37 26 11.76 27 11.20 27 11.47 27 11.79 28 11.31 28 11.55 28 11.84 29 11.39 29 11.60 29 11.88 30 11.46 30 11.66 30 11.91 31 11.53 31 11.71 31 11.94 32 11.58 32 11.75 32 11.97 33 11.64 33 11.80 33 12.00 34 11.70 34 11.84 34 12.03 35 11.74 35 11.87 35 12.05 36 11.78 36 11.90 36 ----- 37 11.82 37 11.92 37 ----- 38 11.85 38 11.95 38 ----- 39 11.87 39 11.97 39 ----- 40 11.90 40 12.00 40 ----- 41 ----- 41 ----- 41 ----- 42 ----- 42 ----- 42 ----- 43 ----- 43 ----- 43 ----- 44 ----- 44 ----- 44 ----- 45 ----- 45 ----- 45 -----

Indicator Properties of Hydrangea Extract (1090-050) 14
Titrations with red flower extract before changing the plant color provided the following
overall data. All values obtained inherit an error of .01 units.
It was assumed that the discrepancies between the curves were caused by the amount of light available before the titration. This is represented by the differing color of the extracts before the titrations.
All values inherit an error of .01 units. Inflection points were determined by equating a line to the titrated points, with less than 4% deviation. Finding where the second derivative equaled zero provided the x-value for the inflection points.
Plant Color Red-1 Red-2 Red-3 Average
Extract Color Description Pale Yellow Pink White wine -----
Temp during Titration Refrigerated Refrigerated Room temp -----
Titrated With (moldm-3) [.01] NaOH [.01] NaOH [.01] NaOH -----
Initial pH 5.84 4.94 5.84 5.54
Inflection Point (cm3) 15.94 15.93 12.66 14.84
pH at Inflection Point 7.18 8.43 8.58 8.06 [Acidic anthocyanin] (1/1000moldm-
3) 3.19 3.19 2.53 2.97
pKa of Anthocyanin 6.24 6.09 6.79 6.37
4
5
6
7
8
9
10
11
12
13
0 10 20 30 40 50
pH
mL .01moldm-3 NaOH
Red Extract Titrations Before Color Change
Red-1
Red-2
Red-3
Indicator Properties of Hydrangea Extract (1090-050) 15
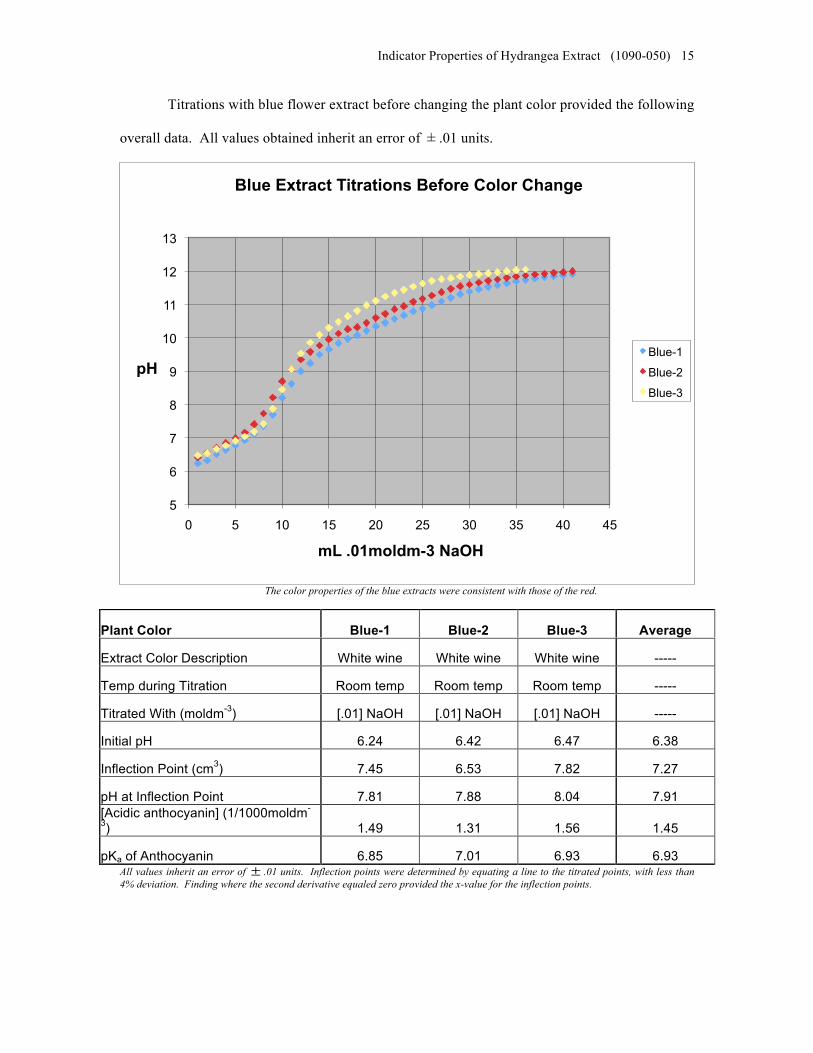
Titrations with blue flower extract before changing the plant color provided the following
overall data. All values obtained inherit an error of .01 units.
The color properties of the blue extracts were consistent with those of the red.
All values inherit an error of .01 units. Inflection points were determined by equating a line to the titrated points, with less than 4% deviation. Finding where the second derivative equaled zero provided the x-value for the inflection points.
5
6
7
8
9
10
11
12
13
0 5 10 15 20 25 30 35 40 45
pH
mL .01moldm-3 NaOH
Blue Extract Titrations Before Color Change
Blue-1
Blue-2
Blue-3
Plant Color Blue-1 Blue-2 Blue-3 Average
Extract Color Description White wine White wine White wine -----
Temp during Titration Room temp Room temp Room temp -----
Titrated With (moldm-3) [.01] NaOH [.01] NaOH [.01] NaOH -----
Initial pH 6.24 6.42 6.47 6.38
Inflection Point (cm3) 7.45 6.53 7.82 7.27
pH at Inflection Point 7.81 7.88 8.04 7.91 [Acidic anthocyanin] (1/1000moldm-
3) 1.49 1.31 1.56 1.45
pKa of Anthocyanin 6.85 7.01 6.93 6.93
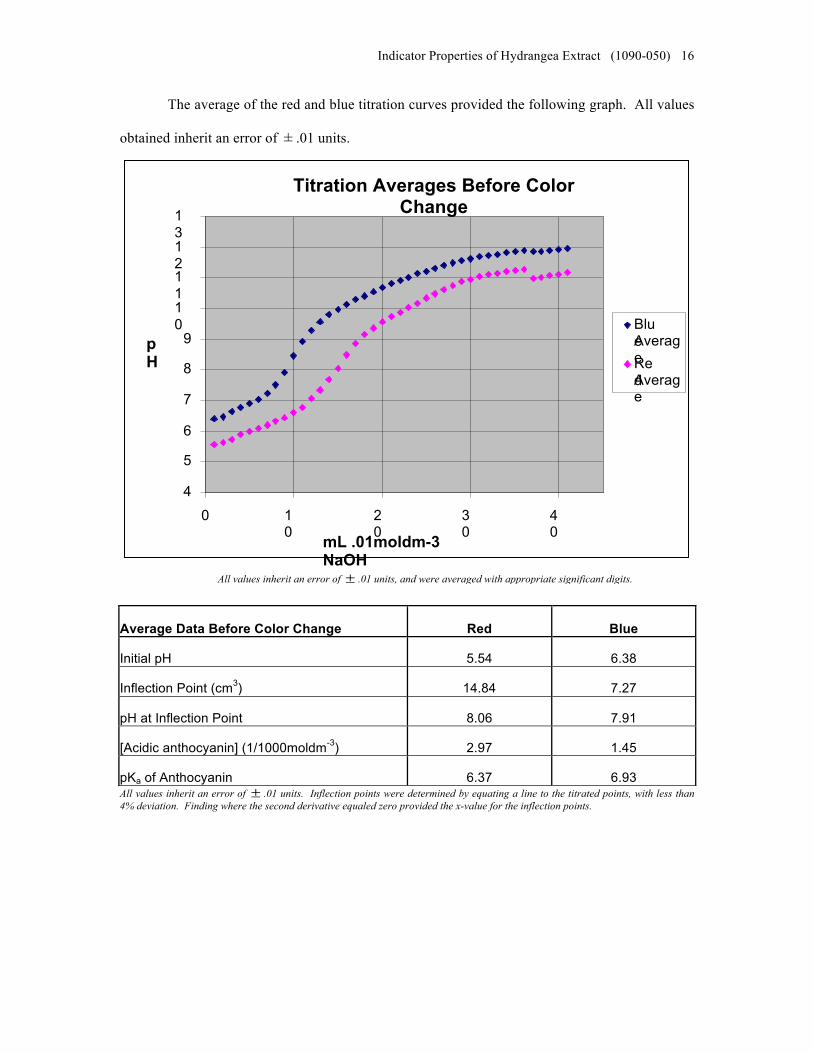
Indicator Properties of Hydrangea Extract (1090-050) 16
The average of the red and blue titration curves provided the following graph. All values
obtained inherit an error of .01 units.
Unusual jumps in the graph are the result of the averaging of only two recorded points, after one of the earlier titrations reached the endpoint before the others.
All values inherit an error of .01 units. Inflection points were determined by equating a line to the titrated points, with less than 4% deviation. Finding where the second derivative equaled zero provided the x-value for the inflection points.
Average Data Before Color Change Red Blue
Initial pH 5.54 6.38
Inflection Point (cm3) 14.84 7.27
pH at Inflection Point 8.06 7.91
[Acidic anthocyanin] (1/1000moldm-3) 2.97 1.45
pKa of Anthocyanin 6.37 6.93
All values inherit an error of .01 units, and were averaged with appropriate significant digits.
Titration Averages Before Color Change
4
5
6
7
8
9
10
11
12
13
0 10
20
30
40 mL .01moldm-3
NaOH
pH
Blue Average Red Average
Indicator Properties of Hydrangea Extract (1090-050) 17
Qualitative Data after Color Change
The red flowers were treated with Al2(SO4)3 in an attempt to lower the soil pH and allow
the plants to absorb more aluminum, which would change the sepal color to blue. The Al2(SO4)3
was added with the intention of lowering the pH to around 5.00, which would increase the salt
absorption through the roots. The red flowers had all been stripped for previous tests, and so the
new buds had to develop before the blue color could set in. The sepals actually grew white at
first, indicating a change in the development of the sepal pigmentation.
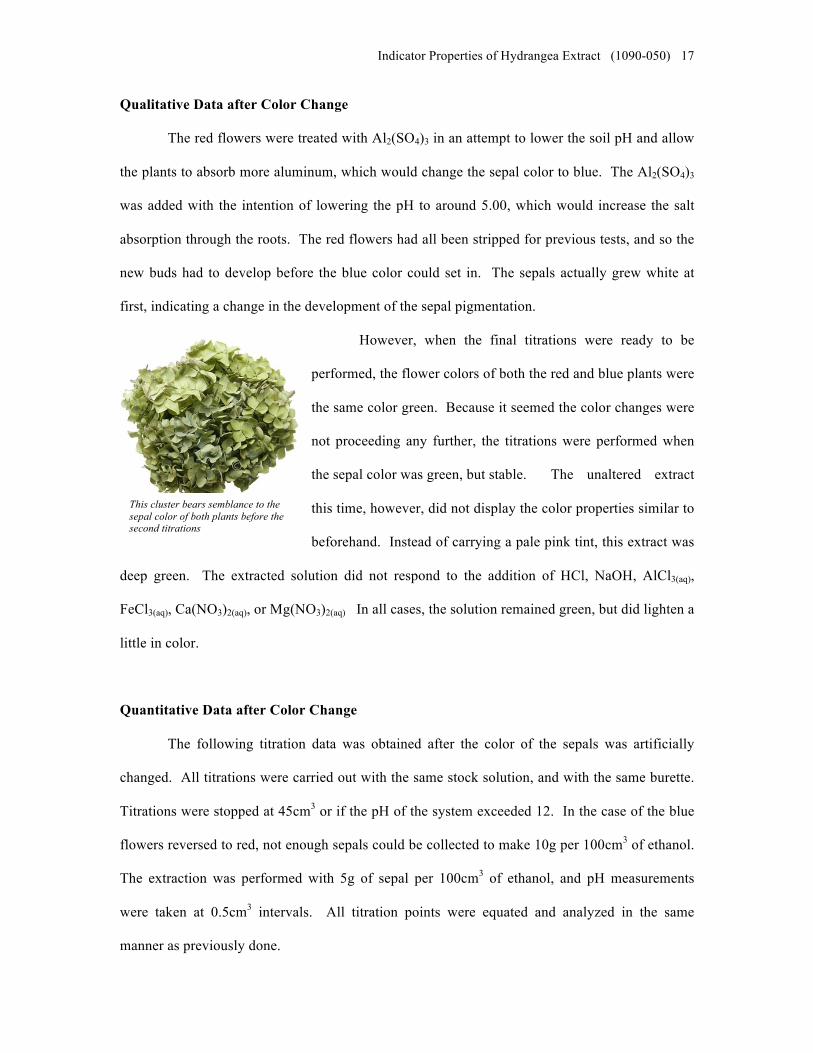
However, when the final titrations were ready to be
performed, the flower colors of both the red and blue plants were
the same color green. Because it seemed the color changes were
not proceeding any further, the titrations were performed when
the sepal color was green, but stable. The unaltered extract
this time, however, did not display the color properties similar to
beforehand. Instead of carrying a pale pink tint, this extract was
deep green. The extracted solution did not respond to the addition of HCl, NaOH, AlCl3(aq),
FeCl3(aq), Ca(NO3)2(aq), or Mg(NO3)2(aq) In all cases, the solution remained green, but did lighten a
little in color.
Quantitative Data after Color Change
The following titration data was obtained after the color of the sepals was artificially
changed. All titrations were carried out with the same stock solution, and with the same burette.
Titrations were stopped at 45cm3 or if the pH of the system exceeded 12. In the case of the blue
flowers reversed to red, not enough sepals could be collected to make 10g per 100cm3 of ethanol.
The extraction was performed with 5g of sepal per 100cm3 of ethanol, and pH measurements
were taken at 0.5cm3 intervals. All titration points were equated and analyzed in the same
manner as previously done.
This cluster bears semblance to the sepal color of both plants before the second titrations
Indicator Properties of Hydrangea Extract (1090-050) 18
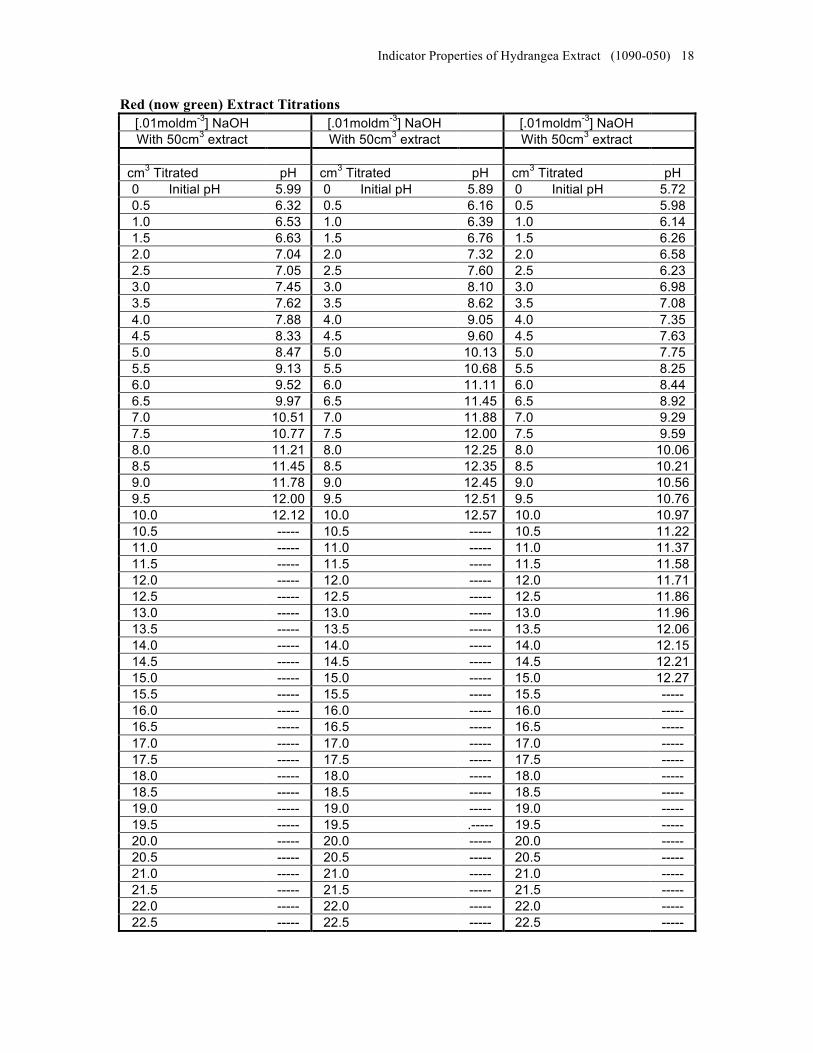
Red (now green) Extract Titrations [.01moldm-3] NaOH [.01moldm-3] NaOH [.01moldm-3] NaOH With 50cm3 extract With 50cm3 extract With 50cm3 extract
cm3 Titrated pH cm3 Titrated pH cm3 Titrated pH
0 Initial pH 5.99 0 Initial pH 5.89 0 Initial pH 5.72 0.5 6.32 0.5 6.16 0.5 5.98 1.0 6.53 1.0 6.39 1.0 6.14 1.5 6.63 1.5 6.76 1.5 6.26 2.0 7.04 2.0 7.32 2.0 6.58 2.5 7.05 2.5 7.60 2.5 6.23 3.0 7.45 3.0 8.10 3.0 6.98 3.5 7.62 3.5 8.62 3.5 7.08 4.0 7.88 4.0 9.05 4.0 7.35 4.5 8.33 4.5 9.60 4.5 7.63 5.0 8.47 5.0 10.13 5.0 7.75 5.5 9.13 5.5 10.68 5.5 8.25 6.0 9.52 6.0 11.11 6.0 8.44 6.5 9.97 6.5 11.45 6.5 8.92 7.0 10.51 7.0 11.88 7.0 9.29 7.5 10.77 7.5 12.00 7.5 9.59 8.0 11.21 8.0 12.25 8.0 10.06 8.5 11.45 8.5 12.35 8.5 10.21 9.0 11.78 9.0 12.45 9.0 10.56 9.5 12.00 9.5 12.51 9.5 10.76 10.0 12.12 10.0 12.57 10.0 10.97 10.5 ----- 10.5 ----- 10.5 11.22 11.0 ----- 11.0 ----- 11.0 11.37 11.5 ----- 11.5 ----- 11.5 11.58 12.0 ----- 12.0 ----- 12.0 11.71 12.5 ----- 12.5 ----- 12.5 11.86 13.0 ----- 13.0 ----- 13.0 11.96 13.5 ----- 13.5 ----- 13.5 12.06 14.0 ----- 14.0 ----- 14.0 12.15 14.5 ----- 14.5 ----- 14.5 12.21 15.0 ----- 15.0 ----- 15.0 12.27 15.5 ----- 15.5 ----- 15.5 ----- 16.0 ----- 16.0 ----- 16.0 ----- 16.5 ----- 16.5 ----- 16.5 ----- 17.0 ----- 17.0 ----- 17.0 ----- 17.5 ----- 17.5 ----- 17.5 ----- 18.0 ----- 18.0 ----- 18.0 ----- 18.5 ----- 18.5 ----- 18.5 ----- 19.0 ----- 19.0 ----- 19.0 ----- 19.5 ----- 19.5 .----- 19.5 ----- 20.0 ----- 20.0 ----- 20.0 ----- 20.5 ----- 20.5 ----- 20.5 ----- 21.0 ----- 21.0 ----- 21.0 ----- 21.5 ----- 21.5 ----- 21.5 ----- 22.0 ----- 22.0 ----- 22.0 ----- 22.5 ----- 22.5 ----- 22.5 -----

Indicator Properties of Hydrangea Extract (1090-050) 19
Blue (now green) Extract Titrations [.01moldm-3] NaOH [.01moldm-3] NaOH [.01moldm-3] NaOH
With 50cm3 extract With 50cm3 extract With 50cm3 extract cm3 Titrated pH cm3 Titrated pH cm3 Titrated pH
0 Initial pH 6.46 0 Initial pH 6.21 0 Initial pH 6.10 1 6.68 1 6.58 1 6.63 2 7.01 2 6.91 2 7.10 3 7.38 3 7.21 3 7.61 4 7.79 4 7.56 4 8.55 5 8.60 5 8.08 5 9.51 6 9.59 6 8.87 6 10.27 7 10.40 7 9.76 7 10.81 8 10.86 8 10.23 8 11.22 9 11.24 9 10.74 9 11.50 10 11.50 10 11.01 10 11.76 11 11.70 11 11.29 11 11.95 12 11.89 12 11.53 12 12.10 13 12.01 13 11.71 13 12.19 14 12.14 14 11.85 14 12.28 15 12.23 15 11.98 15 12.34 16 ----- 16 12.06 16 ----- 17 ----- 17 ----- 17 ----- 18 ----- 18 ----- 18 ----- 19 ----- 19 ----- 19 ----- 20 ----- 20 ----- 20 ----- 21 ----- 21 ----- 21 ----- 22 ----- 22 ----- 22 ----- 23 ----- 23 ----- 23 ----- 24 ----- 24 ----- 24 ----- 25 ----- 25 ----- 25 ----- 26 ----- 26 ----- 26 ----- 27 ----- 27 ----- 27 ----- 28 ----- 28 ----- 28 ----- 29 ----- 29 ----- 29 ----- 30 ----- 30 ----- 30 ----- 31 ----- 31 ----- 31 ----- 32 ----- 32 ----- 32 ----- 33 ----- 33 ----- 33 ----- 34 ----- 34 ----- 34 ----- 35 ----- 35 ----- 35 ----- 36 ----- 36 ----- 36 ----- 37 ----- 37 ----- 37 ----- 38 ----- 38 ----- 38 ----- 39 ----- 39 ----- 39 ----- 40 ----- 40 ----- 40 ----- 41 ----- 41 ----- 41 ----- 42 ----- 42 ----- 42 ----- 43 ----- 43 ----- 43 ----- 44 ----- 44 ----- 44 ----- 45 ----- 45 ----- 45 -----
Indicator Properties of Hydrangea Extract (1090-050) 20
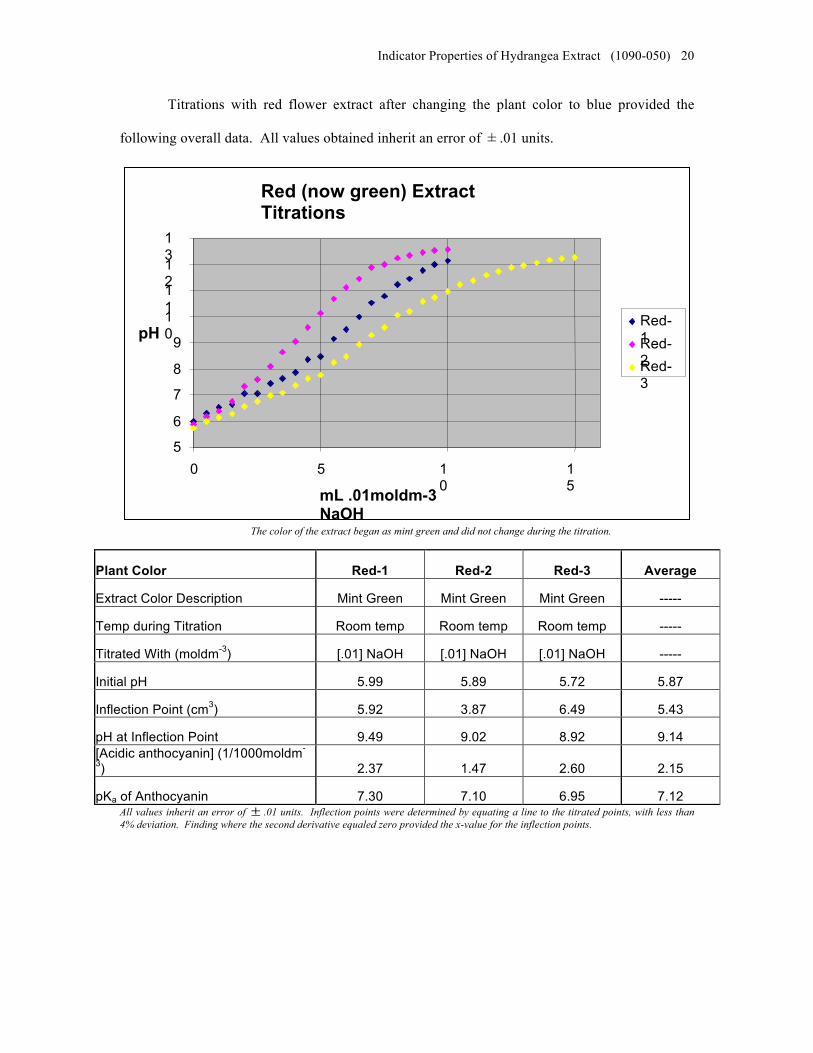
Titrations with red flower extract after changing the plant color to blue provided the
following overall data. All values obtained inherit an error of .01 units.
The color of the extract began as mint green and did not change during the titration.
All values inherit an error of .01 units. Inflection points were determined by equating a line to the titrated points, with less than 4% deviation. Finding where the second derivative equaled zero provided the x-value for the inflection points.
Plant Color Red-1 Red-2 Red-3 Average
Extract Color Description Mint Green Mint Green Mint Green -----
Temp during Titration Room temp Room temp Room temp -----
Titrated With (moldm-3) [.01] NaOH [.01] NaOH [.01] NaOH -----
Initial pH 5.99 5.89 5.72 5.87
Inflection Point (cm3) 5.92 3.87 6.49 5.43
pH at Inflection Point 9.49 9.02 8.92 9.14 [Acidic anthocyanin] (1/1000moldm-
3) 2.37 1.47 2.60 2.15
pKa of Anthocyanin 7.30 7.10 6.95 7.12
Red (now green) Extract Titrations
5 6
7 8
9 10
11
12
13
0 5 10
15 mL .01moldm-3
NaOH
pH Red-1 Red-2 Red-3

Indicator Properties of Hydrangea Extract (1090-050) 21
Titrations with blue flower extract after changing the plant color to red provided the
following overall data. All values obtained inherit an error of .01 units.
The color of the extract began as dark green and did not change during the titration.
All values inherit an error of .01 units. Inflection points were determined by equating a line to the titrated points, with less than 4% deviation. Finding where the second derivative equaled zero provided the x-value for the inflection points.
Plant Color Blue-1 Blue-2 Blue-3 Average
Extract Color Description Dark Green Dark Green Dark Green -----
Temp during Titration Room temp Room temp Room temp -----
Titrated With (moldm-3) [.01] NaOH [.01] NaOH [.01] NaOH -----
Initial pH 6.46 6.21 6.10 6.26
Inflection Point (cm3) 5.60 6.11 4.23 5.31
pH at Inflection Point 9.16 8.98 8.77 8.97 [Acidic anthocyanin] (1/1000moldm-
3) 1.12 1.22 0.85 1.06
pKa of Anthocyanin 7.27 7.19 7.17 7.21
Blue (now green) Extract Titrations
5
6
7
8
9
10
11
12
13
0 5 10
15 mL .01moldm-3
NaOH
pH
Blue-1 Blue-2 Blue-3

Indicator Properties of Hydrangea Extract (1090-050) 22
The average of the red and blue titration curves after the color change provided the
following graph. All values obtained inherit an error of .01 units.
Unusual jumps in the graph are the result of the averaging of only two recorded points, after one of the earlier titrations reached the endpoint before the others.
Average Data Red (now blue) Blue (now red)
Initial pH 5.87 6.26
Inflection Point (cm3) 5.43 5.31
pH at Inflection Point 9.14 8.97
[Acidic anthocyanin] (1/1000moldm-3) 2.15 1.06
pKa of Anthocyanin 7.12 7.21
Titration Averages After Color Change
5
6
7
8
9
10
11
12
13
0 5 10
15 mL .01moldm-3
NaOH
pH
Red (now green) Average Blue (now green) Average
All values inherit an error of .01 units, and were averaged with appropriate significant digits.

Indicator Properties of Hydrangea Extract (1090-050) 23
The average of the red titration curves before and after the color change provided the
following graph. All values obtained inherit an error of .01 units.
Unusual jumps in the graph are the result of the averaging of only two recorded points, after one of the earlier titrations reached the endpoint before the others.
Average Data Red Before Red After
Initial pH 5.54 5.87
Inflection Point (cm3) 14.84 5.43
pH at Inflection Point 8.06 9.14
[Acidic anthocyanin] (1/1000moldm-3) 2.97 2.15
pKa of Anthocyanin 6.37 7.12
All values inherit an error of .01 units, and were averaged with appropriate significant digits.
Red Averages Before and After Color Change
5
6
7
8
9
10
11
12
13
0 10
20
30
40
mL .01moldm-3 NaOH
pH
Red Before
Red After
All values inherit an error of .01 units, and were averaged with appropriate significant digits.

Indicator Properties of Hydrangea Extract (1090-050) 24
The average of the blue titration curves before and after the color change provided the
following graph. All values obtained inherit an error of .01 units.
Unusual jumps in the graph are the result of the averaging of only two recorded points, after one of the earlier titration data points reached the endpoint before the others.
Average Data Blue Before Blue After
Initial pH 6.38 6.26
Inflection Point (cm3) 7.27 5.31
pH at Inflection Point 7.91 8.97
[Acidic anthocyanin] (1/1000moldm-3) 1.45 1.06
pKa of Anthocyanin 6.93 7.21
All values inherit an error of .01 units, and were averaged with appropriate significant digits.

Indicator Properties of Hydrangea Extract (1090-050) 25
Data Analysis
Qualitative Data before Color Change
It was clear from the first qualitative test that the
chelation of Al3+ was responsible for the blue color in the
hydrangea macrophylla that were tested. The protonated
anthocyanin produced a distinctly red color, very similar to
the color of the red flowers before the extraction. When
excess NaOH was added, however, the solution rapidly
became very yellow. Since the anthocyanin is an organic
compound, color change is heavily dependent on the number
of conjugated bonds in the ring structures. Very similar to
cyanidin (right), when the delphinidin molecule is protonated, there are eight conjugated bonds in
the structure. However, in an alkaline solution it is deprotonated, and there are then only seven
conjugated bonds between carbons. The oxygen in the middle ring also loses its positive formal
charge, and the oxygen on the C-Ring loses a sigma bond and gains a pi bond, which frees
electrons, contributing to the hypsochromic shift of the structure.
Cyanidin molecules protonated (top), and deprotonated (bottom)
Indicator Properties of Hydrangea Extract (1090-050) 26
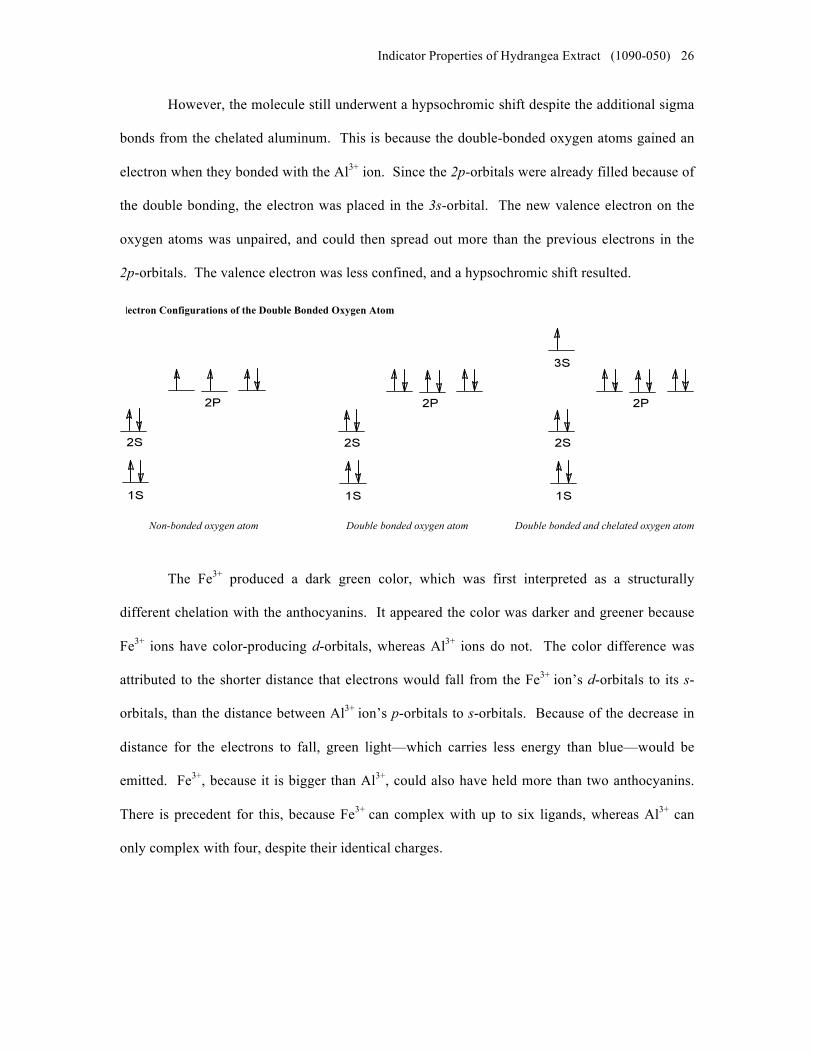
However, the molecule still underwent a hypsochromic shift despite the additional sigma
bonds from the chelated aluminum. This is because the double-bonded oxygen atoms gained an
electron when they bonded with the Al3+ ion. Since the 2p-orbitals were already filled because of
the double bonding, the electron was placed in the 3s-orbital. The new valence electron on the
oxygen atoms was unpaired, and could then spread out more than the previous electrons in the
2p-orbitals. The valence electron was less confined, and a hypsochromic shift resulted.
The Fe3+ produced a dark green color, which was first interpreted as a structurally
different chelation with the anthocyanins. It appeared the color was darker and greener because
Fe3+ ions have color-producing d-orbitals, whereas Al3+ ions do not. The color difference was
attributed to the shorter distance that electrons would fall from the Fe3+ ion’s d-orbitals to its s-
orbitals, than the distance between Al3+ ion’s p-orbitals to s-orbitals. Because of the decrease in
distance for the electrons to fall, green light—which carries less energy than blue—would be
emitted. Fe3+, because it is bigger than Al3+, could also have held more than two anthocyanins.
There is precedent for this, because Fe3+ can complex with up to six ligands, whereas Al3+ can
only complex with four, despite their identical charges.
Non-bonded oxygen atom Double bonded oxygen atom Double bonded and chelated oxygen atom
Electron Configurations of the Double Bonded Oxygen Atom

Indicator Properties of Hydrangea Extract (1090-050) 27
However, it was found by adding
a drop of FeCl3(aq) to excess ethanolic
extract that Fe3+ chelation actually
produces the same blue color as Al3+, and
that excess Fe3+ was complexing with
water to produce a yellow color. The two
colors combined to make an overall dark
green tint. Because Fe3+ and Al3+
produced the same color when chelated with the anthocyanins, it was assumed that they chelated
in the same manner, and that the color producing electrons did not land on nor fall from d-
orbitals, because Al3+ does not have d-orbitals. This supports the argument for the 3s electron
producing the blue color.
Aluminum ion chelated with delphinidin-3-monoglucoside, which reflects a blue light.

Indicator Properties of Hydrangea Extract (1090-050) 28
Quantitative Data before Color Change
The titrations conducted on the plants before their colors were changed were also
conclusive to determine several relationships between the red and blue plants. The consistent pKa
in both red and blue extracts demonstrates that similar extracts were tested, even though the
concentration and pH of the systems was significantly different. The initial pH of the red extract
was almost one pH unit lower than the blue extracts’, which supports the qualitative data obtained
before, where the red color was demonstrated in acidic solutions. This is also reflected in the
concentration of acidic anthocyanins in the ethanolic extract. Like the amount of NaOH added to
reach the equivalence point, the concentration of acidic anthocyanins in red sepal extract was
nearly twice that of blue extract. This supports the idea that in order for Al3+ ions to chelate with
the anthocyanins, they have to be deprotonated first, to leave an open bonding site on the oxygen
atoms.
Specifically referring to the individual titrations, the pH of the solution at the endpoints
varied more than would be expected. The first red titration did not exceed a pH of 11 even after
45cm3 of .01moldm-3 NaOH had been added, whereas the other two reached a pH of 12 at 40cm3
and 35cm3 respectively. This is likely because of the differing amounts of ethanol remaining in
the solution. Since the first titration was done on extract that had been allowed to sit overnight,
and the other two were obtained the same day, the ethanol concentration was probably
Average Data before Color Change Red Blue
Initial pH 5.54 6.38
Inflection Point (cm3) 14.84 7.27
pH at Inflection Point 8.06 7.91
[Acidic anthocyanin] (1/1000moldm-3) 2.97 1.45
pKa of Anthocyanin 6.37 6.93
All values inherit an error of .01 units, and were averaged with appropriate significant digits.
Indicator Properties of Hydrangea Extract (1090-050) 29
significantly different. Because ethanol is a volatile substance, allowing the first extract to sit
overnight allowed the ethanol more time to evaporate out of the solution, causing a decreased
amount in the extracted solution. This would have raised the concentration of acidic
anthocyanins in the solution, which would have created more of a buffer solution when the NaOH
was added. Because a stronger buffer was created, the pH would not have reached 12.00 as
quickly, despite the consistent inflection point.
The red extract titrations also had a slight second equivalence point. However, since the
color change had already occurred, and the pH was too high to take place inside the hydrangea
sepals, the second inflection point was assumed to be the neutralization of another organic acid.
The blue extracts, unlike the red extracts, were tested immediately after extraction, which
resulted in approximately equal endpoints for their titrations. All solutions reached a pH of 12
within 40cm3, with the exception of the first trial, which had a pH at 11.9. The quicker endpoints
are likely the result of lesser concentration of acidic anthocyanins in the blue extract than the red.
The blue extracts were tested on the same day as the extraction, but had they been allowed to
refrigerate for more time, the endpoints would probably have been reached later.
Indicator Properties of Hydrangea Extract (1090-050) 30
Comparison to Known Values
One of the ways to check the accuracy of this experiment is to compare the
results to published values, several of which were found. It was reported that deprotonization of
the delphinidin occurs at a pH of 7.00. (Dragan S. Veselinovich, 1992). This experiment
determined the pH at which the anthocyanins reached the inflection point before the color change
to be 8.06 for the red sepals, and 7.91 for the blue. Relative to the study’s findings, the data
obtained differed by 15% for the red flowers, and 13% for the blue. This can be explained by the
impurities in the solution while titrating with NaOH. The presence of other organic acids would
mean that more NaOH would have had to been added, causing the pH of the solution to be
slightly higher at the equivalence point.
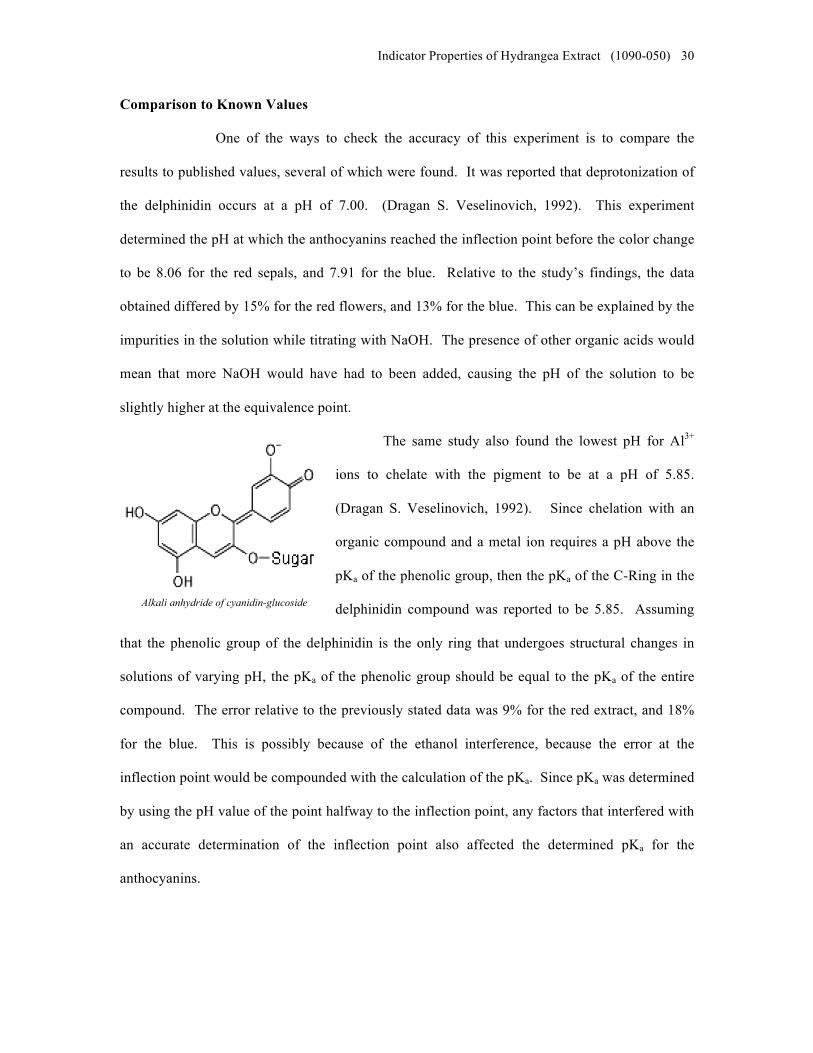
The same study also found the lowest pH for Al3+
ions to chelate with the pigment to be at a pH of 5.85.
(Dragan S. Veselinovich, 1992). Since chelation with an
organic compound and a metal ion requires a pH above the
pKa of the phenolic group, then the pKa of the C-Ring in the
delphinidin compound was reported to be 5.85. Assuming
that the phenolic group of the delphinidin is the only ring that undergoes structural changes in
solutions of varying pH, the pKa of the phenolic group should be equal to the pKa of the entire
compound. The error relative to the previously stated data was 9% for the red extract, and 18%
for the blue. This is possibly because of the ethanol interference, because the error at the
inflection point would be compounded with the calculation of the pKa. Since pKa was determined
by using the pH value of the point halfway to the inflection point, any factors that interfered with
an accurate determination of the inflection point also affected the determined pKa for the
anthocyanins.
Alkali anhydride of cyanidin-glucoside

Indicator Properties of Hydrangea Extract (1090-050) 31
Another study also examined hydrangea flower cells, and found the vacuolar pH in blue
plants to be markedly higher than in red plants. Vacuoles inside plant cells perform many
functions, but the most relevant to pH is the regulation of acidity in a cell. The study determined
the vacuolar pH of blue cells to be 4.1, and the pH of red cells to be 3.3 (Kumi Yoshida, 2006).
Vacuoles themselves are slightly acidic, which accounts for both pH readings being below seven.
Nevertheless, these findings suggest that there is a difference of 0.8 pH units between the red and
blue cells. Before the color change, the pH of the red extract was measured at 5.54 and the blue
at 6.38. The difference between the two is therefore 0.84 pH units, with a 5% error relative to the
known vacuolar pH values, assuming the difference remains constant after extraction.
Overview of Compared Values:
All values inherit an error of .01 units
Measurements and Data Red Blue Published Value
Avg. % Error
pH at Formation of Alkali Anhydride 8.06 7.91 7.00 14.1%
pKa of Acidic Anthocyanin 6.37 6.93 5.85 13.5%
pH Difference Between Red/Blue Extracts 0.84 0.80 5.0%
Indicator Properties of Hydrangea Extract (1090-050) 32
Quantitative Data after Color Change
As the colors of the flowers were reversed, it seemed that the characteristics which
previously distinguished the two colors meshed together to make the extracts indiscernible.
Because the pKa of the extract tested did remain constant between the solutions tested after the
color change, it was assumed that the anthocyanins were the compound tested during the
titrations. However, there were no developed patterns between the measurements before the
color change and those taken after the change. The quantitative data measurements for both of
the colors after the change were too similar to be definitive. Despite this, it seems that the
hydrangea macrophylla were in the process of reversing colors, because the quantitative data
changes anticipated for the change were starting to take place. A higher pH was needed in the red
flowers for the anthocyanins to chelate with Al3+ ions, and the pH of the red extract after the color
change had risen by 0.33 pH units. Conversely, the pH of the blue flowers needed to become
more acidic to turn red, and the pH of the blue extract after the color change had fallen by 0.12
pH units.
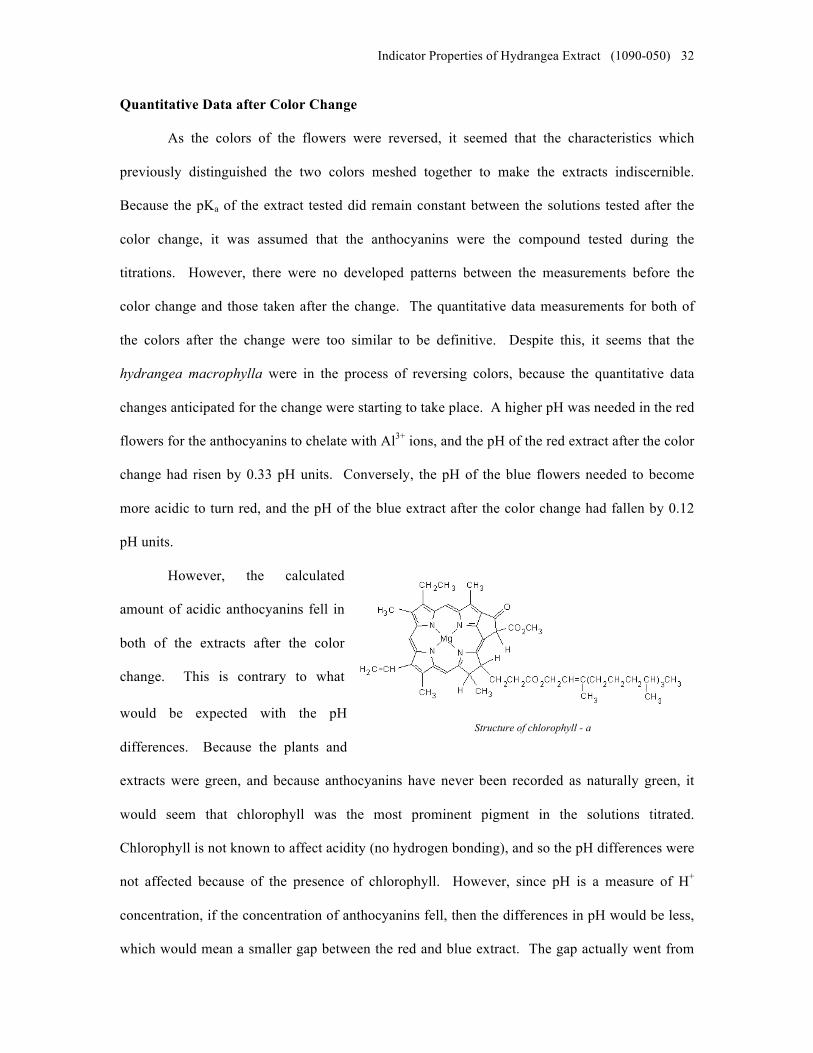
However, the calculated
amount of acidic anthocyanins fell in
both of the extracts after the color
change. This is contrary to what
would be expected with the pH
differences. Because the plants and
extracts were green, and because anthocyanins have never been recorded as naturally green, it
would seem that chlorophyll was the most prominent pigment in the solutions titrated.
Chlorophyll is not known to affect acidity (no hydrogen bonding), and so the pH differences were
not affected because of the presence of chlorophyll. However, since pH is a measure of H+
concentration, if the concentration of anthocyanins fell, then the differences in pH would be less,
which would mean a smaller gap between the red and blue extract. The gap actually went from
Structure of chlorophyll - a

Indicator Properties of Hydrangea Extract (1090-050) 33
0.84 pH units before the color change, to 0.39 pH units after. Additionally, the recorded pKa
values for the extracts after the color changed averaged 0.51 pH units higher than the values
recorded before the color change. A high pKa means that a solution is weakly acidic, and so if the
concentration of the anthocyanins fell, the solution would have had a lesser H+ concentration, and
thus would be less acidic.
Another result of the decreased concentration of anthocyanins was that the endpoints of
the titrations after the color change were reached much sooner. The titrations performed on the
red and blue extracts before the color change reached a pH of 12.00 with an average of 39cm3 of
.01moldm-3 NaOH, while the titrations performed after the color change reached a pH of 12.00
after an average of 13.5cm3 added. Additionally, because the solution was less acidic, the pKa
was higher. The absence of a strong buffer solution suggests that there was also a marginal
decrease in anthocyanin concentration.
Overall, because of the reversal of the sepal colors had not been fully completed when the
titrations were performed, the concentration of anthocyanins was significantly less than the
previous extracts. As a result, the measurements obtained after the attempted color change were
inconclusive to determine any qualitative or quantitative changes the anthocyanins undergo when
the colors of hydrangea macrophylla sepals are reversed. Other sources of error and uncertainty
are discussed below.
Indicator Properties of Hydrangea Extract (1090-050) 34
Limitations and Uncertainties
With any experiment, there are certain inherent errors associated with the data obtained.
Because of the limitations in precision of the equipment used, the values obtained can only be
accurate to a certain degree. Additionally, such factors as differing temperatures and atmospheric
conditions can affect the way similar systems behave.
The graduated cylinders used for preparing the stock solution of NaOH, the ethanol for
the pigment extraction, and measuring the amount of extract before titrations carried an
uncertainty of .05cm3. The balance used to mass the amount of NaOH had an uncertainty of
.002g, and the burette used for the titrations had an uncertainty of .05cm3. Overall, the
uncertainty for the graduated cylinders was 0.1%, the balance 0.2%, and the burette 0.12%. The
functions to which the calculator equated the titration points also carried an error of 4%. By
summing the percent uncertainties, it was determined that the total uncertainty for the
experiments performed was 4.62% from the chemical equipment and the calculator.
Another source of error was the light dependency on the behavior of anthocyanins.
Naturally, in plants, the amount of sunlight can affect the development of the pigment.
Specifically in apples, the side that grows in the sunlight will often be redder than the rest of the
apple. It was not known how this affected the anthocyanins once they were already developed,
but the varying amounts of light they had absorbed before they were titrated could have affected
the behavior of the system. When extracts were removed from the refrigerator, they were almost
always clear. However, when the anthocyanins were allowed to sit under the room lighting, the
pink tint returned, and the extract behaved similarly to the others that were titrated before
refrigeration. Allowing the extract to sit in the open air could have also allowed interference with
O2, N2, or CO2, the latter of which would’ve acidified the solution before the titration.
Additionally, since only two hydrangeas were tested, the scope of the experiment is not
broad enough to determine if all hydrangea macrophylla exhibit similar properties. These plants
were grown pots, and also fed with ‘Miracle Grow,’ a plant supplement containing chemicals

Indicator Properties of Hydrangea Extract (1090-050) 35
normally associated with fertilized soil. There were no nutrients added that the plant would not
otherwise obtain, however with the closed soil pot, it was necessary to replenish the chemicals
used by the plant. Both plants received the same additive, so the alteration was at least consistent.
The NaOH pellets used in preparing the stock solution were also very reactive hydrates,
absorbing water from the atmosphere quickly. Because of this, the amount of NaOH massed on
the balance might have been artificially high if a significant amount of water was absorbed before
an accurate weight could be determined. This would have artificially lowered the calculated
anthocyanin concentration.
The last limitation, and possibly the biggest, is that the concentration of anthocyanins
obtained in the experiments cannot be related to other plants. Since no attempts were made to
purify the anthocyanins from the rest of the organic compounds, the concentration obtained is not
conclusive to identify the amount of pigmentation in hydrangea flowers. Also, since the ethanol
that was not evaporated during the extraction was allowed to remain in the solution, the
concentrations obtained with 50cm3 are not as consistent as they would have been if the ethanol
were removed by another purification of the extract. The sepals during extraction were also
weighed to about 10g per 100cm3 of ethanol, but the flowers were weighed while wet, and it is
also possible that some of the stalks were included in the extraction, and so the mass of sepals
would have been artificially high. Because of the limited extraction methods, the data can only
be used in comparison with similar systems.
Indicator Properties of Hydrangea Extract (1090-050) 36
Conclusion
Overall, the results determined in this experiment answered three of the four research
questions proposed in the introduction. Red extracts were almost one pH unit lower than the
blue. The chemical additive that directly causes the blue color in hydrangea macrophylla was
determined to be Al3+, while the reddening agent was excess H+, which protonated the
anthocyanin to produce a pinkish color. A yellow color was also produced when the
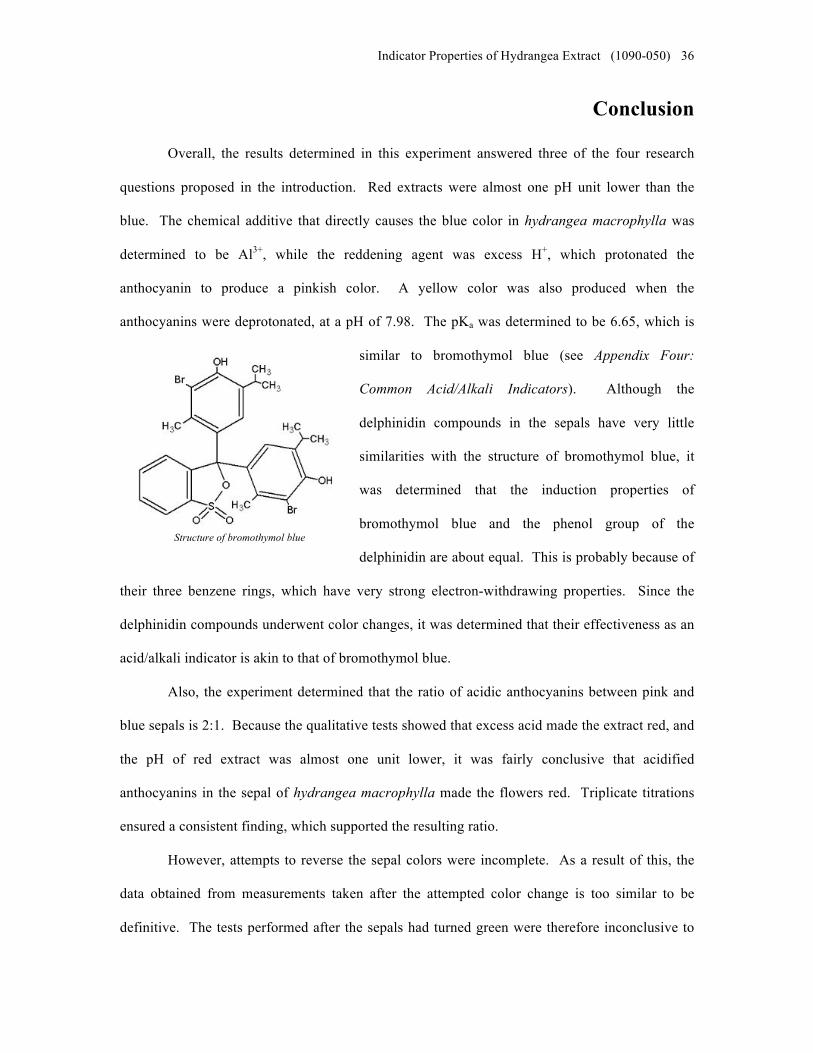
anthocyanins were deprotonated, at a pH of 7.98. The pKa was determined to be 6.65, which is
similar to bromothymol blue (see Appendix Four:
Common Acid/Alkali Indicators). Although the
delphinidin compounds in the sepals have very little
similarities with the structure of bromothymol blue, it
was determined that the induction properties of
bromothymol blue and the phenol group of the
delphinidin are about equal. This is probably because of
their three benzene rings, which have very strong electron-withdrawing properties. Since the
delphinidin compounds underwent color changes, it was determined that their effectiveness as an
acid/alkali indicator is akin to that of bromothymol blue.
Also, the experiment determined that the ratio of acidic anthocyanins between pink and
blue sepals is 2:1. Because the qualitative tests showed that excess acid made the extract red, and
the pH of red extract was almost one unit lower, it was fairly conclusive that acidified
anthocyanins in the sepal of hydrangea macrophylla made the flowers red. Triplicate titrations
ensured a consistent finding, which supported the resulting ratio.
However, attempts to reverse the sepal colors were incomplete. As a result of this, the
data obtained from measurements taken after the attempted color change is too similar to be
definitive. The tests performed after the sepals had turned green were therefore inconclusive to
Structure of bromothymol blue

Indicator Properties of Hydrangea Extract (1090-050) 37
determine what, if any, structural changes the anthocyanins undergo when the flower colors are
reversed.
The values obtained compared to published values ranged from a 5% error to an 18%
error. Both the experimental values for the pH at the equivalence point and the pKa were higher
than the published values, which were attributed to the ethanol interference during the titrations.
Overall, three out of four research questions given in the introduction were adequately answered.

Indicator Properties of Hydrangea Extract (1090-050) 38
Appendices Appendix One: History of Anthocyanins
Anthocyanins have played a prominent role in the enrichment of human lives for
thousands of years. Historians and scientists believe that cave paintings from as far back as
15,000 B.C.E. were colored using various plant pigments, and in Egypt and China, dyed fabrics
have been found and dated back to 2,000 B.C.E. The ancient Britons used a blue plant dye to
color their bodies in an attempt to frighten enemies in battle, and more recently in history, the
famous “red coats,” worn by British soldiers in the American Revolutionary War, were dyed with
a plant called ‘madder root’.
Richard Martin Willstätter was the first scientist to identify anthocyanins as the primary
red/blue pigmentation in some plants and fruits. He received the Nobel Prize in Chemistry in
1915 for his work with chlorophyll in connection to anthocyanins and plant coloring.
Specifically, he isolated the characteristic pigment in
cornflowers, roses, pelargonias, larkspurs, and hollyhock, and
showed that anthocyanidins attached to glucoses produced an
anthocyanin. Willstätter also explained how the same
anthocyanin can have blue or red color properties, and proposed
that in roses the anthocyanin is bonded to a plant acid, which
makes it red. Conversely, he claimed, in cornflower, the
anthocyanin is bonded to a plant alkali, which is why it is
distinctly blue.
The word anthocyanin is derived from two Greek words, anthos, which means ‘flower’,
and kyáneos, which means ‘purple’. Nearly three hundred different anthocyanins have been
discovered, and different fruits and vegetables have their own signature mix of pigments. Red
wine, for example, contains over fifteen different anthocyanin compounds, depending on the
The difference in color pattern suggests an unequal distribution of chemicals in the flower, which is not genetically determined.
Indicator Properties of Hydrangea Extract (1090-050) 39
amount and type of grapes with which it is made. The differing concentrations and types of
compounds are what give wine its different color shades.
Anthocyanins are also thought to play an important role in the high antioxidant levels in
fruits and vegetables. Blueberries, for example, contain a very high concentration of antioxidant
compounds, which guard the cell walls of the berry from harmful free radicals existing inside the
plant. When people ingest blueberries, they obtain the same protection from free radicals, which
can be just as harmful to cell membranes as cell walls. Blueberries, cranberries, and cherries can
contain up to 400mg of antioxidants per 100g of berry, and concord grapes—used in many red
wines—can contain up to 750mg per 100g of grape (Sriram, 2004).
In the twelfth century, bilberry (Vaccinium myrtillus) was used as an herbal medicine to
induce menstruation, and during World War II, British pilots took the same drug before nighttime
missions to enhance their night-vision. Now, researchers know that although anthocyanins
probably cannot increase nighttime awareness, nor encourage menstruation, they can prevent
oxidation damage in both large and small blood vessels because of their anti-oxidant properties.
Anthocyanins are also believed to inhibit degenerative nerve damage, and in laboratory
conditions, delphinidin and cyanidin compounds have been found to inhibit the epidermal growth
factor receptor in cancer cells, which could potentially stunt the growth of tumor cells in humans.
Also under study are anthocyanins’ abilities to reduce LDL (the “bad”) cholesterol, and prevent
blood clotting.

Indicator Properties of Hydrangea Extract (1090-050) 40
Appendix Two: Effect of Soil pH on Hydrangea Salt Absorption
According to the University of Georgia Agricultural Website, the development of the
color of the sepals in hydrangea macrophylla depends on two different factors. The amount of
sunlight the plant receives, and the pH of the soil in which the plant is grown. Hydrangeas of all
colors cannot be left in the sunlight for more than four or five hours a day, because the leaves will
dry up and wilt very quickly and easily. The pH of most garden soils ranges from 4.5 to 7.5, and
most garden soils tend to be acidic, because of the salt compounds, which contain metal ions
acting as Lewis acids. Because of differing conditions in which the plants are grown, variations
do occur, but primarily, the color follows this pH pattern:
pH Flower Color
4.5 deep, vivid blue
5.0 medium blue
5.5 lavender-purple
6.0 purplish-pink
6.5 mauve-pink
6.8 medium pink
7.0 deep, vivid pink
7.5 true red
Generally, red hydrangea macrophylla grow best, and retain their color in a soil with a
pH of 6.6 to 7.5, because at a higher pH, the roots of the pink hydrangea aren’t able to absorb
aluminum compounds, which turn the flowers from pink to blue. Blue hydrangeas prefer soils
below 6.0, because the roots can obtain aluminum compounds from the soil much more easily
than they can at a higher pH. This is due in large part to the higher amount of aluminum—which
lowers pH because of its presence—and also the physiology behind the absorption of chemicals
through the cell walls of the plant root.
Color of hydrangea sepals with respect to soil pH and aluminum availability in the soil

Indicator Properties of Hydrangea Extract (1090-050) 41
Appendix Three: Common Acid/Alkali Indicators
Indicator Name Effective pH Range
Alizarin Red S 4.6 - 6.0
Brilliant Green 0.0 - 2.6
Bromocresol Green 3.8 - 5.4
Bromocresol Purple 5.2 - 6.8
Bromophenol Blue 3.0 - 4.6
Bromothymol Blue 6.0 - 7.6
Chlorophenol Red 4.8 - 6.4
Congo Red 3.0 - 5.0
m-Cresol Purple 1.2 - 2.8
m-Cresol Red 2.0 - 3.0
Eosin Y 0.0 - 3.0
Methyl Orange 3.2 - 4.4
Methyl Orange - Xylene Cyanol 3.2 - 4.2
Methyl Purple 4.8 - 5.4
Methyl Red 4.2 - 6.2
Methyl Violet 0.1 - 3.2
Phenol Red 6.8 - 8.2
Phenolphthalein 8.2 —9.6
Sulfo Orange 11.0 - 12.6
Thymol Blue 8.0 - 9.2
Thymolphthalein 8.8 -10.5
Universal pH Indicator 2.0 - 11.0 All values inherit an error of .1 pH units.
*
* Table adapted from: <http://www.vgdusa.com/indicator_solutions.htm>

Indicator Properties of Hydrangea Extract (1090-050) 42
References
Acid or Alkaline? What pH means in Garden Speak. Marion Owen. 1996. Plantea. 27 November 2006.
<http://www.plantea.com/pH.htm>
Anthocyanins as pH Indicators. Peter Keusch, 2007. 28 March 2007. <http://www.uni-
regensburg.de/Fakultaeten/nat_Fak_IV/Organische_Chemie/Didaktik/Keusch/p26_anth-e.htm>
Chandrasekaran. Chemistry of Colors. 2001. Education Technology Unit. 5 April 2007.
<http://www.ias.ac.in/resonance/Mar2001/pdf/Mar2001p66-75.pdf>
Chemical of the Week: Chlorophyll. 2003. 21 May 2007.
<http://scifun.chem.wisc.edu/chemweek/CHLRPHYL/Chlrphyl.html>
Dragan S. Veselinovi6,' Jelisaveta M. Baranac, Zoran D. ZujoviC, and Dragana S. Djordjevib.
Spectroabsorptiometric Investigations of Complexing Reactions of Polyhydroxylic Flavylium
Compounds. 1992. University of Belgrade. 2 May 2007. <http://pubs.acs.org/cgi-
bin/abstract.cgi/jafcau/1992/40/i12/f-pdf/f_jf00024a003.pdf?sessid=6006l3>
Farber, Eduard. The Evolution of Chemistry: A History of Its Ideas, Methods, and Materials. New York:
Ronald Press, 1952. Questia. 30 November 2006.
<http://www.questia.com/PM.qst?a=o&d=6507111>.
Flower Mart, The. 1998-2007. 22 May 2007.
<http://www.theflowermart.com/cart.asp?whichpage=&mode=price&category=Hydrangeas&ite>
Gardening: Q & A. Sunday Mirror (London, England) 29 Nov. 1998: 68. Questia. 5 December 2006
<http://www.questia.com/PM.qst?a=o&d=5004072788>.
Genome Database. Entry C12138. 13 April 2007. <http://www.genome.jp/dbget-
bin/www_bget?compound+C12138+-s>
Getting Pigments to Hang On. 2003. National Gardening Association. 15 March 2007.
<http://www.kidsgardening.com/growingideas/projects/may03/pg2.html>
Growing Bigleaf Hydrangea. Gary L. Wade. The University of Georgia College of Agricultural &
Environmental Sciences Cooperative Extension Service. 27 November 2006.
<http://pubs.caes.uga.edu/caespubs/horticulture/hydrangea.html>

Indicator Properties of Hydrangea Extract (1090-050) 43
Halevy, Asen. Identification of the Anthocyanins in Petals of Tulip Varieties Smiling Queen and Pride of
Haarlem. United States Department of Agriculture. 8 April 2007.
<http://www.pubmedcentral.nih.gov/articlerender.fcgi?artid=541240>
Harley, John H., and Stephen E. Wiberley. Instrumental Analysis. New York: Wiley, 1954. Questia. 30
November 2006. <http://www.questia.com/PM.qst?a=o&d=14613301>.
How LEDs Work. How Stuff Works Inc. 1998-2007. 21 May 2007.
<http://electronics.howstuffworks.com/led.htm>
Hydrangea Questions and Answers. 2005. The United States National Arboretum. 26 November 2006.
<http://www.usna.usda.gov/Gardens/faqs/hydrangeafaq2.html>
Hydrangea Questions and Answers. 2005. The United States National Arboretum. 26 November 2006.
<http://www.usna.usda.gov/Gardens/faqs/hydrangeafaq2.html>
Hydrangea. 2004. Cambrian Nursery and Florist. 25 November 2006.
<http://www.cambrianursery.com/hydrangea.htm>
Indicator Solutions. Voigt Global Distribution. 28 May 2007.
<http://www.vgdusa.com/indicator_solutions.htm>
Maekawa, Inagaki and Terabun. Effect of Aluminum Ions on the Bluing of Petal Color in Cut Chinese
Bellflower, Platycodon grandiflorum. 1983. Oxford Journals. 9 April 2007.
<http://pcp.oxfordjournals.org/cgi/content/abstract/24/4/759>
Marcheix. Fruit Phenolics. 1990. CRC Press. 9 April 2007.
<http://books.google.com/books?hl=en&lr=&id=vHqke7F4lWYC&oi=fnd&pg=RA1-
PA1&sig=x3gUFTC9gM2z9rhN5ijEvOjA50c&dq=anthocyanin+extraction+techniques#PPP1,M>
Michaelis, Leonor, and William A. Perlzweig. Hydrogen Ion Concentration: Its Significance in the
Biological Sciences and Methods for Its Determinations. Baltimore: Williams & Wilkins
Company, 1926. Questia. 30 November 2006.
<http://www.questia.com/PM.qst?a=o&d=96995426>.
Molecules. Steve GB. 9 February 2007. <www.steve.gb.com/science/molecules.html>

Indicator Properties of Hydrangea Extract (1090-050) 44
Raghavachari. Introduction to Bioanalytical Electronic Spectroscopy. 2006. Indiana University
Department of Chemistry. 6 April 2007.
<http://www.chem.indiana.edu/academics/ugrad/Courses/s117/documents/kr_120106.pdf>
Rajan, Mainer, Davis. Studies on the Chelation of Aluminum for Neurobiological Application. 1981. Pub-
Med. 14 April 2007.
<http://www.ncbi.nlm.nih.gov/entrez/query.fcgi?cmd=Retrieve&db=PubMed&list_uids=7276932
&dopt=Abstract>
Richard Willstätter. 2007. The Nobel Foundation. 8 April 2007.
<http://nobelprize.org/nobel_prizes/chemistry/laureates/1915/willstatter-bio.html>
Separation of Anthocyanins by Thin Layer Chromatography. Robert Curtright, Randy Emry and John
Markwell. 1996. Biochemistry 321. 27 March 2007. <http://www-
class.unl.edu/biochem/labs/student/exp10.htm>
Sriram, Surendranath, Sureshkumar. Kinetics of Anthocyanin Extraction from Fresh and Dried Grape
Waste. 2004. Taylor and Francis. 4 February 2007.
<http://taylorandfrancis.metapress.com/content/buexy4v72c0e3kcp/>
Stains and Indicators. 2006. Niles Biological, Inc. 4 May 2007.
<http://www.nilesbio.com/subcat277.html>
Steyermark, Julian A. Spring Flora of Missouri. St. Louis, MO: Missouri Botanical Garden, 1940. Questia.
30 November 2006. <http://www.questia.com/PM.qst?a=o&d=6839998>.
Takeda. Blue Metal Complex Pigments Involved in Blue Flower Color. 2006. Tokyo Gakugei University.
7 April 2007. <http://www.jstage.jst.go.jp/article/pjab/82/4/82_142/_article>
Tsutomu Yabuya. High-performance liquid chromatographic analysis of anthocyanins in Japanese garden
iris and its wild forms. 1990. Euphytica. 9 April 2007.
<http://www.springerlink.com/content/t462210238764g08/>
Universal Indicator. D. Spurlock. 1999-2006. 27 May 2007.
<ttp://wps.prenhall.com/wps/media/objects/602/616516/Media_Assets/Chapter15/Text_Images/F
G15_05.JPG>

Indicator Properties of Hydrangea Extract (1090-050) 45
Van Nostrand's Scientific Encyclopedia. 3rd ed. Princeton, NJ: D. Van Nostrand, 1958. Questia. 30
November 2006. <http://www.questia.com/PM.qst?a=o&d=97547639>.
What are some Natural Acid/Base Indicators?. Fred Senese. 2005. Chemistry FAQ. 3 March 2007.
<http://antoine.frostburg.edu/chem/senese/101/acidbase/faq/natural-indicators.shtml>
Yoshida, Toyama-Kato, Kameda, Kondo. Sepal Color Variation of Hydrangea macrophylla and Vacuolar
pH Measured with a Proton-Selective Microelectrode. 2006. Oxford Journals. 27 November
2006. <http://pcp.oxfordjournals.org/cgi/content/abstract/44/3/262>