Embed Size (px)
Citation preview

Determining the Fatigue Life of Dental Implants∗
Horea T. Ilies†
Dennis Flanagan DDS‡
Paul T. McCullough and Scott McQuoid§
Abstract
Dental implants are used to retain and support fixed and removable dental prostheses. Inmany clinical situations, local bone morphology requires dental implants that have a diameterthat is significantly smaller than the typical implant diameters. In these cases, the fatigue life ofthe smaller diameter implants becomes a critical therapeutic parameter. However, this fatiguelife depends on the implant itself, on the physical properties of the bone, as well as on othermorphological characteristics that are patient dependent. In other words, this fatigue life variesgreatly with each newly placed implant, but the capability to predict the fatigue life of dentalimplants does not exist today.
In this paper we present the first steps towards establishing such a methodology. We developa finite element based fatigue model for rigidly mounted dental implants, and correlate its resultswith both analytical predictions as well as physical measurements. This implies that such amodel can be used as a valid predictor of fatigue life of dental implants themselves, and can beused as a valuable implant design tool. Furthermore, we present the design of a cost effective
device to measure the fatigue life of dental implants that can be either rigidly or bone mounted(in vitro). This device was used to measure the fatigue life of an initial sample of nine dentalimplants, and we show that the results predicted by the finite element model correlated wellwith our initial experimental results.
1 Introduction
In the past 25 years dental implants emerged as a popular and feasible treatment option for pa-tients needing removable prostheses and have revolutionized the dental treatment of edentulouspatients [1, 2, 3, 4, 5]. The success of an implant placement depends on a variety of factors thatare specific to either the implant itself (e.g., design, material, and manufacturing process), thepatient, or the actual procedure used to place the implant. In a typical case, standard sized im-plants whose diameters range between 3.75-4.1mm are placed in the bone, which is followed by theosseointegration of the implant (the so called “healing period”), and by the attachment of the finalprosthesis to the newly placed implant(s). Though, in many clinical situations, the bone volumemay be insufficient to support a standard sized implant, and this lack of bone volume usually ap-pears in the form of a narrow atrophic edentulous ridge of the bone. In these cases, a smaller sized
∗This is a preprint of the paper that appeared in Journal of Medical Devices, Vol. 2, No 1, March 2008.†Department of Mechanical Engineering, University of Connecticut, Storrs, CT 06269-3139.‡Windham Dental Group, 1671 West Main St. Willimantic, Conn. 06226§Department of Mechanical Engineering, University of Connecticut, Storrs, CT 06269-3139.
1

diameter implant, as that illustrated in Figure 1, may intuitively be used. Indeed, some clinicianshave reported successful treatment with 2.0mm diameter implants supporting fixed prostheses inatrophic or compromised osseous sites. However, the decrease in the implant diameter may haveserious implications on the functionality of the implant due to the higher stresses and lower fatiguelife developed by mastication. Proprietary data of implant manufacturers suggests that there maybe sufficient fatigue life of these smaller implants so that they can be used to support fixed dentalprostheses, at least under the tested loading conditions (cyclic bidirectional forces of relatively lowvalue, with the abutment attached, and the dental implant mounted in an acrylic resin). However,their tests cannot be used to estimate the fatigue life of these implants for other loading conditionsor designs, since it is obvious that the fatigue life of a bone mounted dental implant will vary withboth the magnitude and orientation of the applied force. Furthermore, it appears that there hasbeen no extramural cyclic load testing of these implants.
Figure 1: A 2.0mm Intra-Lock MDL (Mini-Drive Lock, Ultimatics) dental implant.
Without a doubt, the knowledge of the expected functional life of an implant is a criticaltherapeutic parameter for prosthetic longevity. Such a knowledge requires fatigue tests in order tomeasure the fatigue life of the implant. However, these tests are not only time consuming, but alsorelatively expensive to be performed frequently. One alternative is to develop computer modelswhose predictions correlate well with the test results, and replace physical testing with computerbased fatigue life prediction.
The fatigue life of an implant depends on both the implant itself, on the physical properties of thebone as well as on other morphological characteristics that are patient dependent, which explainswhy this fatigue life varies greatly with each newly placed implant. However, the capability topredict the fatigue life of a newly placed implant is currently nonexistent. In this study we takethe first steps towards developing such a capability by developing a cost effective device that allowsa range of loading conditions, and can accurately measure the fatigue life of a dental implantthat can be either rigidly or bone mounted (in vitro). Our device was used to test an initialsample of nine dental implants having a 2.0mm diameter subjected to a unidirectional cyclic loadat 200N, but the same device can be used to test implants of other diameters, either rigidly or bonemounted, and under different loading conditions. Furthermore, we also describe a finite elementbased model for rigidly mounted implants whose fatigue life predictions correlate well with ourinitial measurements. Consequently, such a computer model can be used to predict the fatigue lifeof other implants without requiring additional physical testing. At the same time, such a modelcan be used in the design of dental implants for improved fatigue life.
2

2 Design of the Measurement Device
Our device was designed to apply a cyclic unidirectional force in the range of 200 to 300 N to theimplant, which is the average lateral force in the anterior section of the human jaws, at a rate of 1-6cycles per second. However, these ranges can be easily modified with simple design changes. Thecyclic applied force was selected based on the real loading conditions during mastication, and wasapplied in the lateral direction since this is the component of the masticatory force that contributesto fatigue failure. A load cell connected to a commercial data acquisition software [6] was used torecord the force data and the cycle data.
The key design objectives were to obtain a design that is as cost efficient as possible, bothin terms of manufacturing as well as operation, that can perform the fatigue testing accurately,and automatically without compromise in safety. Many different design configurations have beenconsidered for the testing machine. In the end, the best compromise between accuracy, cost, andcomplexity proved to be the motor and crank assembly configuration, which is shown both as asolid model and as a final manufactured device in Figure 2. In this configuration, an inductionmotor and speed reducer were used to rotate a crank, which is attached to an arm. This arm movesa slider attached to a guide rail. The rotary motion of the crank is transformed into linear motionthrough the slide and guide rail.
The motion of the slider is transferred to the implant through a compression spring. The springis contracted and expanded as the slider moves in and out, cyclically loading the implant. Thespring is located in the guide cylinder, and is in contact with the force transducer that also contactsthe plunger. The plunger applies the external load to the implant. The spring prevents the impactloading of the implant, which would distort the measured data. Both the guide rail and guidecylinder are fixed in place. The crank consists of a circular disk welded to a shaft. An adjustableslot in the crank provides the means to adjust the compression of the spring, and therefore of theforce applied on the implant. As the attachment of the link arm moves away from the center ofthe motor shaft, the output force increases and the total displacement increases. This adjustmentallows flexibility in the later calibration and measurements. The slider serves as the mechanism totransform the rotary motion of the motor into the desired linear motion. A linear ball bearing isused to connect the slider to the guide rail. Because the implant is threaded with a self-tappingthread, no hole could be threaded to secure the implant throughout the testing. Thus, a clamp wascustom made to hold the implant securely, and the clamp was attached to a custom designed base.This clamp was positioned on a compound slide table that allowed the adjustment of the implantposition in the plane of the force.
A load cell, capable of measuring up to 500 lbs, was used to record the applied forces of theforce, and calibrated to accurately record the magnitude of the force. The forces measured by theload cell, connected to LabView through an SCXI chassis. Once the implant fails, a series of relayswould shut the motor off and LabVIEW would save the data. The spring, load cell and plunger areshown in Figure 2(b). The spring used for these tests had a spring constant of 35 lb/in. The totaldisplacement necessary to obtain the 200 N force is approximately 1.25 inches. The outer diameterof the spring in .710 inches and the overall length is 5.5 inches. The load cell had an outer diameterof .75 inches and a load capacity of 500 lbs. To protect the load cell wires from rubbing againstthe cylinder and fraying, a load cell holder was manufactured to hole the load cell during testing.
The motor rotates the crank, which forces the link arm to linearly translate on the guide rail,and forces the push rod against the spring. The spring applies the cyclic loading on the load celland the implant (Figure 3). The load cell feeds information to the data acquisition system (DAQ),
3

Figure 2: CAD model of the measurement device (a); detail of the force applicator (b); and imageof the manufactured device (c).
which sends the information to the central processing unit (CPU). Once the load cell reads a voltagethat corresponds to a low force (i.e., after the implant failure), the CPU sends a signal to the switchto turn off the motor.
A block diagram of the final design and the wiring diagram for the electrical setup on the machineare shown in Figure 4. The induction motor used to rotate the crank was wired in a circuit thatincludes a switch, a variable transformer, a fuse, and two relays. The variable transformer allowedthe control of the rotational speed of the motor. A 20 amp fuse was incorporated into the circuitfor safety reasons. The two relays are used to control the stopping of the motor through LabVIEW.When the testing begins, LabVIEW sends a direct current (DC) voltage to the DC relay, closingthe circuit. This allows for the alternating current (AC) relay, with 12 VDC operating voltage, toclose. The AC voltage is now allowed to flow through the AC relay, starting the motor. As thetesting continues, the DC relay is closed as long as the range of the force from the load cell is abovea preset value. Once the load cell reads a range lower than this value, the DC voltage supply willdiscontinue and the DC relay will close the circuit to the AC relay, shutting off the motor. A lowforce corresponds to an implant failure, so the measurements and data acquisition are terminated.
4
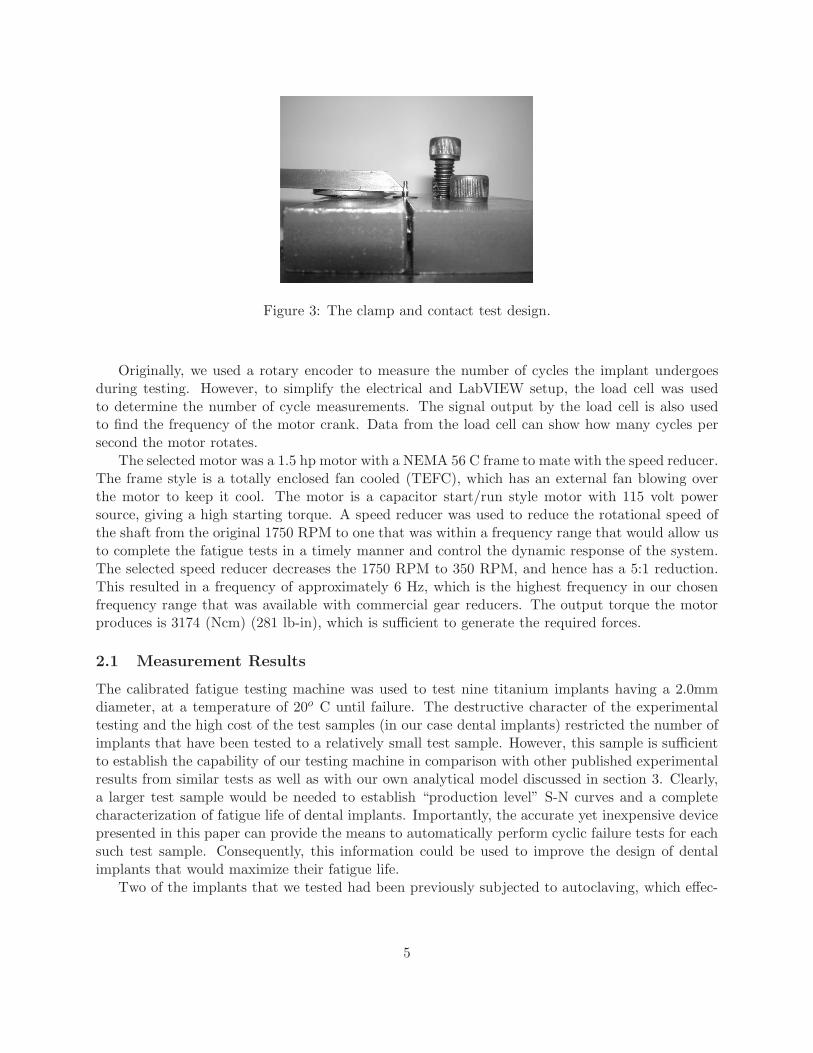
Figure 3: The clamp and contact test design.
Originally, we used a rotary encoder to measure the number of cycles the implant undergoesduring testing. However, to simplify the electrical and LabVIEW setup, the load cell was usedto determine the number of cycle measurements. The signal output by the load cell is also usedto find the frequency of the motor crank. Data from the load cell can show how many cycles persecond the motor rotates.
The selected motor was a 1.5 hp motor with a NEMA 56 C frame to mate with the speed reducer.The frame style is a totally enclosed fan cooled (TEFC), which has an external fan blowing overthe motor to keep it cool. The motor is a capacitor start/run style motor with 115 volt powersource, giving a high starting torque. A speed reducer was used to reduce the rotational speed ofthe shaft from the original 1750 RPM to one that was within a frequency range that would allow usto complete the fatigue tests in a timely manner and control the dynamic response of the system.The selected speed reducer decreases the 1750 RPM to 350 RPM, and hence has a 5:1 reduction.This resulted in a frequency of approximately 6 Hz, which is the highest frequency in our chosenfrequency range that was available with commercial gear reducers. The output torque the motorproduces is 3174 (Ncm) (281 lb-in), which is sufficient to generate the required forces.
2.1 Measurement Results
The calibrated fatigue testing machine was used to test nine titanium implants having a 2.0mmdiameter, at a temperature of 20o C until failure. The destructive character of the experimentaltesting and the high cost of the test samples (in our case dental implants) restricted the number ofimplants that have been tested to a relatively small test sample. However, this sample is sufficientto establish the capability of our testing machine in comparison with other published experimentalresults from similar tests as well as with our own analytical model discussed in section 3. Clearly,a larger test sample would be needed to establish “production level” S-N curves and a completecharacterization of fatigue life of dental implants. Importantly, the accurate yet inexpensive devicepresented in this paper can provide the means to automatically perform cyclic failure tests for eachsuch test sample. Consequently, this information could be used to improve the design of dentalimplants that would maximize their fatigue life.
Two of the implants that we tested had been previously subjected to autoclaving, which effec-
5

tively changed the metallic structure and the mechanical properties of the implants1. One suchexample is shown in Figure 5(a) where one can observe the purplish color of the implant. The loadaverage remained constant until the implant failed catastrophically, when the load range decreasessignificantly. It is at this point that the computer outputs a signal to the relay network to shut offthe motor. The number of cycles until failure measured by our device is shown in Figure 6.
As evident from the data, the implants failed at a wide variety of cycles. Even though all im-plants were subjected to identical loading conditions before failure, and even though all the failuresoccurred at the junction of the implant collar and screw threads as predicted by the computersimulation discussed in Section 3, the autoclaved implants failed much sooner than the originalimplants that had not been subjected to the thermal gradient. This indicates that the standardautoclaving process that is being used routinely in dental practices can significantly decrease thefatigue life of dental implants which should be an important consideration for practicing dentists.
All implants failed at the junction of the implant collar and beginning of the threads where thepractically rigid collet was holding the implant, which allowed us to measure the fatigue life of theimplant itself. The fatigue testing performed by the manufacturer of the implants that we tested(IntraLock) show a higher number of cycles to failure that what we measured, but their testingconditions were different than ours. First, their implant specimens were retained in an acrylic basethat may have allowed some movement of the implant as well as dissipation of some of the appliedenergy into the acrylic base. Second, their testing setup applied a bidirectional cyclic force on theimplant. Third the abutment was attached to the implant with a special paste that is used inclinical situations, but the abutment and the paste may have also dissipated some of the energygenerated by the applied forces.
A microscopic view of the failed region of the implant is shown in Figure 6(b). The entiresurface of the failed cross section is typically referred to as a rapid fracture area. In fatigue testing,the fractured surface may exhibit a pattern of rings or undulations called beach marks whichindicate an advancement of a failing crack front. However, the implants tested did not exhibit thisphenomenon, indicating a catastrophic, rapid failure due to the cyclic stress.
3 Finite Element Model for Fatigue Life Prediction of Dental Im-
plants
As already mentioned above, a computer model that correlates to the physical tests can predict thefatigue life of implants, possibly having different geometry, without requiring additional physicaltesting. Therefore these predictions can be obtained not only much faster than the physical tests,but, more importantly, without requiring their additional cost.
The implant is experiencing stresses far below its yield stress within the assumed load ranges,and therefore we assume that all deformations are elastic, and that the fatigue failure is estimatedusing the stress based approach, as discussed below. These approaches are based on stress ampli-tude compared to number of cycles (S-N) curves that have been established experimentally for agiven material. To describe these curves analytically, a number of (material) parameters must beintroduced, which are defined as:
1The dependence of the metallic structure on the temperature gradients to which metals are subjected, eitherintentionally or accidentally, is a well understood and studied problem in material science such as [12].
6

σ0 = Yield Stressσu = Ultimate strengthσ′f = Stress Coefficient
b = Stress Exponentε′f = Strain Coefficient
c = Strain exponentE = Modulus of Elasticity
The transition fatigue life (TFL) value expresses the number of cycles until failure that separatesstrain dominated failure from stress dominated failure, and we denote it with the usual Nt. Straindominated failure is also known as low cycle fatigue, while the stress dominated failure is knownas high cycle fatigue [7]. To determine whether the failure of the implant falls into the strain orstress dominated failure we evaluated the transition fatigue life using material properties of commontitanium alloys:
Nt =1
2
(
σ′f
ε′fE
)1
c−b
(1)
Equation (1) outputs TFL values ranging from 350.9 to 384.6 cycles for the available materialproperties. Since our implants are expected to last a number of cycles that is orders of magnitudelarger than the range resulting from equation (1), the implants can be considered to experiencehigh cycle fatigue, which requires a stress based fatigue analysis approach.
There are several stress based approaches proposed in the literature, and all these approachesuse the effective stress amplitude and effective mean stress given by [7]:
σa =1√
2[(σxa − σya)
2 + (σya − σza)2
+ (σza − σxa)2
+ 6(τ2
xya + τ2
yza + τ2
xza)]1
2
σm = σxm + σym + σzm
(2)
These quantities are combined into an equivalent, completely reversed, uniaxial stress. Severalmethods have been developed for this value including the Goodman, Morrow, Gerber, and SWT(Smith-Watson-Topper) [7]:
7
Goodman :σa
σar
+σm
σu
= 1 or
σar =σa
1 −σm
σu
Morrow :σa
σar
+σm
σ′f
= 1 or
σar =σa
1 −σm
σ′f
Gerber :σa
σar
+
(
σm
σu
)
2
= 1 or
σar =σa
1 −
(
σm
σu
)2
SWT : σar =√
σmaxσa
(3)
This step is necessary since material properties obtained experimentally have a mean stress ofzero, which is not the case in our model. Finally the expected implant life can be estimated usingthe following correlations for an S-N curve.
Nt =1
2
(
σar
σ′f
)1
b
(4)
Each equation in (3) will result in different estimates of σar, and hence in different S-N curvesthat will provide multiple estimates of fatigue life. Here we used the experimental data that wecollected during our physical measurements to study the fatigue life estimated by each of the fourmethods outlined by equations (3).
3.1 Finite Element Modeling
In order to run a finite element analysis to obtain the parameters needed to estimate the fatiguelife, we constructed a solid model of the implant. Since the implant dimensions specified by themanufacturer were not available, we followed a simple three step process to create the solid modelby reconstructing the geometry of the original implant. First we obtained a digitized image of theimplant, which was then converted into a binary image in Matlab. Boundary points of the implantwere extracted from the binary image and were used to construct the solid model of the implant.These dimensions were then used to create a faithful solid model of the implant in a commercialsolid modeler.
Mesh convergence studies were run to determine the optimal mesh size. However, creating auniform mesh of the implant geometry with this optimal mesh size resulted in a very large model,which significantly increased the analysis time. Consequently, we used an adaptive mesh size thatwas optimal around the areas of interest where the implant collar meets the threads (Figure 7(b)),and larger everywhere else (with an average size of 0.08mm). The maximum Von Mises stress wascomputed for each element (Figure 7(c)) in ABAQUS.
8
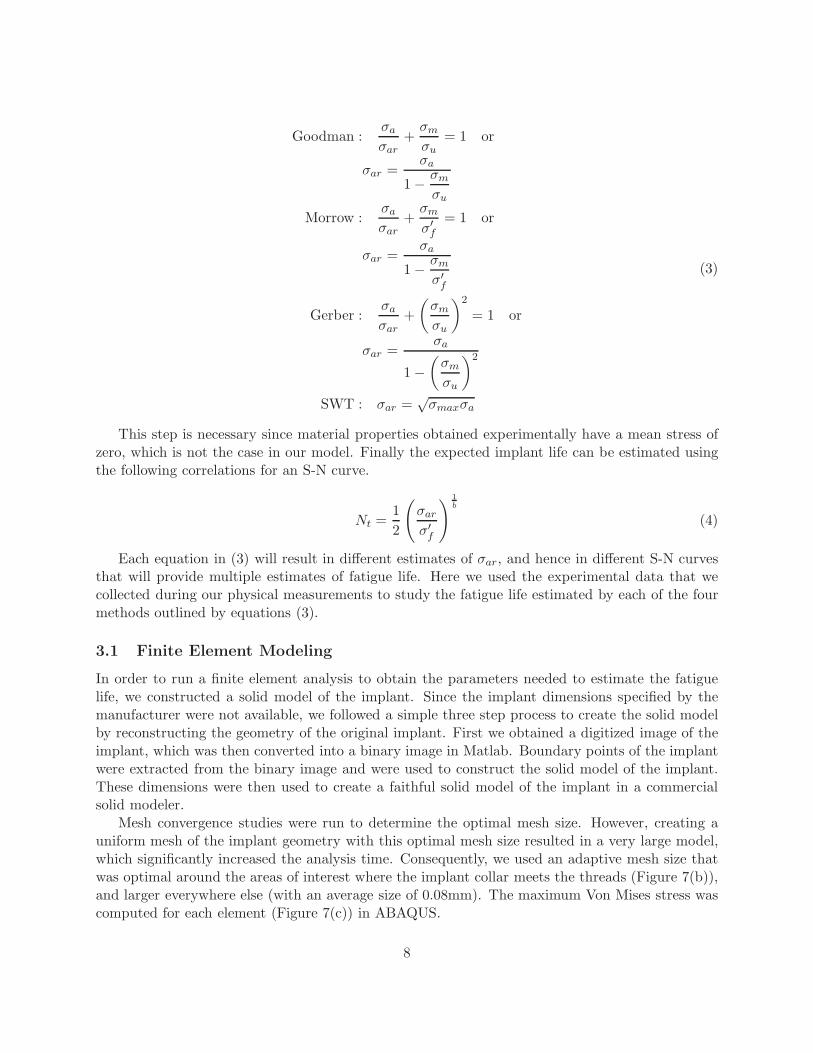
The boundary conditions used in our simulation mimicked the testing conditions described insection 2, and a load of 200N was applied normal to the planar surface of the implant shown inFigure 7(a). The maximum Von Mises stress (Figure 8(a)) occurred at the junction of the implantcollar and the start of the threads of the implant, with a value of 705 MPa. The location of thismaximal stress agrees with the recent FEA results [8]. The FEA analysis results were used toproduce S-N curves using the four different methods described above. The maximum Von Misesstress, shown with solid horizontal line in Figure 8(b), was then used in conjunction with the S-Ncurves to produce an estimate for fatigue life.
A logarithmic plot of the S-N curve is shown in Figure 8(b). This graph shows that the Goodmanand SWT methods give the most conservative estimates of fatigue life. The Gerber correlation is theleast conservative, and therefore was omitted. At 705 MPa the Goodman method predicts failureat 401,000 cycles, the Morrow method predicts failure at 1,634,000 cycles, while the prediction ofthe Gerber method is around 5 million cycles, and the SWT’s prediction is 365,000 cycles.
As with the data obtained, the four different methods produce results that differ greatly. TheMorrow method accurately predicted the failure for the implants that failed after 1 million cycles,but the Goodman and SWT method are more accurate for the implants that did not last 1 millioncycles. A conservative estimate may be obtained by using the Goodman method, which closelyapproximates the average number of cycles to failure found for the nine implants of 533,000 cycles.For a more aggressive approach, the Morrow method may be most appropriate. Clearly, opting forone of these approaches will require a statistically significant sample of
4 Conclusions
One study has shown that full-dentition adults can apply a maximum force on their teeth rangingfrom 244 – 1243 Newtons with an average of 720 N [9]. This force vector applied to the tooth is inboth the axial direction and the lateral direction. The lateral, off-axial, forces applied in a cyclicfashion from masticatory patterns and parafunction may fatigue the implant, causing it to fracture.Studies have also shown that a young adult male applies a level 3 force (a force that is 3/4 themagnitude of the subjects maximum biting force) at an average of 325 times in a 24 hour period.These numbers for an adult female were found to be 439 times during meal times and 453 timesa day [10]. Adult males apply greater maximum biting forces than women, meaning an implantshould have a better chance of failing in a male patient [11]. With knowledge of the magnitude ofthe applied forces and the numbers of chewing cycles a human applies each day, the fatigue testmay allow a prediction for the life of an implant or the number of years until failure.
The fatigue failure occurs due to propagating microscopic cracks in the material that appeardue to a variety of factors, such as material imperfections, internal stresses, or externally appliedloads. The initial cracks tend to propagate under the effect of external loading, and particularlywhen the loading is cyclic. The rate at which these cracks propagate has a direct influence on thefatigue life of the material: the faster the crack propagates, the sooner the part will fail. Unlikestatic loading failure, where small scratches or tool marks have little effects, cyclic loading failureis influenced greatly by these small imperfections.
In this paper we presented the design of a simple and cost effective test stand for measuringfatigue of small parts such as dental implants subjected to unidirectional cyclic loading. Clearly,small design changes can be made to accommodate other types of loading (such as bi-directional)and with magnitudes outside of the ranges that were used in this design. Our device can apply
9

a cyclic load from 0-300 N at a rate of 1-6 Hz, and can be used for measuring the fatigue life ofa variety of dental implants. The motor and crank assembly configuration provided the flexibilityand simplicity while maintaining the associated costs under control. Furthermore, a finite elementanalysis (FEA) analysis was performed on a faithful geometric model of the implant in order tonumerically predict the fatigue life. The Goodman method of S-N curves closely approximated theaverage life expectancy of our experimental data.
The destructive character of the experimental testing and the high cost of the test samples (inour case dental implants) restricted the number of implants that have been tested to a relativelysmall test sample. However, this sample is sufficient to establish the capability of our testing devicein comparison with other published experimental results from similar tests as well as with our ownanalytical model discussed in this paper. The nine failed implants show the typical range of fatiguelife values that can be obtained even for implants having identical nominal geometry. We foundthe fatigue life of the tested implants varied significantly, as expected, and the maximum fatiguelife exceeded 1.6 million cycles, while the minimum fatigue life (of possibly heat damaged implants)just passed 10,000 cycles. Based on our observations, the thermal damage of two of the implantsgenerated by the autoclaving process, and the fact that the same implants have previously beenbone implanted and removed account for most the low fatigue life of these two tested implants.Broadly speaking, there are a number of other factors that can contribute to such a variation,including material defects and internal stresses induced by the implant manufacturing process.Our study implies that more implants should be tested to provide a statistically significant sample,and that additional testing and simulation of implants secured in natural or artificial bone as wellas rigid mounting should be considered.
The predictions of our finite element-based model correlated well to our initial experimental re-sults that we obtained for the implants that had not been heat-damaged, and consistently predictedthe location of the failure for the implants. This suggests that the finite element models can beused as reasonable predictors of the actual fatigue life of the dental implants, i.e., predictions thatdo not account for the effect of the environment in which the implant is placed. At the same time,the finite element model can enhance our understanding of how different design variables of theseimplants influence their fatigue life, for example by performing a sensitivity analysis for the designvariables. But more importantly, our work provides the platform that can be used for additionaltesting of implants mounted not only rigidly, but also directly in bone, and under various loadingconditions. Such tests are needed to extend the finite element model to include the behavior ofthe bone itself and its influence on the fatigue life of dental implants. Note that if the bone istaken into consideration, the horizontal component of the force will still be the only one inducingfatigue failures in the implant, but the vertical component will induce additional failure modes,particularly in the bone.
References
[1] Flanagan, D., 2006. “Implant-supported fixed prosthetic treatment using very small-diameterimplants: a case report.”. J Oral Implantol, 32(1), pp. 34–37.
[2] Kanie, T., Nagata, M., and Ban, S., 2004. “Comparison of the mechanical properties of 2prosthetic mini-implants.”. Implant Dent, 13(3), Sep, pp. 251–256.
10
[3] Fritz, U., Diedrich, P., Kinzinger, G., and Al-Said, M., 2003. “The anchorage quality of mini-implants towards translatory and extrusive forces.”. J Orofac Orthop, 64(4), Jul, pp. 293–304.
[4] Mazor, Z., Steigmann, M., Leshem, R., and Peleg, M., 2004. “Mini-implants to reconstructmissing teeth in severe ridge deficiency and small interdental space: a 5-year case series.”.Implant Dent, 13(4), Dec, pp. 336–341.
[5] Kim, Y., Oh, T.-J., Misch, C. E., and Wang, H.-L., 2005. “Occlusal considerations in implanttherapy: clinical guidelines with biomechanical rationale.”. Clin Oral Implants Res, 16(1),Feb, pp. 26–35.
[6] Instruments, N., 2006. Labview. Austin TX.
[7] Figliola, R., and Beasley, D., 2004. Theory and Design for Mechanical Measurements. JohnWiley & Sons, Inc., New York, NY.
[8] Kayabasi, O., Yuzbasioglu, E., and Erzincanli, F., 2006. “Static, dynamic and fatigue behaviorsof dental implant using finite element method”. Advances in Engineering Software, 37(10),Oct., pp. 649–658.
[9] Gibbs, C. H., Anusavice, K. J., Young, H. M., Jones, J. S., and Esquivel-Upshaw, J. F., 2002.“Maximum clenching force of patients with moderate loss of posterior tooth support: a pilotstudy.”. J Prosthet Dent, 88(5), Nov, pp. 498–502.
[10] Miyamoto, K., Ishizuka, Y., Ueda, H. M., Saifuddin, M., Shikata, N., and Tanne, K., 1999.“Masseter muscle activity during the whole day in children and young adults.”. J Oral Rehabil,
26(11), Nov, pp. 858–864.
[11] Miyaura, K., Matsuka, Y., Morita, M., Yamashita, A., and Watanabe, T., 1999. “Comparisonof biting forces in different age and sex groups: a study of biting efficiency with mobile andnon-mobile teeth.”. J Oral Rehabil, 26(3), Mar, pp. 223–227.
[12] Callister, W., 2006. Materials Science and Engineering: An Introduction, 7th ed. Wiley &Sons.
11

Figure 4: The block diagram of the final design and the corresponding wiring diagram.
12

Figure 5: Failed implants (a) and a microscopic view of the failure surface (b).
Implant # Cycles
1 240,264
2 1,855,000
3 11,250
4 16,000
5 1,389,462
6 127,920
7 954,438
8 83,574
9 121,650
Figure 6: Measured cycles to failure.
13
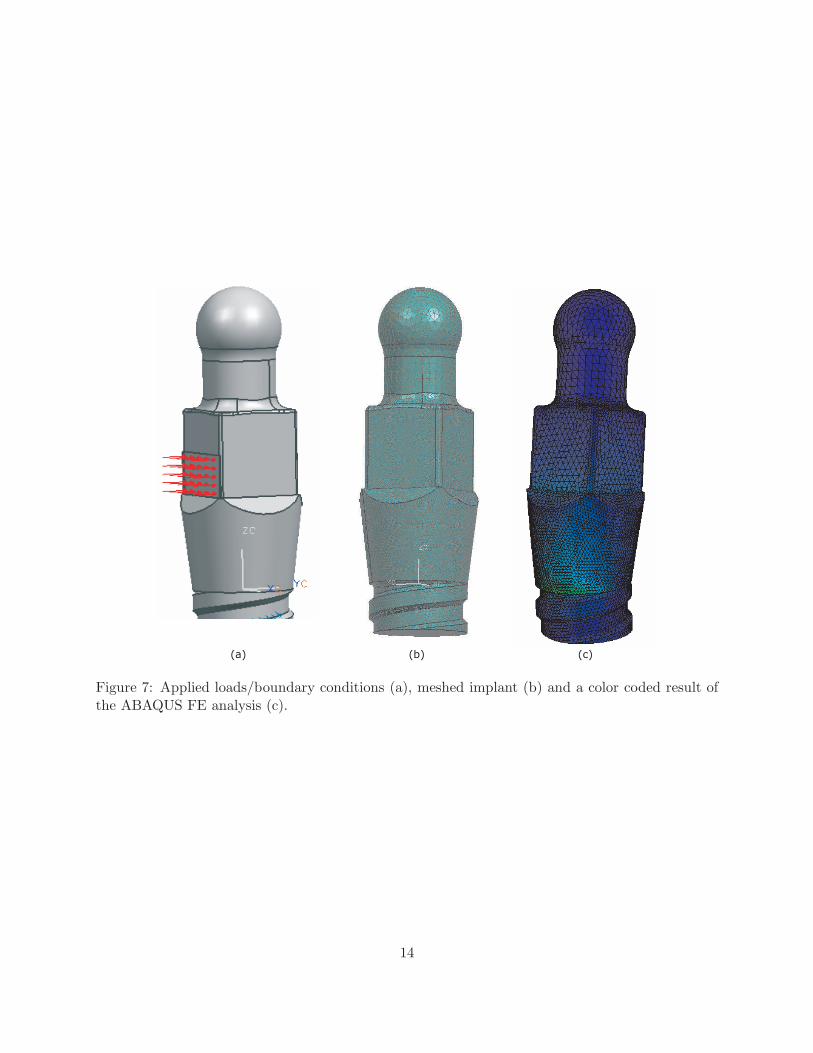
Figure 7: Applied loads/boundary conditions (a), meshed implant (b) and a color coded result ofthe ABAQUS FE analysis (c).
14

Figure 8: Detail of the area where the largest Von Mises stresses occur (a); and the correspondinglogarithmic S-N curves (b).
15