Embed Size (px)
Citation preview
DETERring Deforestation in the Amazon:
Environmental Monitoring and Law Enforcement 1
Juliano Assunçãoa,b,c, Clarissa Gandoura,b, Romero Rochad
aClimate Policy Initiative (CPI)bNúcleo de Avaliação de Políticas Climáticas da PUC-Rio (NAPC/PUC-Rio)
cDepartment of Economics, PUC-RiodInstitute of Economics, Federal University of Rio de Janeiro (UFRJ)
Abstract
We study Brazil's recent use of satellite technology to overcome law enforcement
shortcomings resulting from weak institutional environments. DETER is a system
that processes satellite imagery and issues near-real-time deforestation alerts to
target environmental enforcement in the Amazon. We propose a novel
instrumental variable approach for estimating enforcement's impact on
deforestation. Clouds limiting DETER's capacity to detect clearings serve as a
source of exogenous variation for the presence of environmental authorities.
Findings indicate that monitoring and enforcement e�ectively curbed
deforestation. Results are not driven by the displacement of illegal activity into
neighboring areas, and hold across several robustness checks.
Keywords: deforestation, conservation, monitoring and law enforcement, crime
JEL codes: K42, Q18, Q23, Q58
This version: November, 2019
1We thank the Brazilian Ministry of the Environment, particularly Francisco Oliveira, and the BrazilianNational Institute for Space Research, particularly Dalton Valeriano and Luis Maurano, for their continuoussupport. We are also grateful for helpful comments from Andrew Hobbs, Angela Falconer, Antônio Bento, ArthurBragança, Benjamin Olken, Cristina Leme Lopes, David Nelson, Dimitri Szerman, Elysha Rom-Povolo, JaneWilkinson, Joana Chiavari, Klênio Barbosa, Pedro Hemsley, and Ruben Lubowski, as well as from participantsat the 2013 EEA Conference, 2013 PUC-Rio Economics Seminar, 2013 North American Summer Meeting ofthe Econometric Society, 2013 AERE Summer Conference, 2013 EPGE/FGV Economics Seminar, 2013 LACEAConference, 2013 NEUDC Conference, 2013 SBE Annual Meeting, 2013 Economics of Low-Carbon Marketsworkshop, and 2015 World Congress of the Econometric Society. Fábio Magrani, Juliana Portella, Karla Gregório,Ana Carolina Ribeiro, Diego Menezes, and João Pedro Vieira provided excellent research assistance. All remainingerrors are our own. Support for this research came, in part, from the Brazilian National Council for Scienti�c andTechnological Development (CNPq), as well as from the Children's Investment Fund Foundation (CIFF), institutoClima e Sociedade (iCS), and Norway's International Climate and Forest Initiative (NICFI) through grants toClimate Policy Initiative's Land Use Initiative (INPUT).
Email addresses: [email protected] (Juliano Assunção), [email protected] (Clarissa Gandour),[email protected] (Romero Rocha).
1. Introduction
Greenhouse gas (GHG) emissions, the key driver of anthropogenic climate
change, imply global externalities (Stern, 2008; Nordhaus, 2019). Although most
of the growth in emissions over the coming decades is expected to originate in
developing countries, its impact will be felt worldwide (Wolfram et al., 2012;
Greenstone and Jack, 2015). As the threat of climate change looms nearer, the
world's well-being increasingly depends on developing countries' capacity to
successfully enact and enforce environmental policies to reduce emissions
(Greenstone and Hanna, 2014; Greenstone and Jack, 2015). Yet, weak institutions,
which have long been barriers to policy implementation in developing countries,
often limit e�ective enforcement (Banerjee et al., 2008; Du�o et al., 2013; Ashraf
et al., 2016). With the bulk of research on climate change and associated policy
focused on developed economies, little is actually known about the e�ects and
workings of environmental policy enforcement where it currently matters most
(Burke et al., 2016).
This paper assesses the e�ectiveness of an environmental policy that was
enacted in and enforced by Brazil, a developing country with great potential to
contribute to GHG emissions reductions. It explores a unique setting in which the
innovative use of remote sensing technology was paramount in overcoming
limitations imposed by the country's weak institutional environment. Speci�cally,
we investigate if environmental law enforcement that was targeted using a
pioneering satellite-based monitoring system e�ectively reduced Brazilian Amazon
deforestation.
Brazil plays a prominent role in the global �ght against climate change.
Extending over an area nearly half the size of continental Europe, the Brazilian
Amazon is a vital carbon sink. In the early 2000s, at a time when almost a �fth of
global GHG emissions originated from the (mostly tropical) forestry sector, Brazil
stood out as the country that cleared most tropical forest area in both absolute
and relative terms (IPCC, 2007; Hansen and DeFries, 2004; Hansen et al., 2008).
As the protection of tropical forests rose to the top of the global environmental
policy agenda (Burgess et al., 2012), Brazil responded to rising international
pressures by launching a conservation action plan aimed at combating Amazon
deforestation. Within less than a decade, Amazon forest clearing rates fell by
nearly 85% (INPE, 2017).
Strengthening command and control was central to the action plan's strategy,
not least because the vast majority of Amazon clearings are illegal. The
cornerstone of this strategy was the implementation of the Real-Time System for
Detection of Deforestation (DETER), a satellite-based system that provides
near-constant surveillance of deforestation activity throughout the full extent of
the Brazilian Amazon. Upon detecting a change in tropical forest cover, DETER
2
issues a georeferenced deforestation alert signaling areas in need of immediate
attention, which then serves to target environmental law enforcement. In Brazil,
the ability to provide a timely response is a crucial part of an e�ective strategy to
inhibit deforestation, because the country's institutional setup is such that
environmental law enforcers can apply more binding penalties when catching
o�enders red-handed. This is particularly relevant in a context of frail property
rights, widespread illegality, and acute lawlessness, all of which characterize the
Brazilian Amazon (Alston et al., 2000; Schmitt, 2015; Fetzer and Marden, 2017;
Mueller, 2018). In this context, DETER was a major leap forward in Amazon
enforcement capacity, allowing environmental authorities to better identify, more
closely monitor, and more quickly act upon areas being illegally deforested.
Brazil's experience with satellite-based monitoring to combat Amazon
deforestation therefore o�ers a unique opportunity for empirical assessment. It not
only provides evidence on the e�ectiveness of enforcing environmental policy of
great international salience in a developing country, but also sheds light on how
technology can be used to leverage state capacity and tackle challenges inherent to
weak institutional environments. Developing countries, in particular, stand to
bene�t from the technology's potential to bring oversight across regions often
deemed too large, remote, or unsafe for the ground presence of law enforcement
personnel.2
The relationship between law enforcement and criminal activity is
characterized by strong endogeneity, so isolating a causal e�ect is an empirically
challenging task (Levitt, 1997; Di Tella and Schargrodsky, 2004; Draca et al., 2011;
Chal�n and McCrary, 2017). In this paper, we build on an empirical setting
exclusive to the Brazilian Amazon to propose a novel instrumental variable for
environmental law enforcement. Our core argument is as follows. Cloud coverage
blocks visibility in satellite imagery and thereby limits DETER's capacity to
detect changes in land cover patterns. Because the system issues no deforestation
alerts for areas covered by clouds, enforcement personnel are less likely to be
allocated to these areas. We argue � and provide supporting empirical evidence
� that, controlling for relevant weather controls, DETER cloud coverage serves as
a valid instrument for environmental law enforcement in the Brazilian Amazon.
We explore this exogenous source of variation in law enforcement using a 2006
through 2016 panel of Amazon municipalities to recover two-stage least squares
(2SLS) estimates of the impact of enforcement on deforestation, conditional on a
host of controls, as well as on municipality and year �xed e�ects. First-stage
2UNOSAT, a United Nations initiative, o�ers a collection of examples for the use of remotesensing technology in risk zones: damage assessment in the Gaza Strip, Iraq, Nepal, Syria, andYemen; post-disaster monitoring in Haiti and Pakistan; and tracking of refugee camps in Syria tocoordinate humanitarian support (UNITAR, 2016, 2019).
3
results corroborate that municipalities with greater DETER cloud coverage in a
given year see a signi�cantly reduced presence of law enforcement that year, as
proxied by the total number of deforestation-related �nes issued in that
municipality by the environmental law enforcement authority. Fines are a good
proxy for environmental law enforcement in this setting, in which most clearings
are illegal, because �nes are issued both as standalone penalties and alongside
more severe penalties for environmental infractions. They therefore serve as a
means of capturing that law enforcement was present in that speci�c locality.
Second-stage results indicate that monitoring and law enforcement were e�ective
in curbing Amazon deforestation. This �nding holds across a series of robustness
exercises accounting for potentially relevant di�erences at baseline, varying sample
composition, and alternative controls. Results further suggest that the estimated
impact was sizable: on average, reducing monitoring and law enforcement by half
increases municipal deforestation by an estimated 44%. This is particularly timely
considering that the 2020 budget originally presented by the Brazilian Federal
Government proposes cutting back on �nancial support for environmental
monitoring and law enforcement by up to 50%.
We discuss two possible explanations for this e�ect in light of the changes
introduced by the new monitoring system. Improved targeting of law enforcement
may have deterred deforestation by causing potential o�enders to update their
beliefs about their chance of getting caught and, thus, their expected costs from
engaging in the illegal activity. Alternatively, enforcement action leading to the
loss of capital goods used in forest clearing may have reduced potential o�enders'
ability to commit future o�enses. The exercise does not, however, reveal the
underlying mechanisms for the estimated impact.
The analysis also investigates whether the monitoring and law enforcement
e�orts that locally curbed deforestation had additional, albeit unintended,
consequences. We �nd no evidence to support that local reductions in forest
clearings were driven by leakage of tropical deforestation activity into neighboring
areas, nor do we �nd evidence that local agricultural production was negatively
a�ected by the presence of law enforcement. In fact, if anything, municipalities
that saw a greater presence of environmental law enforcement in a given year
exhibited improved agricultural outcomes the following year. We speculate that
this might be driven by the increased presence of law enforcement contributing to
an improved institutional and productive environment.
This paper speaks to di�erent strands of the economic literature. First, it
contributes to a burgeoning literature on the enforcement of environmental
regulation in developing countries. Environmental regulation has long been
assessed in terms of both policy e�ectiveness and impacts on socioeconomic
outcomes, but almost exclusively within the context of developed nations
4
(Greenstone, 2002; Chay and Greenstone, 2005; Gray and Shimshack, 2011; Keiser
and Shapiro, 2019). A smaller, but recently growing, number of studies address the
topic in the context of developing countries, focusing mostly on regulation aimed
at reducing air and water pollution (Greenstone and Hanna, 2014; Tanaka, 2015).
Greenstone and Hanna (2014) stress the need for further research on the
enforcement of environmental regulation in developing countries, since empirical
�ndings from developed nations can seldom be extended to developing ones, which
typically have very di�erent institutional environments. This is, perhaps, where
our paper makes its greatest contribution, as it provides insight into how a
developing nation pioneered the use of technology to leverage its capacity to
enforce environmental regulation with a potential for impact that extends far
beyond its national borders. After all, although �ghting tropical forest clearings
might not be a policy priority in all developing nations, Amazon deforestation has
global climate consequences, and Brazil is currently the only country that can
address it at scale.
Second, the analysis relates to a broader literature on the determinants of
tropical deforestation (Pfa�, 1999; Chomitz and Thomas, 2003; Burgess et al.,
2012; Souza-Rodrigues, 2019), as well as to a narrower literature dedicated to the
assessment of potential policy drivers of the 2000s Brazilian Amazon deforestation
slowdown (Hargrave and Kis-Katos, 2013; Assunção et al., 2015, 2019a,b; Burgess
et al., 2019). Although several works in the latter literature have documented that
policies signi�cantly contributed to reduce Amazon clearing rates, none have
focused on estimating the impact of environmental monitoring and law
enforcement e�orts, despite their central role in the action plan.3 To the best of
our knowledge, this is the �rst empirical evaluation of environmental monitoring
and law enforcement that adequately addresses known endogeneity between illegal
deforestation and the presence of law enforcers in the Brazilian Amazon.
Finally, the paper also speaks to the police and crime literature, which has long
sought to disentangle the causal impact of law enforcement on illegal activity
(Chal�n and McCrary, 2017). Authors have explored several alternative sources of
exogenous variation in police presence, ranging from electoral cycles (Levitt, 1997;
McCrary, 2002; Levitt, 2002) to terrorist attacks (Di Tella and Schargrodsky, 2004;
Klick and Tabarrok, 2005; Draca et al., 2011), and have, more recently, even
experimented with randomized deployment of hot-spot policing (Blattman et al.,
2019). This analysis contributes to the �eld by assessing the impact of law
enforcement on criminal activity within an empirical setting that is not
context-speci�c, but rather encompasses the full extent of the geographical area
3Hargrave and Kis-Katos (2013) �nd a negative relationship between municipal �ne density anddeforestation in the Brazilian Amazon, but do not explicitly account for endogeneity between lawenforcement and forest clearings.
5
subject to the illegal activity. Thus, no additional assumptions or extrapolations
are needed to draw conclusions about the e�ectiveness of enforcement in this
setting.
The rest of the paper is organized as follows. Section 2 describes the
institutional context regarding Brazilian Amazon deforestation, as well as
associated environmental monitoring and law enforcement. Section 3 details the
empirical strategy used to estimate the e�ect of law enforcement on deforestation.
Section 4 describes the data and provides descriptive statistics. Section 5 presents
and discusses the main results, and explores potential leakage e�ects and policy
costs. Section 6 provides a series of robustness checks. Section 7 concludes with
policy implications.
2. Institutional Context
This section presents a contextual overview of Brazilian Amazon deforestation,
focusing on the three elements that are most necessary to understand law
enforcement's potential for impact in this setting. It starts with a characterization
of deforestation activity since the early 2000s, which occurred primarily as a means
of clearing the land for non-forest uses. Because this activity was mostly illegal, it
was subject to law enforcement action. The section therefore follows with a
description of how environmental law enforcement targeting deforestation evolved
over recent decades, particularly after the introduction of satellite-based
monitoring of Amazon forest cover. It closes with a discussion about the role the
novel monitoring system played in enhancing enforcement capacity, largely because
it allowed enforcement authorities to provide a more timely response to infractions.
In being able to more quickly detect and thereby reach sites of recent deforestation
activity, law enforcers had a greater chance of catching o�enders red-handed and,
thus, of applying more binding penalties.
2.1. Amazon Deforestation
At the beginning of the 21st century, Brazil stood out as the country that cleared
most tropical forest, both in absolute area and relative to its year-2000 forest cover
(Hansen et al., 2008). By 2004, deforested area totaled over 600 thousand km2,
nearly 15% of the country's original Amazon forest area (INPE, 2017). There are
two aspects of Brazilian Amazon deforestation over the last two decades that are
central to this paper: (i) it was largely an illegal practice; and (ii) its primary goal
was to clear areas for non-forest land uses, and not to extract timber.
In Brazil, removing native vegetation is only legal if the clearing of a speci�c area
has been duly authorized by a government environmental authority. Authorizations
can only be granted for areas within designated lands, which encompass private
landholdings and public lands assigned either to protection or to agrarian reform
6
settlements.4 Private landholders must also comply with the Brazilian Forest Code,
which sets legal guidelines for conversion and protection of native vegetation inside
private properties. The Forest Code is particularly restrictive for properties in the
Amazon, capping legal deforestation at no more than 20% of total property area,
and further requiring landholders to preserve areas of permanent protection, such
as riparian forests.5 Clearing forest in undesignated lands (public areas that have
not been assigned to a speci�c use) is always illegal. Currently available data on
Amazon deforestation do not allow legal clearings to be distinguished from illegal
ones. However, descriptive and anecdotal evidence, brie�y summarized in what
follows, corroborate the general consensus that forest clearing in the region is mostly
illegal.6
The Brazilian Amazon covers an area of approximately 4.2 million km2.
Undesignated lands, where all clearings are illegal, extend over an estimated
700 thousand km2 (Azevedo-Ramos and Moutinho, 2018). An additional
2.1 million km2 are under protection, as either indigenous lands or protected areas
(CNUC, 2018; FUNAI, 2018). Because clearing forest within protected Amazon
territory is either entirely forbidden or subject to stringent requirements, it is
practically analogous to being illegal. The remaining 1.4 million km2 are either
private landholdings or agrarian reform settlements, both of which must comply
with conservation requirements established in the Brazilian Forest Code. While
clearings inside properties can be legal, property-level assessments reveal very poor
compliance with environmental regulation and the Forest Code in the Amazon
(Michalski et al., 2010; Godar et al., 2012; Börner et al., 2014). Forest clearings in
non-compliant properties are carried out in irregular circumstances and are
therefore also illegal. In light of this, although the data on Amazon deforestation
used in this paper may include legal clearings, it is safe to assume that this
amounts to only a small fraction of total cleared area.
In addition to having been mostly illegal, Amazon deforestation since the early
2000s occurred primarily as a means to clear land for alternative non-forest uses.
The two leading drivers of clear-cut deforestation (total removal of forest biomass)
in the Brazilian Amazon are agricultural conversion and illegal land grabbing. The
former is re�ected in the pattern of land use within the stock of deforested areas:
pasture occupies 63% and cropland 6% of cleared Amazon areas (INPE & Embrapa,
2016).7 The latter is a symptom of a long history of fragile property rights in the
4Speci�c regulations determining requirements and procedures for legal deforestation vary acrossland tenure categories.
5See Chiavari and Lopes (2015) for an overview of the Brazilian Forest Code.6Representatives of the Brazilian Ministry of the Environment and the federal environmental
police authority have stated, in informal conversations, that over 90% of Amazon forest clearingswithin the past two decades were illegal.
7The remaining cleared area is covered by forest regrowth (23%), or a mix of other uses (8%),including urban and mining areas.
7
region, where public forest areas are often cleared as a means of illegally claiming
ownership over the land (Alston et al., 2000; Alston and Mueller, 2010; Fetzer and
Marden, 2017; Mueller, 2018; Azevedo-Ramos and Moutinho, 2018). Occupied areas
are typically held for speculative purposes. The key implication of a pattern of forest
clearing for agricultural conversion and land grabbing is spatial permanence. As land
itself is the main input in both practices, it is unlikely that recently deforested areas
in the Amazon are immediately abandoned.8
Combined, these two aspects of Amazon deforestation suggest there is room for
law enforcement to a�ect forest clearing practices. Illegal activities are, by nature,
the central target of law enforcement e�orts. Moreover, because deforested areas in
the Amazon are not quickly abandoned, enforcement o�cers have a non-negligible
chance of identifying the o�enders who are responsible for the illegal clearing. In
this sense, spatial permanence contributes to enforcement's capacity to attribute
responsibility for the environmental infraction. In the remainder of this section, we
discuss how, in spite of this, law enforcement was regarded as having only a very
limited capacity to impact Amazon deforestation. This was largely because the
severity of penalties that can be applied as punishment for deforestation in Brazil
depends on the timing of the enforcement response. It was not until the adoption
of a novel satellite-based monitoring system that the Brazilian environmental law
enforcement authority was able to provide a timely response. This system essentially
introduced what spatial permanence alone could not guarantee: the ability to catch
o�enders red-handed and, hence, impose binding penalties.
2.2. Environmental Monitoring and Law Enforcement
During the 1980s and 1990s, administrative sanctions were regarded as having
little capacity to inhibit environmental o�enders (Schmitt, 2015). The enactment
of the 1998 Law of Environmental Crimes (Brasil, 1998) brought regulatory
stability to the investigation and prosecution of environmental violations by
providing clearer de�nitions of infractions, as well as setting legal directives for the
application of administrative and penal sanctions. In the Amazon, this law was
enforced by the Brazilian Institute for the Environment and Renewable Natural
Resources (Ibama), an executive branch of the Brazilian Ministry of the
Environment. Ibama is responsible for environmental monitoring and law
enforcement at the federal level, operating as the national police authority in the
investigation of environmental infractions and application of administrative
sanctions.
8In contrast, logging is an inherently mobile practice. Although logging has been associated withtropical forest loss, timber extraction in the Amazon is performed selectively to target high-valuetrees and avoid the high costs of clearing large areas covered with tropical vegetation (Angelsenand Kaimowitz, 1999; Hargrave and Kis-Katos, 2013; Chimelli and Soares, 2017). This typicallyresults in forest degradation (partial removal of forest biomass), not clear-cut deforestation.
8
Although the participation of Amazon states in environmental management has
grown since the 1990s, Ibama still holds a large and central role in carrying out
command and control policy in the region. In addition to its headquarters in the
Brazilian capital of Brasília, the institute holds several regional o�ces in the
Amazon to support its �eld operations. Yet, given the sheer magnitude of the
Brazilian Amazon, Ibama's enforcement capacity largely hinges on its ability to
accurately detect and target environmental infractions. Through the very early
2000s, targeting was mostly based on strategic intelligence Ibama collected, and
complemented by anonymous reports of forest clearing activity received via a hot
line. In this setting, enforcement capacity would clearly bene�t from remote
monitoring technology capable of placing large forest areas under regular
surveillance. At the time, however, the available technology was limited to air
vehicles, such as helicopters, which o�ered only a relatively short range of action,
and still put Ibama o�cers at great personal risk.
Conditions for environmental monitoring and law enforcement in the Amazon
drastically changed with the enactment of Brazil's Action Plan for the Prevention
and Control of Deforestation in the Legal Amazon (PPCDAm). Launched in 2004,
the action plan inaugurated a novel approach towards combating tropical
deforestation in Brazil. It integrated actions across di�erent government
institutions and proposed new procedures for monitoring, environmental control,
and territorial management. Because Amazon deforestation was known to be
mostly illegal, strengthening command and control policy was the action plan's
tactical-operational priority, and adopting high-frequency remote monitoring of
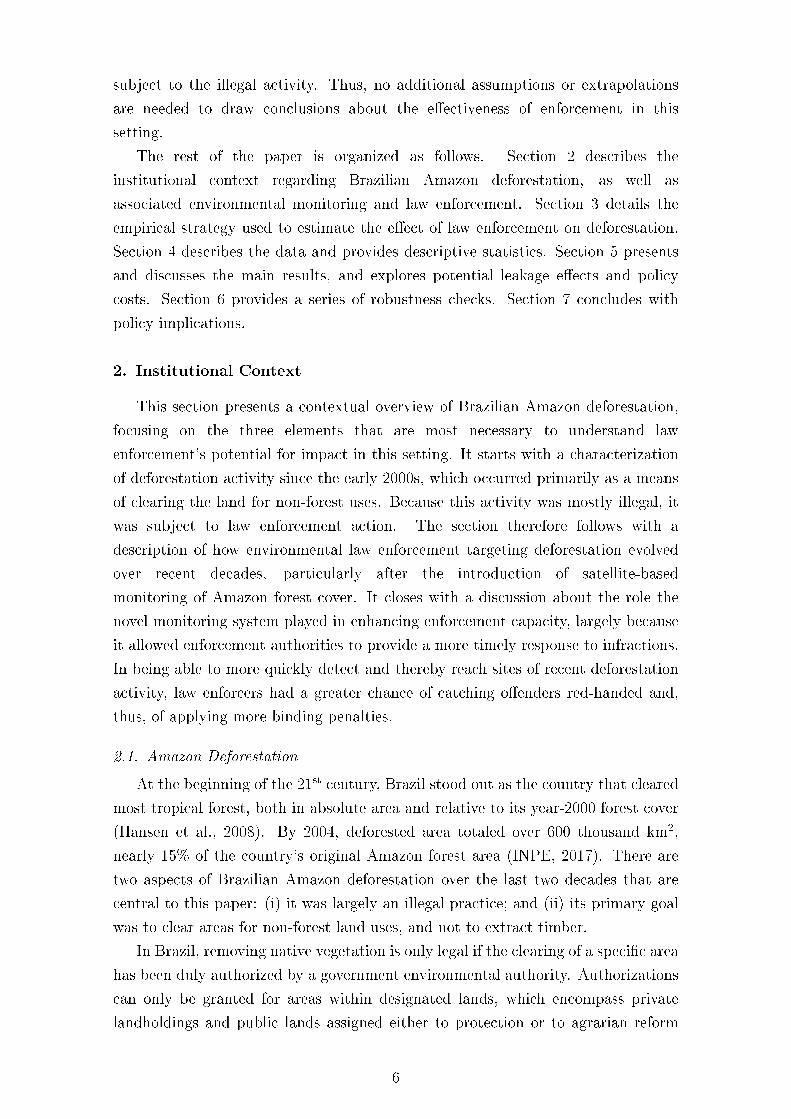
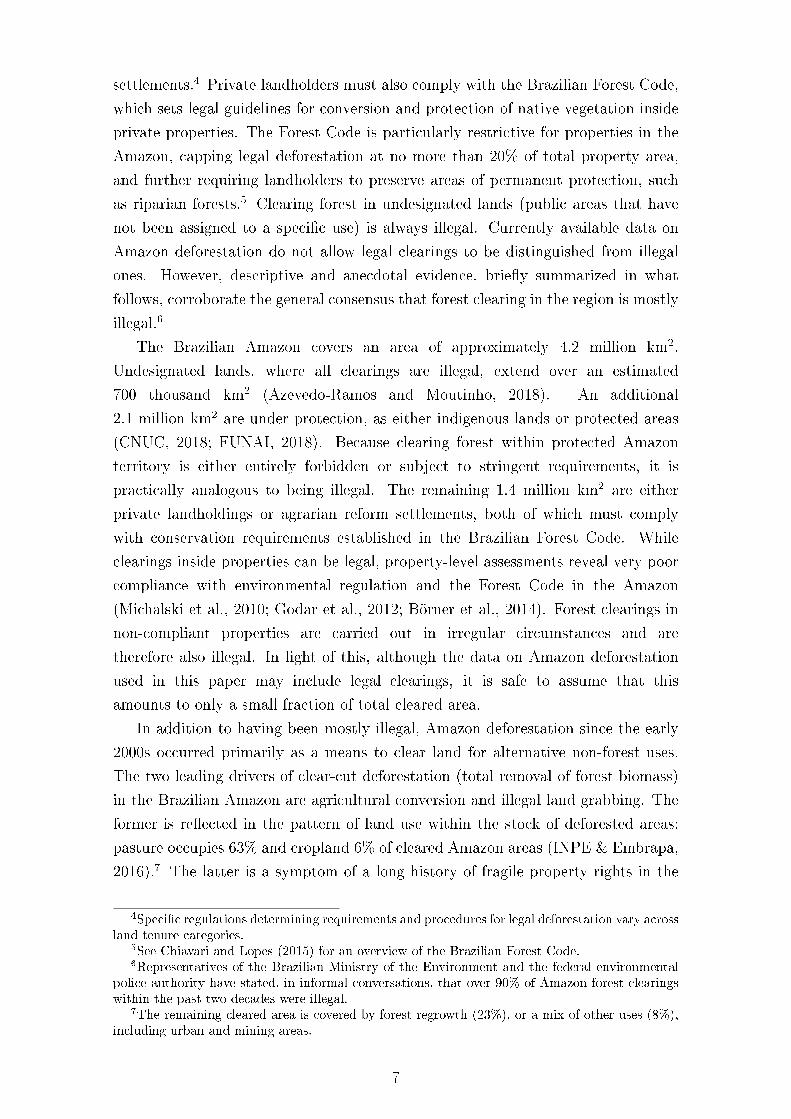
forest clearing activity was its pivotal endeavor. Developed by the Brazilian
Institute for Space Research (INPE), DETER was a satellite-based system that
regularly collected and processed georeferenced imagery on Amazon land cover to
detect forest loss. DETER used optical imagery from the MODIS sensor on the
Terra satellite, which had a spatial resolution of 250m and a daily revisit rate for
the full extent of the Brazilian Amazon. Figure 1 portrays how DETER captured
deforestation using this imagery. The system classi�ed land cover seen on
satellite-based pictures, distinguishing between areas that were covered by
vegetation and those that were not. Images from two di�erent points in time for
the same location were compared to identify recent changes in forest cover, which
were regarded as potential forest clearing hot spots. Once detected, each hot spot
was associated with a georeferenced deforestation alert marking the area in need of
immediate attention, as shown in Figure 2.
9
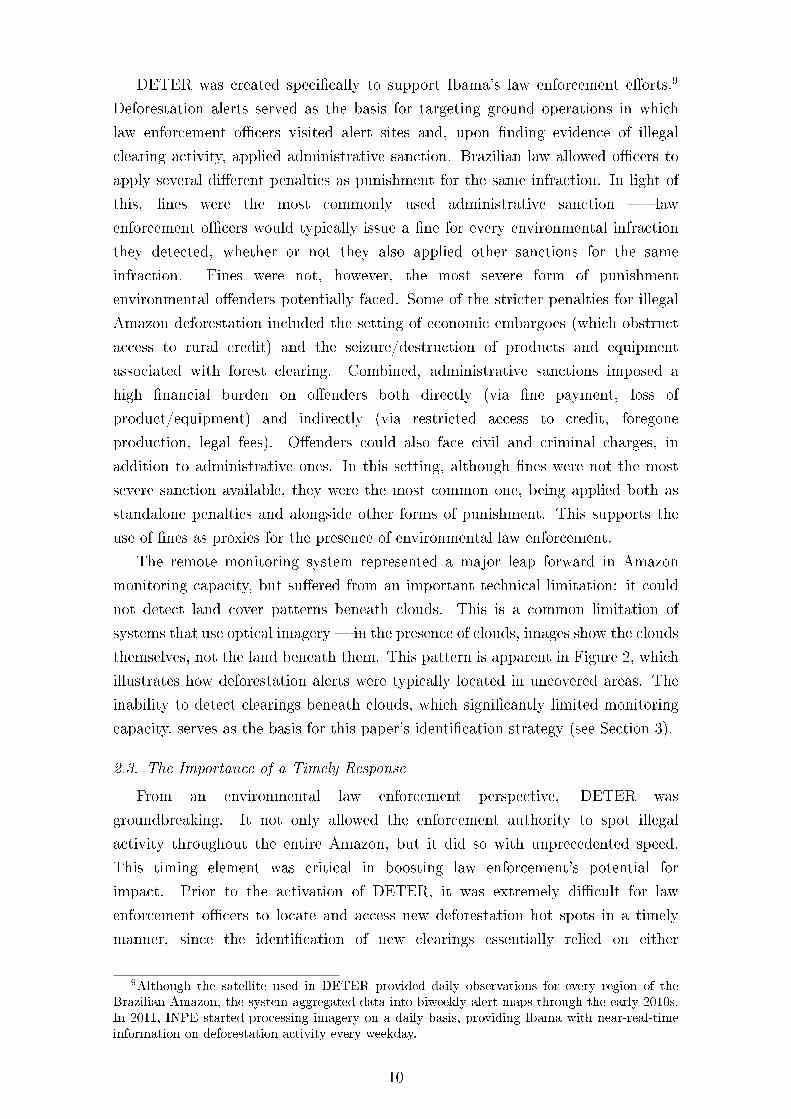
DETER was created speci�cally to support Ibama's law enforcement e�orts.9
Deforestation alerts served as the basis for targeting ground operations in which
law enforcement o�cers visited alert sites and, upon �nding evidence of illegal
clearing activity, applied administrative sanction. Brazilian law allowed o�cers to
apply several di�erent penalties as punishment for the same infraction. In light of
this, �nes were the most commonly used administrative sanction � law
enforcement o�cers would typically issue a �ne for every environmental infraction
they detected, whether or not they also applied other sanctions for the same
infraction. Fines were not, however, the most severe form of punishment
environmental o�enders potentially faced. Some of the stricter penalties for illegal
Amazon deforestation included the setting of economic embargoes (which obstruct
access to rural credit) and the seizure/destruction of products and equipment
associated with forest clearing. Combined, administrative sanctions imposed a
high �nancial burden on o�enders both directly (via �ne payment, loss of
product/equipment) and indirectly (via restricted access to credit, foregone
production, legal fees). O�enders could also face civil and criminal charges, in
addition to administrative ones. In this setting, although �nes were not the most
severe sanction available, they were the most common one, being applied both as
standalone penalties and alongside other forms of punishment. This supports the
use of �nes as proxies for the presence of environmental law enforcement.
The remote monitoring system represented a major leap forward in Amazon
monitoring capacity, but su�ered from an important technical limitation: it could
not detect land cover patterns beneath clouds. This is a common limitation of
systems that use optical imagery � in the presence of clouds, images show the clouds
themselves, not the land beneath them. This pattern is apparent in Figure 2, which
illustrates how deforestation alerts were typically located in uncovered areas. The
inability to detect clearings beneath clouds, which signi�cantly limited monitoring
capacity, serves as the basis for this paper's identi�cation strategy (see Section 3).
2.3. The Importance of a Timely Response
From an environmental law enforcement perspective, DETER was
groundbreaking. It not only allowed the enforcement authority to spot illegal
activity throughout the entire Amazon, but it did so with unprecedented speed.
This timing element was critical in boosting law enforcement's potential for
impact. Prior to the activation of DETER, it was extremely di�cult for law
enforcement o�cers to locate and access new deforestation hot spots in a timely
manner, since the identi�cation of new clearings essentially relied on either
9Although the satellite used in DETER provided daily observations for every region of theBrazilian Amazon, the system aggregated data into biweekly alert maps through the early 2010s.In 2011, INPE started processing imagery on a daily basis, providing Ibama with near-real-timeinformation on deforestation activity every weekday.
10
Ibama's capacity to accurately anticipate spatial deforestation patterns, or reports
received via its hot line. By the time o�cers reached deforested areas, it was often
too late to apply the more severe � and, thus, more binding � sanctions. Even if
o�cers were able to correctly identify and locate the responsible parties, which is
not a trivial task in a setting rife with insecure property rights (Alston et al., 2000;
Schmitt, 2015; Mueller, 2018), their capacity to impose the most costly penalties
ultimately depended on their capacity to catch o�enders red-handed. Consider, as
an example, the seizure and destruction of equipment used for clearing. If law
enforcement o�cers �nd heavy machinery, like tractors, on-site in a deforestation
hot spot, they can in�ict an immediate and severe �nancial loss on the o�ender by
seizing and destroying it. Expensive capital goods were not usually left unused in
deforested areas once clearing was completed, so seizure/destruction could only be
resorted to when o�cers interrupted o�enders mid-clearing. DETER essentially
increased the probability of such caught-in-the-act operations.
In light of this, the adoption of near-real-time satellite-based monitoring of forest
loss was particularly salient. Since its implementation in 2004, DETER has served
as the main targeting tool for Amazon law enforcement. By allowing Ibama to
quickly locate and act upon areas a�icted by recent deforestation, it increased law
enforcement's capacity to catch o�enders red-handed, and thereby enhanced the
potential for the application of binding sanctions.
3. Empirical Strategy
This paper's central empirical challenge is to adequately address the endogeneity
that exists in the relationship between environmental law enforcement and illegal
deforestation. In the context of the Brazilian Amazon, this endogeneity can be
brie�y stated as follows. On the one hand, the presence of law enforcement is
intuitively expected to negatively impact illegal forest clearings by either inhibiting
potential o�enders or reducing their capacity to commit future o�enses; on the other
hand, law enforcers are knowingly allocated, at least in part, based on the actual
occurrence of clearings. As we only observe an equilibrium situation, an estimator
that does not adequately account for reverse causality will be biased. To address the
possible upward bias in ordinary least squares (OLS) estimators, our estimation must
tackle simultaneity in addition to the usual concerns regarding omitted variables.
This section proposes an instrumental variable strategy to estimate the causal e�ect
of law enforcement on Amazon deforestation.
Recall from Section 2 that, because DETER is unable to detect land cover
patterns beneath clouds, it does not issue alerts for any given area when cloud
coverage is limiting visibility in that area. Alerts serve as the basis for targeting
Amazon law enforcement, so law enforcers are less likely to be allocated to areas
that are blocked from view by clouds in the monitoring system, even if forest
11
clearing is occurring in these areas. This suggests that, after the adoption of the
satellite-based monitoring system, the presence of environmental law enforcement
in the Brazilian Amazon should be at least partially determined by DETER cloud
coverage. If this is, in fact, the case � and we will provide empirical evidence that
supports this claim at the municipal level (see Section 5.1) � average annual
DETER cloud coverage is arguably a source of exogenous variation in the presence
of environmental law enforcement at the municipal level. Hence, we propose using
DETER cloud coverage as an instrument for environmental law enforcement in the
Brazilian Amazon.
The instrument's validity hinges on it being uncorrelated with the error term in
the equation that regresses deforestation on law enforcement, conditional on
observable variables. There are two scenarios in which this condition could be
violated in our empirical setup: (i) if DETER cloud coverage correlates with other
geographical characteristics that, in turn, correlate with forest clearings; and (ii) if
DETER cloud coverage correlates with the outcome of interest, namely
deforestation. The availability of relevant observable variables helps make the case
for the instrument's validity.
We address the potential correlation between geographical characteristics and
forest clearings using a combination of available data and �xed e�ects. Rainfall and
temperature are an obvious source of concern here, as both are expected to correlate
with clouds via weather phenomena. They may also correlate with deforestation,
either as determinants of forest clearing decisions, or as ecological consequences
of forest loss (Nobre et al., 1991; Negri et al., 2004; Aragão et al., 2008; Chomitz
and Thomas, 2003; Bagley et al., 2014). Although delving into the speci�cs of this
relationship is out of the scope of this paper, the empirical strategy accounts for
it by using precipitation and temperature data to control for municipal weather.
Another source of concern in validating the instrument's exclusion restriction is
the potential correlation between average cloud coverage and soil type. Biophysical
conditions that determine soil type could be correlated with local weather conditions,
and soil quality, which a�ects agricultural outcomes, could in�uence forest clearing
decisions in the Brazilian Amazon. The inclusion of location �xed e�ects helps
mitigate this concern. All speci�cations therefore include municipal precipitation
and temperature controls, as well as municipality �xed e�ects.
Data availability also serves to address the potential correlation between
DETER cloud coverage and the outcome of interest. Deforestation data come from
INPE's Project for Monitoring Deforestation in the Legal Amazon (PRODES),
which uses satellite-based optical imagery to annually map deforested areas (see
Section 4.1 for a detailed description). Although both PRODES and DETER use
satellite imagery to detect changes in Amazon land cover, PRODES' goal is to
measure deforestation more accurately only once per year, not monitor it
12
frequently. PRODES data are constructed using information collected from a
di�erent satellite that provides images at higher resolutions. While DETER uses
daily imagery all year round, PRODES selects only the best images from the
Amazon dry season to minimize cloud coverage and maximize visibility of land
surfaces. PRODES is thus less likely to su�er from limited visibility, but if present
in selected imagery, clouds will still block land cover from view. In light of this, a
sound empirical strategy must ensure that the potential correlation between the
proposed instrument, DETER cloud coverage, and the key dependent variable,
PRODES deforestation, is adequately accounted for. Fortunately, PRODES data
are released containing information on areas that were blocked from view, so all
speci�cations include controls for these areas. Coe�cients are therefore estimated
considering only DETER cloud coverage that is orthogonal to PRODES
non-observable areas.
Having controlled for municipal precipitation, temperature, and PRODES
satellite visibility, as well as for municipality �xed e�ects, we argue that the only
remaining channel through which DETER cloud coverage could be correlated with
deforestation in the Brazilian Amazon is that of environmental law enforcement
allocation. The empirical analysis starts by testing the relationship between law
enforcement and DETER cloud coverage. The OLS estimation equation is given
by:
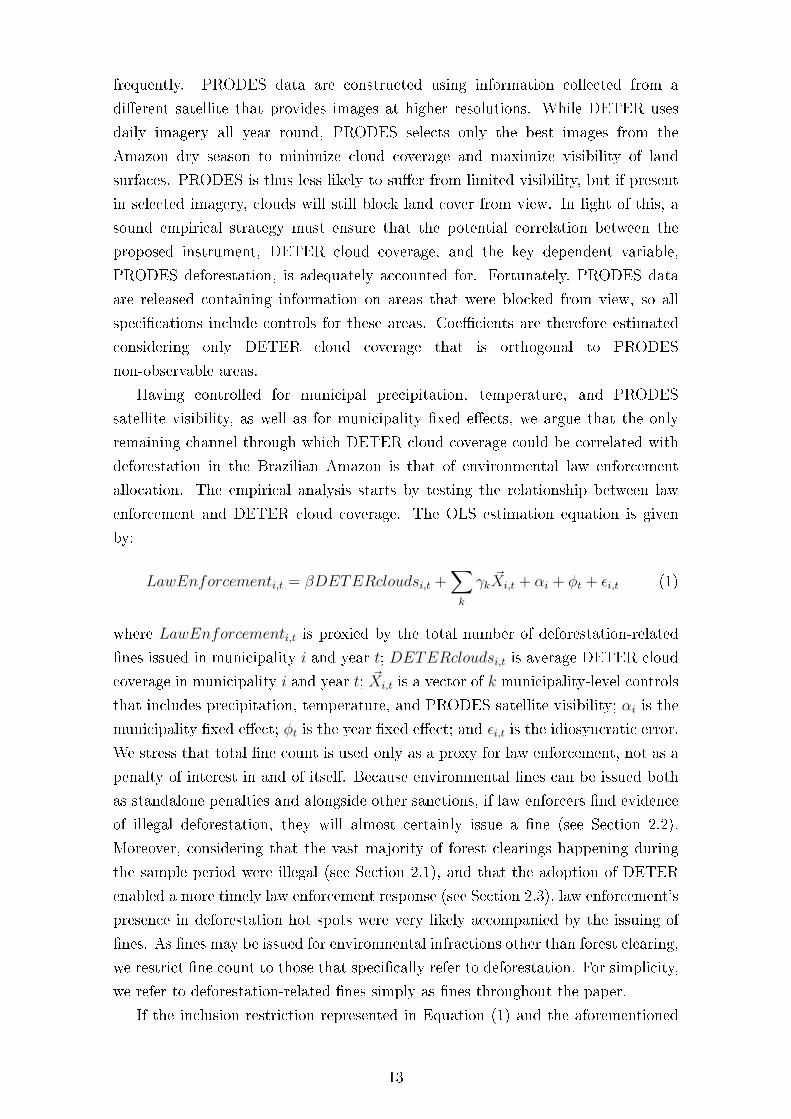
LawEnforcementi,t = βDETERcloudsi,t +∑k
γk ~Xi,t + αi + φt + εi,t (1)
where LawEnforcementi,t is proxied by the total number of deforestation-related
�nes issued in municipality i and year t; DETERcloudsi,t is average DETER cloud
coverage in municipality i and year t; ~Xi,t is a vector of k municipality-level controls
that includes precipitation, temperature, and PRODES satellite visibility; αi is the
municipality �xed e�ect; φt is the year �xed e�ect; and εi,t is the idiosyncratic error.
We stress that total �ne count is used only as a proxy for law enforcement, not as a
penalty of interest in and of itself. Because environmental �nes can be issued both
as standalone penalties and alongside other sanctions, if law enforcers �nd evidence
of illegal deforestation, they will almost certainly issue a �ne (see Section 2.2).
Moreover, considering that the vast majority of forest clearings happening during
the sample period were illegal (see Section 2.1), and that the adoption of DETER
enabled a more timely law enforcement response (see Section 2.3), law enforcement's
presence in deforestation hot spots were very likely accompanied by the issuing of
�nes. As �nes may be issued for environmental infractions other than forest clearing,
we restrict �ne count to those that speci�cally refer to deforestation. For simplicity,
we refer to deforestation-related �nes simply as �nes throughout the paper.
If the inclusion restriction represented in Equation (1) and the aforementioned
13
exclusion restrictions hold, an instrumental variable setup can be used to capture the
impact of law enforcement (instrumented by DETER cloud coverage) on Amazon
deforestation. The 2SLS second-stage estimation equation is given by:
Deforestationi,t = δLawEnforcementi,t−1 +∑k
θk ~Xi,t + ψi + λt + ξi,t (2)
where Deforestationi,t is a normalized measure of total deforested area in
municipality i and year t; LawEnforcementi,t−1 is the total number of
deforestation-related �nes issued in municipality i and year t − 1, and is
instrumented by DETERcloudsi,t−1; ~Xi,t is the vector of k municipality-level
controls; ψi is the municipality �xed e�ect; λt is the year �xed e�ect; and ξi,t is the
idiosyncratic error. Estimates are robust to heteroskedasticity, and standard errors
are clustered at the municipality level in all speci�cations, making them robust to
serial correlation (Bertrand et al., 2004).
The use of a one-year lag for the enforcement variable is based on the literature
that documents a lagged response of illegal activity to enhanced enforcement
(Levitt, 1997; Shimshack and Ward, 2005; Chal�n and McCrary, 2017). A one-year
lag seems plausible in a setting with DETER-based monitoring and annual
deforestation data. For a given area, increased forest clearing in year t likely
triggers the concurrent issuing of DETER alerts associated with that area, thereby
increasing the presence of law enforcement via targeted allocation that same
year t. If potential o�enders perceive the increased presence of law enforcement in
year t as a higher probability of getting caught and sanctioned in year t + 1, they
may choose to not engage in the illegal activity the following year, consequently
contributing to reduce deforestation in year t + 1. We therefore test whether
lagged environmental law enforcement a�ected current deforestation. To capture
DETER cloud coverage that is correlated with the allocation of law enforcement,
but uncorrelated with deforestation through all other channels, we include
one-year lags for precipitation and temperature controls, but current measures for
all other controls.
In all speci�cations, municipality �xed e�ects control for potentially relevant
municipality-speci�c characteristics a�ecting both deforestation activity and law
enforcement e�orts, and year �xed e�ects account for aggregate shocks. In
addition to the variables added to support the validity of the exclusion restriction
(precipitation, temperature, and PRODES satellite visibility), Xi,t in Equation (2)
also includes agricultural commodity price controls, which have been shown to be
relevant drivers of tropical deforestation (Angelsen and Kaimowitz, 1999; Hargrave
and Kis-Katos, 2013; Assunção et al., 2015). Conservation policy e�orts
implemented alongside improvements in monitoring and law enforcement may have
also a�ected deforestation outcomes during the sample period. We discuss these
14
policies in more detail and include available policy controls in robustness exercises
(see Section 6.3), but refrain from adding them to benchmark speci�cations due to
endogeneity concerns.
4. Data
This paper's empirical analysis uses a 2006 through 2016 municipality-by-year
panel dataset built entirely from publicly available data. The sample includes all
municipalities that are either partially or entirely located in the Amazon biome,
that exhibited variation in forest cover during this period, and for which
deforestation data were available.10 The variation in forest cover criteria enables
the use of municipality �xed e�ects. This eliminates 25 municipalities that did not
contain a signi�cant amount of forest cover at baseline, as evidenced by a 2%
average ratio of forest to municipal area (INPE, 2017). The non-missing data for
deforestation criteria eliminates seven municipalities that lie only marginally
within the far northeast region of the Legal Amazon, such that there is no relevant
coverage of their respective territories in Amazon satellite systems. The �nal
sample comprises 521 municipalities.11
4.1. Deforestation
Since 1988, INPE annually tracks the loss of tropical vegetation in the Brazilian
Amazon via PRODES. The system uses optical images from Landsat class satellites,
with a spatial resolution of 20 to 30 meters, to detect changes in tropical forest
cover throughout the full extent of the Brazilian Amazon. PRODES only accounts
for clear-cut deforestation, which it de�nes as the near-complete or complete loss of
tropical vegetation. Deforested areas in PRODES therefore do not include the loss of
degraded forests, or non-tropical vegetation. The system provides annual data, but
because PRODES typically uses imagery from the Amazon dry season to minimize
cloud coverage in imagery, these data do not refer to a calendar (January through
December) year. Rather, they refer to what we call the �PRODES year�: for a given
year t, PRODES measures deforestation that happened from August of year t − 1
through July of year t. Unless otherwise stated, years referenced throughout the
analysis refer to PRODES years, not calendar ones.
PRODES was created to map and measure tropical deforestation increments,
10The Legal Amazon refers to a geopolitical territorial division, whereas the Amazon biome refersto an ecological one. Figure 2 maps the two regions. Although DETER monitoring covers the fullextent of the Legal Amazon, 97% of the area deforested in the Amazon since the adoption of theremote monitoring system occurred within the Amazon biome (INPE, 2017). This is consistentwith the fact that, at the time DETER was launched, tropical forest covered less than 5% ofnon-biome Legal Amazon territory (INPE, 2017).
11Municipal boundaries in the analysis refer to the 2007 administrative division from theBrazilian Institute for Geography and Statistics (IBGE).
15
which are used to calculate an Amazon-wide annual deforestation rate.12 When an
area is identi�ed as deforested in PRODES imagery, it is classi�ed as part of that
year's deforestation increment; as of the following year, it is classi�ed as accumulated
deforestation and is incorporated into what is known as the �PRODES deforestation
mask�. Once part of this mask, an area is never reclassi�ed. Thus, by construction,
PRODES can neither detect deforestation of areas covered by tropical regeneration,
nor include this type of forest clearing in its calculation of the annual deforestation
rate. The PRODES deforestation increment is publicly released at an annual basis
both as an Amazon-wide georeferenced dataset and as panel containing municipal
aggregates.
Municipality-level deforestation increments from PRODES serve as the basis
for the construction of our main outcome of interest. These increments are
normalized to account for the large variation in municipality size � the sample
standard deviation is 16 thousand km2. The two benchmark normalization
procedures use the natural log and the inverse hyperbolic sine transformations.13
Some exercises explore alternative normalization procedures, based on municipality
size and across-time average deforestation (see Section 5.3).
4.2. Law Enforcement
Ideally, we would like to use deployment data to capture the presence of
environmental law enforcement in the Brazilian Amazon. However, to the best of
our knowledge, there is neither an existing dataset that contains this information,
nor a means of accurately compiling the data from scratch. We therefore use the
total number of deforestation-related �nes issued by Ibama in each municipality
and year as proxy for the presence of law enforcement at the municipal level. Our
interest lies in the proxy for law enforcement, not in �nes as penalties in and of
themselves. They are a good proxy for the presence of law enforcement in the
Brazilian Amazon, because they are issued both as standalone penalties and
alongside more severe punishments (see Section 2.2). In a context in which the
vast majority of forest clearings are illegal (see Section 2.1), �nes serve as an
indication that law enforcement was both present at the site of an environmental
infraction and able to hold someone accountable for it.14
12Deforestation increments encompass all visible deforested areas; the deforestation rate is closelyrelated to the increment, but it further accounts for cleared forest areas that were partially orentirely blocked from view during remote sensing. INPE (2013) provides a detailed account ofPRODES methodology and rate estimation details.
13The log normalization is implemented as ln(deforesti,t + 0.01), where deforesti,t is thedeforestation increment in km2 for municipality i and year t, to allow for the occurrence ofobservations with null deforestation in the analysis. Note that non-null deforestation is greaterthan 0.01 km2 for all observations in the raw data.
14The knowingly low collection rates for environmental �nes in the Brazilian Amazon (Schmitt,2015) do not invalidate their use as proxies for the presence of law enforcement in the BrazilianAmazon, which essentially depends on the issuing � not the payment � of �nes.
16
Ibama holds a public electronic record of all environmental �nes issued in the
country, with �ne-level information on the type of infraction (enabling the distinction
between di�erent types of environmental occurrences), as well as its issue date (day,
month, and year) and location (municipality), among other administrative details.
Using this record, we build a panel containing the total count of deforestation-related
�nes issued in each municipality and each year.
4.3. DETER Cloud Coverage
Although DETER provides law enforcement with high-frequency information
on deforestation hot spots, the system's cloud coverage data are aggregated into
monthly georeferenced datasets for public release. In these datasets, areas that
are covered by clouds were blocked from view throughout the entire month (see
Figure 2).15 When visibility is at least partial, the monthly data show exactly which
areas were covered by clouds. When visibility is too precarious throughout the entire
month to derive any information about land cover, however, no data is produced
for that month � we follow INPE's recommendation and assume DETER cloud
coverage to be complete in this case. We use these spatial data to calculate the
monthly ratio of cloud coverage to municipal area, and average these municipality-
level ratios across each year to derive our instrument.
Although the earliest monthly DETER data are from the 2004 calendar year, the
DETER system remained in experimental phase halfway through the 2005 calendar
year. The benchmark sample therefore starts in 2006 (using data from August 2005
through July 2006) and follows through 2016, the latest year for which data were
available at the time the dataset was built. We use DETER cloud coverage data
from the early experimental phase in robustness exercises (see Section 6.2).
4.4. Controls
The benchmark set of controls contains variables that account for local
weather, PRODES satellite visibility, and agricultural commodity prices. First,
weather controls include measures of precipitation and temperature to address the
potential correlation between deforestation and regional microclimate (see
Section 3). This set of controls is critical to the validity of DETER cloud coverage
as an instrument for law enforcement, as it mitigates concerns regarding the
potential correlation between cloud coverage, local geographic characteristics, and
deforestation. We build our control variables from monthly gridded data on total
precipitation (Matsuura and Willmott, 2017b) and average air temperature
(Matsuura and Willmott, 2017a) interpolated to a 0.5◦ by 0.5◦ grid resolution.
15There are a few months for which the raw data contains biweekly, as opposed to monthly,information on DETER cloud coverage. In these cases, we follow INPE's recommendation andintersect the biweekly spatial data to identify areas that were blocked from view throughout theentire month.
17
Using this grid, we construct monthly measures for precipitation and temperature
in each municipality as follows: (i) for a municipality that intersects with at least
one grid node, we calculate total precipitation and average temperature across
nodes; (ii) for a municipality that does not intersect with any grid nodes, we
identify nodes that intersect with its 30km bu�er and calculate average
precipitation and average temperature across nodes; and (iii) for a municipality
that neither intersects nor has its 30km bu�er intersect with any grid nodes, we
identify nodes that intersect with its 60km bu�er and calculate average
precipitation and average temperature across nodes.16 Monthly values are then
added (precipitation) or averaged (temperature) to construct municipality-level
annual measures.
Second, satellite visibility controls account for areas that are blocked from view
in satellite imagery. Clouds, shadows cast by clouds, and smoke from forest �res
can all a�ect PRODES visibility. INPE publicly discloses annual municipality-level
information on these obstructions, classifying them as �cloud coverage� or
�non-observable areas� (the latter includes both shadows cast by clouds and smoke
from forest �res).17 We include the two ratios of PRODES obstructed to municipal
area in all regressions to control for measurement error, as well as to address
potential correlation between PRODES deforestation and the DETER cloud
coverage instrument.
Finally, the last set of controls account for agricultural commodity prices. As
these prices are endogenous to local agricultural production and thereby also to
local deforestation activity, we follow Assunção et al. (2015) to construct output
price series that capture exogenous variations in the demand for agricultural
commodities produced locally. The authors show that commodity prices recorded
by the Agriculture and Supply Secretariat of the State of Paraná (SEAB-PR)
closely correlates with average local agricultural prices for Amazon
municipalities.18 Select commodity prices cover beef cattle, as well as soybean,
cassava, rice, corn, and sugarcane to capture incentives for both cattle ranching
and crop farming activities.19 For each of the six commodities, we build an index
of real prices for the �rst and second semester of each calendar year.20 We start by
de�ating monthly nominal prices to year 2000 Brazilian currency, and averaging
16Bu�er distance is based on the grid size, with 30km being approximately equivalent to halfthe distance between grid nodes.
17In DETER raw data, all visual obstructions are recorded as cloud coverage.18Paraná is a non-Amazon state located in the far south of Brazil.19Soybean, cassava, rice, and corn systematically account for more than 84% of the planted area
in sample municipalities during the sample period. Although not present in the Amazon, sugarcaneis also included to address concerns regarding the expansion of sugarcane-based ethanol biofuelproduction in Brazil over the past decades.
20We use January through July of year t as the �rst semester of year t to more closely matchthe breaks in PRODES years, which end in July. August through December of year t make up thesecond semester of year t.
18
the de�ated monthly prices across semesters. To introduce cross-sectional variation
in the commodity price series, we weight the prices using a measure of that
commodity's relevance in each municipality in years immediately preceding the
sample period. The weighted real price for each commodity is therefore given by:
PWc,i,st = Pc,st ∗Wi,c (3)
where PWc,i,st is the weighted real price of commodity c in municipality i and
semester/year st; PPc,st is the real price of commodity c in semester/year t; and
Wi,c is the municipality/commodity-speci�c weight. For crops, the weight is given
by the 2004 through 2005 average ratio of farmland to municipal area for crop c in
municipality i, using annual data from Brazil's Municipal Crop Production Survey
(PAM/IBGE). For beef cattle, the weight is given by the 2004 through 2005
average ratio of heads of cattle to municipal area in municipality i, using data from
Brazil's Municipal Livestock Survey (PPM/IBGE). The set of agricultural
commodity price controls for year t includes prices for the �rst and second
semesters of calendar year t − 1, as well as prices for the �rst semester of calendar
year t.
4.5. Descriptive Statistics
Table 1 provides descriptive statistics for the analysis' main variables. It shows
that deforestation, law enforcement, and DETER cloud coverage exhibit
substantial variation both across and within sample years. The downward trend in
mean deforestation over time is consistent with a context in which forest clearing
was slowing down in the Brazilian Amazon as a whole. Figure 3 portrays the
deforestation slowdown alongside the trajectory for total annual �ne count,
o�ering some insight into the endogeneity that exists among the two. While the
sharp increase in the number of �nes issued through 2008 could be expected to
have contributed to the observed reduction in deforestation, lower forest clearing
rates imply a lower incidence of illegal clearings and, thus, lower �ne counts over
time. The proposed IV strategy aims at disentangling these e�ects to isolate the
impact of law enforcement on Amazon deforestation.
5. Results
This section presents the analysis' main results. It starts by providing empirical
evidence that DETER cloud coverage signi�cantly in�uenced environmental law
enforcement in the Brazilian Amazon. Drawing on this evidence as support for
using cloud coverage as an instrument for enforcement in this speci�c setting, it
then follows with the benchmark results, which indicate that environmental law
enforcement e�ectively curbed tropical deforestation. The section also explores
19
regional impacts of local enforcement, and looks into potential costs of enforcing
environmental law in the Amazon.
5.1. Law Enforcement and Deforestation
To be a valid instrument for environmental law enforcement in the Brazilian
Amazon, DETER cloud coverage must systematically a�ect enforcement outcomes.
We test whether this condition holds using the speci�cation from Equation (1), in
which the total number of �nes issued in each municipality and year serves as a
proxy for law enforcement. This exercise mirrors the �rst-stage regression of the
proposed instrumental variable (IV) strategy, but allows for the gradual inclusion
of relevant controls. Table 2 presents estimated OLS coe�cients. Column 1 starts
with the univariate regression; column 2 adds weather controls (precipitation and
temperature); column 3 adds satellite visibility controls (PRODES cloud coverage
and other non-observable areas); and column 4 adds municipality and year �xed
e�ects, as well as the set of agricultural commodity prices. The coe�cient of
interest � the e�ect of DETER cloud coverage on law enforcement � remains
negative and statistically signi�cant across speci�cations. Thus, for any given
Amazon municipality, years with greater DETER cloud coverage also saw laxer
environmental law enforcement, as proxied by a smaller number of �nes. These
results support the validity of the inclusion restriction imposed by the proposed IV
strategy.
Having provided empirical evidence that DETER cloud coverage systematically
a�ects environmental law enforcement targeting deforestation in the Brazilian
Amazon, we now explore this relationship in the IV speci�cation from
Equation (2). Table 3 presents estimated coe�cients using both OLS and 2SLS
estimators, as well as two alternative normalizations for the dependent variable
(two additional normalizations are discussed in Section 5.3). All speci�cations use
the full set of �xed e�ects (municipality, year) and controls (weather, satellite
visibility, agricultural commodity prices). Our main interest lies in the 2SLS
coe�cients (Panel A, even columns), which isolate the e�ect of law enforcement on
deforestation. OLS coe�cients (Panel A, odd columns) are reported for
comparative purposes only. They are all statistically insigni�cant and
point-estimates are virtually zero, suggesting that law enforcement does not
signi�cantly a�ect deforestation. This conclusion, however, does not hold, since
OLS yields biased estimators in the presence of reverse causality. In this setting,
because the OLS estimator is expected to be upward biased, the null coe�cients
reported in Table 3 suggest that estimation strategies that adequately tackle
endogeneity should yield smaller (negative) point estimates.
The proposed IV strategy was designed to address reverse causality between
law enforcement and deforestation. Second-stage 2SLS coe�cients (Table 3,
Panel A) are all negative and statistically signi�cant, indicating that the presence
20
of law enforcement in any given Amazon municipality and year led to a reduction
in total forest area cleared in that municipality the following year. This pattern
holds across normalizations for the dependent variable, so �ndings do not appear
to be driven by the choice of normalization procedure. We report second-stage
results for the remaining exercises using both log and inverse hyperbolic sine
transformations, and refer back to columns 2 and 4 as their respective benchmark
speci�cations. The log-level speci�cation provides a sense of the magnitude of the
e�ect. On average, reducing monitoring and law enforcement by half increases
municipal deforestation by an estimated 44% (= 1 − e(9.87/2)×0.0743). First-stage
2SLS results (Table 3, Panel B) support the use of DETER cloud coverage as an
instrument for law enforcement. In years with greater cloud coverage,
municipalities systematically saw a signi�cantly smaller number of �nes.
Estimated coe�cients show that, on average, an increase of one sample standard
deviation in DETER cloud coverage reduced the presence of law enforcement at
the municipal level by nearly 25% of the sample mean. These �ndings validate the
inclusion restriction. Finally, with a �rst-stage F-statistic greater than 10,
instrument strength is not a source of concern (Stock et al., 2002).
Results from Table 3 capture the paper's main �nding: IV estimation provides
empirical evidence that environmental law enforcement e�ectively curbed tropical
deforestation in the Brazilian Amazon from 2006 through 2016. The adoption of the
near-real-time monitoring system allowed law enforcement to more quickly detect
and react to illegal forest clearings, notably increasing enforcers' capacity to catch
o�enders red-handed (see Sections 2.2 and 2.3). As enforcement became more salient
to o�enders, who then faced a higher chance of getting caught and punished, they
updated their beliefs about the expected costs of engaging in the illegal activity.
The change in the perceived cost/bene�t of deforestation is the driving force behind
a deterrence mechanism � in light of higher expected costs, potential o�enders
rationally choose to refrain from engaging in the illegal activity. Additionally, in
being able to more quickly locate recent clearings, law enforcement o�cers could
also reach the clearing sites faster. This increased the chance that equipment used
for deforestation were still on-site and could be apprehended. The loss of such
capital goods, which were typically expensive and hard to replace, limited o�enders'
capacity to deforest in the near future. Our empirical strategy does not reveal which
of these underlying mechanisms drove the estimated impact of law enforcement of
deforestation, but DETER enhanced the potential for both. Hence, although we are
not able to disentangle the two channels in the analysis, both operate in the same
direction and likely contribute to our empirical results.
5.2. Spillovers
Thus far, the �nding that monitoring and law enforcement were e�ective at
curbing Amazon forest clearing refers solely to the direct policy impact, estimated
21
based on the e�ect of local (municipal) enforcement on local deforestation. Yet,
local interventions may also have had regional impacts. On the one hand, if law
enforcement o�cers were more present in a given municipality, clearings might have
fallen locally due to a redistribution of deforestation activity towards municipalities
where enforcement was not as salient. In this scenario, enforcement would displace
illegal clearings, but not actually contain them at the aggregate level. On the other
hand, the presence of enforcement o�cers in a given municipality might have led
potential o�enders in the whole region to update their beliefs about the probability
of being caught. In this case, local enforcement's impact on deforestation might not
have been restricted to the local level, having had a more widespread regional e�ect.
To investigate whether leakage or contagion occurred, we assess the e�ect of
municipal law enforcement on deforestation outcomes within the broader region of
a municipality's neighborhood. The 2SLS second-stage estimation equation builds
on Equation (2), but is now given by:
Deforestation∂i,t = δLawEnforcementi,t−1 +∑m
υm ~Xi,t+
+∑n
µn~W∂i,t + ψi + λt + ξi,t
(4)
where ∂i denotes a variable de�ned at the neighborhood level, such that
Deforestation∂i,t is a normalized measure of total deforested area in municipality
i's neighborhood and year t; ~Xi,t is a vector of m municipality-level controls
covering precipitation and temperature; and ~W∂i,t is a vector of n
neighborhood-level controls covering average precipitation, average temperature,
total PRODES clouds and other non-observable areas, average agricultural
commodity prices, and average DETER cloud coverage.21 All other terms are
de�ned as in Equation (2). Deforestation outcomes for the central municipality are
not included in this speci�cation's outcome of interest.
Table 4 presents estimated coe�cients using the following three alternative
de�nitions for a municipality's neighborhood: (i) all municipalities that share a
border (are contiguous) with the central municipality (columns 1 and 4); (ii) the
three municipalities that are nearest to the central municipality, where proximity is
based on the linear distance between municipalities' centroids (columns 2 and 5);
and (iii) all municipalities whose centroid lies within a 100km bu�er from the
central municipality (columns 3 and 6).22 Although the benchmark sample was
21Average neighborhood DETER cloud coverage is included to account for potential correlationbetween cloud coverage in the central municipality and cloud coverage in its neighborhood, whichcould a�ect enforcement outcomes in both the central municipality and its neighborhood.
22To account for spatial decay across larger distances, the construction of deforestation outcomesfor the bu�er-based de�nition weighs deforested area in each neighboring municipality by a factorof edistance×(−ln2
50 ), such that deforestation in a neighbor that is 50km away receives a weight of0.5.
22
preserved to ensure comparability across neighborhood and benchmark results,
some observations were lost due to limitations in data availability.23
The evidence appears to support that contagion, not leakage, occurred.
Estimated coe�cients are systematically negative and statistically signi�cant,
suggesting that the presence of law enforcers in a given municipality helped contain
forest clearings not only locally (within that municipality), but also regionally
(within its neighborhood). These results further indicate that the benchmark
estimated local impact of law enforcement on deforestation was not driven by
leakage of forest clearing activity into surrounding areas. Amazon monitoring and
law enforcement may therefore have had positive regional spillovers, but further
investigation is needed to attest to its magnitude and spatial characteristics.
Finding that leakage did not occur at a regional level is consistent with the
institutional context of Amazon monitoring and law enforcement (see Section 2).
Indeed, the very nature of the DETER system inhibits displacement of
deforestation activity. Continuous universal surveillance means that no area is
subject to less monitoring at any given time. As such, potential o�enders cannot
reasonably attribute a smaller chance of getting caught to any one area. Still,
because DETER's inability to detect land cover patterns beneath clouds is public
information, one might posit that o�enders could concentrate clearing activity in
areas more prone to cloud coverage. We argue this is an unlikely story. Amazon
cloud coverage is an inherently variable phenomenon, as evidenced by the
descriptive statistics in Table 1 and illustrated in Figure 2. High within-year
variation in cloud coverage means that clearings in most of the Amazon region are
not systematically hidden from view in the high-frequency monitoring system. If
an o�ender were to base his clearing decision on clouds, once they clear and
deforestation is detected by DETER, his activity could be targeted by law
enforcement. This is particularly relevant in a setting in which most deforestation
occurs to clear land for non-forest uses. Moreover, considering that clearing
tropical forest is both time-consuming and expensive, o�enders do not typically
leave recently cleared areas in the very short term � they need time to use the
land to collect the bene�ts from deforestation.
That being said, although short-term variation in cloud coverage would not
su�ce to evade monitoring, it signi�cantly a�ected the presence of law
enforcement. To reconcile these apparently contradictory notions, it is important
to recall two key points from the institutional context for Amazon monitoring and
law enforcement (see Section 2). First, the new monitoring system shed light on
23For the shared borders and proximity-based neighborhoods, one municipality is dropped fromthe sample because deforestation data are missing for all of its neighbors. For the bu�er-basedneighborhood, forty-six municipalities are dropped from the sample because their 100km bu�ersdo not intersect with any municipality centroids.
23
forest clearing activity that had remained hitherto unknown to law enforcement
authorities. As such, it had the capacity to reveal several new deforestation hot
spots and, over time, allow targeting of these areas. Second, cloud coverage played
a key role in determining how quickly law enforcement could reach new clearing
sites. This in�uenced enforcers' capacity to apply more or less binding
punishments, which, in turn, fed into o�enders' updated beliefs about the costs of
engaging in illegal clearings. Combined, these arguments point towards DETER
cloud coverage being su�ciently variable to be a poor long-term cover for illegal
forest clearings, but also su�ciently salient to signi�cantly impact the
on-the-ground presence of law enforcement.
5.3. Policy Costs
Monitoring and law enforcement appear to have been e�ective at curbing
deforestation in the Brazilian Amazon � but at what price? We explore two
potential dimensions: a direct cost, and an opportunity cost.
We start with an investigation of whether monitoring and law enforcement
e�orts were a cost-e�ective way of protecting the Amazon. We perform a
back-of-the-envelope cost-bene�t calculation to arrive at a simpli�ed answer.
Annual budgets for Ibama (USD 560 million) and INPE (USD 125 million) provide
an estimate for the total cost of both running the monitoring system and
implementing law enforcement.24 This is certainly an overestimate of the actual
cost of Amazon monitoring and law enforcement e�orts, because Ibama and INPE
were not exclusively dedicated to this endeavor.
To quantify the bene�ts of preserving the forest, we revisit our benchmark
speci�cation using a linear transformation to normalize deforestation.25 Table 5
presents estimated 2SLS coe�cients for two alternative linear normalizations: the
annual municipal deforestation increment as a share of municipal area (column 1);
and the annual municipal deforestation increment as a share of the 2002 through
2016 mean municipal deforestation increment (column 2). Coe�cients are
consistent with those from Table 3, reinforcing that our benchmark results are not
being driven by the choice of normalization procedure. These coe�cients provide a
measure of the average e�ect on deforestation of increasing the presence of law
enforcement in any given municipality. We use these estimates to simulate what
would have happened in two hypothetical scenarios: (i) one in which Amazon
monitoring and law enforcement have been entirely shut down, and (ii) another
one in which the novel satellite-based monitoring system was never adopted. We
build these scenarios empirically by setting the total number of �nes in each
24Information on annual budgets is not available for every sample year, so we resort to the actualbudgets in 2011 for both institutes as an approximation.
25Linearity is needed to enable the derivation of the expected value for deforestation in theproposed simulation (see Appendix A).
24
municipality to zero or pre-DETER (2002 through 2004 average �ne count) levels,
respectively, and simulating municipal deforestation outcomes under these
conditions. Figure 4 depicts total sample observed and simulated deforested areas,
showing that both scenarios yield systematically larger deforestation.26 From the
�rst scenario, if monitoring and law enforcement had been entirely shut down, the
Amazon would have seen 338 thousand km2 of cleared areas � almost �ve times
what was actually observed during the sample period. The second hypothetical
scenario sheds light on the relative contribution of DETER. If the new
satellite-based monitoring system had never been developed and law enforcement
had sustained its pre-DETER pattern, total sample deforestation would have
amounted to 279 thousand km2. Combined, these exercises point towards the
importance of correctly allocating � and not just intensifying � enforcement
e�orts. Accurate targeting of illegal activity was a crucial part of e�ective law
enforcement in the Brazilian Amazon.
Based on results from the �rst hypothetical scenario, monitoring and law
enforcement e�orts avoided the clearing of an average of 27 thousand km2 of
tropical forest per year. This is equivalent to avoiding the emission of nearly
1 billion tCO2 per year.27 Again, this is certainly an underestimate of the true
value of protecting the forest, as it focuses strictly on avoided emissions, and
doesn't account for several other environmental services the forest provides, such
as protection of biodiversity and hydrological resources (Stern, 2008; Watson et al.,
2018). Comparing the estimated annual costs (USD 685 million) and bene�ts
(1 billion tCO2), we arrive at a break-even price of USD 0.69/tCO2. Carbon prices
are currently rising, with about half of emissions now covered by carbon pricing
initiatives priced at over USD 10/tCO2e (World Bank et al., 2017) � well above
the break-even price calculated in our setting. Hence, the bene�ts of protecting the
forest more than compensate the costs of implementing Amazon monitoring and
law enforcement e�orts. This is particularly striking considering that our estimates
only capture a lower bound for this potential gain, as costs are overestimated and
bene�ts are underestimated. Overall, this exercise suggests that monitoring and
law enforcement were a cost-e�ective way of curbing Amazon deforestation.
Despite being �nancially viable, the Amazon monitoring and law enforcement
strategy might still have had relevant opportunity costs. There is an ongoing debate
among academics and policymakers regarding potential tensions between economic
growth and the conservation of natural resources. These concepts, however, need not
be mutually exclusive. Indeed, there is both anecdotal and causal evidence of cases
26Reported simulation outcomes are based on the municipal area normalization, but results areanalogous for the mean-based normalization and are available from the authors upon request.
27Conversion based on a factor of 10,000 tC/km2 (36,700 tCO2/km2), as determined by theBrazilian Ministry of the Environment (MMA, 2011).
25
in which environmental quality improved in tandem with economic development
(Arrow et al., 1995; Stern, 2004; Foster and Rosenzweig, 2003). Still, considering
that agricultural land covers a large share of deforested areas in the Amazon (see
Section 2.1), interventions that a�ect forest clearing practices might also in�uence
agricultural production.
In light of this, we explore the proposed IV strategy to investigate whether
law enforcement a�ected local agricultural production. Table 6 reports estimated
coe�cients for two di�erent measures of production: (i) municipal gross domestic
product (GDP) for the agricultural sector (Panel A, columns 1 and 2), which includes
both livestock- and crop-based activities; and (ii) municipal value of crop production
(Panel A, columns 3 and 4).28 Due to missing raw data on municipal value of crop
production for select municipalities and years, speci�cations that use crop value
as the dependent variable (columns 3 and 4) are estimated using an unbalanced
panel. Speci�cations that do not include agricultural price controls capture the
impact of law enforcement on value outcomes (columns 1 and 3), whereas those
that do include agricultural price controls capture the impact on quantum outcomes
(columns 2 and 4).
Results indicate that monitoring and law enforcement did not harm
agricultural production. If anything, they had a signi�cant positive impact on
production, with both value and quantum outcomes systematically improving in
municipalities with greater presence of law enforcement. Combined with our
benchmark results, this �nding indicates that monitoring and law enforcement
e�ectively contained Amazon deforestation without jeopardizing local agricultural
production. Looking at a broader historical and economic context for the Brazilian
Amazon can be insightful when interpreting these results. The region's long
history of insecure property rights has been associated with severe land tenure
uncertainty, particularly regarding the illegal squatting of both public and private
lands, and violent rural con�ict (Alston et al., 2000; Araujo et al., 2009; Chiavari
et al., 2016; Fetzer and Marden, 2017; Mueller, 2018). This contributes to
widespread informality in production. We speculate that, in this setting, the
increased presence of law enforcement may have helped boost production by
improving the local institutional environment. Alternatively, stricter monitoring
and law enforcement may have created an incentive for producers to increase
productivity, as opposed to expanding production along extensive margins.
Although this exercise sheds light on a currently salient debate about
conservation policy and economic development, an important caveat is in place.
By construction, the analysis' dependent variables only measure formal
28The municipal GDP series is available from IBGE; the municipal value of crop productionseries is available in PAM/IBGE. Although IBGE also conducts an annual survey on livestock, itprovides no information on value of production for beef cattle.
26
agricultural production, so results fail to capture potential impacts on informal
production. On the one hand, informal producers may have responded to law
enforcement by shifting from a low-productivity setup to a more productive one,
essentially compensating production that was lost at the extensive margin for that
gained at the intensive margin. On the other hand, they may have ceased to
produce entirely, with relevant consequences for individual or regional well-being.
An analysis capable of assessing these impacts � on the informal sector,
subsistence agriculture, and individual-level production � might yield di�erent
conclusions to those drawn from Table 6. To the best of our knowledge, no data is
currently available for conducting such analysis at scale.
6. Robustness Checks
The set of results presented in Section 5 indicate that the monitoring and law
enforcement strategy for combating Amazon deforestation e�ectively curbed tropical
clearings. In addition to its e�ectiveness, the policy does not appear to have had
negative collateral e�ects, neither displacing clearings to neighboring regions within
the Amazon, nor imposing unfavorable policy costs. We now subject this main
�nding to a series of robustness checks
6.1. Baseline Di�erences
The paper's identi�cation strategy partly depends on valid comparability
across municipalities after controlling for relevant observable characteristics and
municipality and year �xed e�ects. This comparability might not hold if included
controls and �xed e�ects do not adequately account for baseline di�erences that
set municipalities on di�erent deforestation paths. We consider three scenarios
where this might be a source of concern, and test whether results are robust to the
inclusion of scenario-speci�c linear time trends.
First, when the new monitoring system was implemented, remaining forest
cover varied signi�cantly across Amazon municipalities. Such variation could a�ect
deforestation trends, since the forest area available for clearing within a
municipality mechanically decreases with decreasing forest cover.29 To control for a
trend determined by baseline accumulated deforestation, the saturated robustness
speci�cation builds on the benchmark speci�cation from Equation (2), but also
includes an interaction between a linear year trend and accumulated deforested
area in 2003 (pre-DETER) as a share of municipal area. Second, deforestation
levels at baseline could be associated with forest clearing patterns during the
29In addition to being correlated with future deforestation increments, accumulated deforestedarea might also correlate with local micro-climate (see Section 3). Thus, the robustness speci�cationthat controls for baseline accumulated deforested area also addresses concerns about the validityof the exclusion restriction.
27
sample period. If more dynamic municipalities in the Amazon have more intense
clearing activity and are thereby subject to greater deforestation pressures,
di�erences in current deforestation could determine di�erent clearing trends over
time. Whereas the �rst scenario looks at the stock of deforested areas, this second
scenario considers the �ow of deforestation at baseline. Its robustness speci�cation
is analogous to that of the �rst scenario, but includes an interaction between a
linear year trend and the 2003 (pre-DETER) deforestation increment.30 Third, the
baseline distribution of law enforcement could impact local deforestation trends,
particularly in a setting in which enforcement has been shown to e�ectively
contain forest clearings. The last robustness speci�cation in this exercise is, again,
analogous to the two previous ones, but includes an interaction between a linear
year trend and the 2002 through 2004 average municipal �ne count.
Table 7 presents estimated 2SLS coe�cients for the three speci�cations, and
also replicates benchmark results for comparison. If the paper's main �ndings had
been driven by the convergence in deforestation activity between municipalities
with either varying stocks of deforested areas, di�erent economic dynamics and
deforestation pressures, or shifts in the distribution of law enforcement, adding the
linear time trends to the benchmark speci�cation should have returned
insigni�cant estimated coe�cients for law enforcement. Instead, second-stage
coe�cients remain negative and statistically signi�cant across speci�cations, and
�rst-stage results hold in terms of coe�cient sign and signi�cance, as well as of
instrument strength. Table 7 therefore attests to the robustness of monitoring and
law enforcement's capacity to have e�ectively curbed Amazon deforestation.
6.2. Sample Composition
Spatially, construction of the benchmark sample entails virtually no selection
other than deforestation data availability and time-series variation (see Section 4).
Moreover, it includes all Amazon biome municipalities meeting this selection
criteria, so it has universal coverage of the relevant geographical region. The
benchmark sample contains a high degree of variability in municipal forest cover,
including municipalities with a relatively small share of forest at baseline.
Deforestation dynamics speci�c to regions with little remaining forest cover could
be driving the paper's main �ndings, and thereby contributing to a
misinterpretation of results. More intense clearing activity in any place and time
mechanically implies that less forest is available for clearing in that same place in
the future. Thus, if increased clearing is also associated with greater presence of
law enforcement in a given municipality, the estimated impact of lagged
enforcement on current deforestation could have been driven, at least in part, by
30The test for the second scenario also captures potential e�ects from baseline di�erences ininfrastructure across municipalities, such as road networks, that might determine future localforest clearing dynamics.
28
this mechanical reduction in the availability of forest areas. To mitigate concerns
about mechanical reductions in cleared areas, this exercise assesses the impact of
law enforcement on deforestation strictly in municipalities that contained a
relatively large amount of forest cover at baseline. Table 8 presents estimated
2SLS coe�cients for the benchmark speci�cation using a restricted sample of
municipalities containing an above-median ratio of forest to municipal area at
baseline. Results are robust to the sample restriction, with estimated coe�cients
remaining negative and statistically signi�cant across speci�cations.
Temporally, construction of the benchmark sample also entails little selection.
Although the earliest DETER data refer to 2005, the DETER system remained in
testing phase until 2006, when it became fully operational (see Section 4.3). The
benchmark sample therefore starts in 2006 and follows through 2016, the latest year
for which data were available at the time of dataset construction. As a second test of
robustness to sample composition, Table 8 presents estimated 2SLS coe�cients for
the benchmark speci�cation using an extended sample that covers the 2005 through
2016 period. Despite noisier DETER data for 2005, results indicate that the impact
of law enforcement on deforestation remains robust to the inclusion of information
from DETER's test phase.
6.3. Control Variables
The last set of robustness checks tests whether the paper's main results are
sensitive to changes in the benchmark control variables. First, we consider the
inclusion of additional controls for Amazon conservation policies that were
implemented alongside monitoring and law enforcement. Two such policies stand
out due to their close relationship with observed levels of deforestation: the
expansion and targeted allocation of protected areas, and the listing of priority
municipalities. As part of the novel action plan to tackle Amazon deforestation,
Brazil introduced a new siting strategy for protected territory. In addition to
maintaining ecological and biological criteria, siting was henceforth also
determined based on regional deforestation pressures. New protected areas were
meant to serve as shields to advancing deforestation, so protection tended to
increase in regions where forest clearing was particularly intense (Gandour,
2018).31 Furthermore, as of 2008, Brazil annually published a list of Amazon
municipalities with a recent history of intense forest clearing activity. Listed
municipalities were classi�ed as in need of priority action to combat illegal
deforestation, and could only be unlisted upon demonstrating signi�cant
reductions in forest clearing. Priority municipalities could be subjected to
31Protection has been shown to be an e�ective way of locally holding back deforestation in theAmazon, but there is still an ongoing debate about the magnitude of this e�ect at more aggregatelevels, particularly considering the scope for spatial leakage (Nolte et al., 2013; Pfa� et al., 2014;Gandour, 2018; Herrera et al., 2019; Amin et al., 2019).
29
di�erentiated monitoring and law enforcement strategies, as well as to stricter
administrative measures like harsher licensing requirements for private
landholdings and economic sanctions from players in commodity supply-chains.32
Both protected territory and priority municipalities policies might have a�ected
deforestation outcomes in sample municipalities.
Protected territory controls are built from georeferenced data on protected
areas provided by the Brazilian National Registry for Conservation Units (CNUC,
2018), as well as from georeferenced data on indigenous lands provided by the
Brazilian National Native Foundation and the Socio-Environmental Institute (ISA,
2016; FUNAI, 2018). These datasets contain information on the date each territory
was granted protection, enabling the construction of a spatial panel. Priority
municipality controls are built from information contained in each of the Ministry
of the Environment's annual listings of municipalities that were attributed priority
status or removed from the blacklist. Table 9 presents estimated 2SLS coe�cients
for the benchmark speci�cation adding controls for protected territory (annual
ratio of protected to municipal area) and priority municipalities (annual indicator
of priority status). The positive and signi�cant coe�cient for protection likely
re�ects the practice of allocating protected areas in places heavily a�ected by
forest clearings. The coe�cient for priority municipalities is statistically
insigni�cant, suggesting that the e�ect of priority status on deforestation operates
via a law enforcement mechanism, as found by Assunção and Rocha (2019). The
impact of law enforcement on deforestation remains robust, and is even slightly
larger after the inclusion of the conservation policy controls.
Finally, in the last robustness exercise, we test whether the paper's main results
hold when using alternative weather controls. Precipitation and temperature are
specially relevant in this empirical setting, because they play a key role in ensuring
the instrument meets the necessary exclusion restriction (see Section 3). Weather
datasets compiled from information collected at ground stations can carry
inaccurate measures of actual weather, particularly in areas with low station
density like the Brazilian Amazon. Climate scientists have attempted to mitigate
this by using a variety of geographical interpolations to construct grid node-level
data from ground stations. Still, if these gridded datasets are sensitive to the
speci�c interpolation technique adopted in their construction, empirical results
derived using these datasets might, too, vary with the choice of weather data. The
economic literature typically addresses this concern by subjecting results to
robustness tests using alternative datasets for weather variables (Dell et al., 2014).
32A number of studies document that the policy contributed to reduce deforestation in listedmunicipalities, but the literature is yet to reach a consensus about the mechanism through whichit operated (Arima et al., 2014; Cisneros et al., 2015; Assunção et al., 2019b; Assunção and Rocha,2019).
30
Table 10 presents estimated 2SLS coe�cients for the benchmark speci�cation
using di�erent combinations of benchmark and alternative datasets for precipitation
and temperature variables. The benchmark controls are constructed using monthly
average air temperature and total precipitation interpolated to a 0.5◦ by 0.5◦ grid
resolution (Matsuura and Willmott, 2017b,a). These datasets have been extensively
used in the economic literature both to evaluate the impact of weather variables on
economic outcomes, and to provide relevant precipitation and temperature controls
(Jones and Olken, 2010; Dell et al., 2012). The alternative datasets are both provided
by the National Oceanic and Atmospheric Administration (NOAA) from the U.S.
Department of Commerce. The Climate Prediction Center (CPC) dataset contains
daily information on precipitation and maximum/minimum temperature registered
by ground stations and interpolated to a 0.5◦ by 0.5◦ grid resolution (NOAA-CPC,
2018a; 2018b). The National Centers for Environmental Prediction (NCEP) dataset
contains monthly information on average precipitation derived from reanalysis and
recorded at a 2.5◦ by 2.5◦ grid resolution (NOAA-NCEP, 2019). Alternative weather
controls are constructed in the likeness of benchmark controls (see Section 4.4).
The table shows that the paper's main results were not driven by our choice our
benchmark weather datasets, with estimated coe�cients remaining robust in terms
of both magnitude and statistical signi�cance.
7. Final Comments
The analysis yields important policy implications. Results indicate that
monitoring and law enforcement e�orts were e�ective in curbing Amazon
deforestation, helping protect a substantial amount of tropical forest. The
magnitude of the estimated impact, combined with the favorable cost-bene�t
assessment, reinforce the case for maintaining and strengthening command and
control strategies to protect vegetation in settings with pervasive illegal
deforestation. Yet, the results also tell a broader story � one that is not restricted
to the monitoring of tropical forest clearings. This is a story of how a developing
country devised a new way of using technology in its favor, and thereby
signi�cantly leveraged its capacity to enforce environmental regulation in spite of
its weak institutional environment. At a time when the world's future well-being
largely hinges on developing countries' ability to enact and enforce e�ective
environmental regulation to tackle the threats associated with climate change
(Greenstone and Jack, 2015), Brazil's experience with satellite monitoring of
tropical forests serves as an encouraging example of how innovation can enhance
policy.
31
A. Expected Value for Deforestation
Rewrite the benchmark speci�cation (Equation 2, Section 3) as:
yi,t = δLawEnforcementi,t−1 +∑k
θk ~Xi,t + ψi + λt + ξi,t, (5)
where yi,t is normalized deforestation. In a counterfactual scenario where law
enforcement is di�erent to that which was observed, the expected di�erence
between simulated (abbreviated as sim) and observed normalized deforestation is
given by:
E[yi,t|sim − yi,t] = δ̂LawEnforcementi,t−1|sim +∑
k θ̂k~Xi,t + ψi + λt +
−(δ̂LawEnforcementi,t−1 +∑
k θ̂k~Xi,t + ψi + λt)
= δ̂(LawEnforcementi,t−1|sim − LawEnforcementi,t−1).
For the linear transformation in which annual municipal deforestation (defi,t) is
divided by a municipality-speci�c constant (µi), this di�erence is given by:
E[defi,tµi
∣∣∣sim− defi,t
µi
]= δ̂(LawEnforcementi,t−1|sim − LawEnforcementi,t−1)
E[defi,t|sim − defi,t
µi
]= δ̂(LawEnforcementi,t−1|sim − LawEnforcementi,t−1)
E[defi,t|sim − defi,t] = µi × δ̂(LawEnforcementi,t−1|sim − LawEnforcementi,t−1).
32
References
Alston, L. J., Libecap, G. D., and Mueller, B. (2000). Land Reform Policies, the Sources of ViolentCon�ict, and Implications for Deforestation in the Brazilian Amazon. Journal of EnvironmentalEconomics and Management, 39(2):162�188.
Alston, L. J. and Mueller, B. (2010). Property Rights, Land Con�ict and Tenancy in Brazil. NBERWorking Paper 15771.
Amin, A., Choumert-Nkolo, J., Combes, J.-L., Combes Motel, P., Kéré, E. N., Ongono-Olinga,J.-G., and Schwartz, S. (2019). Neighborhood e�ects in the Brazilian Amazônia: Protectedareas and deforestation. Journal of Environmental Economics and Management, 93:272�288.
Angelsen, A. and Kaimowitz, D. (1999). Rethinking the Causes of Deforestation: Lessons fromEconomic Models. World Bank Research Observer, 14:73�98.
Aragão, L. E. O. C., Malhi, Y., Barbier, N., Lima, A., Shimabukuro, Y., Anderson, L., andSaatchi, S. (2008). Interactions between rainfall, deforestation and �res during recent years inthe Brazilian Amazonia. Philosophical Transactions of the Royal Society of London B: BiologicalSciences, 363(1498):1779�1785.
Araujo, C., Bonjean, C. A., Combes, J.-L., Combes Motel, P., and Reis, E. J. (2009). Propertyrights and deforestation in the Brazilian Amazon. Ecological Economics, 68:2461�2468.
Arima, E. Y., Barreto, P., Araújo, E., and Soares-Filho, B. (2014). Public policies can reducetropical deforestation: Lessons and challenges from Brazil. Land Use Policy, 41:465�473.
Arrow, K., Bolin, B., Costanza, R., Dasgupta, P., Folke, C., Holling, C. S., Jansson, B. O., Levin,S., Mäler, K. G., Perrings, C., and Pimentel, D. (1995). Economic Growth, Carrying Capacity,and the Environment. Science, 268(5210):520�520.
Ashraf, N., Glaeser, E. L., and Ponzetto, G. A. M. (2016). Infrastructure, Incentives, andInstitutions. American Economic Review, 106(5):77�82.
Assunção, J., Gandour, C., and Rocha, R. (2015). Deforestation slowdown in the Brazilian Amazon:prices or policies? Environment and Development Economics, 20(6):692�722.
Assunção, J., Gandour, C., Rocha, R., and Rocha, R. (2019a). The E�ect of Rural Credit onDeforestation: Evidence from the Brazilian Amazon. The Economic Journal. Forthcoming.
Assunção, J., McMillan, R., Murphy, J., and Souza-Rodrigues, E. (2019b). Optimal EnvironmentalTargeting in the Amazon Rainforest. NBER Working Paper No. 25636.
Assunção, J. and Rocha, R. (2019). Getting greener by going black: the e�ect of blacklistingmunicipalities on Amazon deforestation. Environment and Development Economics, 24:115�137.
Azevedo-Ramos, C. and Moutinho, P. (2018). No man's land in the Brazilian Amazon: Couldundesignated public forests slow Amazon deforestation? Land Use Policy, 73:125�127.
Bagley, J. E., Desai, A. R., Harding, K. J., Snyder, P. K., and Foley, J. A. (2014). Droughtand Deforestation: Has Land Cover Change In�uenced Recent Precipitation Extremes in theAmazon? Journal of Climate, 27:345�361.
Banerjee, A. V., Glennerster, R., and Du�o, E. (2008). Putting a Band-Aid on a Corpse: Incentivesfor Nurses in the Indian Public Health Care System. Journal of the European EconomicAssociation, 6:487�500.
Bertrand, M., Du�o, E., and Mullainathan, S. (2004). How Much Should We Trust Di�erences-in-Di�erences Estimates? The Quarterly Journal of Economics, 119(1):249�275.
Blattman, C., Green, D. P., Ortega, D., and Tobon, S. (2019). Place Based Interventions at Scale:The Direct and Spillover E�ects of Policing and City Services on Crime. Working paper availableat SSRN: https://ssrn.com/abstract=3050823 or http://dx.doi.org/10.2139/ssrn.3050823.
33
Börner, J., Wunder, S., Wertz-Kanounniko�, S., Hyman, G., and Nascimento, N. (2014). Forestlaw enforcement in the Brazilian Amazon: Costs and income e�ects. Global EnvironmentalChange, 29:294�305.
Brasil, Presidência da República, Casa Civil (1998). Law No. 9,605 from February 12, 1998. Lawof Environmental Crimes.
Burgess, R., Costa, F., and Olken, B. (2019). The Brazilian Amazon's Double Reversal of Fortune.Working paper.
Burgess, R., Hansen, M., Olken, B. A., Potapov, P., and Sieber, S. (2012). The Political Economyof Deforestation in the Tropics. The Quarterly Journal of Economics, 127(4):1707�1754.
Burke, M., Craxton, M., Kolstad, C. D., Onda, C., Allcott, H., Baker, E., Barrage, L., Carson, R.,Gillingham, K., Gra�-Zivin, J., Greenstone, M., Heal, G., Hsiang, S., Jones, B., Kelly, D. L.,Kopp, K., Kotchen, M., Mendelsohn, R., Meng, K., Metcalf, G., Moreno-Cruz, J., Pindyck, R.,Rose, S., Rudik, I., Stock, J., and Tol, R. S. J. (2016). Opportunities for advances in climatechange economics. Science, 352:292�293.
Cadastro Nacional de Unidade de Conservação (CNUC) (2018). Unidades de Conservação[database]. Technical report, Cadastro Nacional de Unidade de Conservação, Ministério doMeio Ambiente. Retrieved from http://mapas.mma.gov.br/i3geo/datadownload.htm# onJan. 2018.
Chal�n, A. and McCrary, J. (2017). Criminal Deterrence: A Review of the Literature. Journal ofEconomic Literature, 55(1):5�48.
Chay, K. Y. and Greenstone, M. (2005). Does Air Quality Matter? Evidence from the HousingMarket. Journal of Political Economy, 113(2):376�424.
Chiavari, J. and Lopes, C. L. (2015). Brazil's New Forest Code: Part I � How to Navigate theComplexity. Policy Brief, Climate Policy Initiative / INPUT .
Chiavari, J., Lopes, C. L., Marques, D., Antonaccio, L., and Braga, N. (2016). Panorama dosDireitos de Propriedade no Brasil Rural: Legislação, Gestão Fundiária e Código Florestal.Technical report, Climate Policy Initiative.
Chimelli, A. B. and Soares, R. R. (2017). The Use of Violence in Illegal Markets: Evidence fromMahogany Trade in the Brazilian Amazon. American Economic Journal: Applied Economics,9(4):30�57.
Chomitz, K. M. and Thomas, T. S. (2003). Determinants of Land Use in Amazônia: A Fine-ScaleSpatial Analysis. American Journal of Agricultural Economics, 85:1016�1028.
Cisneros, E., Zhou, S. L., and Börner, J. (2015). Naming and Shaming for Conservation: Evidencefrom the Brazilian Amazon. PLoS ONE, 10(9):e0136402.
Dell, M., Jones, B. F., and Olken, B. A. (2012). Temperature Shocks and Economic Growth:Evidence from the Last Half Century. American Economic Journal: Macroeconomics, 4(3):66�95.
Dell, M., Jones, B. F., and Olken, B. A. (2014). What Do We Learn from the Weather? The NewClimate-Economy Literature. Journal of Economic Literature, 52(3):740�798.
Di Tella, R. and Schargrodsky, E. (2004). Do Police Reduce Crime? Estimates Using the Allocationof Police Forces After a Terrorist Attack. American Economic Review, 94(1):115�133.
Draca, M., Machin, S., and Witt, R. (2011). Panic on the Streets of London: Police, Crime, andthe July 2005 Terror Attacks. American Economic Review, 101(5):2157�2181.
Du�o, E., Greenstone, M., Pande, R., and Ryan, N. (2013). Truth-telling by Third-party Auditorsand the Response of Polluting Firms: Experimental Evidence from India. The Quarterly Journalof Economics, 128:1499�1545.
34
Fetzer, T. and Marden, S. (2017). Take What You Can: Property Rights, Contestability andCon�ict. Economic Journal, 127:757�783.
Foster, A. D. and Rosenzweig, M. R. (2003). Economic Growth and the Rise of Forests. TheQuarterly Journal of Economics, 118(2):601�637.
Fundação Nacional do Índio (FUNAI) (2018). Terras Indígenas [database]. Technical report,Fundação Nacional do Índio, Ministério da Justiça. Retrieved from http://www.funai.gov.
br/index.php/shape on Jan. 2018.
Gandour, C. (2018). Forest Wars: A Trilogy on Combating Deforestation in the Brazilian Amazon.PhD thesis, Economics Department, Pontifícia Universidade Católica do Rio de Janeiro (PUC-Rio).
Godar, J., Tizado, E. J., and Pokorny, B. (2012). Who is responsible for deforestation in theAmazon? A spatially explicit analysis along the Transamazon Highway in Brazil. Forest Ecologyand Management, 267:58�73.
Gray, W. B. and Shimshack, J. P. (2011). The E�ectiveness of Environmental Monitoring andEnforcement: A Review of the Empirical Evidence. Review of Environmental Economics andPolicy, 5:3�24.
Greenstone, M. (2002). The Impacts of Environmental Regulations on Industrial Activity:Evidence from the 1970 and 1977 Clean Air Act Amendments and the Census of Manufactures.Journal of Political Economy, 110(6):1175�1219.
Greenstone, M. and Hanna, R. (2014). Environmental Regulations, Air and Water Pollution, andInfant Mortality in India. American Economic Review, 104(10):3038�3072.
Greenstone, M. and Jack, B. K. (2015). Envirodevonomics: A Research Agenda for an EmergingField. Journal of Economic Literature, 53(1):5�42.
Hansen, M. C. and DeFries, R. S. (2004). Detecting Long-term Global Forest Change UsingContinuous Fields of Tree-Cover Maps from 8-km Advanced Very High Resolution Radiometer(AVHRR) Data for the years 1982�99. Ecosystems, 7:695�716.
Hansen, M. C., Stehman, S. V., Potapov, P. V., Loveland, T. R., Townshend, J. R. G., DeFries,R. S., Pittman, K. W., Arunarwati, B., Stolle, F., Steininger, M. K., Carroll, M., and Dimiceli,C. (2008). Humid tropical forest clearing from 2000 to 2005 quanti�ed by using multitemporaland multiresolution remotely sensed data. Proceedings of the National Academy of Sciences ofthe United States of America, 105(27):9439�44.
Hargrave, J. and Kis-Katos, K. (2013). Economic Causes of Deforestation in the Brazilian Amazon:A Panel Data Analysis for the 2000s. Environmental and Resource Economics, 54:471�494.
Herrera, D., Pfa�, A., and Robalino, J. (2019). Impacts of protected areas vary with the levelof government: Comparing avoided deforestation across agencies in the Brazilian Amazon.Proceedings of the National Academy of Sciences, 116(30):14916�14925.
Instituto Nacional de Pesquisas Espaciais (INPE) (2013). Metodologia para o Cálculo da TaxaAnual de Desmatamento na Amazônia Legal. Technical report, Instituto Nacional de PesquisasEspaciais, Ministério da Ciência e Tecnologia. Original text by Gilberto Câmara, Dalton deMorisson Valeriano, and João Vianei Soares (Sep/2006). Revised by Marisa da Mota (Apr/2010)and Luis Maurano (Oct/2013).
Instituto Nacional de Pesquisas Espaciais (INPE) (2017). Projeto PRODES � Monitoramento daFloresta Amazônica Brasileira por Satélite [database]. Technical report, Coordenação-Geralde Observação da Terra, Instituto Nacional de Pesquisas Espaciais, Ministério da Ciência,Tecnologia e Inovação. Retrieved from http://www.obt.inpe.br/prodes/index.php on Nov.2017.
35
Instituto Nacional de Pesquisas Espaciais (INPE) & Empresa Brasileira de Pesquisa Agropecuária(Embrapa) (2016). TerraClass Amazônia [database]. Technical report, Instituto Nacional dePesquisas Espaciais, Ministério da Ciência, Tecnologia e Inovação and Empresa Brasileira dePesquisa Agropecuária, Ministério da Agricultura, Pecuária e Abastecimento. Retrieved fromhttp://www.inpe.br/cra/projetos_pesquisas/terraclass2014.php on Aug. 2016.
Instituto Socioambiental (ISA) (2016). De Olho nas Terras Indígenas [database]. Technical report,Instituto Socioambiental. Retrieved from http://ti.socioambiental.org/ on Apr. 2016.
IPCC (2007). Climate Change 2007. Synthesis Report, Intergovernmental Panel on ClimateChange.
Jones, B. F. and Olken, B. A. (2010). Climate Shocks and Exports. American Economic Review:Papers & Proceedings, 100(2):454�459.
Keiser, D. A. and Shapiro, J. S. (2019). Consequences of the Clean Water Act and the Demandfor Water Quality. The Quarterly Journal of Economics, 134:349�396.
Klick, J. and Tabarrok, A. (2005). Using Terror Alert Levels to Estimate the E�ect of Police onCrime. The Journal of Law and Economics, 48(1):267�279.
Levitt, S. D. (1997). Using Electoral Cycles in Police Hiring to Estimate the E�ect of Police onCrime. American Economic Review, 87(3):270�290.
Levitt, S. D. (2002). Using Electoral Cycles in Police Hiring to Estimate the E�ects of Police onCrime: Reply. American Economic Review, 92(4):1244�1250.
Matsuura, K. and Willmott, C. J. (2017a). Terrestrial Air Temperature: 1900-2017Gridded Monthly Time Series (Version 5.01) [database]. Technical report, Universityof Delaware. Retrieved from http://climate.geog.udel.edu/~climate/html_pages/
Global2017/GlobalTsT2017.html on Mar. 2019.
Matsuura, K. and Willmott, C. J. (2017b). Terrestrial Precipitation: 1900-2017 Gridded MonthlyTime Series (Version 5.01) [database]. Technical report, University of Delaware. Retrievedfrom http://climate.geog.udel.edu/~climate/html_pages/Global2017/GlobalTsP2017.
html on Mar. 2019.
McCrary, J. (2002). Using Electoral Cycles in Police Hiring to Estimate the E�ect of Police onCrime: Comment. American Economic Review, 92(4):1236�1243.
Michalski, F., Metzger, J. P., and Peres, C. A. (2010). Rural property size drives patterns of uplandand riparian forest retention in a tropical deforestation frontier. Global Environmental Change,20:705�712.
Ministério do Meio Ambiente (MMA) (2011). Nota Técnica n.22 / 2011 / DPCD / SECEX.Technical note, Departamento de Políticas para o Combate ao Desmatamento, Ministério doMeio Ambiente.
Mueller, B. (2018). Property Rights Implications for the Brazilian Forest Code. Revista deEconomia e Sociologia Rural, 56(2):329�346.
National Oceanic and Atmospheric Administration, Climate Prediction Center (NOAA-CPC)(2018a). CPC Global Daily Temperature [database]. Technical report, National Oceanicand Atmospheric Administration, Oceanic and Atmospheric Research, Earth System ResearchLaboratory, Physical Sciences Division, Climate Prediction Center. Retrieved from https:
//www.esrl.noaa.gov/psd/data/gridded/data.cpc.globalprecip.html on Jun. 2018.
National Oceanic and Atmospheric Administration, Climate Prediction Center (NOAA-CPC)(2018b). CPC Global Uni�ed Gauge-Based Analysis of Daily Precipitation [database]. Technicalreport, National Oceanic and Atmospheric Administration, Oceanic and Atmospheric Research,Earth System Research Laboratory, Physical Sciences Division, Climate Prediction Center.Retrieved from https://www.esrl.noaa.gov/psd/data/gridded/data.cpc.globalprecip.
html on May 2018.
36
National Oceanic and Atmospheric Administration, National Centers for Environmental Prediction(NOAA-NCEP) (2019). NCEP-DOE Reanalysis 2: Surface Grids [database]. Technical report,National Oceanic and Atmospheric Administration, Oceanic and Atmospheric Research, EarthSystem Research Laboratory, Physical Sciences Division, National Centers for EnvironmentalPrediction. Retrieved from https://www.esrl.noaa.gov/psd/data/gridded/data.ncep.
reanalysis2.surface.html on Apr. 2019.
Negri, A. J., Adler, R. F., Xu, L., and Surratt, J. (2004). The Impact of Amazonian Deforestationon Dry Season Rainfall. Journal of Climate, 17:1306�1319.
Nobre, C. A., Sellers, P. J., and Shukla, J. (1991). Amazonian Deforestation and Regional ClimateChange. Journal of Climate, (10):957�988.
Nolte, C., Agrawal, A., Silvius, K. M., and Soares-Filho, B. S. (2013). Governance regime andlocation in�uence avoided deforestation success of protected areas in the Brazilian Amazon.Proceedings of the National Academy of Sciences, 110(13):4956�4961.
Nordhaus, W. (2019). Climate Change: The Ultimate Challenge for Economics. AmericanEconomic Review, 109(6):1991�2014.
Pfa�, A., Robalino, J., Lima, E., Sandoval, C., and Herrera, L. D. (2014). Governance, Locationand Avoided Deforestation from Protected Areas: Greater Restrictions Can Have Lower Impact,Due to Di�erences in Location. World Development, 55:7�20.
Pfa�, A. S. P. (1999). What Drives Deforestation in the Brazilian Amazon? Evidence from Satelliteand Socioeconomic Data. Journal of Environmental Economics and Management, 37:26�43.
Schmitt, J. (2015). Crime sem castigo: a efetividade da �scalização ambiental para o controledo desmatamento ilegal na Amazônia. PhD thesis, Centro de Desenvolvimento Sustentável,Universidade de Brasília, Brasília, DF.
Shimshack, J. P. and Ward, M. B. (2005). Regulator reputation, enforcement, and environmentalcompliance. Journal of Environmental Economics and Management, 50:519�540.
Souza-Rodrigues, E. (2019). Deforestation in the Amazon: A Uni�ed Framework for Estimationand Policy Analysis. The Review of Economic Studies. Forthcoming.
Stern, D. I. (2004). The Rise and Fall of the Environmental Kuznets Curve. World Development,32(8):1419�1439.
Stern, N. (2008). The Economics of Climate Change. American Economic Review, 98(2):1�37. Papers and Proceedings of the One Hundred Twentieth Annual Meeting of the AmericanEconomic Association.
Stock, J. H., Wright, J. H., and Yogo, M. (2002). A Survey of Weak Instruments and WeakIdenti�cation in Generalized Method of Moments. Journal of Business and Economic Statistics,20(4):518�529.
Tanaka, S. (2015). Environmental regulations on air pollution in China and their impact on infantmortality. Journal of Health Economics, 42:90�103.
United Nations Institute for Training and Research (UNITAR) (2016). UNOSAT SummaryReport: Satellite-Based Damage Assessment of Cultural Heritage Sites. Technicalreport, United Nations. Retrieved from http://unosat.web.cern.ch/unosat/unitar/
publications/chs-2015/Full_CHS_Report.pdf in Jul. 2019.
United Nations Institute for Training and Research (UNITAR) (2019). Website: OperationalSatellite Applications Programme � UNOSAT. Technical report, United Nations. Retrievedfrom https://unitar.org/unosat/ in Jul. 2019.
37
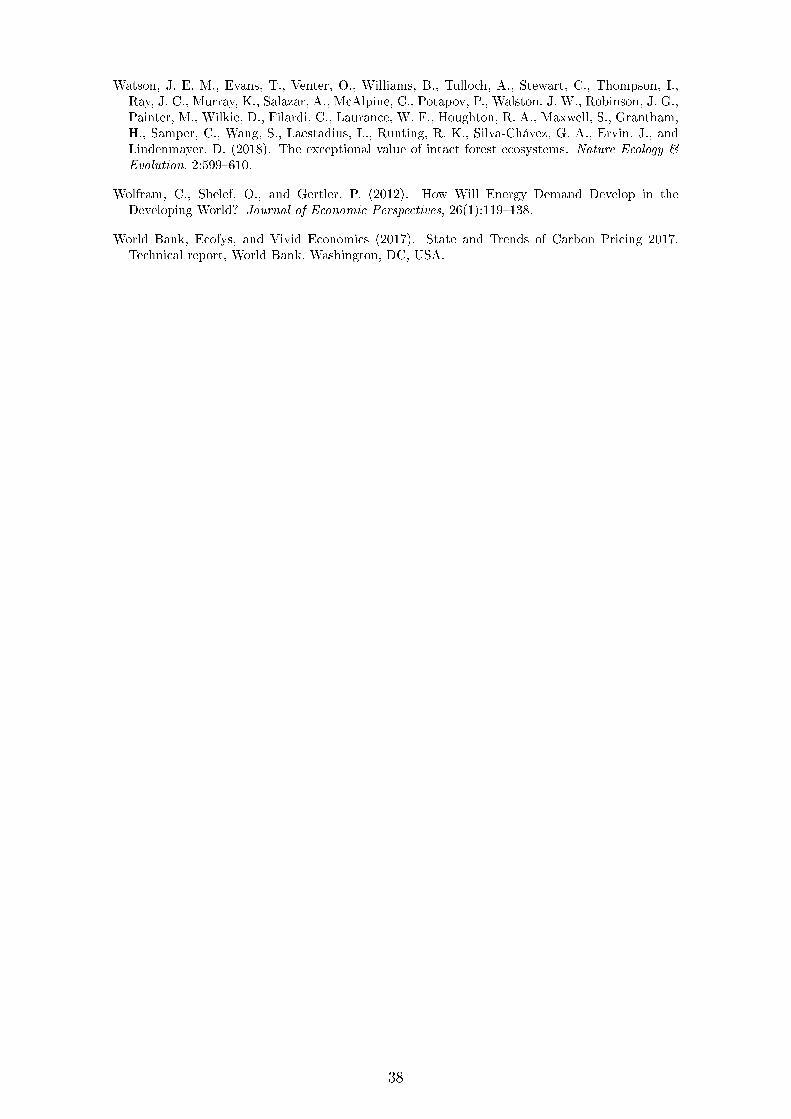
Watson, J. E. M., Evans, T., Venter, O., Williams, B., Tulloch, A., Stewart, C., Thompson, I.,Ray, J. C., Murray, K., Salazar, A., McAlpine, C., Potapov, P., Walston, J. W., Robinson, J. G.,Painter, M., Wilkie, D., Filardi, C., Laurance, W. F., Houghton, R. A., Maxwell, S., Grantham,H., Samper, C., Wang, S., Laestadius, L., Runting, R. K., Silva-Chávez, G. A., Ervin, J., andLindenmayer, D. (2018). The exceptional value of intact forest ecosystems. Nature Ecology &Evolution, 2:599�610.
Wolfram, C., Shelef, O., and Gertler, P. (2012). How Will Energy Demand Develop in theDeveloping World? Journal of Economic Perspectives, 26(1):119�138.
World Bank, Ecofys, and Vivid Economics (2017). State and Trends of Carbon Pricing 2017.Technical report, World Bank, Washington, DC, USA.
38
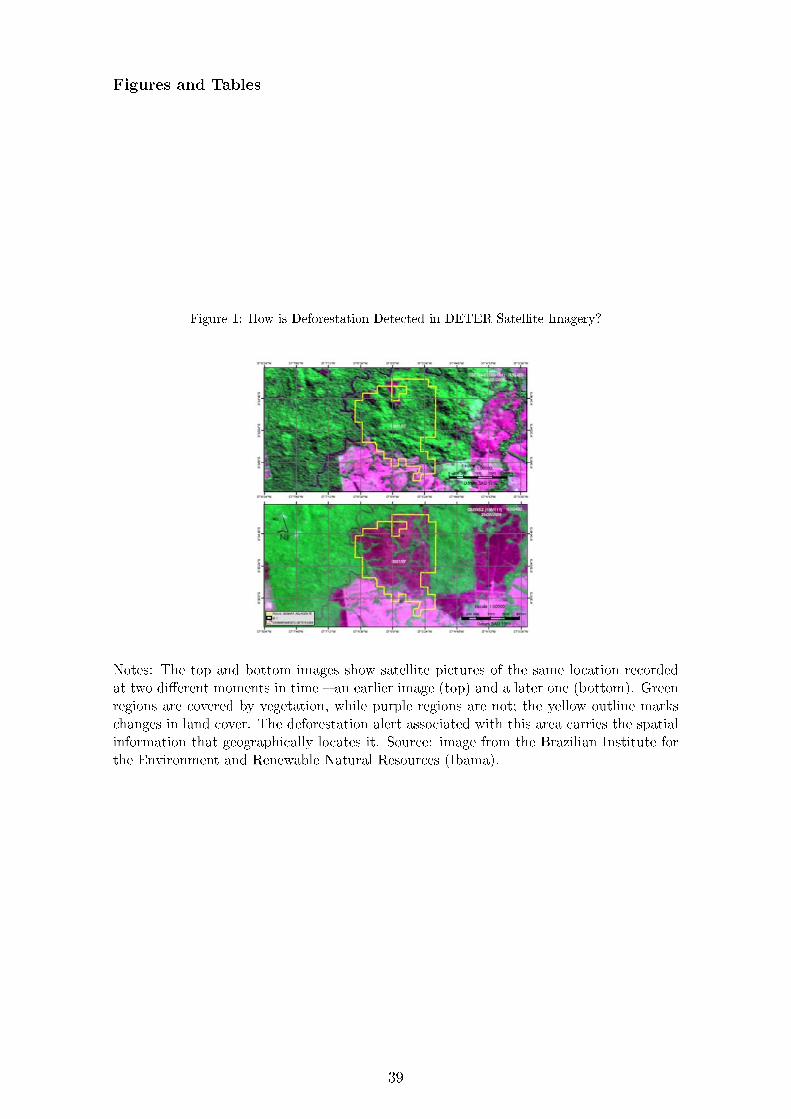
Figures and Tables
Figure 1: How is Deforestation Detected in DETER Satellite Imagery?
Notes: The top and bottom images show satellite pictures of the same location recorded
at two di�erent moments in time � an earlier image (top) and a later one (bottom). Green
regions are covered by vegetation, while purple regions are not; the yellow outline marks
changes in land cover. The deforestation alert associated with this area carries the spatial
information that geographically locates it. Source: image from the Brazilian Institute for
the Environment and Renewable Natural Resources (Ibama).
39
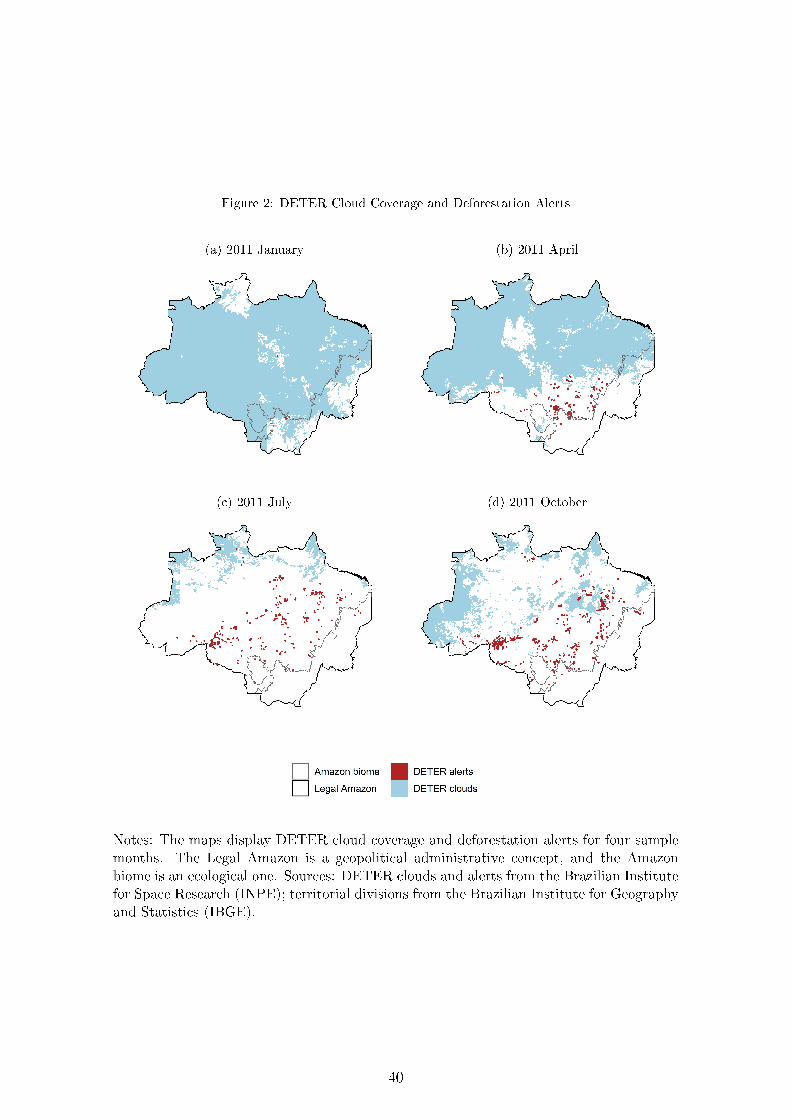
Figure 2: DETER Cloud Coverage and Deforestation Alerts
(a) 2011 January (b) 2011 April
(c) 2011 July (d) 2011 October
Notes: The maps display DETER cloud coverage and deforestation alerts for four sample
months. The Legal Amazon is a geopolitical administrative concept, and the Amazon
biome is an ecological one. Sources: DETER clouds and alerts from the Brazilian Institute
for Space Research (INPE); territorial divisions from the Brazilian Institute for Geography
and Statistics (IBGE).
40
Figure 3: Descriptive Statistics: Amazon Deforestation and Fine Count
Notes: The graph displays total annual deforested area and total annual deforestation-
related �ne count for all sample municipalities. Sources: deforestation from the Brazilian
Institute for Space Research (INPE); �ne count from the Brazilian Institute for the
Environment and Renewable Natural Resources (Ibama).
41
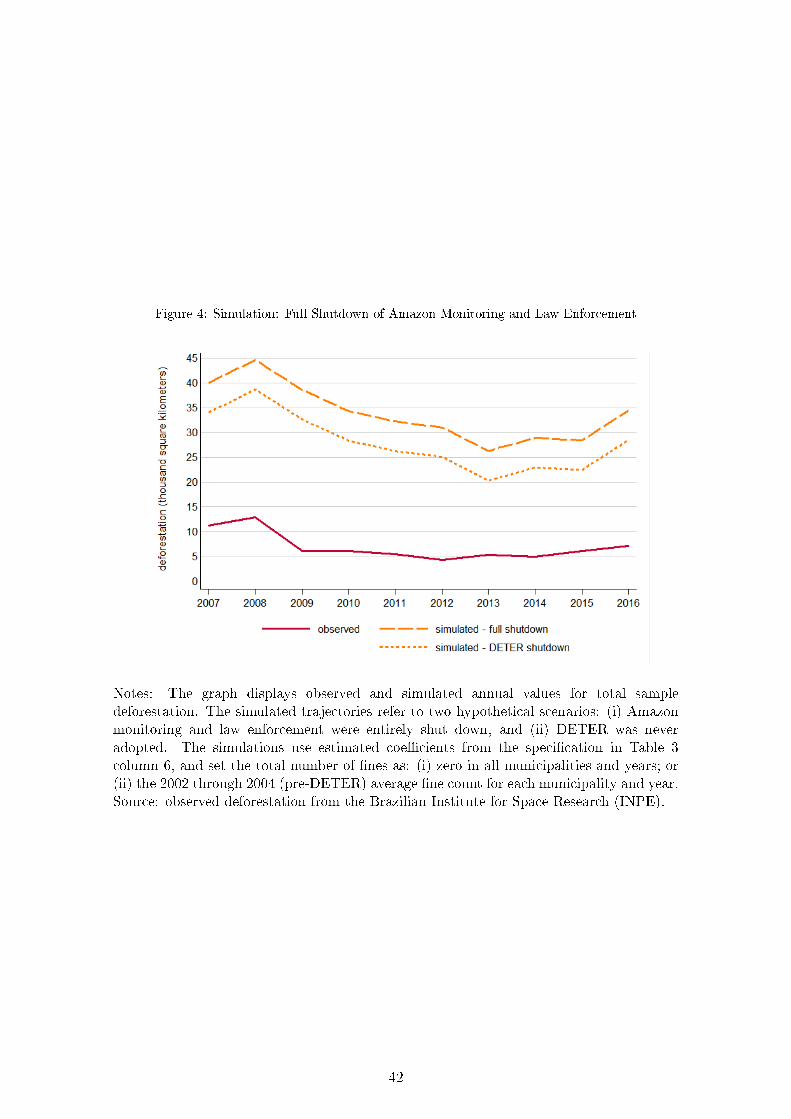
Figure 4: Simulation: Full Shutdown of Amazon Monitoring and Law Enforcement
Notes: The graph displays observed and simulated annual values for total sample
deforestation. The simulated trajectories refer to two hypothetical scenarios: (i) Amazon
monitoring and law enforcement were entirely shut down, and (ii) DETER was never
adopted. The simulations use estimated coe�cients from the speci�cation in Table 3
column 6, and set the total number of �nes as: (i) zero in all municipalities and years; or
(ii) the 2002 through 2004 (pre-DETER) average �ne count for each municipality and year.
Source: observed deforestation from the Brazilian Institute for Space Research (INPE).
42
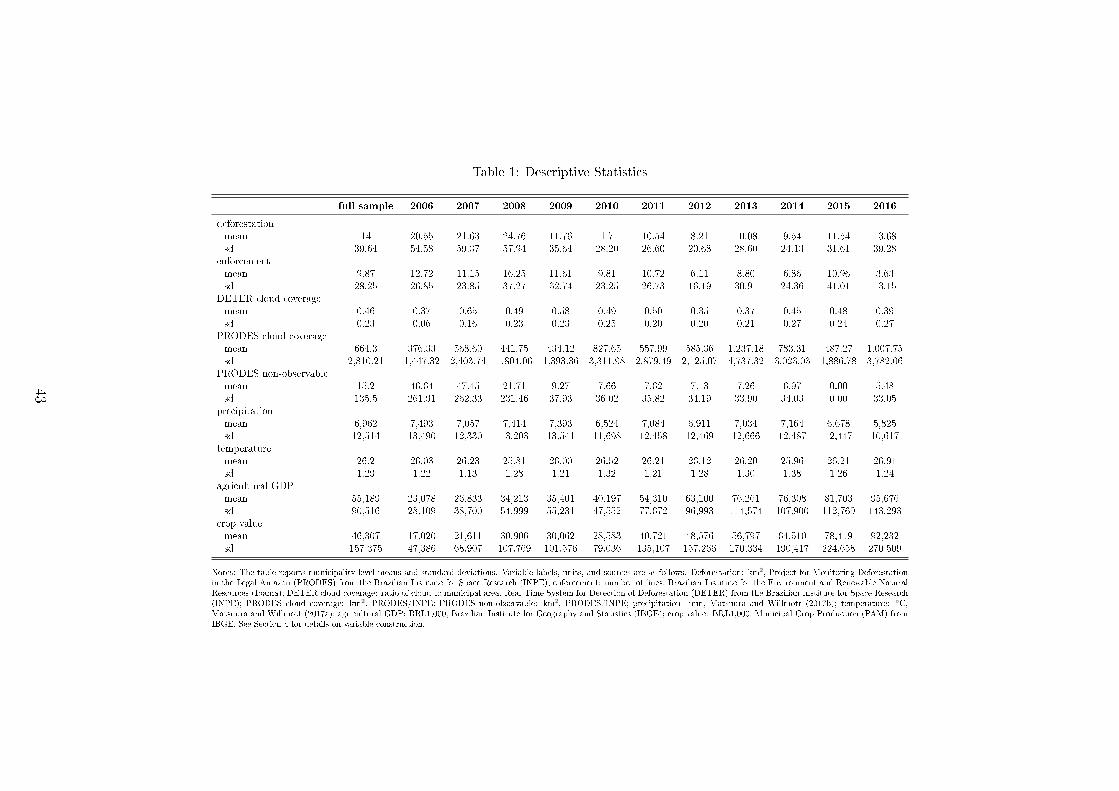
Table 1: Descriptive Statistics
full sample 2006 2007 2008 2009 2010 2011 2012 2013 2014 2015 2016
deforestationmean 14 20.55 21.63 24.76 11.76 11.71 10.54 8.21 10.08 9.54 11.54 13.68sd 39.64 54.58 59.37 57.94 35.64 28.20 26.60 20.68 28.60 24.13 31.61 39.28
enforcementmean 9.87 12.72 11.15 16.25 11.61 9.81 10.72 6.11 8.80 6.86 10.96 3.63sd 28.25 26.85 23.85 37.27 32.74 23.25 26.73 16.19 30.91 24.36 41.01 13.15
DETER cloud coveragemean 0.46 0.37 0.65 0.49 0.58 0.49 0.50 0.35 0.37 0.45 0.48 0.39sd 0.23 0.06 0.16 0.23 0.23 0.25 0.20 0.20 0.21 0.27 0.24 0.27
PRODES cloud coveragemean 664.3 376.33 568.60 441.75 434.12 827.65 557.99 585.36 1,237.18 783.31 487.27 1,007.75sd 2,810.21 1,447.32 2,403.74 1,804.06 1,393.36 3,311.98 2,879.49 2,125.07 4,737.32 3,023.03 1,886.78 3,782.06
PRODES non-observablemean 15.2 46.64 47.45 21.71 9.27 7.66 7.62 7.13 7.26 6.97 0.00 5.48sd 135.5 261.91 262.33 231.46 37.93 36.02 35.82 34.19 33.90 34.03 0.00 33.05
precipitationmean 6,962 7,493 7,057 7,414 7,393 6,524 7,084 6,911 7,034 7,164 6,678 5,825sd 12,514 13,490 12,330 13,203 13,541 11,698 12,458 12,469 12,666 12,487 12,447 10,617
temperaturemean 26.2 26.03 26.23 25.81 26.00 26.52 26.21 26.12 26.20 25.96 26.21 26.91sd 1.29 1.22 1.13 1.28 1.21 1.32 1.21 1.28 1.30 1.38 1.26 1.24
agricultural GDPmean 55,189 23,078 26,833 34,213 35,401 40,197 54,310 63,100 76,261 76,308 81,703 95,676sd 90,516 28,109 38,700 54,999 55,231 47,552 77,672 96,993 114,574 107,900 112,769 143,293
crop valuemean 46,307 17,020 21,611 30,906 30,062 28,583 40,721 48,576 56,797 64,510 78,419 92,232sd 157,375 47,386 68,907 107,769 101,576 79,036 135,107 157,266 170,334 190,417 224,658 270,509
Notes: The table reports municipality-level means and standard deviations. Variable labels, units, and sources are as follows. Deforestation: km2, Project for Monitoring Deforestationin the Legal Amazon (PRODES) from the Brazilian Institute for Space Research (INPE); enforcement: number of �nes, Brazilian Institute for the Environment and Renewable NaturalResources (Ibama); DETER cloud coverage: ratio of cloud to municipal area, Real-Time System for Detection of Deforestation (DETER) from the Brazilian Institute for Space Research(INPE); PRODES cloud coverage: km2, PRODES/INPE; PRODES non-observable: km2, PRODES/INPE; precipitation: mm, Matsuura and Willmott (2017b); temperature: ◦C,Matsuura and Willmott (2017a); agricultural GDP: BRL1,000, Brazilian Institute for Geography and Statistics (IBGE); crop value: BRL1,000, Municipal Crop Production (PAM) fromIBGE. See Section 4 for details on variable construction.
43
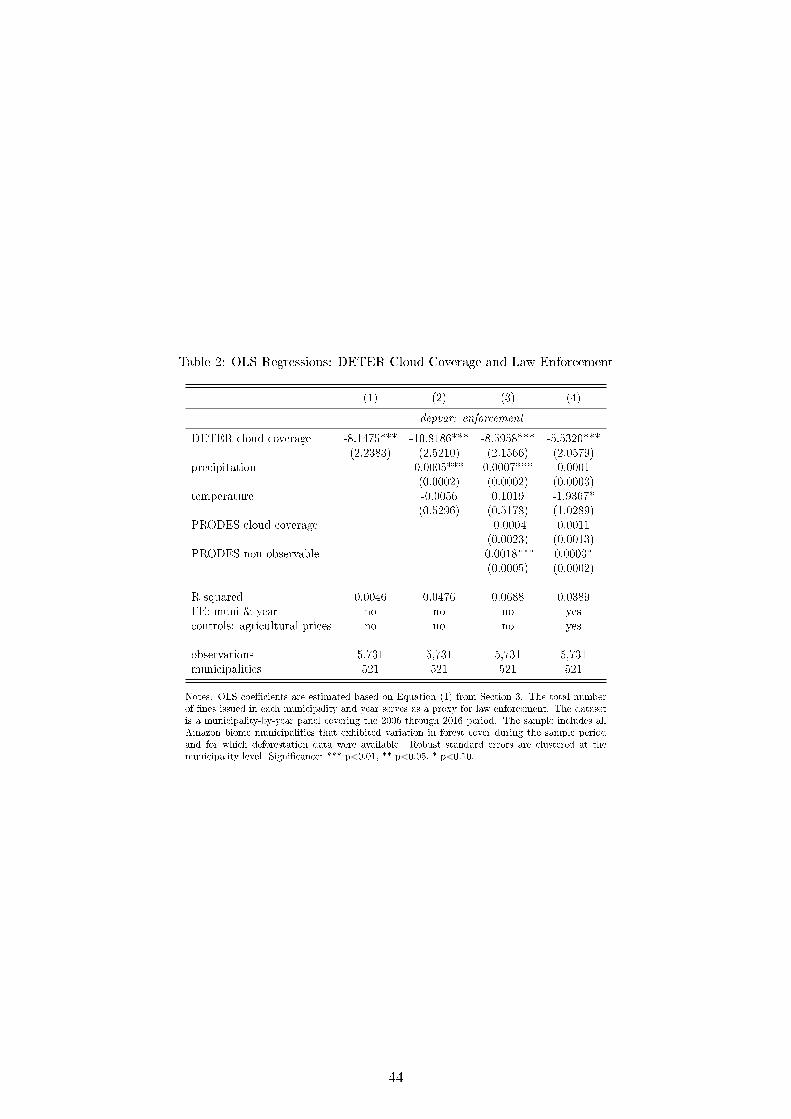
Table 2: OLS Regressions: DETER Cloud Coverage and Law Enforcement
(1) (2) (3) (4)
depvar: enforcement
DETER cloud coverage -8.1475*** -10.8186*** -8.5958*** -5.5320***(2.2383) (2.5210) (2.1566) (2.0579)
precipitation 0.0005*** 0.0007*** 0.0001(0.0002) (0.0002) (0.0003)
temperature -0.0056 0.1019 -1.9367*(0.5296) (0.5178) (1.0289)
PRODES cloud coverage -0.0004 0.0011(0.0023) (0.0013)
PRODES non-observable -0.0018*** 0.0003*(0.0005) (0.0002)
R-squared 0.0046 0.0476 0.0688 0.0389FE: muni & year no no no yescontrols: agricultural prices no no no yes
observations 5,731 5,731 5,731 5,731municipalities 521 521 521 521
Notes: OLS coe�cients are estimated based on Equation (1) from Section 3. The total numberof �nes issued in each municipality and year serves as a proxy for law enforcement. The datasetis a municipality-by-year panel covering the 2006 through 2016 period. The sample includes allAmazon biome municipalities that exhibited variation in forest cover during the sample periodand for which deforestation data were available. Robust standard errors are clustered at themunicipality level. Signi�cance: *** p<0.01, ** p<0.05, * p<0.10.
44
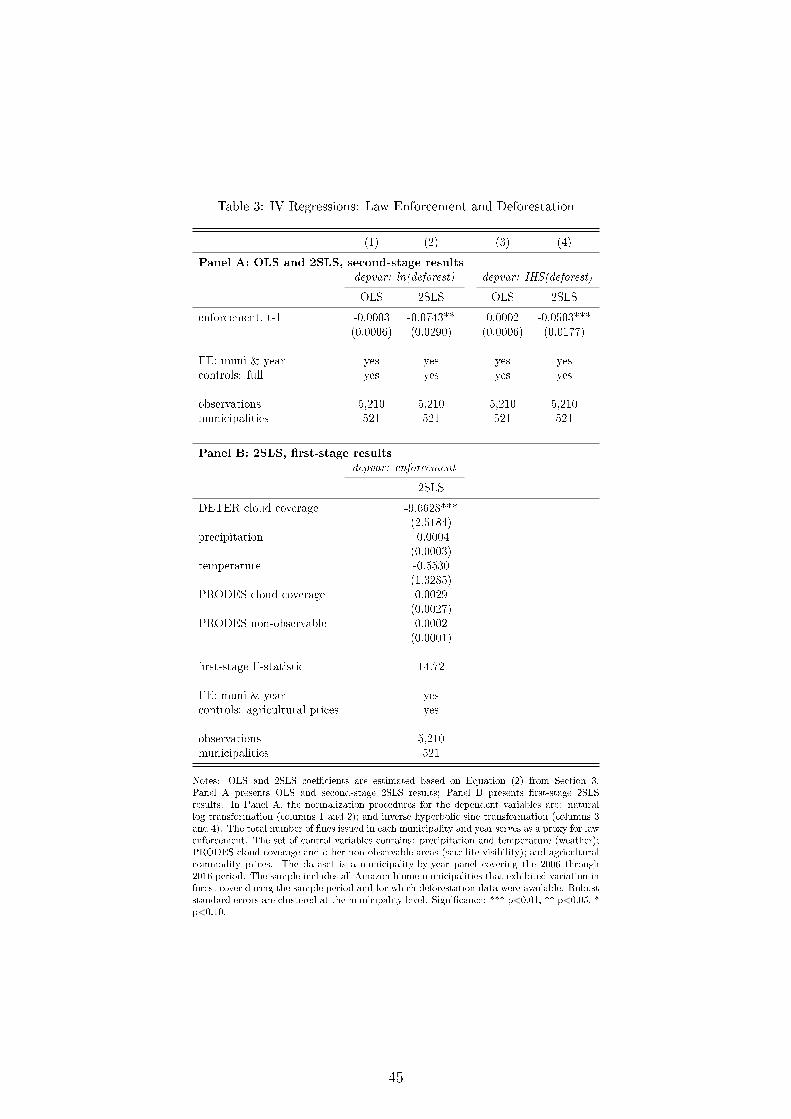
Table 3: IV Regressions: Law Enforcement and Deforestation
(1) (2) (3) (4)
Panel A: OLS and 2SLS, second-stage results
depvar: ln(deforest) depvar: IHS(deforest)
OLS 2SLS OLS 2SLS
enforcement, t-1 -0.0003 -0.0743** 0.0002 -0.0503***(0.0006) (0.0290) (0.0006) (0.0177)
FE: muni & year yes yes yes yescontrols: full yes yes yes yes
observations 5,210 5,210 5,210 5,210municipalities 521 521 521 521
Panel B: 2SLS, �rst-stage results
depvar: enforcement
2SLS
DETER cloud coverage -9.6628***(2.5184)
precipitation -0.0004(0.0003)
temperature -0.5530(1.3285)
PRODES cloud coverage 0.0029(0.0027)
PRODES non-observable 0.0002(0.0001)
�rst-stage F-statistic 14.72
FE: muni & year yescontrols: agricultural prices yes
observations 5,210municipalities 521
Notes: OLS and 2SLS coe�cients are estimated based on Equation (2) from Section 3.Panel A presents OLS and second-stage 2SLS results; Panel B presents �rst-stage 2SLSresults. In Panel A, the normalization procedures for the dependent variables are: naturallog transformation (columns 1 and 2); and inverse hyperbolic sine transformation (columns 3and 4). The total number of �nes issued in each municipality and year serves as a proxy for lawenforcement. The set of control variables contains: precipitation and temperature (weather);PRODES cloud coverage and other non-observable areas (satellite visibility); and agriculturalcommodity prices. The dataset is a municipality-by-year panel covering the 2006 through2016 period. The sample includes all Amazon biome municipalities that exhibited variation inforest cover during the sample period and for which deforestation data were available. Robuststandard errors are clustered at the municipality level. Signi�cance: *** p<0.01, ** p<0.05, *p<0.10.
45
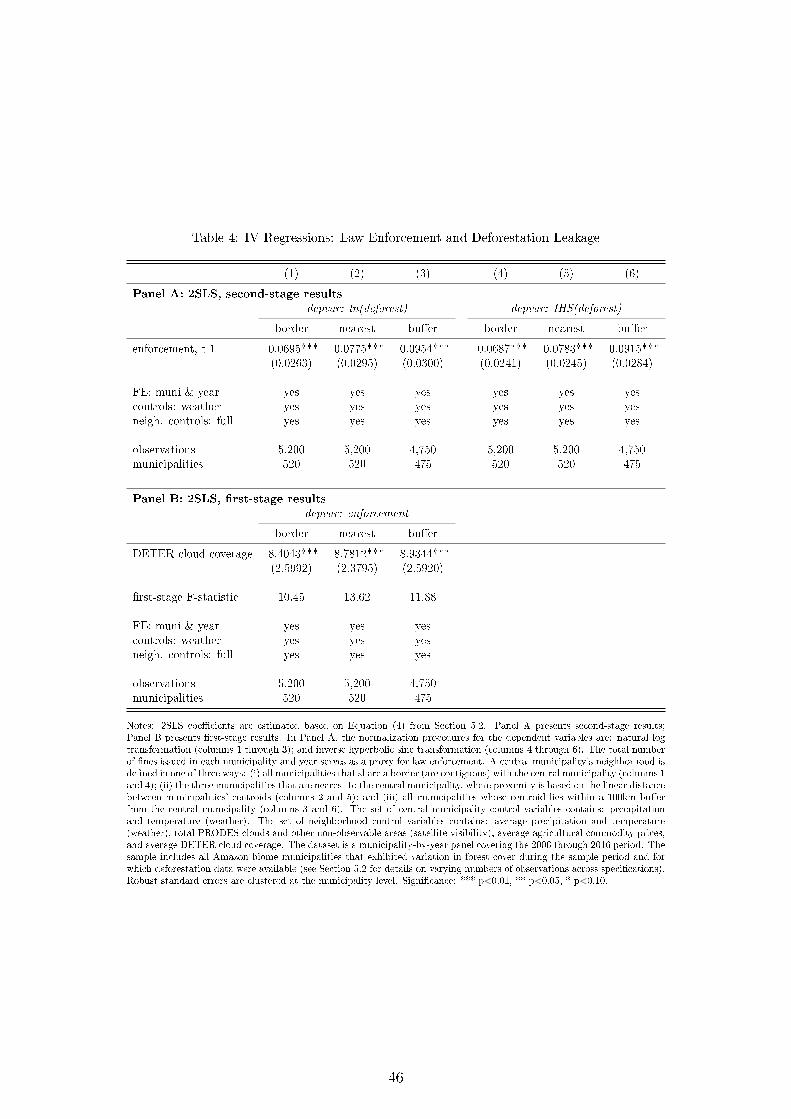
Table 4: IV Regressions: Law Enforcement and Deforestation Leakage
(1) (2) (3) (4) (5) (6)
Panel A: 2SLS, second-stage results
depvar: ln(deforest) depvar: IHS(deforest)
border nearest bu�er border nearest bu�er
enforcement, t-1 -0.0695*** -0.0775*** -0.0954*** -0.0687*** -0.0783*** -0.0915***(0.0263) (0.0295) (0.0300) (0.0241) (0.0245) (0.0284)
FE: muni & year yes yes yes yes yes yescontrols: weather yes yes yes yes yes yesneigh. controls: full yes yes yes yes yes yes
observations 5,200 5,200 4,750 5,200 5,200 4,750municipalities 520 520 475 520 520 475
Panel B: 2SLS, �rst-stage results
depvar: enforcement
border nearest bu�er
DETER cloud coverage -8.4043*** -8.7812*** -8.9344***(2.5992) (2.3795) (2.5920)
�rst-stage F-statistic 10.45 13.62 11.88
FE: muni & year yes yes yescontrols: weather yes yes yesneigh. controls: full yes yes yes
observations 5,200 5,200 4,750municipalities 520 520 475
Notes: 2SLS coe�cients are estimated based on Equation (4) from Section 5.2. Panel A presents second-stage results;Panel B presents �rst-stage results. In Panel A, the normalization procedures for the dependent variables are: natural logtransformation (columns 1 through 3); and inverse hyperbolic sine transformation (columns 4 through 6). The total numberof �nes issued in each municipality and year serves as a proxy for law enforcement. A central municipality's neighborhood isde�ned in one of three ways: (i) all municipalities that share a border (are contiguous) with the central municipality (columns 1and 4); (ii) the three municipalities that are nearest to the central municipality, where proximity is based on the linear distancebetween municipalities' centroids (columns 2 and 5); and (iii) all municipalities whose centroid lies within a 100km bu�erfrom the central municipality (columns 3 and 6). The set of central municipality control variables contains: precipitationand temperature (weather). The set of neighborhood control variables contains: average precipitation and temperature(weather), total PRODES clouds and other non-observable areas (satellite visibility), average agricultural commodity prices,and average DETER cloud coverage. The dataset is a municipality-by-year panel covering the 2006 through 2016 period. Thesample includes all Amazon biome municipalities that exhibited variation in forest cover during the sample period and forwhich deforestation data were available (see Section 5.2 for details on varying numbers of observations across speci�cations).Robust standard errors are clustered at the municipality level. Signi�cance: *** p<0.01, ** p<0.05, * p<0.10.
46
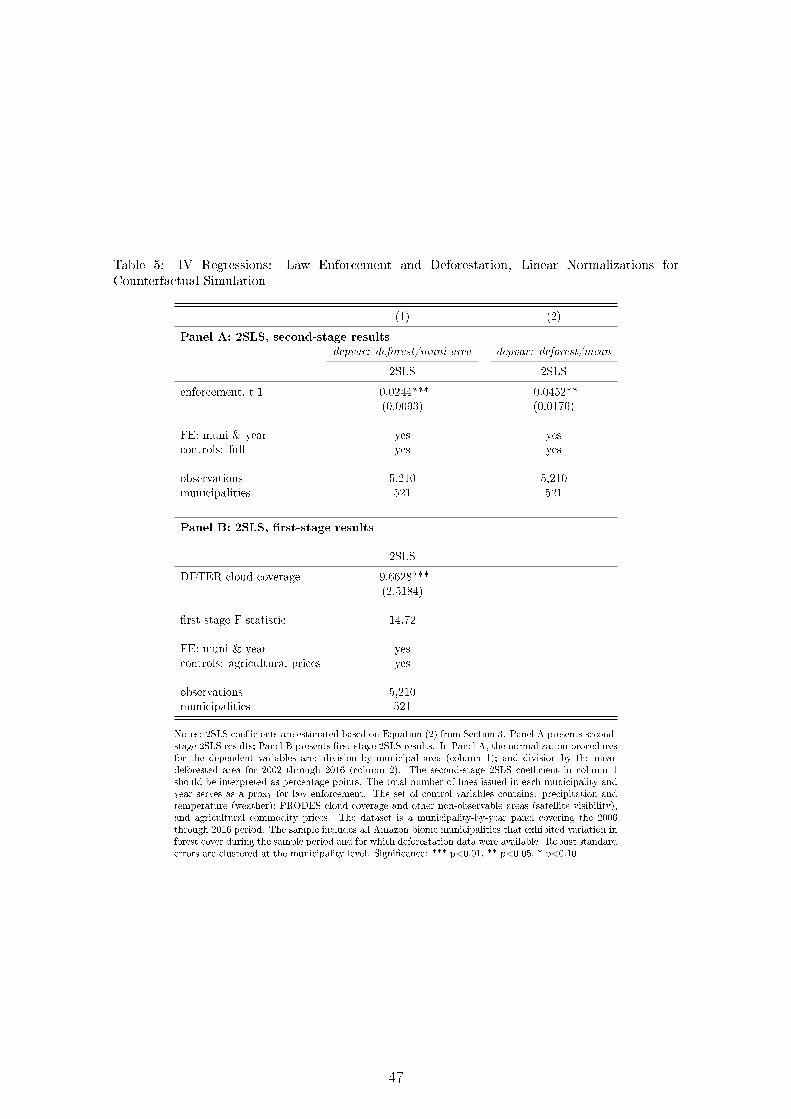
Table 5: IV Regressions: Law Enforcement and Deforestation, Linear Normalizations forCounterfactual Simulation
(1) (2)
Panel A: 2SLS, second-stage results
depvar: deforest/muni area depvar: deforest/mean
2SLS 2SLS
enforcement, t-1 -0.0244*** -0.0452**(0.0093) (0.0176)
FE: muni & year yes yescontrols: full yes yes
observations 5,210 5,210municipalities 521 521
Panel B: 2SLS, �rst-stage results
2SLS
DETER cloud coverage -9.6628***(2.5184)
�rst-stage F-statistic 14.72
FE: muni & year yescontrols: agricultural prices yes
observations 5,210municipalities 521
Notes: 2SLS coe�cients are estimated based on Equation (2) from Section 3. Panel A presents second-stage 2SLS results; Panel B presents �rst-stage 2SLS results. In Panel A, the normalization proceduresfor the dependent variables are: division by municipal area (column 1); and division by the meandeforested area for 2002 through 2016 (column 2). The second-stage 2SLS coe�cient in column 1should be interpreted as percentage points. The total number of �nes issued in each municipality andyear serves as a proxy for law enforcement. The set of control variables contains: precipitation andtemperature (weather); PRODES cloud coverage and other non-observable areas (satellite visibility);and agricultural commodity prices. The dataset is a municipality-by-year panel covering the 2006through 2016 period. The sample includes all Amazon biome municipalities that exhibited variation inforest cover during the sample period and for which deforestation data were available. Robust standarderrors are clustered at the municipality level. Signi�cance: *** p<0.01, ** p<0.05, * p<0.10.
47
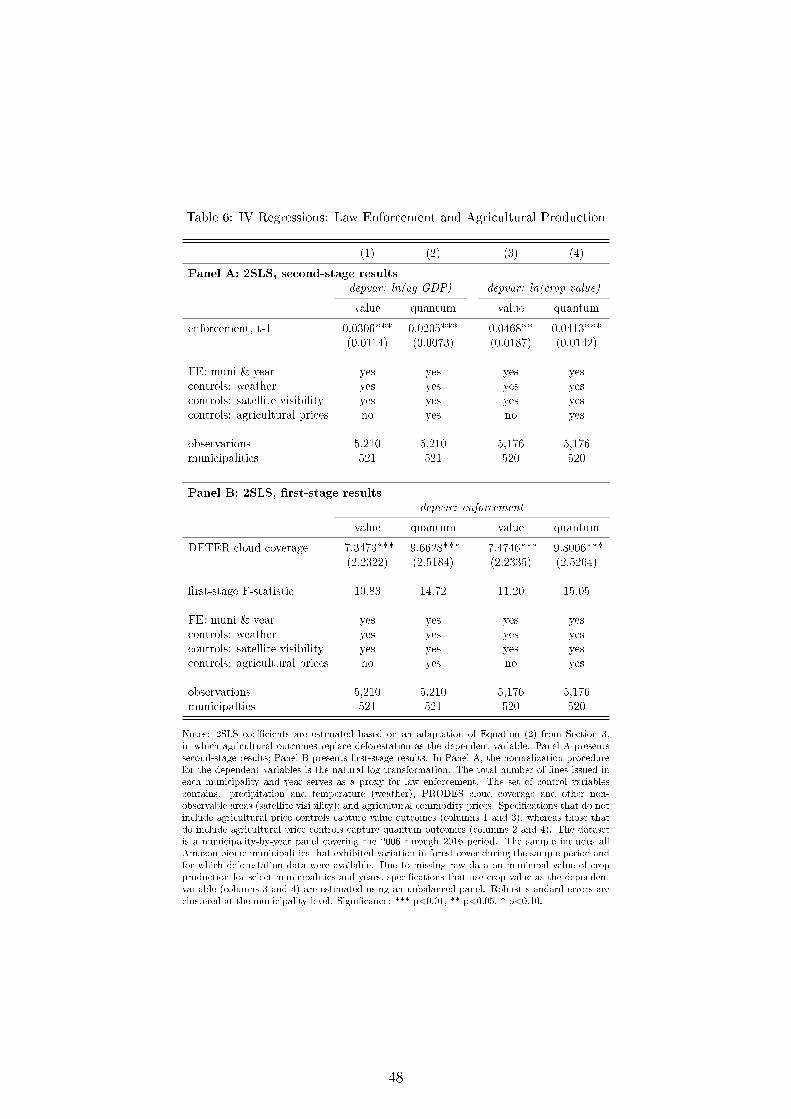
Table 6: IV Regressions: Law Enforcement and Agricultural Production
(1) (2) (3) (4)
Panel A: 2SLS, second-stage results
depvar: ln(ag GDP) depvar: ln(crop value)
value quantum value quantum
enforcement, t-1 0.0306*** 0.0205*** 0.0468** 0.0413***(0.0114) (0.0073) (0.0187) (0.0142)
FE: muni & year yes yes yes yescontrols: weather yes yes yes yescontrols: satellite visibility yes yes yes yescontrols: agricultural prices no yes no yes
observations 5,210 5,210 5,176 5,176municipalities 521 521 520 520
Panel B: 2SLS, �rst-stage results
depvar: enforcement
value quantum value quantum
DETER cloud coverage -7.3473*** -9.6628*** -7.4746*** -9.8006***(2.2322) (2.5184) (2.2335) (2.5264)
�rst-stage F-statistic 10.83 14.72 11.20 15.05
FE: muni & year yes yes yes yescontrols: weather yes yes yes yescontrols: satellite visibility yes yes yes yescontrols: agricultural prices no yes no yes
observations 5,210 5,210 5,176 5,176municipalties 521 521 520 520
Notes: 2SLS coe�cients are estimated based on an adaptation of Equation (2) from Section 3,in which agricultural outcomes replace deforestation as the dependent variable. Panel A presentssecond-stage results; Panel B presents �rst-stage results. In Panel A, the normalization procedurefor the dependent variables is the natural log transformation. The total number of �nes issued ineach municipality and year serves as a proxy for law enforcement. The set of control variablescontains: precipitation and temperature (weather); PRODES cloud coverage and other non-observable areas (satellite visibility); and agricultural commodity prices. Speci�cations that do notinclude agricultural price controls capture value outcomes (columns 1 and 3), whereas those thatdo include agricultural price controls capture quantum outcomes (columns 2 and 4). The datasetis a municipality-by-year panel covering the 2006 through 2016 period. The sample includes allAmazon biome municipalities that exhibited variation in forest cover during the sample period andfor which deforestation data were available. Due to missing raw data on municipal value of cropproduction for select municipalities and years, speci�cations that use crop value as the dependentvariable (columns 3 and 4) are estimated using an unbalanced panel. Robust standard errors areclustered at the municipality level. Signi�cance: *** p<0.01, ** p<0.05, * p<0.10.
48
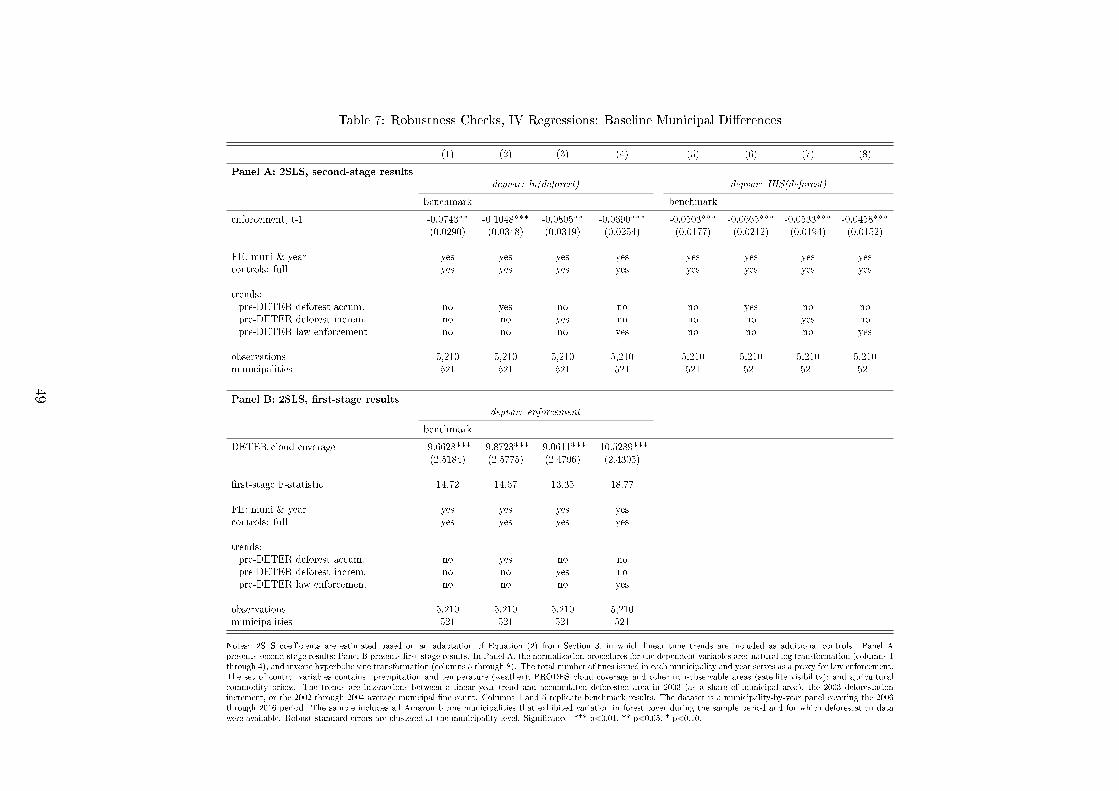
Table 7: Robustness Checks, IV Regressions: Baseline Municipal Di�erences
(1) (2) (3) (4) (5) (6) (7) (8)
Panel A: 2SLS, second-stage results
depvar: ln(deforest) depvar: IHS(deforest)
benchmark benchmark
enforcement, t-1 -0.0743** -0.1048*** -0.0805** -0.0690*** -0.0503*** -0.0665*** -0.0533*** -0.0458***(0.0290) (0.0348) (0.0319) (0.0254) (0.0177) (0.0212) (0.0194) (0.0152)
FE: muni & year yes yes yes yes yes yes yes yescontrols: full yes yes yes yes yes yes yes yes
trends:pre-DETER deforest accum. no yes no no no yes no nopre-DETER deforest increm. no no yes no no no yes nopre-DETER law enforcement no no no yes no no no yes
observations 5,210 5,210 5,210 5,210 5,210 5,210 5,210 5,210municipalities 521 521 521 521 521 521 521 521
Panel B: 2SLS, �rst-stage results
depvar: enforcement
benchmark
DETER cloud coverage -9.6628*** -9.8723*** -9.0611*** -10.5289***(2.5184) (2.5775) (2.4796) (2.4305)
�rst-stage F-statistic 14.72 14.67 13.35 18.77
FE: muni & year yes yes yes yescontrols: full yes yes yes yes
trends:pre-DETER deforest accum. no yes no nopre-DETER deforest increm. no no yes nopre-DETER law enforcement no no no yes
observations 5,210 5,210 5,210 5,210municipalities 521 521 521 521
Notes: 2SLS coe�cients are estimated based on an adaptation of Equation (2) from Section 3, in which linear time trends are included as additional controls. Panel Apresents second-stage results; Panel B presents �rst-stage results. In Panel A, the normalization procedures for the dependent variables are: natural log transformation (columns 1through 4); and inverse hyperbolic sine transformation (columns 5 through 8). The total number of �nes issued in each municipality and year serves as a proxy for law enforcement.The set of control variables contains: precipitation and temperature (weather); PRODES cloud coverage and other non-observable areas (satellite visibility); and agriculturalcommodity prices. The trends are interactions between a linear year trend and accumulated deforested area in 2003 (as a share of municipal area), the 2003 deforestationincrement, or the 2002 through 2004 average municipal �ne count. Columns 1 and 5 replicate benchmark results. The dataset is a municipality-by-year panel covering the 2006through 2016 period. The sample includes all Amazon biome municipalities that exhibited variation in forest cover during the sample period and for which deforestation datawere available. Robust standard errors are clustered at the municipality level. Signi�cance: *** p<0.01, ** p<0.05, * p<0.10.
49
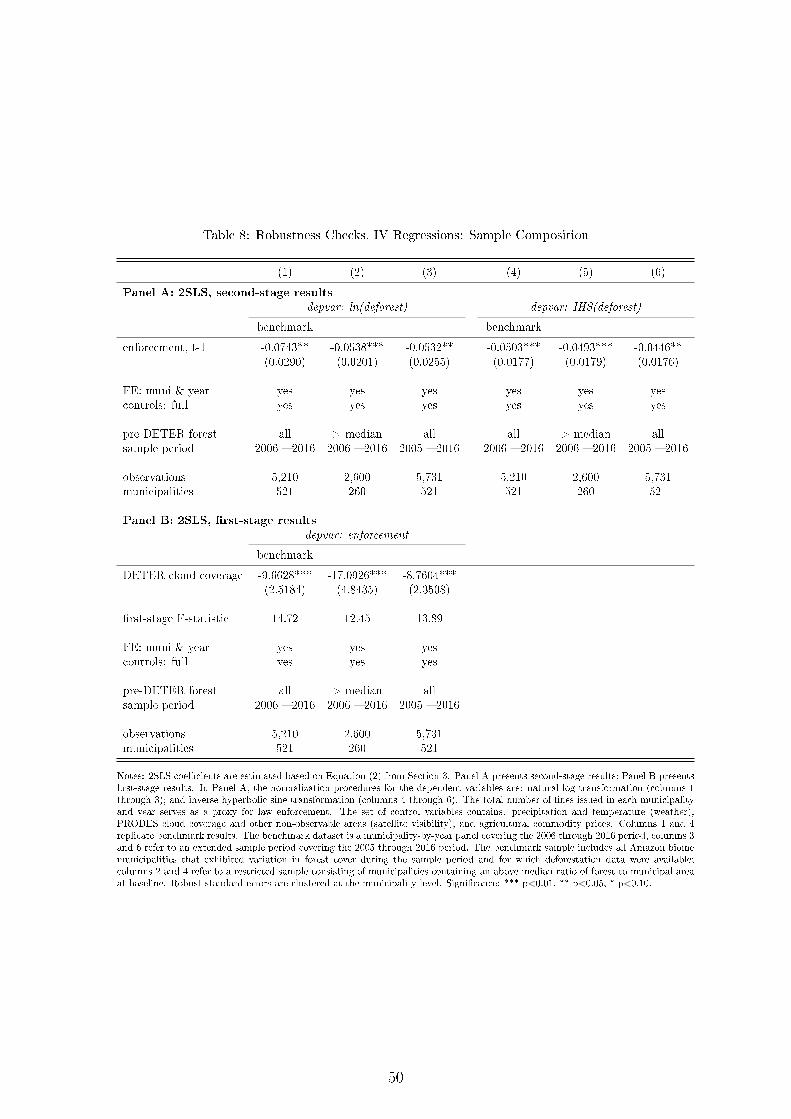
Table 8: Robustness Checks, IV Regressions: Sample Composition
(1) (2) (3) (4) (5) (6)
Panel A: 2SLS, second-stage results
depvar: ln(deforest) depvar: IHS(deforest)
benchmark benchmark
enforcement, t-1 -0.0743** -0.0538*** -0.0532** -0.0503*** -0.0493*** -0.0446**(0.0290) (0.0201) (0.0255) (0.0177) (0.0179) (0.0176)
FE: muni & year yes yes yes yes yes yescontrols: full yes yes yes yes yes yes
pre-DETER forest all > median all all > median allsample period 2006 � 2016 2006 � 2016 2005 � 2016 2006 � 2016 2006 � 2016 2005 � 2016
observations 5,210 2,600 5,731 5,210 2,600 5,731municipalities 521 260 521 521 260 521
Panel B: 2SLS, �rst-stage results
depvar: enforcement
benchmark
DETER cloud coverage -9.6628*** -17.0926*** -8.7604***(2.5184) (4.8435) (2.3508)
�rst-stage F-statistic 14.72 12.45 13.89
FE: muni & year yes yes yescontrols: full yes yes yes
pre-DETER forest all > median allsample period 2006 � 2016 2006 � 2016 2005 � 2016
observations 5,210 2,600 5,731municipalities 521 260 521
Notes: 2SLS coe�cients are estimated based on Equation (2) from Section 3. Panel A presents second-stage results; Panel B presents�rst-stage results. In Panel A, the normalization procedures for the dependent variables are: natural log transformation (columns 1through 3); and inverse hyperbolic sine transformation (columns 4 through 6). The total number of �nes issued in each municipalityand year serves as a proxy for law enforcement. The set of control variables contains: precipitation and temperature (weather);PRODES cloud coverage and other non-observable areas (satellite visibility); and agricultural commodity prices. Columns 1 and 4replicate benchmark results. The benchmark dataset is a municipality-by-year panel covering the 2006 through 2016 period; columns 3and 6 refer to an extended sample period covering the 2005 through 2016 period. The benchmark sample includes all Amazon biomemunicipalities that exhibited variation in forest cover during the sample period and for which deforestation data were available;columns 2 and 4 refer to a restricted sample consisting of municipalities containing an above-median ratio of forest to municipal areaat baseline. Robust standard errors are clustered at the municipality level. Signi�cance: *** p<0.01, ** p<0.05, * p<0.10.
50
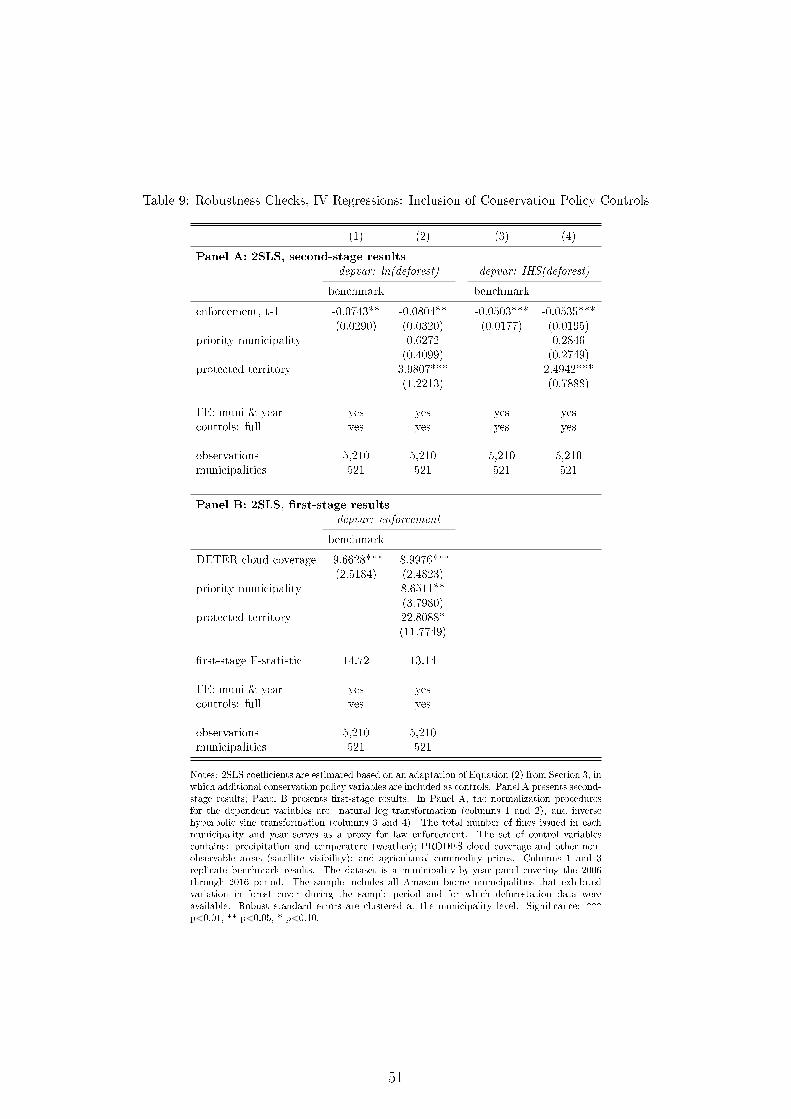
Table 9: Robustness Checks, IV Regressions: Inclusion of Conservation Policy Controls
(1) (2) (3) (4)
Panel A: 2SLS, second-stage results
depvar: ln(deforest) depvar: IHS(deforest)
benchmark benchmark
enforcement, t-1 -0.0743** -0.0804** -0.0503*** -0.0535***(0.0290) (0.0320) (0.0177) (0.0195)
priority municipality 0.6272 0.2846(0.4099) (0.2749)
protected territory 3.9807*** 2.4942***(1.2213) (0.7888)
FE: muni & year yes yes yes yescontrols: full yes yes yes yes
observations 5,210 5,210 5,210 5,210municipalities 521 521 521 521
Panel B: 2SLS, �rst-stage results
depvar: enforcement
benchmark
DETER cloud coverage -9.6628*** -8.9976***(2.5184) (2.4823)
priority municipality 8.6511**(3.7980)
protected territory 22.8088*(11.7749)
�rst-stage F-statistic 14.72 13.14
FE: muni & year yes yescontrols: full yes yes
observations 5,210 5,210municipalities 521 521
Notes: 2SLS coe�cients are estimated based on an adaptation of Equation (2) from Section 3, inwhich additional conservation policy variables are included as controls. Panel A presents second-stage results; Panel B presents �rst-stage results. In Panel A, the normalization proceduresfor the dependent variables are: natural log transformation (columns 1 and 2); and inversehyperbolic sine transformation (columns 3 and 4). The total number of �nes issued in eachmunicipality and year serves as a proxy for law enforcement. The set of control variablescontains: precipitation and temperature (weather); PRODES cloud coverage and other non-observable areas (satellite visibility); and agricultural commodity prices. Columns 1 and 3replicate benchmark results. The dataset is a municipality-by-year panel covering the 2006through 2016 period. The sample includes all Amazon biome municipalities that exhibitedvariation in forest cover during the sample period and for which deforestation data wereavailable. Robust standard errors are clustered at the municipality level. Signi�cance: ***p<0.01, ** p<0.05, * p<0.10.
51
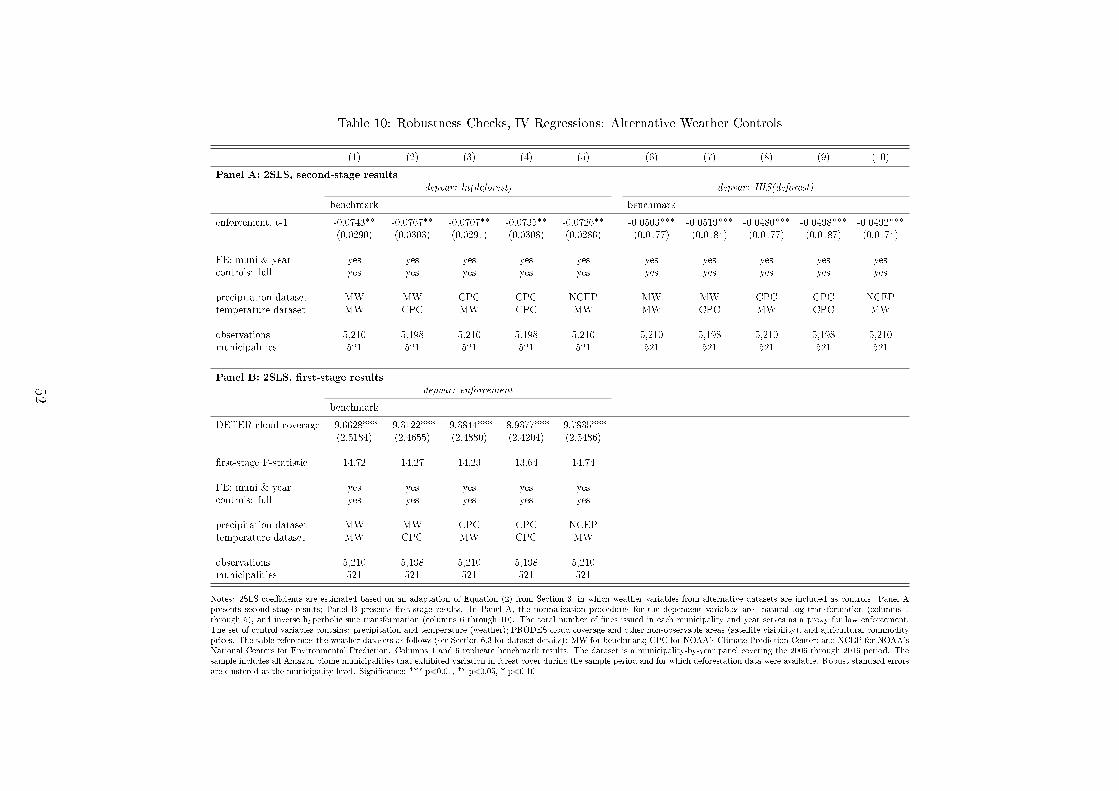
Table 10: Robustness Checks, IV Regressions: Alternative Weather Controls
(1) (2) (3) (4) (5) (6) (7) (8) (9) (10)
Panel A: 2SLS, second-stage results
depvar: ln(deforest) depvar: IHS(deforest)
benchmark benchmark
enforcement, t-1 -0.0743** -0.0767** -0.0707** -0.0735** -0.0726** -0.0503*** -0.0519*** -0.0480*** -0.0498*** -0.0492***(0.0290) (0.0303) (0.0291) (0.0308) (0.0286) (0.0177) (0.0184) (0.0177) (0.0187) (0.0174)
FE: muni & year yes yes yes yes yes yes yes yes yes yescontrols: full yes yes yes yes yes yes yes yes yes yes
precipitation dataset MW MW CPC CPC NCEP MW MW CPC CPC NCEPtemperature dataset MW CPC MW CPC MW MW CPC MW CPC MW
observations 5,210 5,198 5,210 5,198 5,210 5,210 5,198 5,210 5,198 5,210municipalities 521 521 521 521 521 521 521 521 521 521
Panel B: 2SLS, �rst-stage results
depvar: enforcement
benchmark
DETER cloud coverage -9.6628*** -9.3122*** -9.3844*** -8.9377*** -9.7835***(2.5184) (2.4655) (2.4880) (2.4204) (2.5486)
�rst-stage F-statistic 14.72 14.27 14.23 13.64 14.74
FE: muni & year yes yes yes yes yescontrols: full yes yes yes yes yes
precipitation dataset MW MW CPC CPC NCEPtemperature dataset MW CPC MW CPC MW
observations 5,210 5,198 5,210 5,198 5,210municipalities 521 521 521 521 521
Notes: 2SLS coe�cients are estimated based on an adaptation of Equation (2) from Section 3, in which weather variables from alternative datasets are included as controls. Panel Apresents second-stage results; Panel B presents �rst-stage results. In Panel A, the normalization procedures for the dependent variables are: natural log transformation (columns 1through 5); and inverse hyperbolic sine transformation (columns 6 through 10). The total number of �nes issued in each municipality and year serves as a proxy for law enforcement.The set of control variables contains: precipitation and temperature (weather); PRODES cloud coverage and other non-observable areas (satellite visibility); and agricultural commodityprices. The table references the weather datasets as follows (see Section 6.3 for dataset details): MW for benchmark; CPC for NOAA's Climate Prediction Center; and NCEP for NOAA'sNational Centers for Environmental Prediction. Columns 1 and 6 replicate benchmark results. The dataset is a municipality-by-year panel covering the 2006 through 2016 period. Thesample includes all Amazon biome municipalities that exhibited variation in forest cover during the sample period and for which deforestation data were available. Robust standard errorsare clustered at the municipality level. Signi�cance: *** p<0.01, ** p<0.05, * p<0.10.
52