Embed Size (px)
Citation preview
1
Detonation Waves and Pulse Detonation EnginesDetonation Waves and Pulse Detonation Engines
E. Wintenberger and J.E. ShepherdExplosion Dynamics Laboratory,
Graduate Aeronautical Laboratories, California Institute of Technology, Pasadena, CA 91125
Ae103, January 27, 2004
California Institute of TechnologyGraduate Aeronautical Laboratories
2
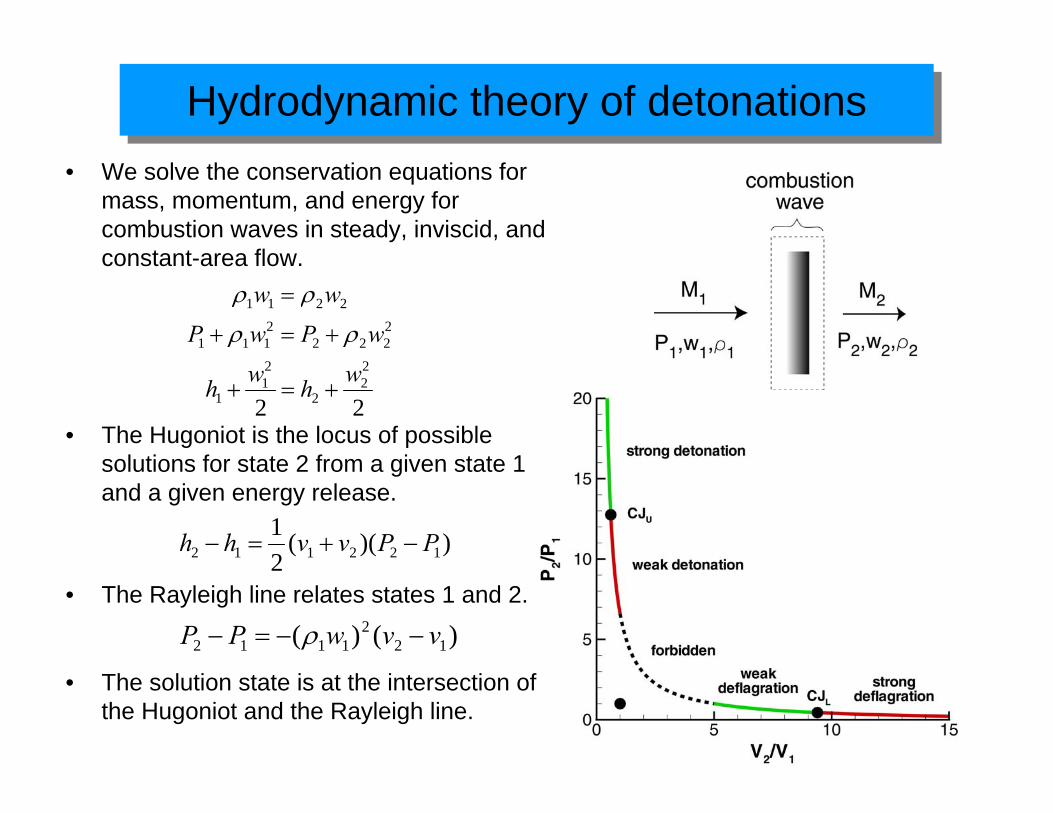
Hydrodynamic theory of detonationsHydrodynamic theory of detonations• We solve the conservation equations for
mass, momentum, and energy for combustion waves in steady, inviscid, and constant-area flow.
22
22
2
21
1
2222
2111
2211
whwh
wPwP
ww
+=+
+=+
=
ρρ
ρρ
• The Hugoniot is the locus of possible solutions for state 2 from a given state 1 and a given energy release.
))((21
122112 PPvvhh −+=−
)()( 122
1112 vvwPP −−=− ρ• The Rayleigh line relates states 1 and 2.
• The solution state is at the intersection of the Hugoniot and the Rayleigh line.
3
Deflagrations and detonationsDeflagrations and detonations
• Deflagrations are subsonic combustion waves: M1<1.– Characteristic of combustion in ramjet and turbojet engines.– Typical deflagrations propagate at speeds on the order of 1-100 m/s.– Across a deflagration, the pressure decreases while the volume increases:
P2<P1 and v2>v1.
• Detonations are supersonic combustion waves: M1>1.– Typical detonation waves propagate at a velocity on the order of 2000 m/s (M1
on the order of 4-8).– Across a detonation, the pressure increases while the volume decreases:
P2>P1 and v2<v1.– For detonations in stoichiometric hydrocarbon fuel-air: P2/P1~20.
4
Chapman-Jouguet conditionChapman-Jouguet condition
• The solution to the conservation equations is only determined with some additional consideration.
– For deflagrations, the structure of the wave, and turbulent and diffusive processes, determine the propagation speed.
– For detonations, gas dynamic considerations are sufficient to determine the solution. Chapman (1899) and Jouguet (1905) proposed that detonations travel at one particular velocity, which is the minimum velocity for all the solutions on the detonation branch.
• At the solution point (the Chapman-Jouguet detonation point), the Hugoniot, Rayleigh line, and isentrope are tangent. It can be shown that the flow behind a CJ detonation is sonic relative to the wave: M2=1.
• The CJ points divide the Hugoniot into 4 regions.– Weak deflagrations (subsonic to subsonic)– Strong deflagrations (subsonic to supersonic)– Weak detonations (supersonic to supersonic) – Strong detonations (supersonic to subsonic)
• Strong deflagrations and weak detonations can be ruled out by considering the structure of the wave. Only weak deflagrations and strong detonations are practically observed. Most detonations travel at the CJ velocity.
5
ZND model of detonationZND model of detonation
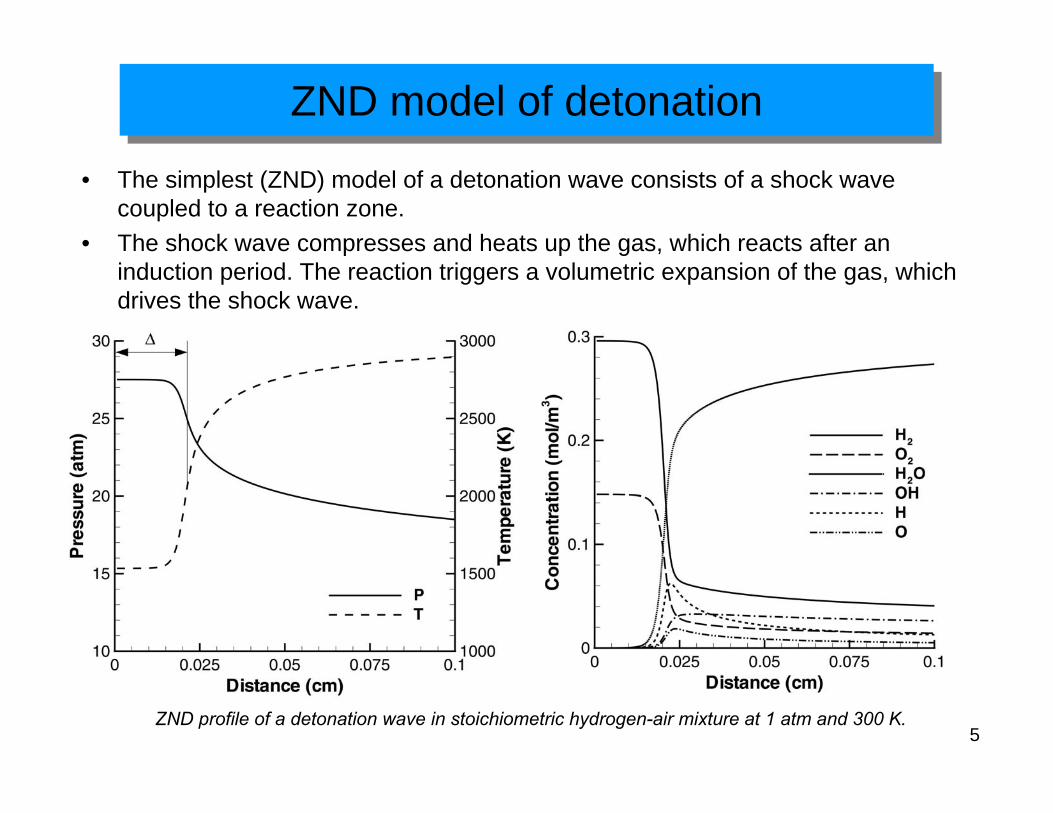
• The simplest (ZND) model of a detonation wave consists of a shock wave coupled to a reaction zone.
• The shock wave compresses and heats up the gas, which reacts after an induction period. The reaction triggers a volumetric expansion of the gas, which drives the shock wave.
ZND profile of a detonation wave in stoichiometric hydrogen-air mixture at 1 atm and 300 K.
6
Detonation structureDetonation structure
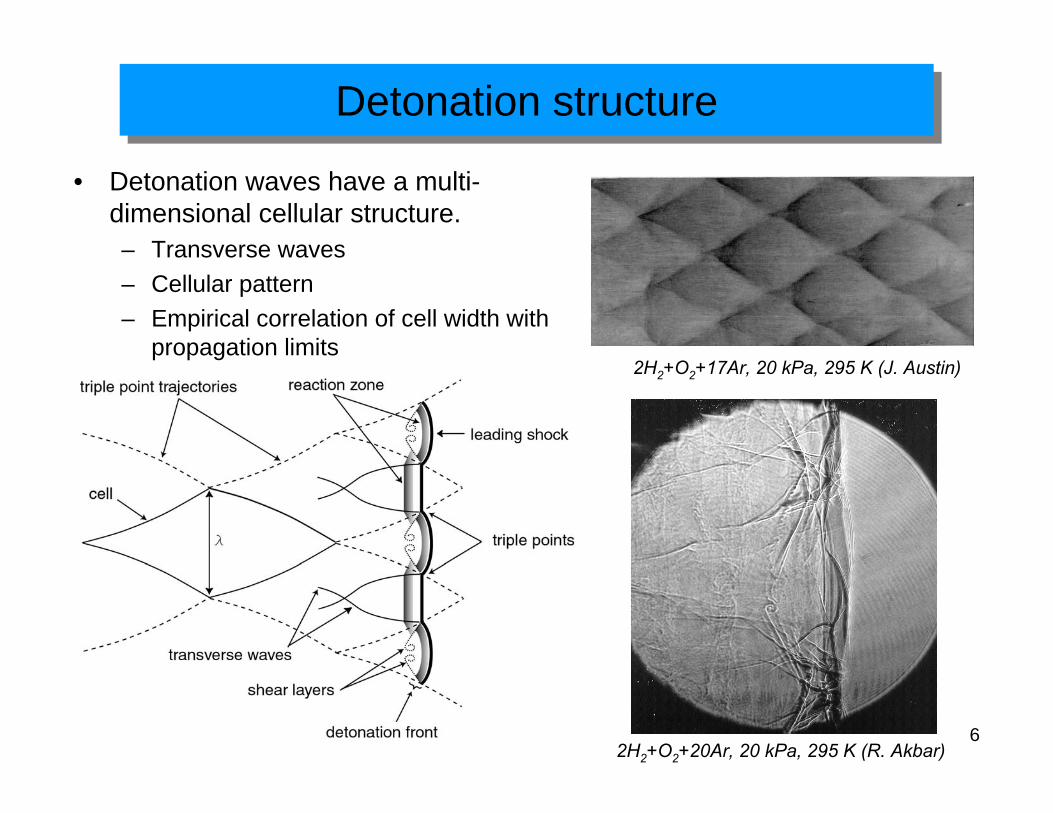
• Detonation waves have a multi-dimensional cellular structure.– Transverse waves– Cellular pattern– Empirical correlation of cell width with
propagation limits
2H2+O2+20Ar, 20 kPa, 295 K (R. Akbar)
2H2+O2+17Ar, 20 kPa, 295 K (J. Austin)
7
Flow behind a propagating detonationFlow behind a propagating detonation
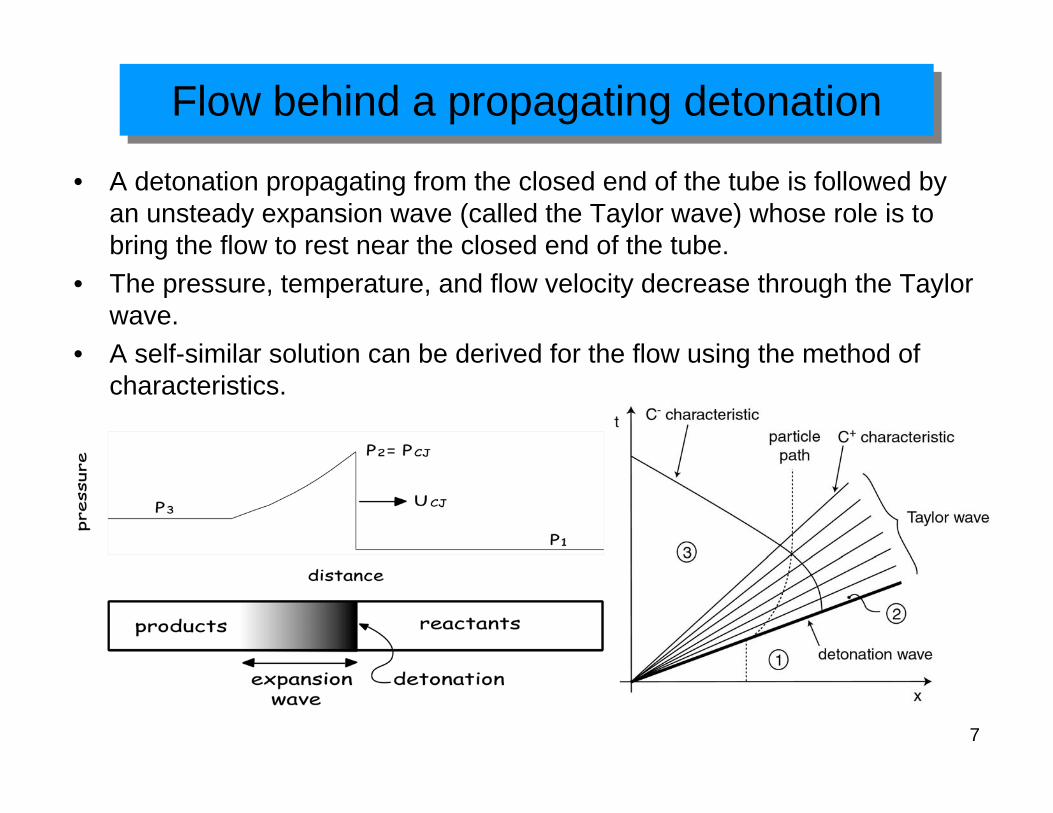
• A detonation propagating from the closed end of the tube is followed by an unsteady expansion wave (called the Taylor wave) whose role is to bring the flow to rest near the closed end of the tube.
• The pressure, temperature, and flow velocity decrease through the Taylor wave.
• A self-similar solution can be derived for the flow using the method ofcharacteristics.
8
Pulsejet enginesPulsejet engines
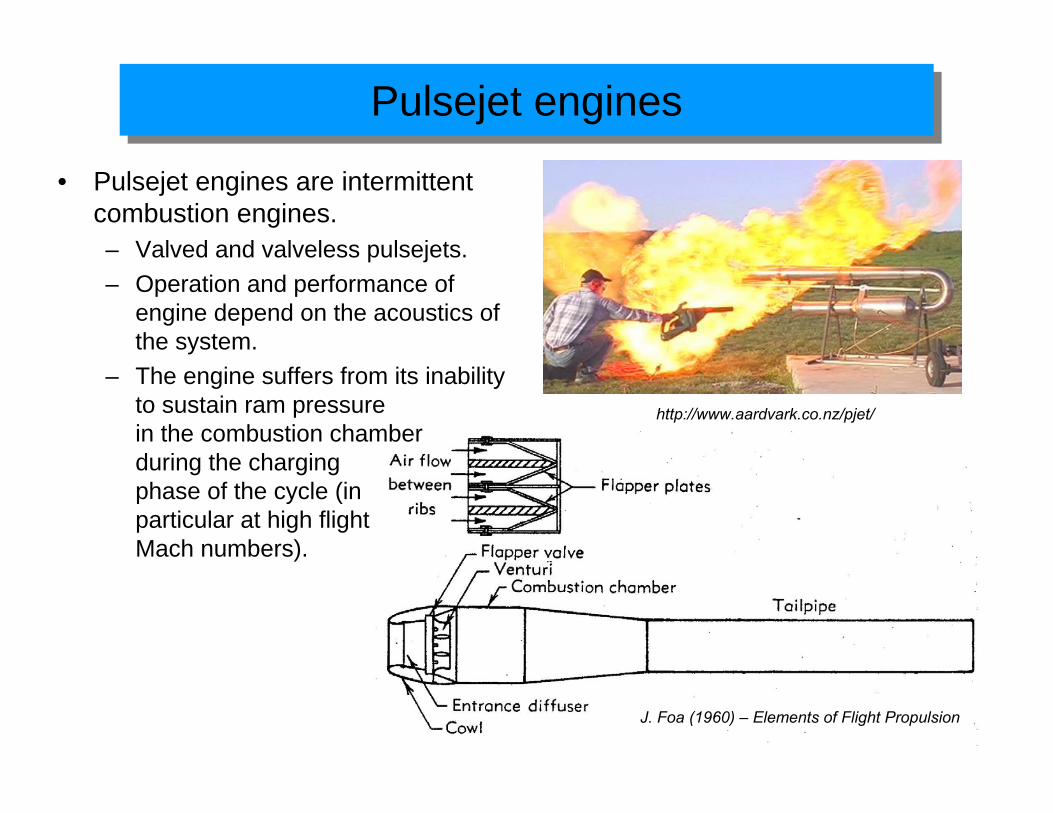
• Pulsejet engines are intermittent combustion engines.– Valved and valveless pulsejets.– Operation and performance of
engine depend on the acoustics of the system.
– The engine suffers from its inability to sustain ram pressure in the combustion chamber during the charging phase of the cycle (in particular at high flight Mach numbers).
http://www.aardvark.co.nz/pjet/
J. Foa (1960) – Elements of Flight Propulsion
9
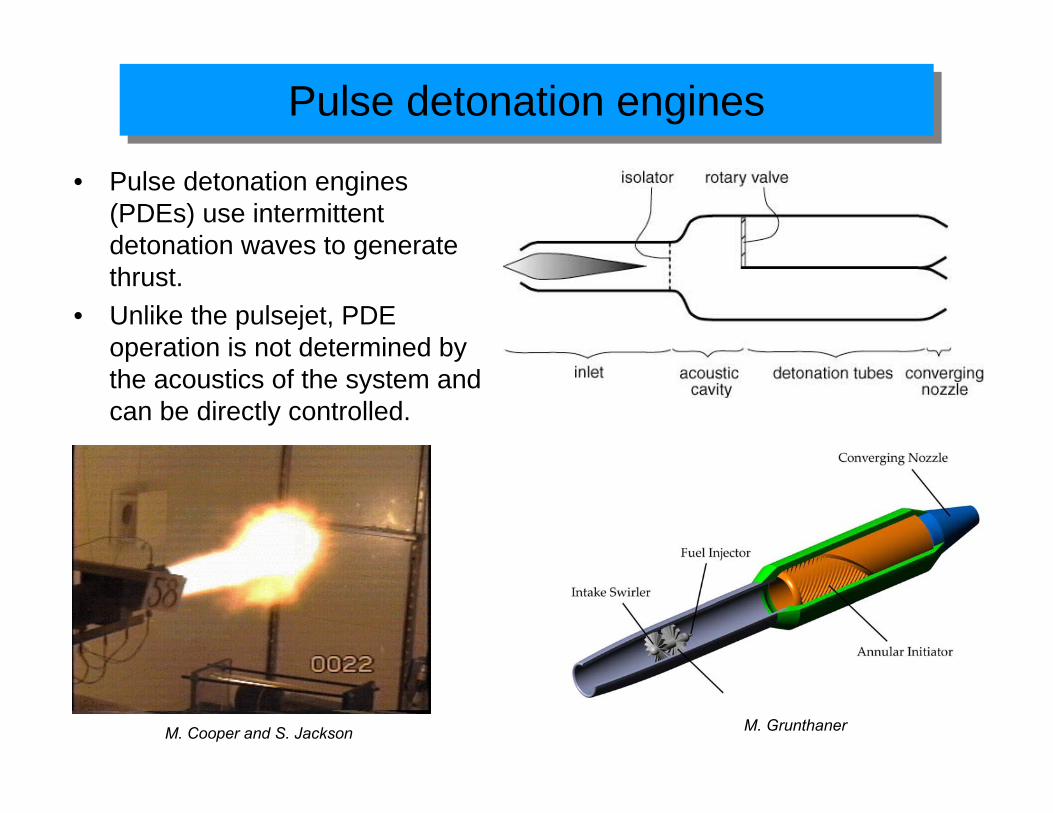
Pulse detonation enginesPulse detonation engines
• Pulse detonation engines (PDEs) use intermittent detonation waves to generate thrust.
• Unlike the pulsejet, PDE operation is not determined by the acoustics of the system and can be directly controlled.
M. Cooper and S. Jackson M. Grunthaner
10
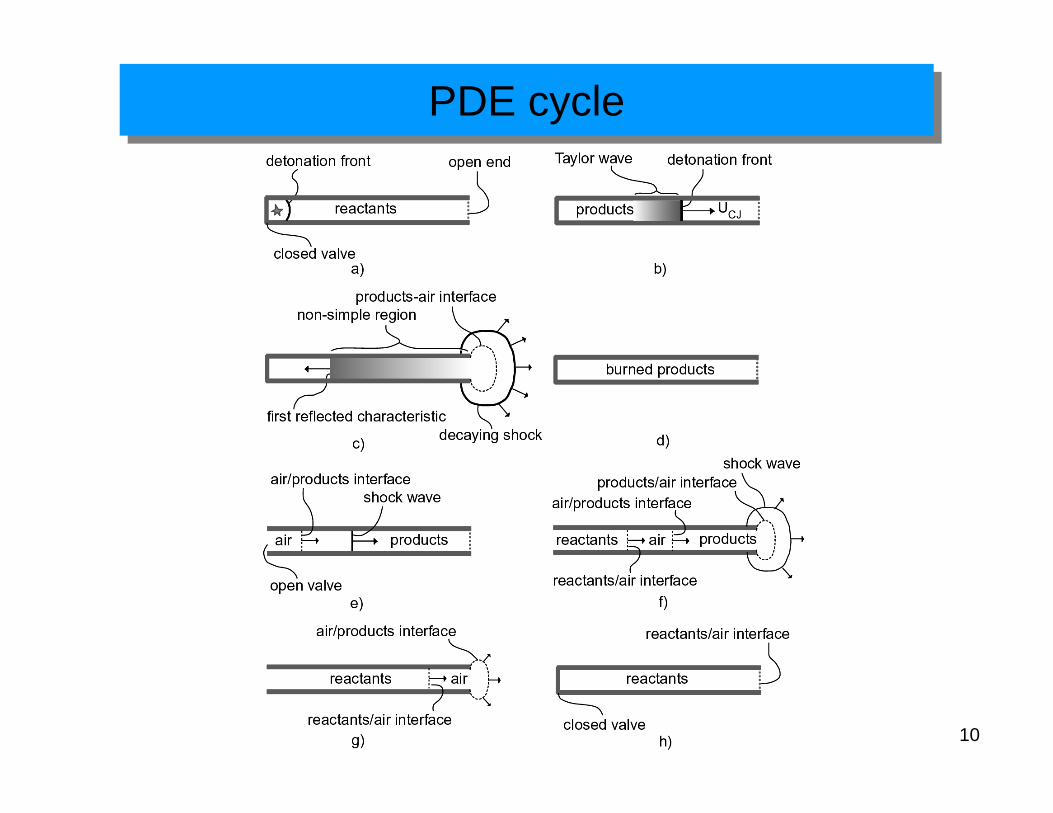
PDE cyclePDE cycle
11
PDE applications and issuesPDE applications and issues
• PDEs typically operate at a frequency of 50-100 Hz, which means that a typical cycle time is on the order of 10-20 ms.
• A wide variety of applications have been proposed for PDEs: supersonic vehicles, cruise missiles, afterburners, UAVs, SSTO launchers, rockets…
• Laboratory-scale PDEs are currently being tested, but there has not been any PDE flight test as of January 2004.
• There are still a number of issues to be resolved:– Inlets for PDEs have to undergo large pressure fluctuations.– Injection and mixing.– Detonation initiation in insensitive liquid fuel-air mixtures.– PDE performance.– Influence of exit nozzle and ejectors on performance and operation.
• The flow in a PDE is a challenging research problem, because it involves compressible, chemically reactive flow in complex geometrical configurations with moving boundaries.
12
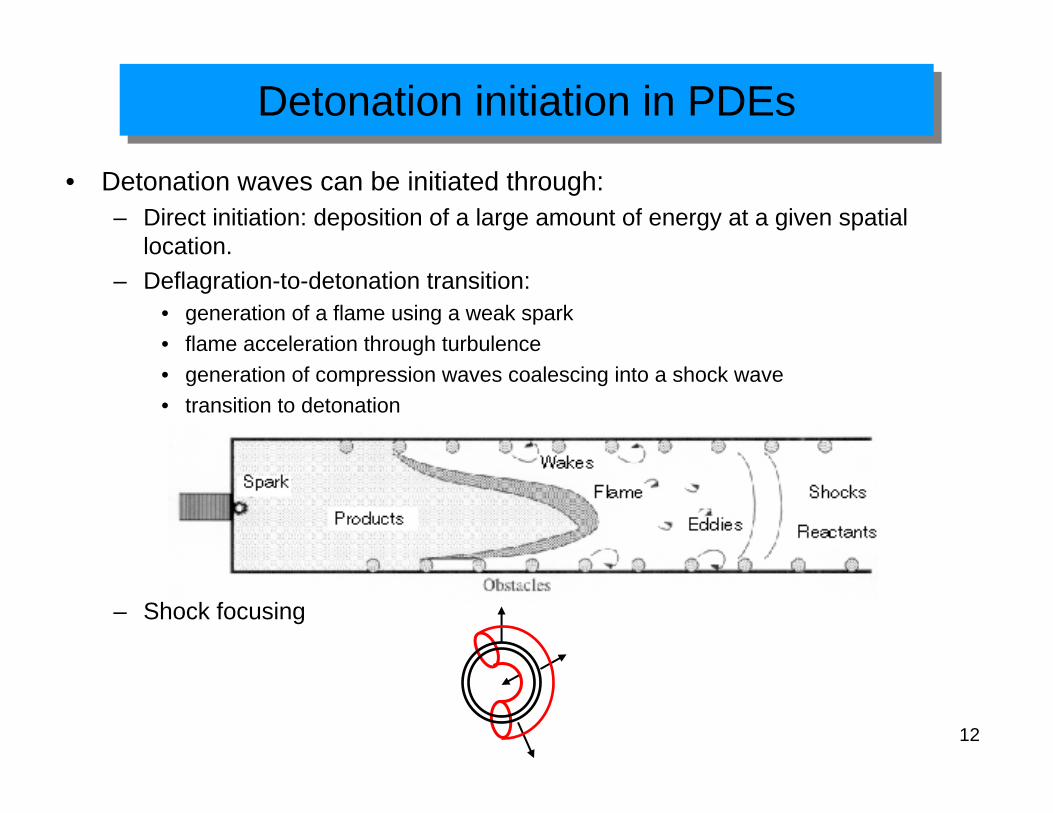
Detonation initiation in PDEsDetonation initiation in PDEs
• Detonation waves can be initiated through:– Direct initiation: deposition of a large amount of energy at a given spatial
location.– Deflagration-to-detonation transition:
• generation of a flame using a weak spark• flame acceleration through turbulence• generation of compression waves coalescing into a shock wave• transition to detonation
– Shock focusing
13
Detonation initiation techniquesDetonation initiation techniques
• Fuels of interest for air-breathing propulsion are liquid fuels such as JP10. These fuels are quite insensitive to detonation: the cell size for JP10 is λJP10 = 60 mm at atmospheric pressure.
• For detonation propagation in a tube, dmin > λJP10 = 60 mm.• Direct detonation initiation requires large amounts of energy and is not practical.• Deflagration-to-detonation transition is a practical way to initiate detonations.
However, there is a minimum distance required for transition.
L
Lmin > 7λJP10 = 420 mm (Dorofeev, 2000)
• Another technique is to initiate a detonation in a small sensitized driver (e.g., fuel-oxygen), which diffracts into the main detonation chamber. d Mixture 2Mixture 1
Driver Tube
Test Section
14
Annular implosion initiatorAnnular implosion initiator
• Idea: to create an imploding detonation wave in a sensitized driver that implodes on the axis of the main detonation tube.
• Advantage: no flow blockage, low drag initiator for PDEs.
Air
Valve
Exit
Fuel
Swirl
S. Jackson
15
Single cycle of a pulse detonation engineSingle cycle of a pulse detonation engine
open endthrust surface UCJ reactantsproducts
The detonation wave, followed by the Taylor wave, is initiated at the closed end of the detonation tube and propagates towards the open end.
airproducts
reflected wave
transmitted shock
When the detonation wave reaches the open end of the tube, the products expand outside the tube. A diffracted shock and a reflected wave are created.
impulse
16
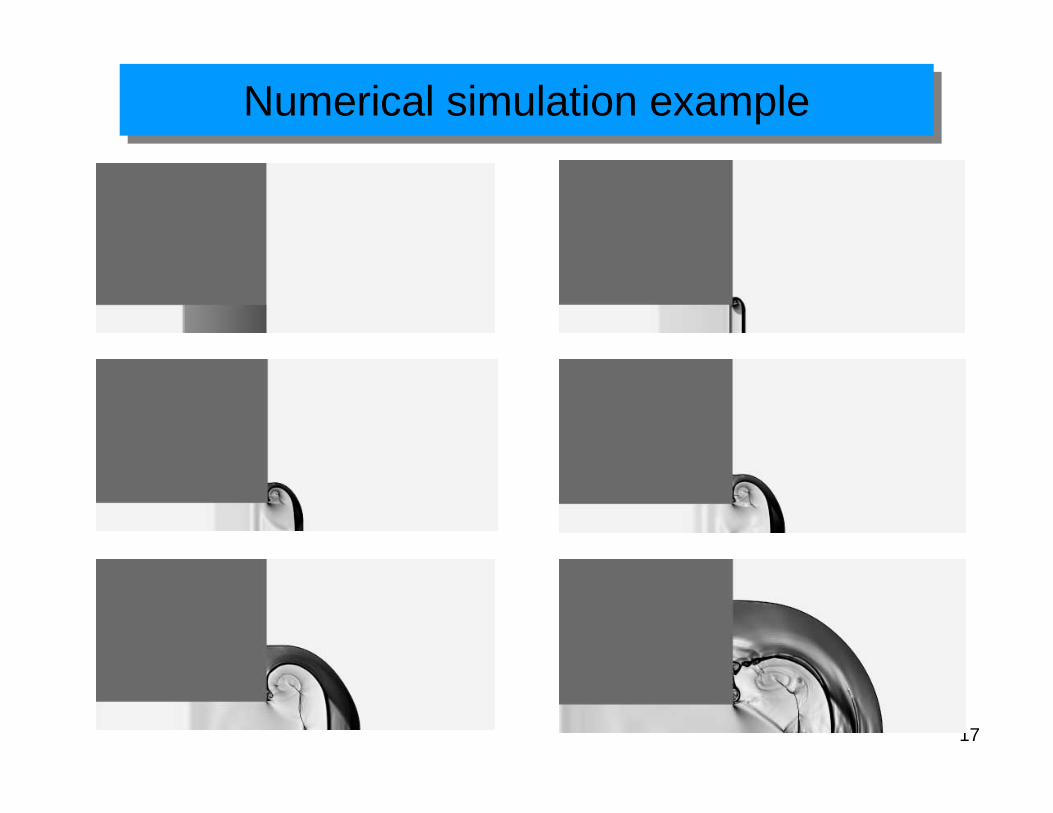
Gas dynamics inside the detonation tubeGas dynamics inside the detonation tube
• During a cycle, thrust is generated as long as the pressure inside the tube on the thrust surface is greater than the atmospheric pressure.
• After the passage of the detonation wave, the pressure at the thrust surface remains constant until the reflected wave (expansion wave on the diagram) reaches the thrust surface.
x-t diagram
17
Numerical simulation exampleNumerical simulation example
18
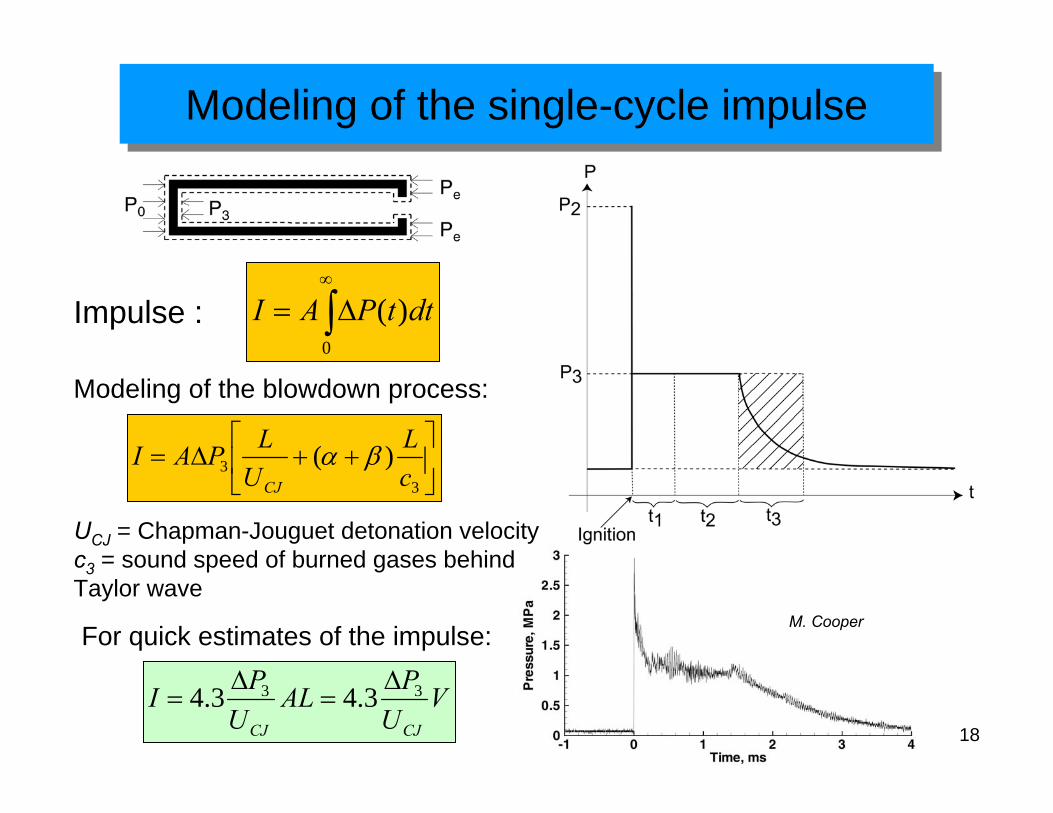
Modeling of the single-cycle impulseModeling of the single-cycle impulse
UCJ = Chapman-Jouguet detonation velocityc3 = sound speed of burned gases behind Taylor wave
Modeling of the blowdown process:
⎥⎦
⎤⎢⎣
⎡++∆=
33 )(
cL
ULPAICJ
βα
VUPAL
UPI
CJCJ
33 3.43.4 ∆=
∆=
For quick estimates of the impulse:
∫∞
∆=0
)( dttPAIImpulse :
M. Cooper
19
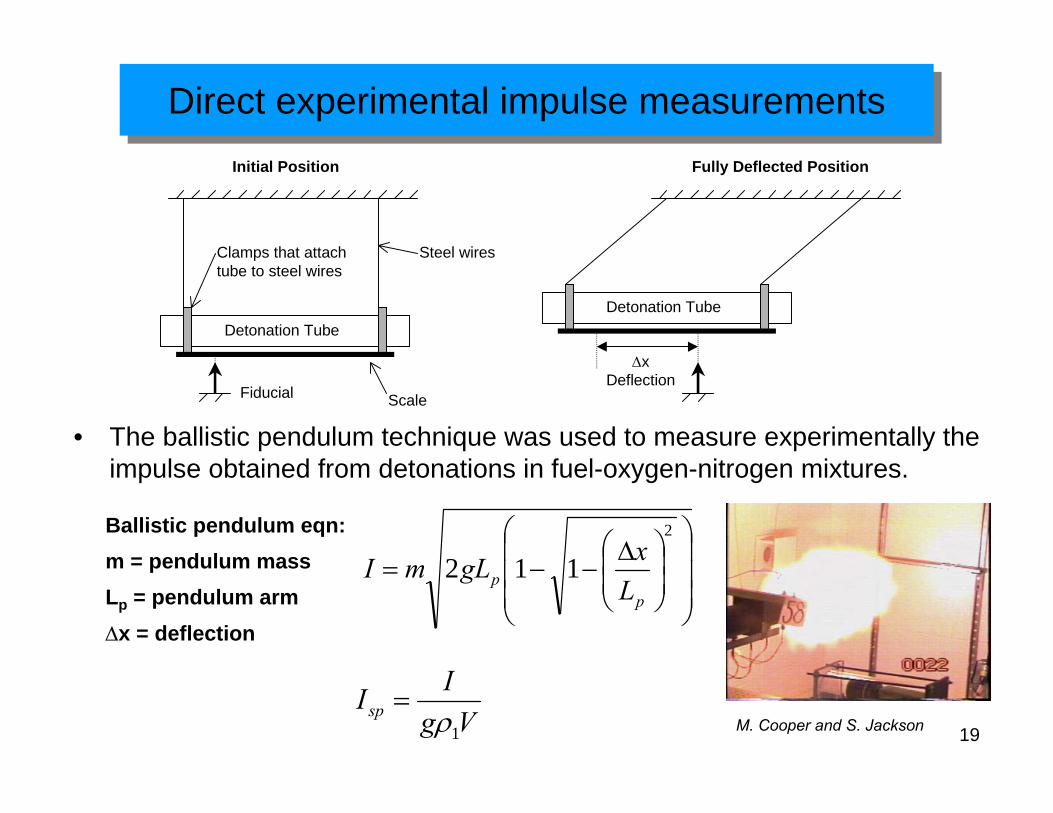
Direct experimental impulse measurementsDirect experimental impulse measurements
• The ballistic pendulum technique was used to measure experimentally the impulse obtained from detonations in fuel-oxygen-nitrogen mixtures.
Detonation Tube
Clamps that attach tube to steel wires
Steel wires
Detonation Tube
ScaleFiducial
∆xDeflection
Initial Position Fully Deflected Position
Ballistic pendulum eqn:m = pendulum massLp = pendulum arm∆x = deflection
⎟⎟⎟
⎠
⎞
⎜⎜⎜
⎝
⎛
⎟⎟⎠
⎞⎜⎜⎝
⎛ ∆−−=
2
112p
p LxgLmI
VgIIsp1ρ
=M. Cooper and S. Jackson
20
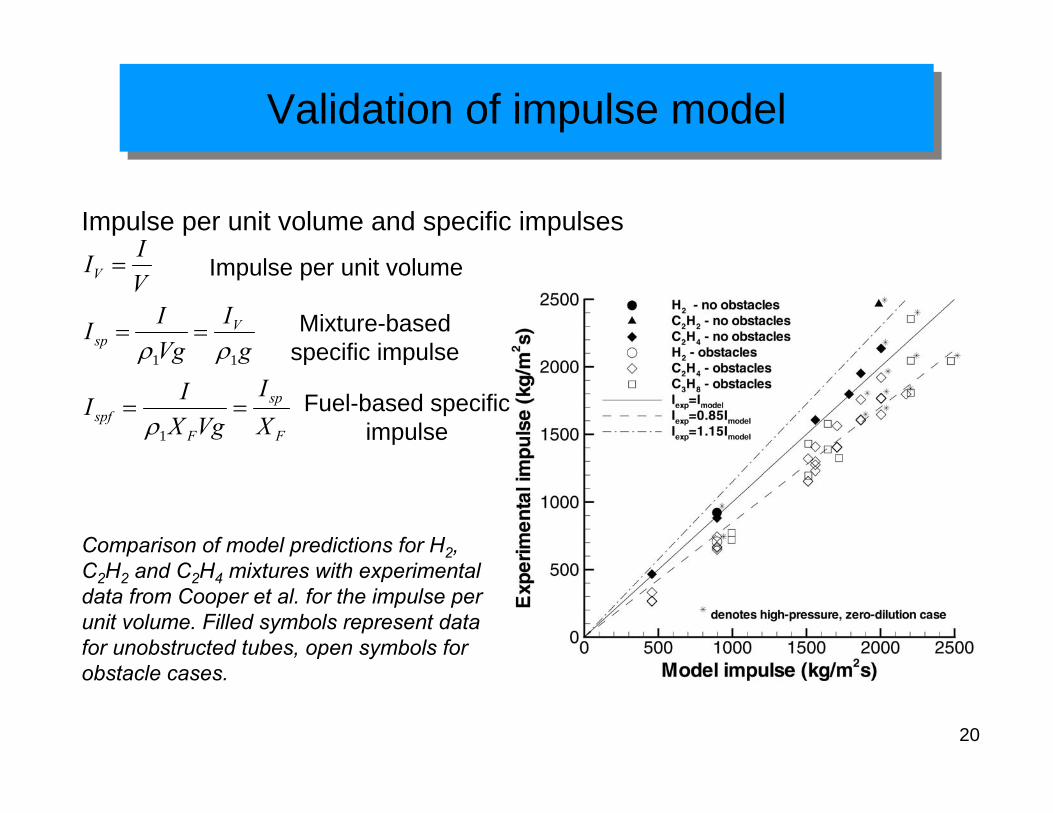
Validation of impulse modelValidation of impulse model
F
sp
Fspf
Vsp
V
XI
VgXII
gI
VgII
VII
==
==
=
1
11
ρ
ρρ
Impulse per unit volume and specific impulses
Comparison of model predictions for H2, C2H2 and C2H4 mixtures with experimental data from Cooper et al. for the impulse per unit volume. Filled symbols represent data for unobstructed tubes, open symbols for obstacle cases.
Impulse per unit volume
Mixture-based specific impulse
Fuel-based specific impulse
21
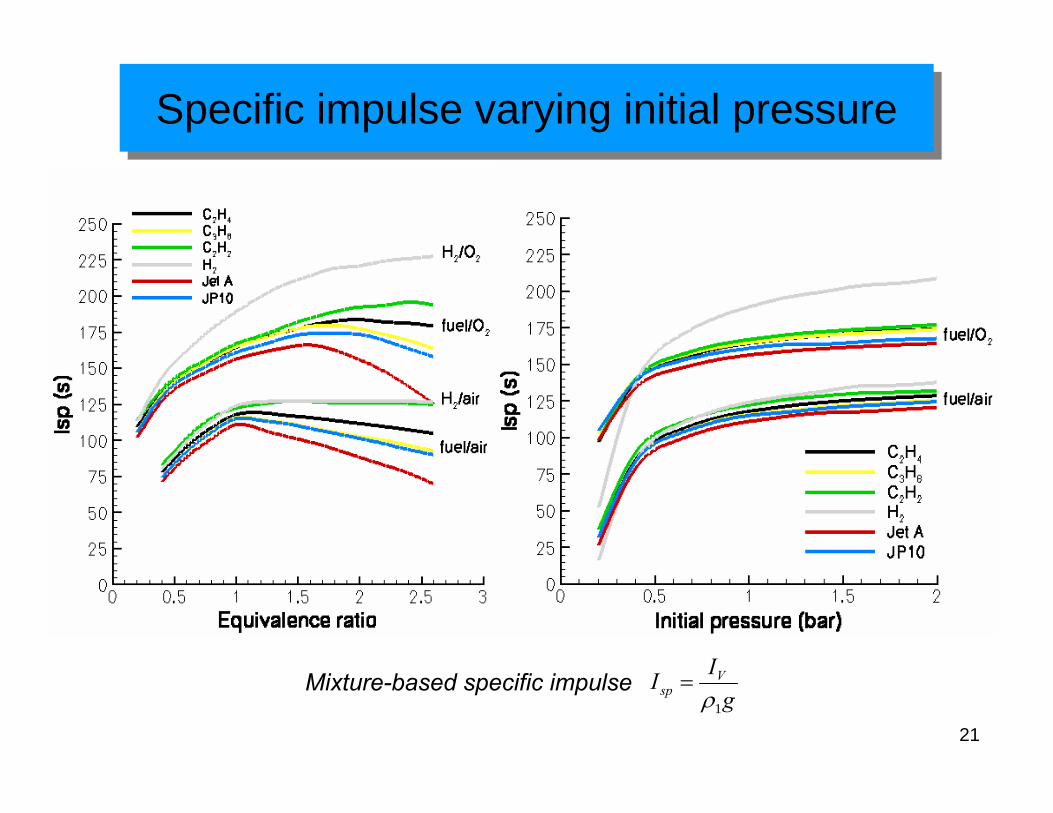
Specific impulse varying initial pressureSpecific impulse varying initial pressure
Mixture-based specific impulsegII V
sp1ρ
=
22
Single-cycle impulse: conclusionsSingle-cycle impulse: conclusions
• The impulse of single idealized cycles can now be reliably estimated.• Performance is primarily determined by
– CJ velocity UCJ
– pressure in stagnation region after Taylor wave P3
• The impulse of a detonation tube is found to scale directly with the mass of explosive m in the tube and the square root of the chemical energy release q.
• At sufficiently high initial pressure, the specific impulse is almost independent of pressure and temperature.
• Specific impulses of most hydrocarbon fuels are similar– 120 s for stoichiometric fuel-air – 160 s for stoichiometric HC-O2
– 190 s for hydrogen-O2
qIqmI sp ∝∝ and
23
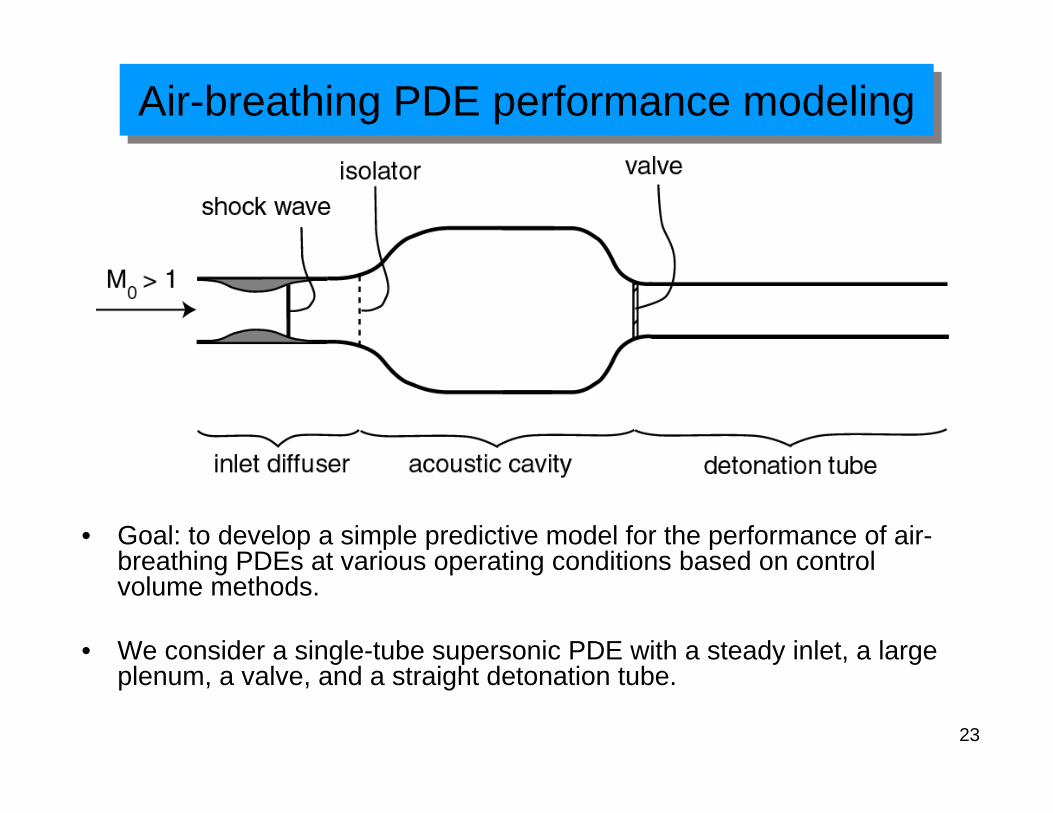
Air-breathing PDE performance modelingAir-breathing PDE performance modeling
• Goal: to develop a simple predictive model for the performance of air-breathing PDEs at various operating conditions based on control volume methods.
• We consider a single-tube supersonic PDE with a steady inlet, a large plenum, a valve, and a straight detonation tube.
24
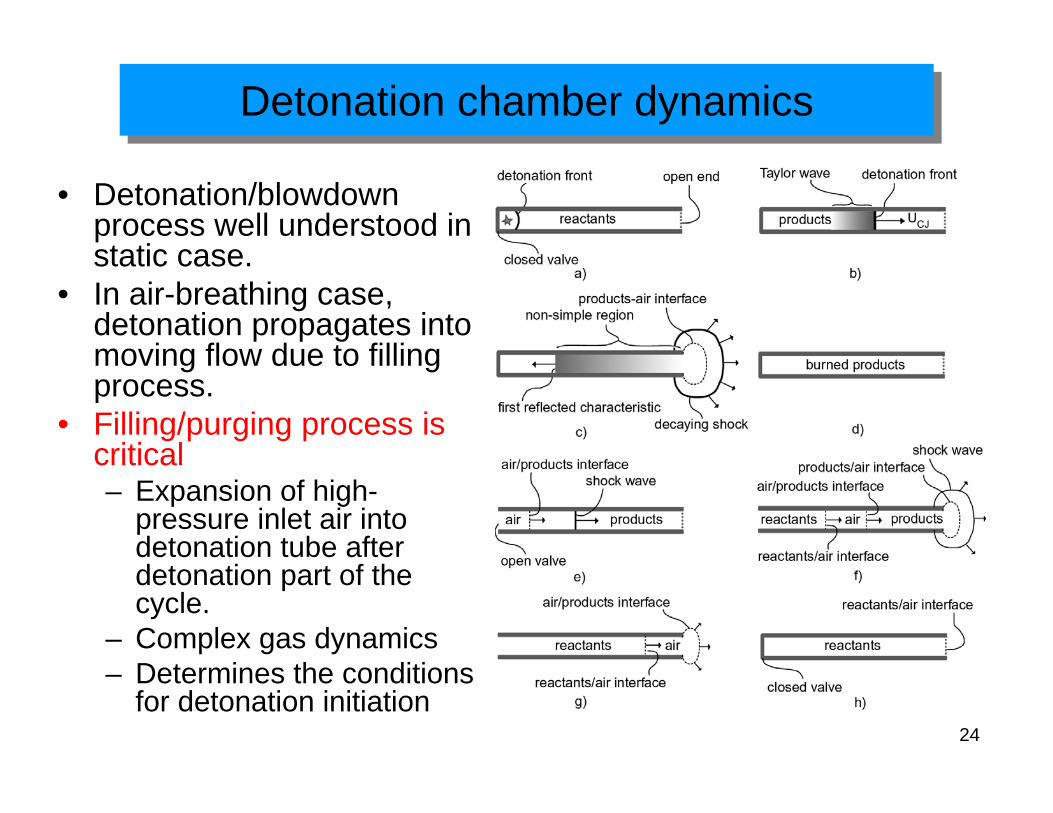
Detonation chamber dynamicsDetonation chamber dynamics
• Detonation/blowdownprocess well understood in static case.
• In air-breathing case, detonation propagates into moving flow due to filling process.
• Filling/purging process is critical– Expansion of high-
pressure inlet air into detonation tube after detonation part of the cycle.
– Complex gas dynamics– Determines the conditions
for detonation initiation
25
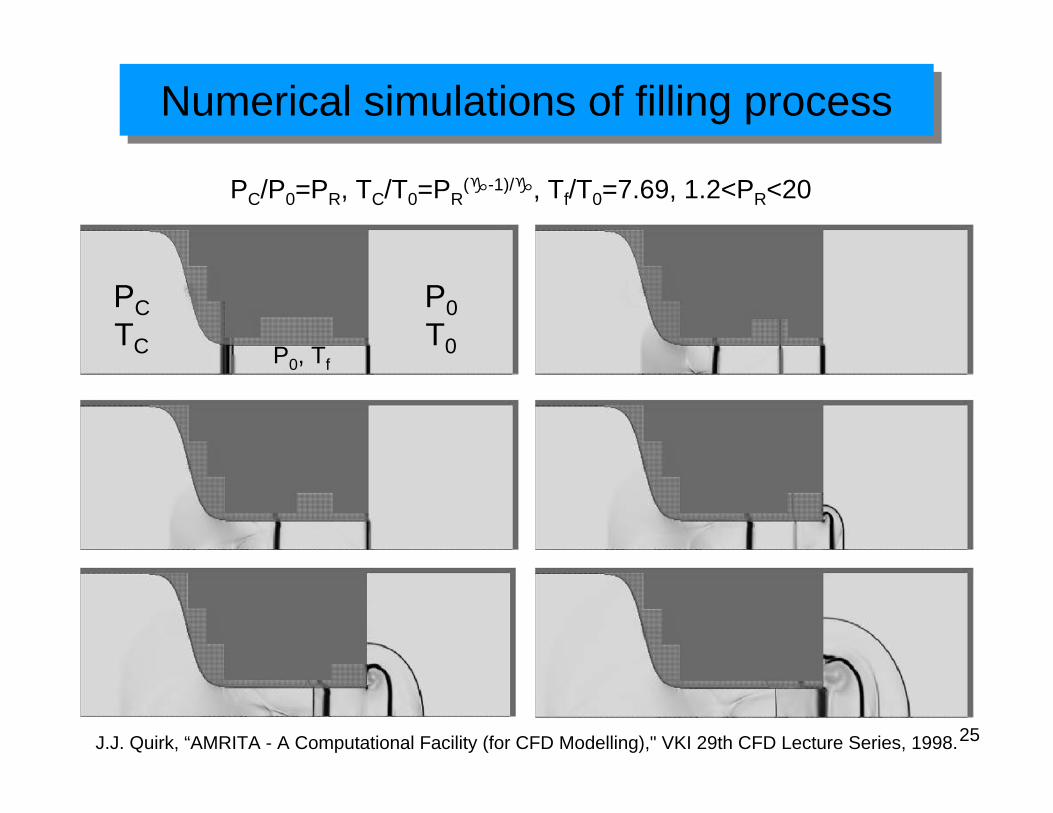
Numerical simulations of filling processNumerical simulations of filling process
J.J. Quirk, “AMRITA - A Computational Facility (for CFD Modelling)," VKI 29th CFD Lecture Series, 1998.
PCTC P0, Tf
P0T0
PC/P0=PR, TC/T0=PR( -1)/ , Tf/T0=7.69, 1.2<PR<20
26
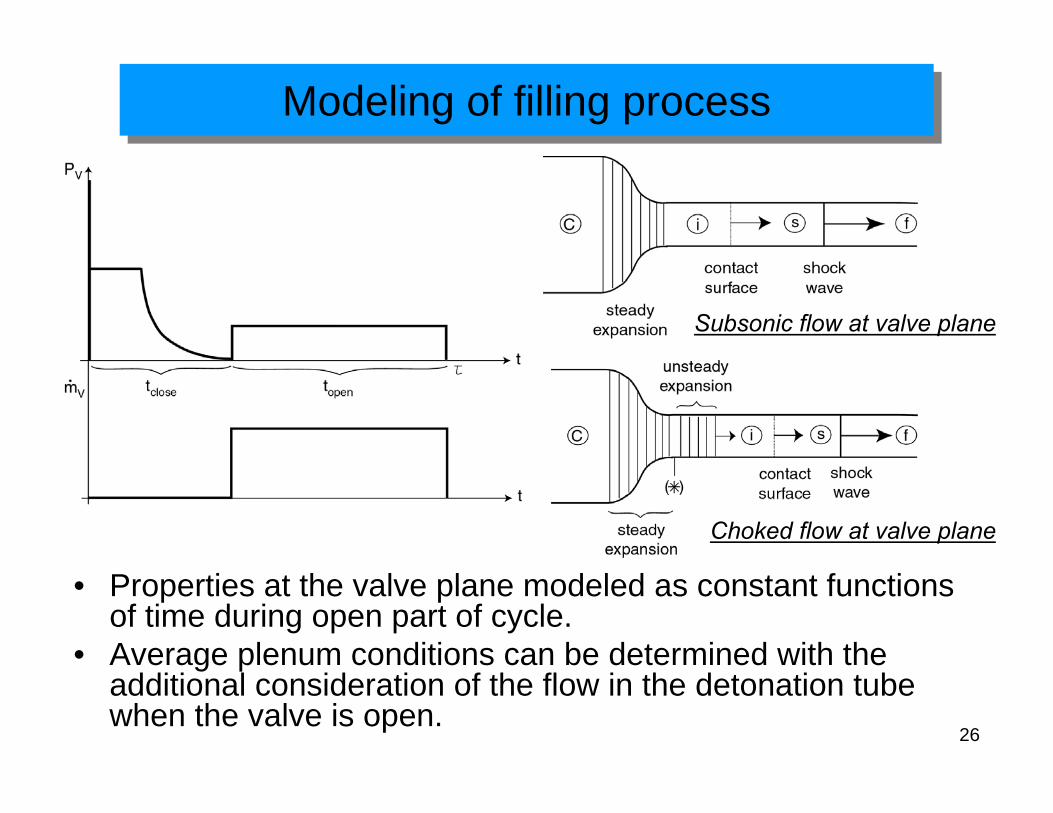
Modeling of filling processModeling of filling process
Subsonic flow at valve plane
Choked flow at valve plane
• Properties at the valve plane modeled as constant functions of time during open part of cycle.
• Average plenum conditions can be determined with the additional consideration of the flow in the detonation tube when the valve is open.
27PR
PV/P
0
5 10 15 200
2
4
6
8
10
12modelAmrita
PR
u/c
0
5 10 15 200
0.5
1
1.5
2
2.5
3 uV - modeluV - AmritaUfill - modelUfill - Amrita
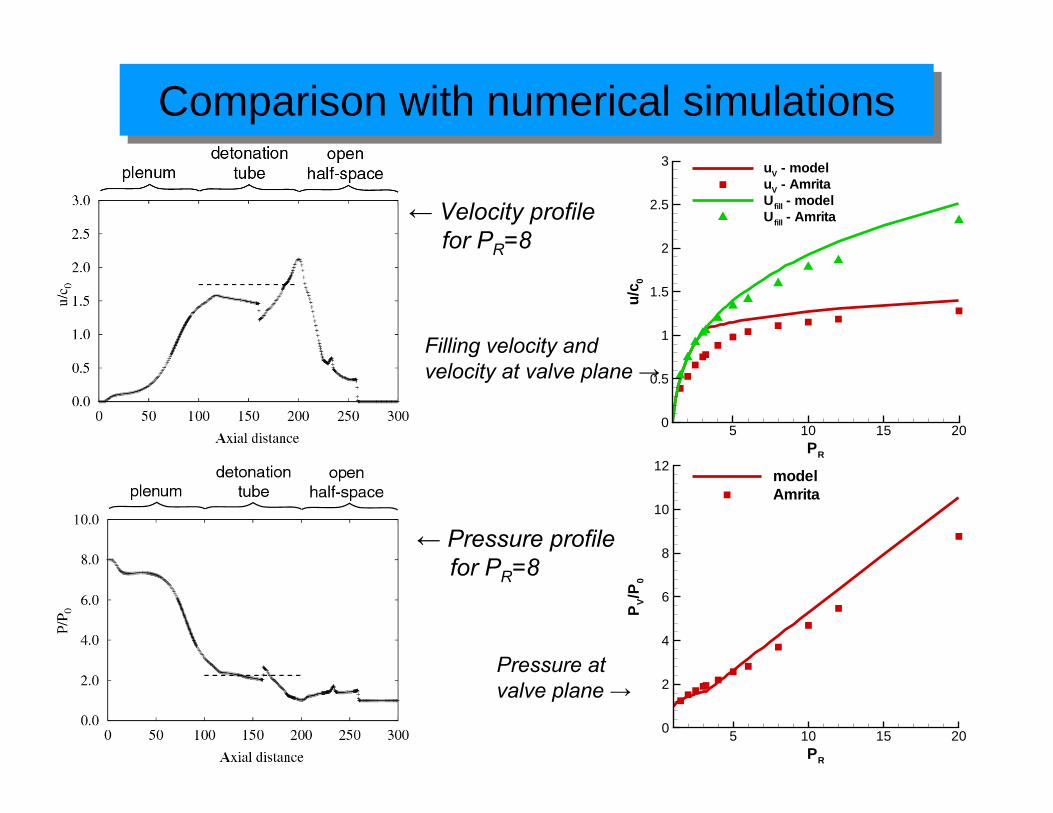
Comparison with numerical simulationsComparison with numerical simulations
← Velocity profile for PR=8
← Pressure profile for PR=8
Filling velocity and velocity at valve plane →
Pressure at valve plane →
28
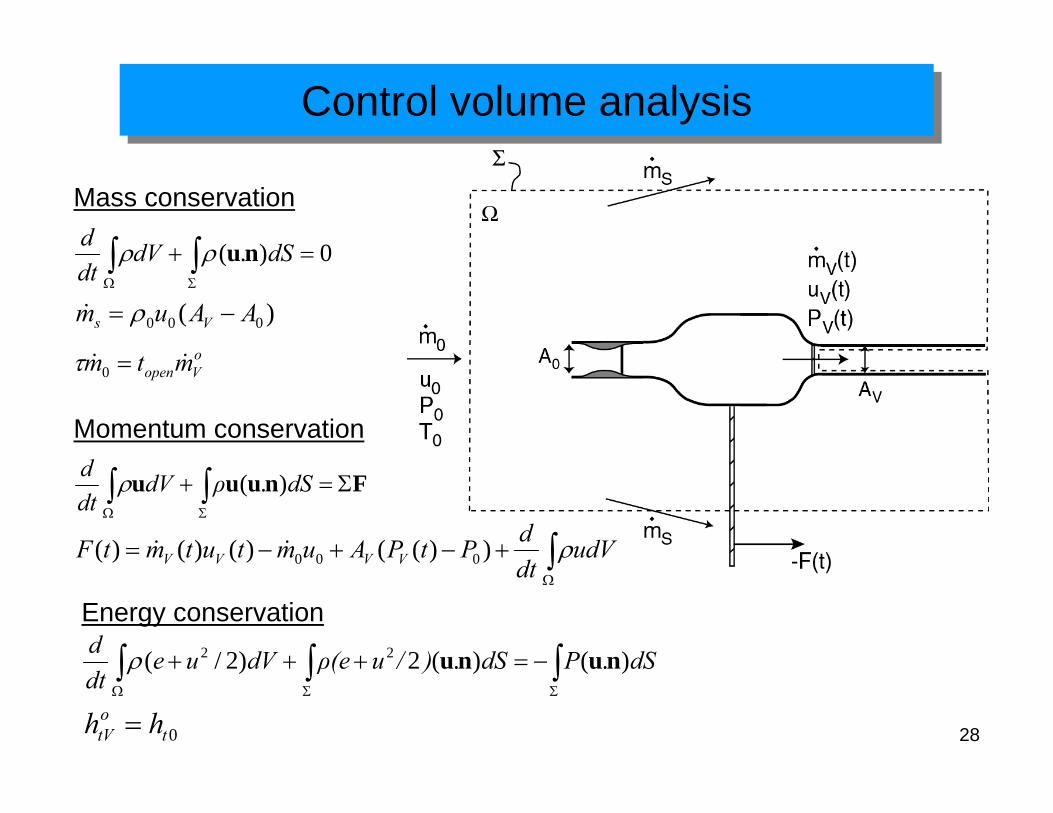
Control volume analysisControl volume analysis
)( 000 AAum Vs −= ρ&
0).( =+ ∫∫ΣΩ
dSdVdtd nuρρ
∫Ω
+−+−= udVdtdPtPAumtutmtF VVVV ρ))(()()()( 000&&
∫ ∫Ω Σ
Σ=+ Fnuuu dSρdVdtd ).(ρ
dSPdS)/uρ(edVuedtd ).().(2)2/( 22 nunu∫ ∫ ∫
Ω Σ Σ
−=+++ρ
Mass conservation
Momentum conservation
Energy conservation
0totV hh =
oVopenmtm && =0τ
29
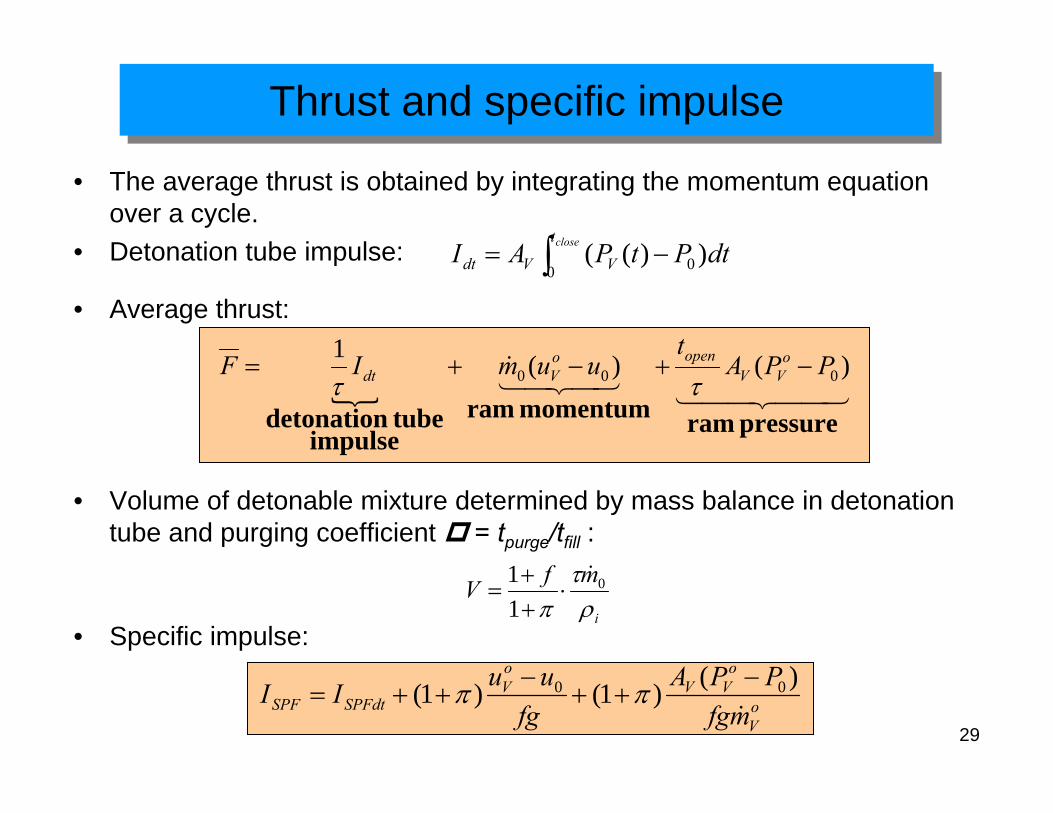
Thrust and specific impulseThrust and specific impulse
• The average thrust is obtained by integrating the momentum equation over a cycle.
• Detonation tube impulse: ∫ −= closet
VVdt dtPtPAI0 0 ))((
44 344 2143421
&
pressure rammomentum ramimpulse
tube detonation
)()(1000 PPA
tuumIF o
VVopeno
Vdt −+−+=ττ
• Average thrust:
• Volume of detonable mixture determined by mass balance in detonation tube and purging coefficient = tpurge/tfill :
i
mfVρτ
π0
11 &
⋅++
=
• Specific impulse:
oV
oVV
oV
SPFdtSPF mfgPPA
fguuII
&
)()1()1( 00 −++
−++= ππ
30
Mfill
∫(P3-
P0)
dtc i/V
Pi
0 1 2 30
1
2
3
4
5modelAmrita
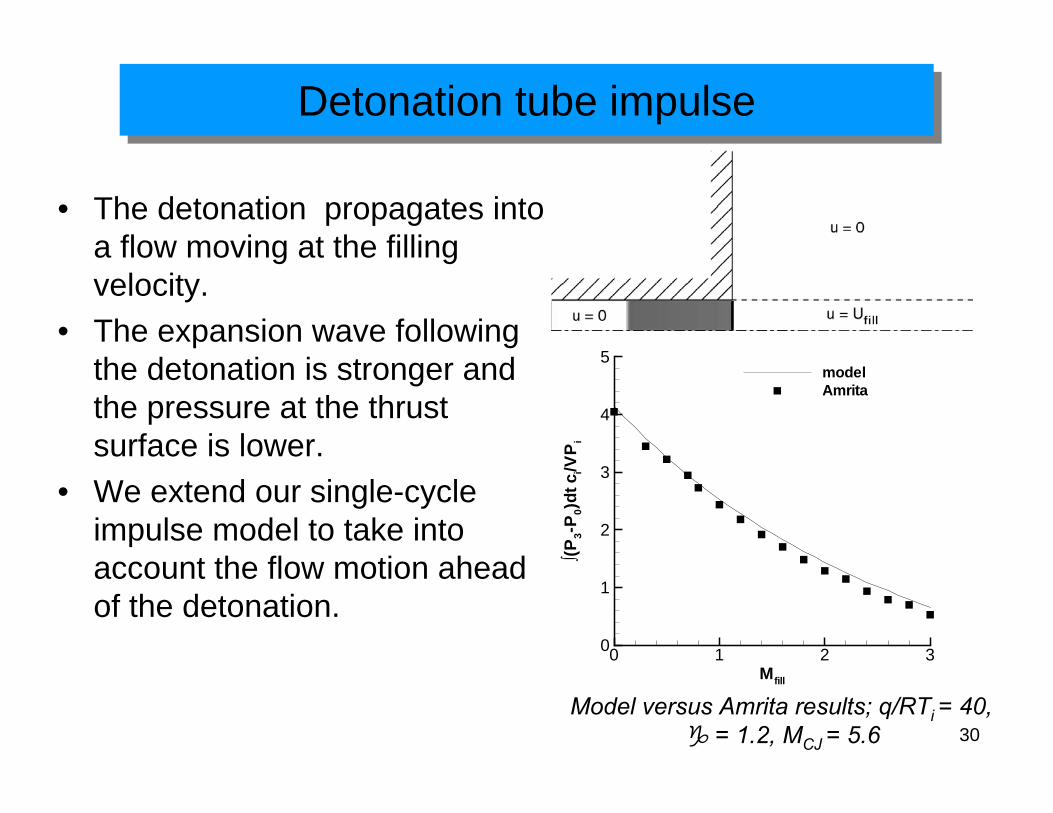
Detonation tube impulseDetonation tube impulse
• The detonation propagates into a flow moving at the filling velocity.
• The expansion wave following the detonation is stronger and the pressure at the thrust surface is lower.
• We extend our single-cycle impulse model to take into account the flow motion ahead of the detonation.
Model versus Amrita results; q/RTi = 40, = 1.2, MCJ = 5.6
31
M0
Spe
cific
impu
lse
(s)
0 1 2 3 4 50
1000
2000
3000
4000
5000
PDE - H2
ramjet - H2
PDE - JP10ramjet - JP10Yang - H2
Schauer et al. - H2
impulse model - H2
CIT- JP10impulse model - JP10
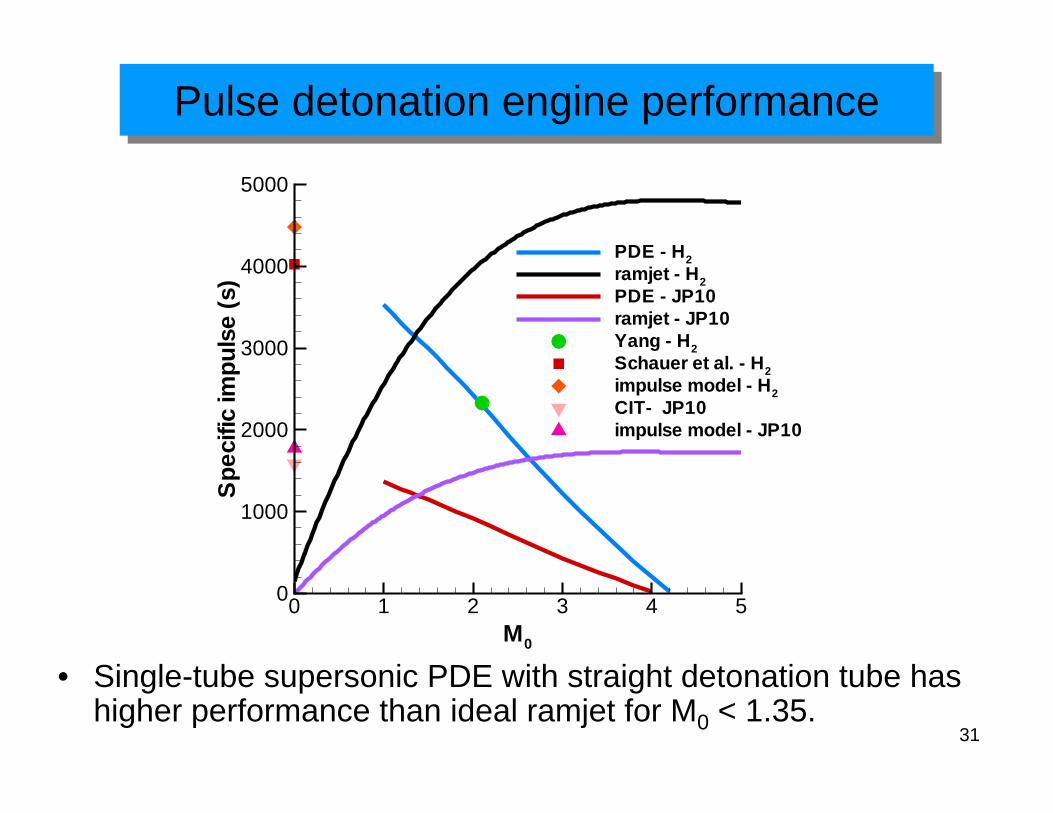
Pulse detonation engine performancePulse detonation engine performance
• Single-tube supersonic PDE with straight detonation tube has higher performance than ideal ramjet for M0 < 1.35.
32
Air-breathing PDE: conclusionsAir-breathing PDE: conclusions
• We have developed a simple model for predicting the performance of a single-tube air-breathing pulse detonation engine, based on unsteady control volume analysis and elementary gas dynamics.
• The model allows to determine the flow within the engine:– Flow in plenum and detonation tube is coupled.– Stagnation pressure in plenum is lower than downstream of inlet.– Flow in plenum is periodic.– Moving flow ahead of detonation wave.
• Performance was calculated – Detonation tube impulse accounts for motion of flow ahead of detonation.– Specific performance calculated for H2-air and JP10-air PDEs.– PDEs with straight detonation tube competitive with ideal ramjet below
Mach 1.35.
33
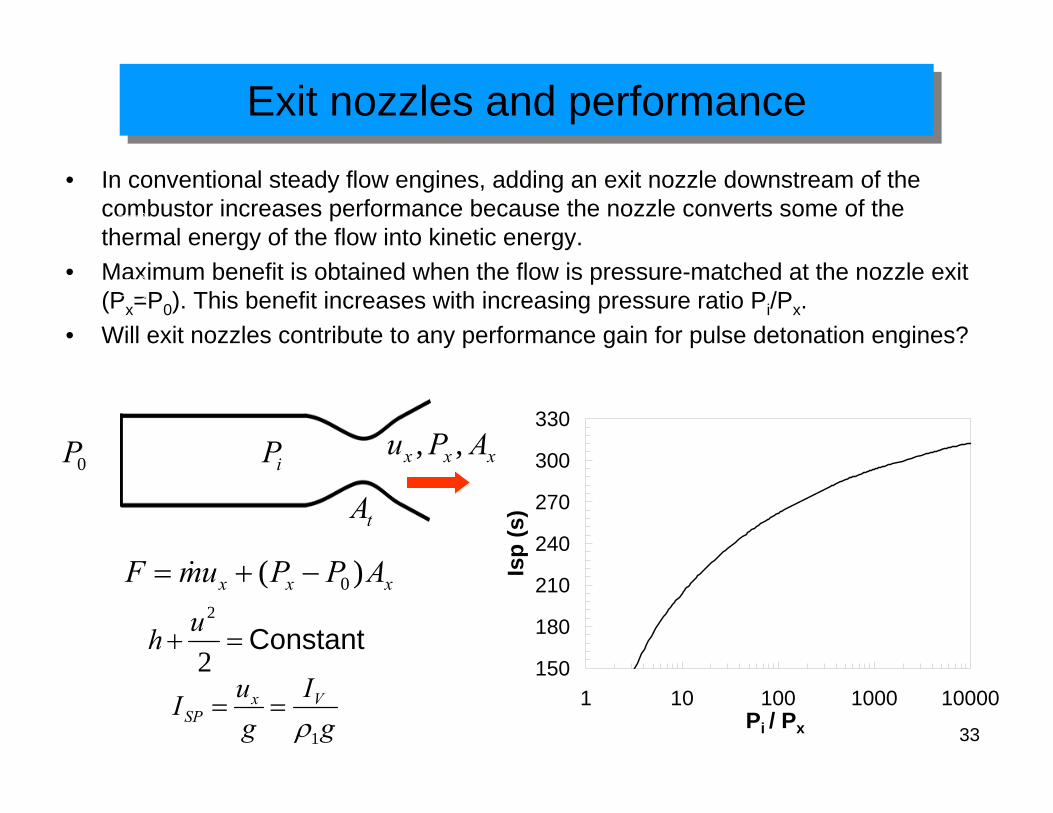
Exit nozzles and performanceExit nozzles and performance
• In conventional steady flow engines, adding an exit nozzle downstream of the combustor increases performance because the nozzle converts some of the thermal energy of the flow into kinetic energy.
• Maximum benefit is obtained when the flow is pressure-matched at the nozzle exit (Px=P0). This benefit increases with increasing pressure ratio Pi/Px.
• Will exit nozzles contribute to any performance gain for pulse detonation engines?
Constant=+2
2uh
xxx APPumF )( 0−+= &
xxx APu ,,
tA0P iP
150
180
210
240
270
300
330
1 10 100 1000 10000Pi / Px
Isp
(s)
gI
guI Vx
SP1ρ
==
34
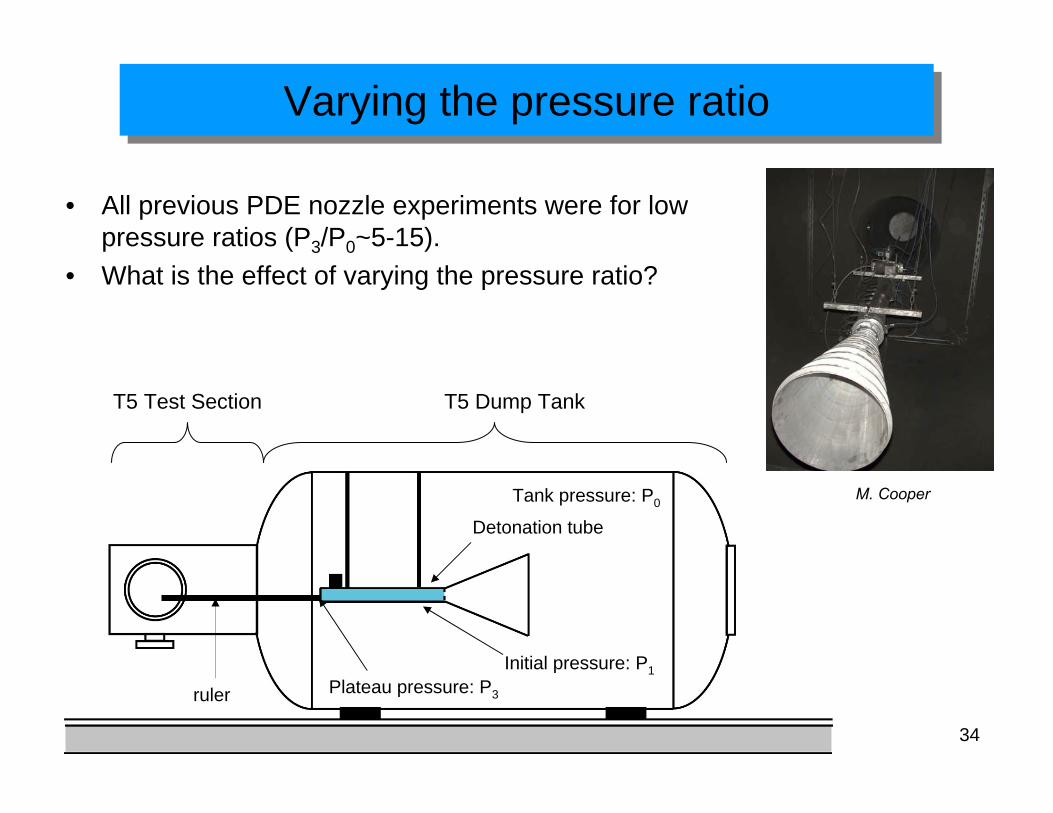
Varying the pressure ratioVarying the pressure ratio
• All previous PDE nozzle experiments were for low pressure ratios (P3/P0~5-15).
• What is the effect of varying the pressure ratio?
T5 Test Section T5 Dump Tank
Detonation tube
ruler
Tank pressure: P0
Initial pressure: P1Plateau pressure: P3
M. Cooper
35
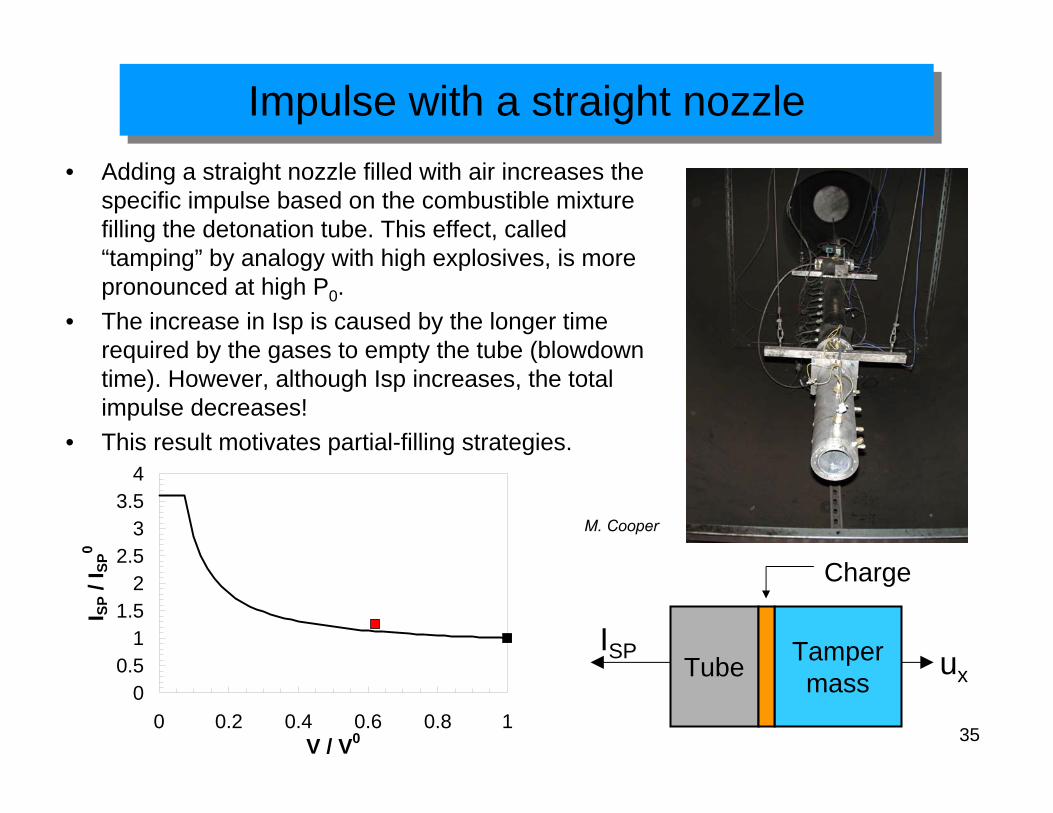
Impulse with a straight nozzleImpulse with a straight nozzle• Adding a straight nozzle filled with air increases the
specific impulse based on the combustible mixture filling the detonation tube. This effect, called “tamping” by analogy with high explosives, is more pronounced at high P0.
• The increase in Isp is caused by the longer time required by the gases to empty the tube (blowdown time). However, although Isp increases, the total impulse decreases!
• This result motivates partial-filling strategies.
00.5
11.5
22.5
33.5
4
0 0.2 0.4 0.6 0.8 1V / V0
I SP
/ ISP
0
Tamper massTube
ISP ux
Charge
M. Cooper
36
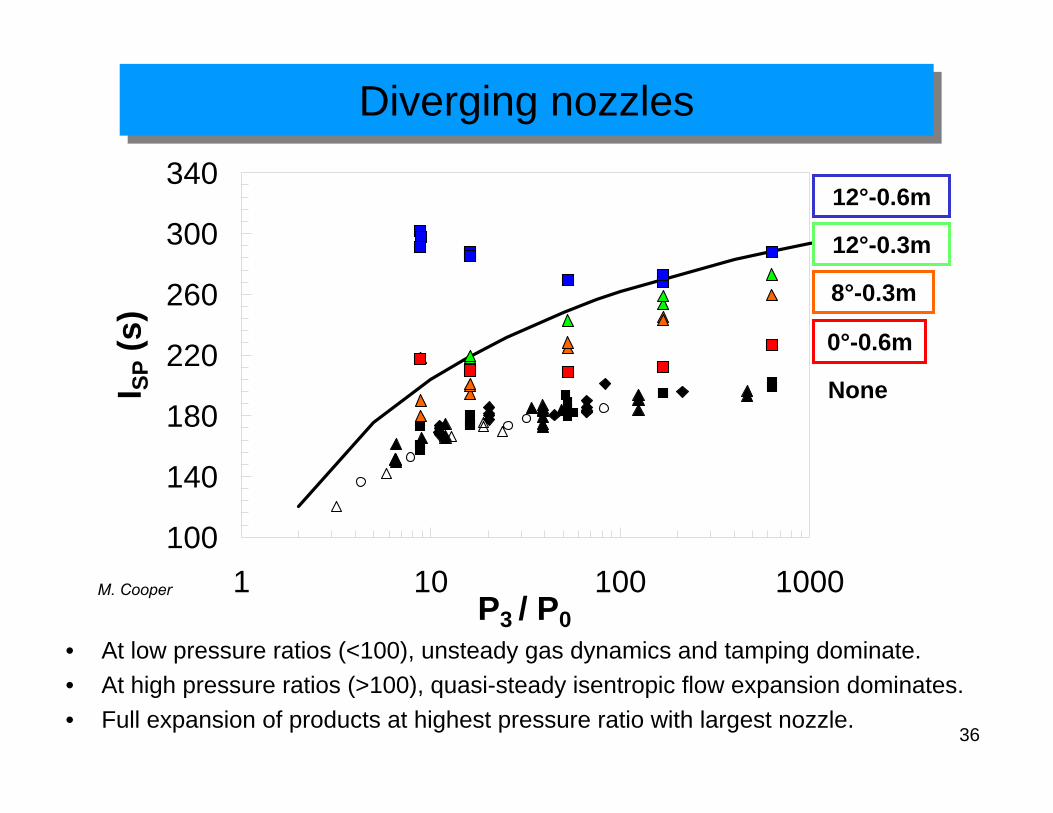
Diverging nozzlesDiverging nozzles
• At low pressure ratios (<100), unsteady gas dynamics and tamping dominate.• At high pressure ratios (>100), quasi-steady isentropic flow expansion dominates.• Full expansion of products at highest pressure ratio with largest nozzle.
100
140
180
220
260
300
340
1 10 100 1000P3 / P0
I SP
(s)
0°-0.6m
None
8°-0.3m
12°-0.6m
12°-0.3m
M. Cooper
37
ConclusionsConclusions
• Exit nozzles appear to have the potential to significantly improve PDE performance at high pressure ratios. However, there is a need for multi-cycle experiments with nozzles to understand their effect on performance.
• Major technological challenges for PDEs:– Valved/valveless inlet concepts and inlet response to unsteady flow in
detonation tube.– Injection and mixing of liquid hydrocarbon fuels in short time frame.– Reliable repetitive initiation in insensitive fuel-air mixtures.– Understanding and control of filling process.– Performance estimates with nozzles and ejectors.– Single and multiple tube PDE concepts.– Thermodynamic cycle model for upper bound performance prediction.– Friction and heat transfer in PDEs.– Hybrid PDE cycles.
• More info? http://www.galcit.caltech.edu/EDL/