Embed Size (px)
Citation preview

WSRC-TR-92-557
Rev 1
Deuterium Absorption and Material PhaseCharacteristics of SAESSt 198 Zr-Fe Alloy (U)
A. Nobile
W. C. MosleyJ. S. HolderK. N. Brooks
Westinghouse Savannah River Company _._4,'_ Z_.t[,,(.,i
Savannah River Site bRbAiken, SC 29808 _
_11 I SAVANNAH RIVER SITE
Prepared for the U. S. Department of Energyunder Contract No. DE-AC09-89SR18035 ._',:._ ._ ="i!."*:'"_' t'_h EM
ID|ST1F:tlBU13ON OF THIC D©GUMENT IS UNUIMITED
i
Disclaimer
This report was prepared as an account of work sponsored by an agencyof the United StatesGovernment. Neither the United States Governmentnor any agency thereof, nor any of their employees, makes any warranty,expressor implied, or assumesany legal liability or responsibilityfor theaccuracy,completeness,or usefulnessof any information apparatus,pro-duce, or processdisclosed,or represents that its use would not infringeprivately owned rights. Reference herein to any specific commercialproduct, process,or service by trade name, trademark, manufacturer, orotherwise does not necessarilyconstitute or imply its endorsement, rec-ommendation, or favoring by the United States Government or anyagency thereof. The views and opinions of authors expressedherein donot necessarilystate or reflect those of the United StatesGovernment orany agency thereof.
Published in cooperation with WSRC Management Information
Services Section Publications Group.
Technical Editor: Charlie Tope

WSRC-TR-92-557
Rev 1
Publication Date: January 1994
Deuterium Absorption and Material PhaseCharacteristics of SAESSt 198 Zr-Fe Alloy (U)
A. Nobile
W. C. MosleyJ, S. HolderK. N. Brooks
T. Motyka, DeriVative Classifier
J.R. _/ermer, Technical Reviewer
_foNSlIIILIrF
Westinghouse Savannah River Company .,.,_°_'_"__ __'%
Savannah River Site ,_ SRS _Aiken, sc 29808
I I SAVANNAH RIVEn SITE
Prepared for the U. S. Department of Energyunder Contract No. DE-AC09-89SR18035
DISTRIBUTION OF T f .... '-'-!S I!.... ' ..... [ .... -- ' _ ..... '_''' "':1_ _ [J lIMITED

This page intentionally left blank.

Deuterium Absorption and Material Phase WSRC-TR-92-557Characteristics of SAES St 198 Zr-Fe Alloy Rev 1
Abstract
This document reports on deuterium absorption and material phasecharacteristics of SAES St 198 Zr-Fe Alloy. Scanning electron microscopeimages of polished surfaces, electron probe microanalysis, and x-ray powderdiffractometry indicated the presence of a primary Zr2Fe phase with sec-ondary phases of ZrFe.z,ZrsFeSn, et-Zr, and Zr6Fe30. A statistically designedexperiment to determine the effects of temperature, time, and vacuum qualityon activation of St 198 revealed that, when activated at low temperature(350°C), deuterium absorptionrate was slower when the vacuum quality waspoor (2.5 Pa vs. 3 × 10⁻⁴ Pa). However, at higher activation temperature(500°C), deuterium absorption rate was fast and was independent of vacuumquality. Deuterium pressure-composition-temperature (P-C-T) data are re-ported for St 198 in the temperature range 200°C to 500°C. The P-C-T dataover the full range of deuterium loading and at temperatures of 350°C andbelow is described by the following expression in terms of the equilibriumdeuterium absorption pressure, PI_, and the getter loading, q:
Koe.(AHa/RT)= (q,.q)2el>2q2,
where AH° andKo havevaluesof 101.8kJ.mole-1and 3.24 x 10⁻⁸Pa'_,respectively, and q* is 15.998 kPa.L-t.g-_. At higher temperatures, one ormore secondary reactions in the solid phase occur that slowly consume D2from the gas phase. X-ray diffraction and other data suggest these reactionsto be:
22 Zr2FeDx --->x ZrD2 + 3 ZrFe2 + (2 - _ x) Zr2Fe
1Zr2FeDx + (2- _-x)D2 --->2 ZrD2 + Fe,
where 0 < x < 3. Reaction between gas-phase deuterium and ZrgFe formed inthe first reaction accounts for the observed consumption of deuterium fromthe gas phase by this reaction.
93xo473._o i

This page intentionally left blank.
1i 93X0,l73.M'WO
Deuterium Absorption and Material Phase WSRC-TR-92-557Characteristics of SAES St 198 Zr-Fe Alloy Rev 1
Contents
Abstract i
Introduction 1
Experimental 2
Elemental Analysis 2
Pellet Physical Properties 2
Material Phase Characteristics 2
Activation Study 3
Pressure-Composition-Temperature Measurements 3
Results 3
Elemental Analysis 3
Pellet Physical Properties 5Material Phase Characteristics 8
Activation Study 10
Pressure-Composition-Time Measurements 14
X-Ray Diffraction Analysis of Deuterium-Loaded Samples 20
Discussion 22
Conclusion 25
Acknowledgments 25
References 25
List of Figures
1. SchematicArrangementof the ApparatusUsed forActivation andP-C-T studieson St 198 Samples(a), Sample Cell Co) 4
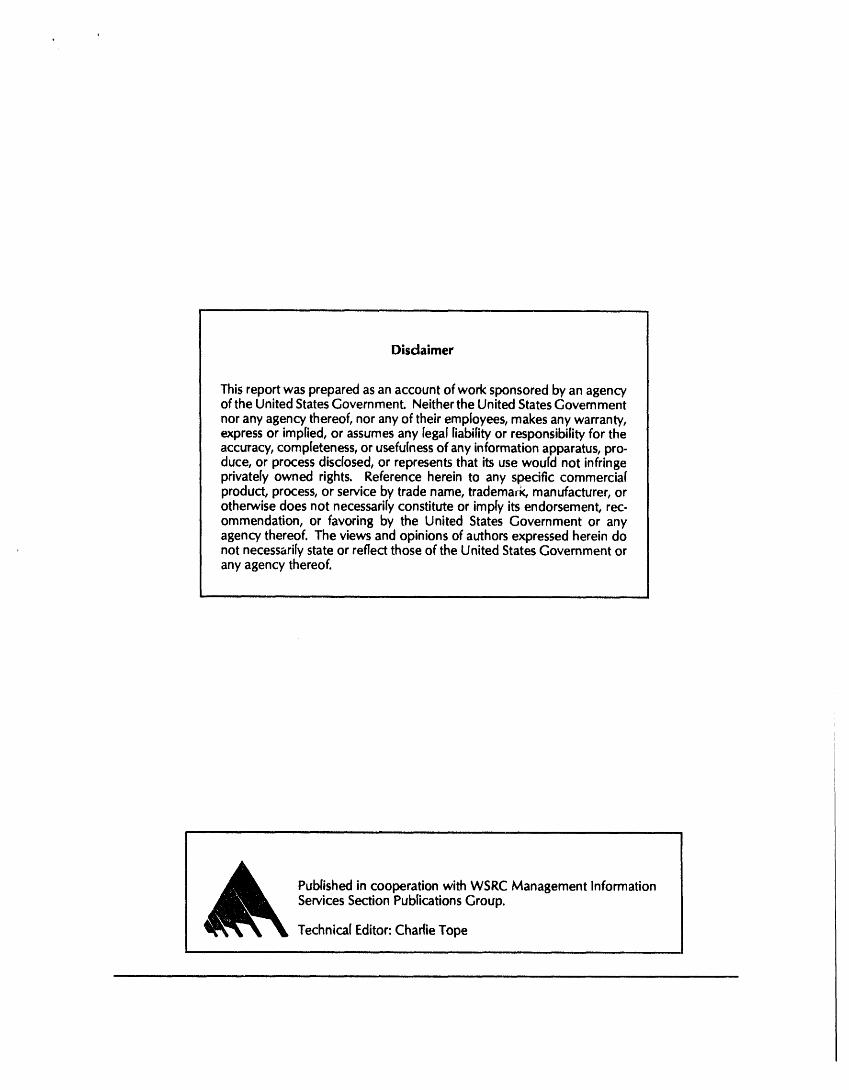
2. ScanningElectronMicroscopyImageof an As-Received SAESSt 198 Pellet Surface 6
3. IncrementalIntrusionVolumevs. Pore Diameterfor As-ReceivedSAES St 198 Pellets 7
4. ScanningElectron MicroscopyBSE Imageand ElementalMaps of the Polished Surface of an As-Received St 198 Pellet 9
5. X-Ray Powder Diffraction Patterns of SAES St 198 Powder fromPulverized As-Received Pellets 11
93xo473.Mwo iii
6. Deuterium Pressure vs. Time Data for Three Sets ofConditions in the 23Factorial Test 12
7. Log(P/Po) vs. Time Plots Used to Determine InitialDeuterium Absorption Rates in the 23 Factorial Test 13
8. Deuterium Absorption Isotherms for SAES St 198 15
9. Deuterium Absorption Isotherms at 500°C for EquilibrationTimes of 20 minutes and 1 Hour for SAES St 198 17
10. Absorption Pressure vs. q2/(q,.q)2 for SAES St 198 atTemperatures of 200°C, 300°C, and 350°C 18
11. van't Hoff Plot of the Equilibrium Constants 19
12. X-Ray Powder Diffraction Patterns of SAES St 198Samples After Conducting Absorption Isotherms at 200°C and 500°C 21
List of Tables
1. Elemental Analysis of As-received SAES St 198 by InductivelyCoupled Plasma Mass Spectroscopy and X-Ray Fluorescence 5
2. Summary of As-Received SAES St 198 Pellet PhysicalCharacterization Parameters 8
3. Test Matrix and Results for 23 Factorial Getter Activation Test 14
4. Main Effects Values Determined from 23 Factorial Test 14
5. Relative Intensities of the Strongest XRD Peaks for As-Received andDeuterium-Exposed SAES St 198 20
-iv 93XO473MV¢O

Deuterium Absorption and Material Phase WSRC-TR-92-557Characteristics of SAES St 198 Zr.Fe Alloy Rev 1
Introduction
A metal getter having a reported composition of 76.5%Zr • 23.5%Fe, whichis produced and sold by SAES Getters under the trade name St 198, has theunique property of being reactive with hydrogen isotopes, oxygen, water, andother gases, while remaining relatively unreactive toward nitrogen. Further,the material is available as pressed pellets that can be used in packed bedreactors with minimal gas pressure drop. These properties allow this getter tobe a candidate for tritium removal from nitrogen glovebox atmospheres andinert gas process streams with low tritium concentrations. The advantage ofremoving tritium from glovebox atmospheres with metal geuers is that highlyradiotoxic tritiated water is not formed, as with conventional gloveboxtritium removal systems that catalytically oxidize tritium to water and traptritiated water on molecular sieves.
Kherani et al. 1studied tritium removal from flowing nitrogen using a SAESSt 198/707 purifier cartridge, They were able to remove tritium in nitrogenwith initial concentrations less than 1 mCi.m"3to levels undetectable by theirion chamber. However, for initial concentrations higher than 1 mCi.m -3,tritium broke through. The amount of breakthrough increased with flow andinitial tritium concentration. Ontario Hydro Research Division2designed andbuilt a glovebox tritium cleanup system that uses St 198. In fact, in acollaborative effort between SAES Getters and Ontario Hydro Research, atritium cleanup system using St 198 was designed for commercial sale. TheOntario Hydro Research glovebox unit successfully removed tritium from theglovebox atmosphere during tests. However, tritium breakthrough behaviorathigher tritium concentrations happened, similar to that observed by Kheraniet al.1
The above work demonstrated the usefulness of St 198 for tritium cleanupsystems. The improvements to the getter bed design will likely eliminatetritium breakthrough at higher concentrations and flow. At the SavannahRiver Site (SRS), a program is underway to develop technology that usesmetal getters to remove tritium from glovebox and process atmospheres. Ourexperience with metal hydride tritium handling processes demonstrated that athorough understanding of hydrogen isotope absorption properties andmaterial phase characteristicsof metal hydride forming materials is essentialfor many reasons. This document reports results from the deuterium pressure-composition-temperature (P-C-T) behavior and the material phasecharacteristics of St 198. We also investigated the getter activation andundesirable secondary reactions, which occur in the Zr2Fe lattice at hightemperature while loaded with deuterium. Additionally, we report a numberof physical parameters such as densities and pore structure data that areuseful for metal getter reactor design calculations.
Some data on the hydrogen absorption behavior of Zr2Fe exists in theliterature. Manini et al.3 and Boffito et al.a provide hydrogen absorptionisotherms for St 198 at temperatures between 200°C and 700°C. Both ofthese publications provide correlations that relate the hydrogen absorptionpressure to temperature and getter hydrogen content. While the material hasa total hydrogen capacity approaching 16 kPa.L.g"_,the correlation of Maniniet al) applies to hydrogen loadings of less than 1.5 kPa.L.g-_.The correlationreported by Boffito et al.4 applies to hydrogen loadings less than0.66 kPa.L.g -_. Manini et al.3 also report, that at temperatures higher than

Deuterium Absorption and Material Phase WSRC-TR-92-557Characteristics of SAES St 198 Zr-Fe Alloy Rev 1
500°C, hydrogen never reached equilibrium with the material, apparentlybecause of a slow reaction of Zr2FeHx to ZrH2 and Zr2Fe. These worksfurther show that at low hydrogen loading Zr2FeH_ is only partiallyconverted to ZrH2 and Zr2Fe. At high loadings ZrH2 and Zr2Fe arecompletely converted. The samples of Manini et al. were held at 500°C for2 hours. Van Essen and Buchow5, who investigated hydrogen absorption inseveral Zr- and Hf-based intermetallic compounds, state that hydrogenuptake in Zr2Fedoes not form a stable hydride, but decomposes to Zr2Fe andZrH2 when activated for 4 hours at 50°C and under 4.05 MPa of hydrogenpressure. Aubertin and coworkers6 confirmed decomposition of hydrogen-loaded Zr2Fe to Zr2Fe and ZrH2 when Zr2Fe was exposed at 850°C to100kPa of hydrogen for 15 hours.
Experimental
Elemental Analysis
We purchased the St 198 getter as 4 mm long × 6 mm diameter pressedpellets from SAES Getters USA, Colorado Springs, Colorado. Usingsolutions obtained by acid dissolution of the getter, we analyzed byinductively coupled plasma-mass spectroscopy (ICP-MS) the getterelemental composition. We dissolved the getter by adding 0.1 g of sample to8 mL of aqua regia, followed by overnight heating at 95°C. A remainingresidue was then dissolved by adding 2 mL of HF. This solution was thendiluted for analysis by ICP-MS. Getter material was also analyzed by x-rayfluorescence (XRF) without standards, but this method is qualitative, and isnot expected to be as accurate as ICP-MS.
Pellet Physical Properties
The pore structure of St 198 _llets was characterized with a MicromeriticsAuto-Pore II MoOd 929.0 mercury intrusion porosimeter. A number ofparameters such as void fractions, densities of pellets, and a packed bed ofthe as-received pellets were measured.
Material Phase Characteristics
Scanning electron microscopy (SEM) provided images of polished surfaceson St 198 pellets to visually examine the phases present in the material.Energy dispersive x-ray (EDX) yielded qualitative elemental analyses ofselected areas on the particle surface. Electron probe microanalysis (EPMA)provided quantitative analyses of selected areas. X-ray intensities were com-pared with zirconium, iron, and tin standards using corrections for atomicnumber, absorption, and fluorescence (ZAF corrections). We performedx-ray diffractometry (XRD) on powder from crushing St 198 pellets. CopperK-alpha radiation was used to scan the two theta range from 5°C to 135°C.Phases were identified by matching crystallographic diffraction peakiJ_terplanarspacings (d-values) and relative intensities with reference XRDdata .7
2 93xo_73.Mwo

Deuterium Absorption and Material Phase WSRC-TR-92.557Characteristics of SAES St 198 Zr-Fe Alloy Rev 1
Activation Study
We activated the St 198 getter by holding samples under vacuum above350°C for several hours. During activation, oxygen from oxides on particlesurfaces supposedly diffuses into the bulk, producing highly reactivesurfaces. To determine the optimum activation conditions and the effects oftemperature, time, and vacuum quality on material activation, we performeda 23 factorial experiment. Samples were activated at temperatures of 350°Cand 500°C, for periods of 4 and 16 hours, and under evacuation by a WelchDuo-Seal two-stage rotary vane pump (2.5 Pa) or an Alcatel Drytel 30fluidless vacuum pump (3 × 10⁻⁴ Pa). A cold trap was not used with eitherpump. The extent of activation was determined by measuring the initialdeuterium absorption rate at 350°C. High initial deuterium absorption rate in-dicates a well activated sample. We measured the absorption rate on the gasmanifold (Figure la). Samples (- 1 g) were held in the sample cell (Figurelb), which was wrapped with electrical heating tape. A temperaturecontroller kept the sample temperature constant within I°C. After activatingthe sample, a data acquisition computer recorded pressure vs. time data aftera valve between the sample and a 300 mL calibrated volume that contained4000 Pa (30 torr) of deuterium opened. An MKS Baratron 390H 0-133 kPacapacitance manometer measured the pressure.
Pressure-Composition-Temperature Measurements
We investigated deuterium P-C-T behavior for St 198 samples using thesame gas manifold, sample cell, and sample size described above. Wemeasured absorption isotherms at temperatures from 200°C to 500°C. Beforeeach isotherm measurement, we loaded a fresh sample into the sample celland activated the cell by evacuating it with an Alcatel Drytel 30 vacuumpump to <3 x 10.4 Pa at 350°C for 4 hours. A data acquisition computer wasused to automate static absorption isotherm measurements. After admittingan aliquot of gas to the sample, the sample equilibrated for 20 minutes. A 0-1.33 kPa MKS Baratron 390H capacitance manometer measured the pressurein equilibrium with the samples.
Results
Elemental Analysis
Table 1 shows the results from ICP-MS and XRF elemental analyses ofSt 198. Boffito et al.4reported St 198 to have the composition 76.5 wt. % Zr,23.5 wt. % Fe. Our iron analysis agrees closely with that of Boffito et al., butwe detected slightly less zirconium and some tin (1.2%). Zn, Cu, Ti, La, andCr are most likely impurities, and probably do not influence the getterbehavior significantly. As will be shown below, tin plays a role in the phasebehavior of the material. XRF analysis is only qualitative and does not agreewith ICP-MS. However, XRF shows the presence of copper, which was notdetected by ICP-MS.
93XO473.MWO 3
k

Deuterium Absorption and Material Pha_ WSRC-TR.92.557Characteristics of SAES St 198 Zr-Fe Alloy Rev 1
tD9 H2 He _ Welch
Duo-Seal
RotaryVane Pump
0-1.33 kl_
0.25" Nupro MKSBellows Valve Baratron
[_ 1.5" High 0-133 kPa [
Vacuum Valve MKSBaratron
Aleatel
pump
SampleCell
(a)
(b)
Figure 1. Schematic Arrangement of the Apparatus Used for Activation and P-C-T Studies on St 198Samples (a), Sample Cell (b)
4 93XO473.MWO

Deuterium Absorption and Material Phase WSRC-TR-92-557Characteristics of SAES St 198 Zr-Fe Alloy Rev 1
Table 1. Elemental Analysis of As-received SAES St 198 by InductivelyCoupled Plasma Mass Spectroscopy and X-Ray Flourescence
Weight PercentElement ICP-MS XRF
Zr 73.60 81.8
Fe 23.30 6.9
Sn 1.20 1.0
Zn 0.50 -
Cu 0.3
Ti 0.10 -
La 0.07 -
Cr 0.06 -i i i llll H ii i ill i i
Pellet Physical Properties
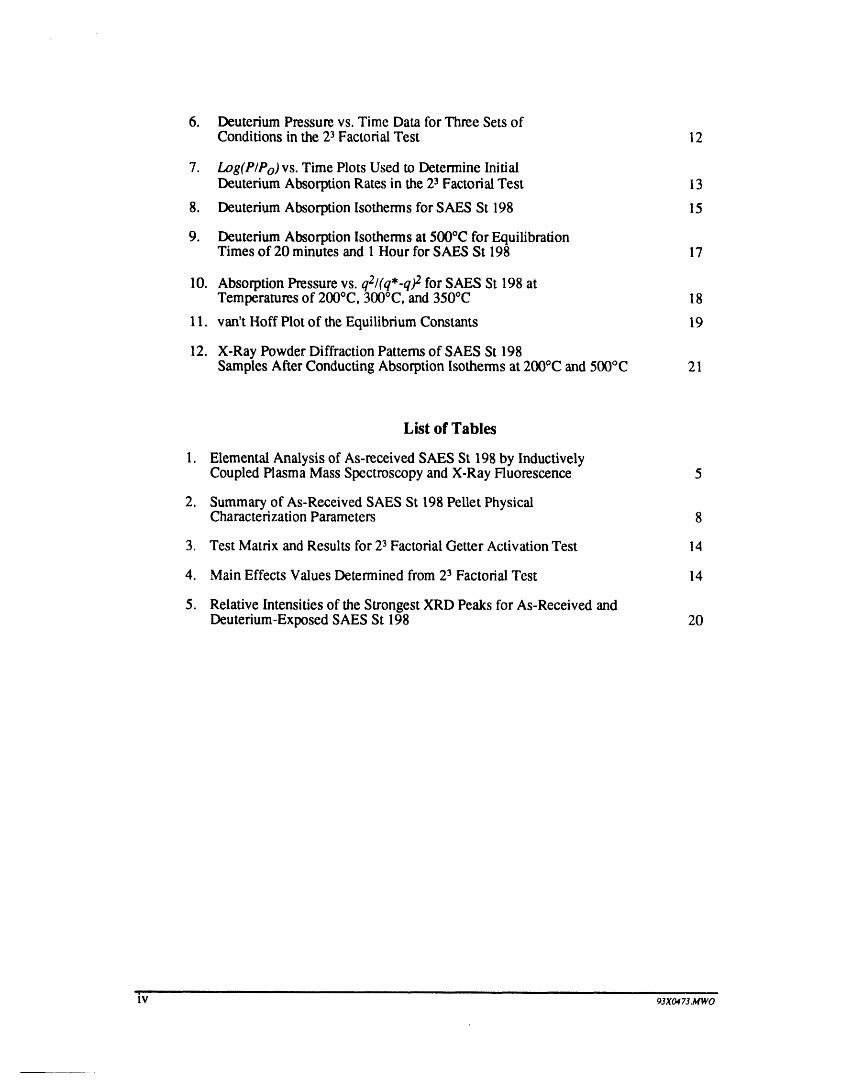
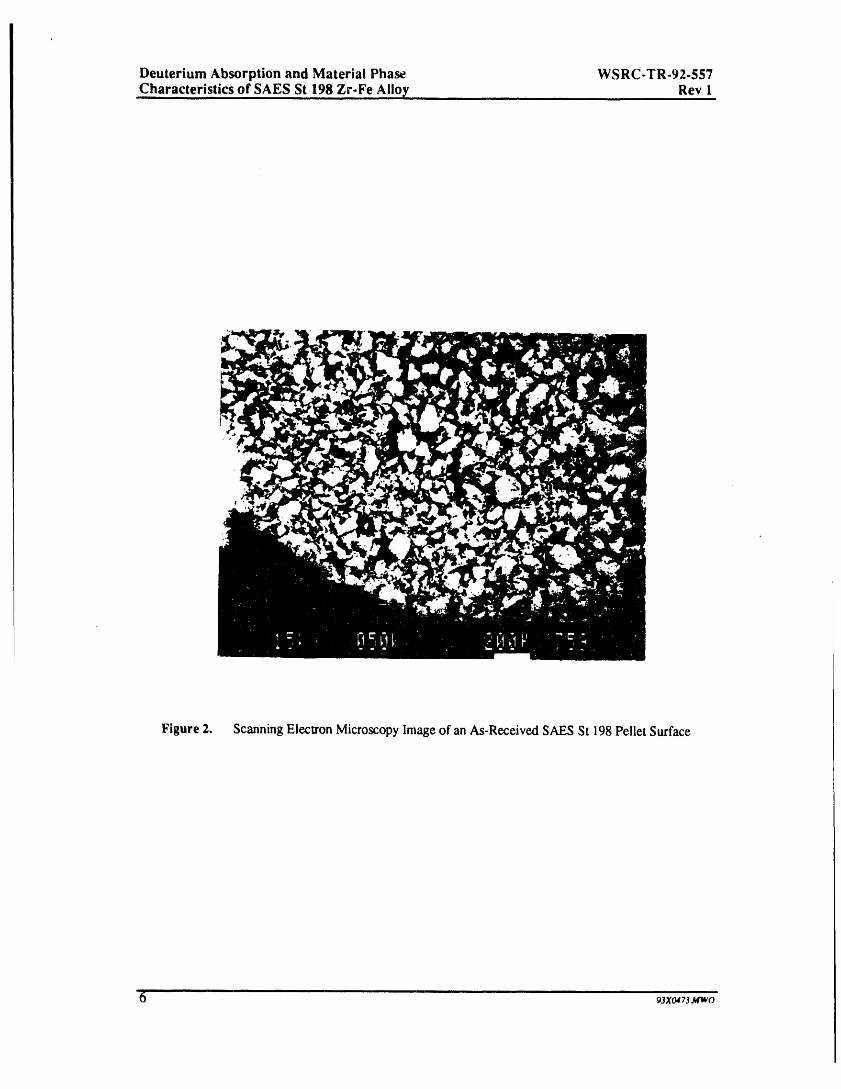
St 198 pellets are formed by compacting irregular alloy granules withmaximum dimensions of about 150 _tm (Figure 2). Figure 3 shows pore sizedistribution data for St 198 pellets expressed as incremental intrusion volumevs. diameter. The majority of the pores are in the 2 to 5 _tm diameter range,with most remaining pores in the 0.2 to 2 I.tmrange. The material has fewpores with diameters less than 0.1 _tm. Each 6 mm diameter x 4 mm longSt 198pellet weighed 0.6 g, corresponding to a pellet density of 5.3 g'cm -3,which closely agrees with 5.17 measured by porosimetry. The theoreticaldensity of 6.8697 g.cm"3measured by porosimetry agrees with 6.938 g.cm3for Zr2Feobtained from x-ray powder diffraction files. 7
The void fraction of 0.25 calculated from the pellet and theoretical densitiesin Table 2 are slightly lower than the value of 0.31 that we determined fromgas expansion measurements. The higher value obtained by gas expansionsuggests the presence of small pores not accessible by the mercury intrusionmethod. However, the close agreement between theoretical densities obtainedfrom the powder diffraction files and porosimetry is inconsistent withinaccessible porosity in the sample. It is more likely that the deviation isattributable to the larger error associated with the gas expansion technique.Thus, the value from the porosimetry measurements is probably morereliable.
93XlM73.MWO
Deuterium Absorption and Material Phase WSRC-TR-92.557Characteristics of SAES St 198 Zr-Fe Alloy Rev 1
Figure 2. Scanning Electron Microscopy Image of an As-Received SAES St 198 Pellet Surface
6 9Jxo_73_two
Deuterium Absorption and Material Phase WSRC-TR-92.557Characteristics of SAES St 198 Zr-Fe Alloy Rev 1
"7 0.014 -
/._1
E 0.012 -(DE:::} 0.010 -o>c 0.008-0u)&..•,..., 0.006 -¢..-
,=_==
E 0.004 -
E_ 0.002-
° /0.000 I I I
loo lo 1 o.1 o.ol o.ool
Pore Diameter (g m)
Figure 3. IncrementalIntrusionVolume vs. PoreDiameterforAs-Received SAES St 198Pellets
93xo47z.Mwo 7

Deuterium Absorption and Material Phase WSRC-TR-92-557Characteristics of SAES St 198 Zr-Fe Alloy Rev 1
Table 2. Summary of As-Received SAES St 198 PelletPhysical Characterization Parameters
ProPerty Value
Total intrusionvolume 0.0479 mL.gl
Total pore area 2.523 m2.ff_
Median pore diam (vol) 2.8443 l.tm
Median pore diam (area) 0.0042 _m
Average pore diam (4V/A) 0.0759 lain
Pellet density 5,1689 g.mL-t
Theoretical density 6.8697 g.mL-_
Pellet void fraction 0,25
Packed bed void fraction 0.43
44mm x 6 mm pellets)
The tap density of a packed bed of 4 mm long x 6 mm diameter pellets wasmeasured to be 2.93 g.mL"1. From this, a void fraction of 0.43 for the bed iscalculated, and represents the void fraction associated with volume betweenindividual pellets in the bed.
Material Phase Characteristics
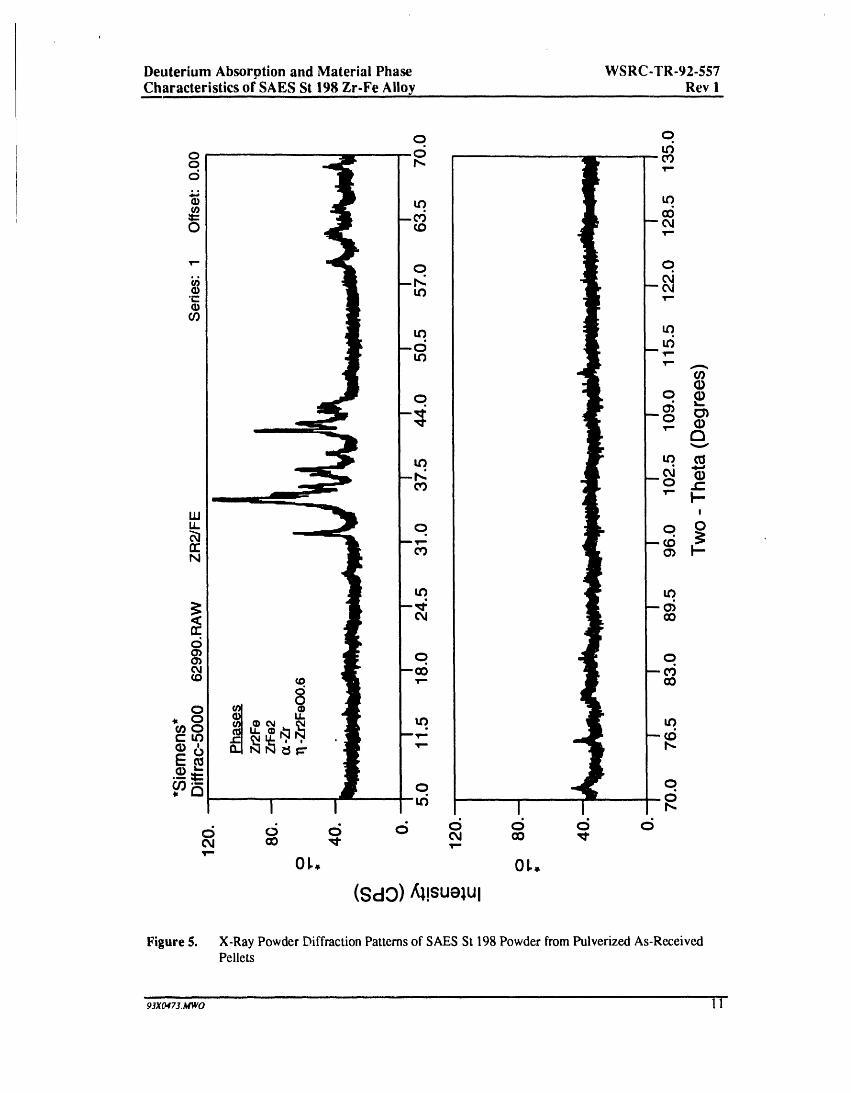
Figure 4 shows an SEM backscattered electron (BSE) image of the polishedsurface of an St 198 pellet. Five phases were detected. The intensity(brightness) of a phase in a BSE image is a function of the phase compositionwith brightness increasing with average atomic number. The primary phasesin St 198 has medium intensity. The composition of the primary phase wasdetermined from EPMA lines profiles to be Zr0.6_o+o.0tsFe0.337+o.ot9Sn o.oo3:1:o.oo_that corresponds to Zr2Fe. The composition of the dark, blockysecondary phase is Zro.35o±o.o_0Fe0.65o±o.0_0that corresponds to ZrFe2. Alarge portion of St 198 is eutectic consisting of primary Zr2Fe withmicrometer-size inclusions of bright secondary phases. SEM/EDX showedthat one bright secondary phase was nearly pure zirconium and anothercontained zirconium, iron, and tin. EPMA was not able to resolve the twobright secondary phases in the inclusions in the eutectic. Analyses in eutecticyielded an average composition of 73 3 + 1.6 atomic percent (a/o) zirconium,25.5 a/o iron and 1.2 _+0.6 a/o tin. However, three points in a large isolatedarea of a bright secondary phase yielded Zr0.715+o.olFeo.lsl±o.oi9Sno.130±0.026,which corresponds to ZrsFeSn. Small inclusions within the eutectic with thesame intensity are thought to be ZrsFeSn. Two EMPA analysis pointscorrespnded to nearly pure zirconium with 79 a/o Zr, 17.7 a/o Fe and 3.3 a/oSn and 82.8 a/o Zr, 13.0 a/o Fe and 4.3 a/o Sn. Scattered dark areas detectedwithin the primary phase by BSE/SEM are thought to correspond to an oxidephase. Figure 5 shows an XRD pattern for as-received St 198 and indicatedthe presence of four phases: Zr2Fe,ZrFe2,a-Zr and Zr 6 FeO. 7 No lines of anXRD pattern for ZrsFeSn were detected.
8 9JXlM73Mwo

Deuterium Absorption and Material Phase WSRC-TR-92-557Characteristics of SAES St 198 Zr-Fe Alloy Rev 1
BSE Image Zr Map
Fe Map Sn Map
Figure 4. Scanning Electron MicroscopyBSE Image and Elemental Mapsof the Polished Surfaceof anAs-Received St 198Pellet
93xo473._rwo 9
Deuterium Absorption and Material Phase WSRC-TR-92.557Characteristics of SAES St 198 Zr-Fe Alloy Rev 1
Activation Study
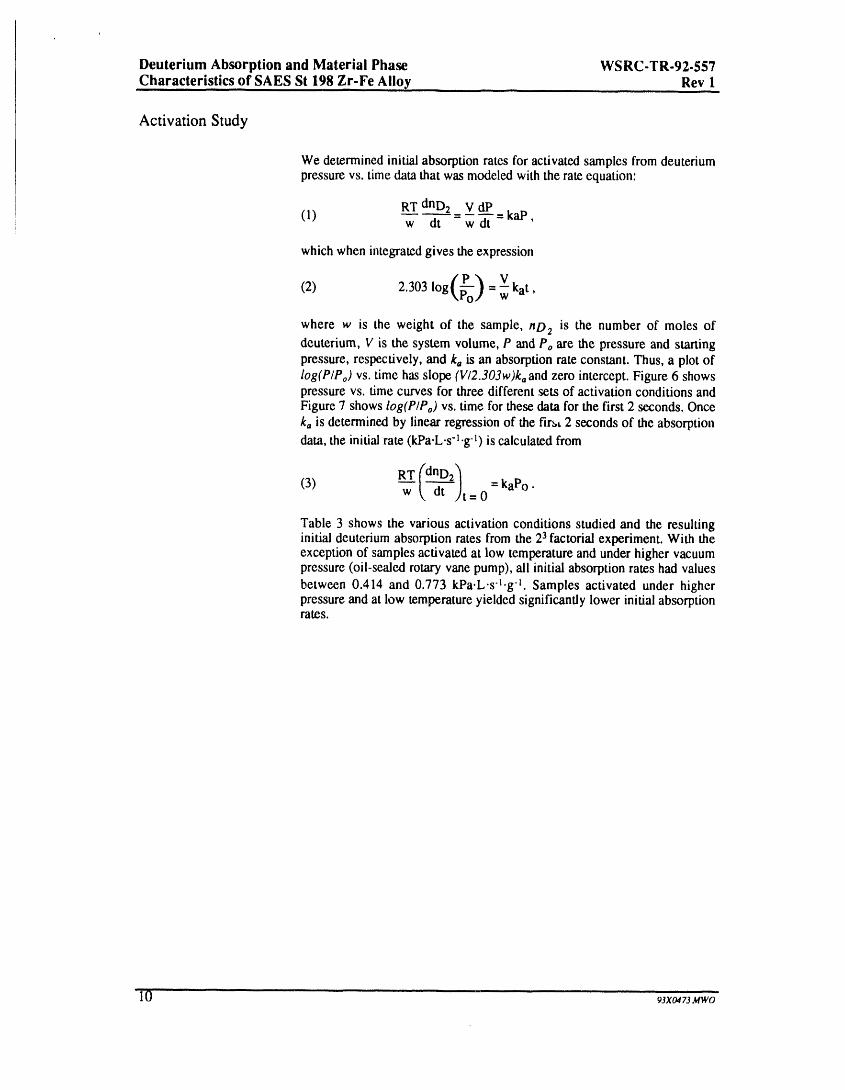
We determined initial absorption rates for activated samples from deuteriumpressure vs. time data that was modeled with the rate equation:
RT dnD2 V dP(1) w dt -wdt-kaP'
which when integratedgives the expression
(P_o) V kat(2) 2.303 log --"w '
where w is the weight of the sample, nD2 is the number of moles ofdeuterium, V is the system volume, P and Po are the pressure and startingpressure, respectively, and ka is an absorption rate constant. Thus, a plot oflog(P/Po) vs. time has slope (V/2.303w)koand zero intercept. Figure 6 showspressure vs. time curves for three different sets of activation conditions andFigure 7 shows log(P/Po) vs. time for these data for the first 2 seconds. Oncek,, is determined by linear regression of the fir_,_2 seconds of the absorptiondata, the initial rate (kPa.L.s-l.g-1)is calculated from
(3) R--T'T(dnD2_ =kaPo.w_. dt it=0
Table 3 shows the various activation conditions studied and the resultinginitial deuterium absorption rates from the 23 factorial experiment. With theexception of samples activated at low temperature and under higher vacuumpressure (oil-sealed rotary vane pump), all initial absorption rates had valuesbetween 0.414 and 0.773 kPa.L.s-_.g -_. Samples activated under higherpressure and at low temperature yielded significantly lower initial absorptionrates.
10 93x0473.MWO
Deuterium Absorption and Material Phase WSRC-TR-92-557Characteristics of SAES St 198 Zr-Fe Alloy Rev 1
Figure 5. X-Ray Powder Diffraction Patterns of SAES St 198 Powder from Pulverized As-ReceivedPellets

Deuterium Absorption and Material Phase WSRC-TR.92-557Characteristics of SAES St 198 Zr-Fe Alloy Rev I
1.2
0.8350 °C,
D"o Oil Pump0.6
350 °C,0.4 / Dry Pump
500 °C,0.2 Oil Pump
0.0
0 5 10 15 20
Time (sec)
Figure 6. Deuterium Pressurevs. Time DataforThreeSetsof Conditionsin the 23FactorialTest
12 93xa¢73._o

Deuterium Absorption and Material Phase WSRC-TR.92-557Characteristics of SAES St 198 Zr-Fe Alloy Rev 1
010
350 °C,Oil Pump
I:L° r-I350 °C,Dry Pump
500 °C,10 -1 Oil Pump
.....
I I I0 1 2 3
Time (sec)
Figure 7. Log(P/Po) vs. Time Plots Used to DetermineInitialDeuterium AbsorptionRates in the 23FactorialTest
9Jxo.,73..,o 1

Deuterium Absorption and Material Phase WSRC-TR-92-557Characteristics of SAES St 198 Zr-Fe Alloy Rev 1
Table 3. ' Test Ma_ix and Results for 23 Factorial Getter Activation Test
Temperature Activation VAC Press RateRun (°C) (hour) (Pa) (kPa.L.s-l.g-l)
1 500 4 2.5 0.7468
2 500 4 3 x 10⁻⁴ 0.5377
3 500 16 2.5 0.4140
4 500 16 3 x 10⁻⁴ 0.7730
5 350 4 2.5 0.0430
6 350 4 3 x 10⁻⁴ 0.6028
7 350 16 2.5 0.0017
8 350 16 3 x 10⁻⁴ 0.6829
Table 4 shows the main effects calculated from the statistical test. The maineffect is a relative number that indicates the relative effect of each variable onthe response parameter (initial absorption rate). The larger the main effect,the greater the effect of the variable on the response parameter. Temperatureand vacuum conditions have the largest effect on the initial absorption rate,whereas time does not appear to affect the activation process significantly.
Table 4. ' Main Effect V'aluesDetermined from 23Factorial Test
Variable Main Effect, m, .. .. ,.,i,
Temperature 0.285
Time -0.015
i Vacuum Condition -0.348iiiiiiii i
Pressure-Composition-Time Measurements
Figure 8 shows deuterium absorption isotherms for Zr_Fe at temperatures
between 200°C and 500°C. At approximately 6 kPa.L'g -_, the slope of the400°C isotherm decreases and the isotherm eventually contacts the 350°Cisotherm at approximately 10 kPa'L.g "1. Similarly, the isotherm at 500°Cundergoes a slope change at about 5 kPa.L'g "1 and nearly contacts theisotherms at 350°C and 400°C. During measurement of the 500°C isotherm,
i
14 93xo473_wo

I
Deuterium Absorption and Material Phase WSRC-TR-92.557Characteristics of SAES St 198 Zr-Fe Alloy Rev 1
103 __
0 200ocA 300 °C[3 350 °C
102- V 400 °C0 500 °CV
_ 101 -
e-
"g__oa"-1°° _0/¢__0,,_ I)'
..Q< 1
0
0 2 4 6 8 10 12 14
Absorbed Deuterium (kPaLg-1)
Figure 8. Deuterium Absorption Isotherms for SAES St 198
93XO473.MWO 15

Deuterium Absorption and Material Phase WSRC-TR-92-557Characteristics of SAES St 198 Zr.Fe Alloy Rev 1
we observed that there was initiallya rapid equilibration of D 2 with the getter,which was complete within a few seconds. However, a slow decrease insystem pressure followed the equilibration. At the lower temperature(<350°C) equilibration occurred within a few seconds, but the final pressurewas stable. This observation indicated that initial deuterium equilibration withthe sample was rapid, but that a slow solid state reaction occurred and con-sumed gas-phase deuterium. After running the isotherm again (Figure 9) witha longer equilibration time (1 hour), it was apparent that at loadings higherthan approximately 2 kPa.L.g-l, a reaction that consumed additional deuteriumfrom the gas phase was occurring. Absorption isotherms at 350°C run at20 minutes and 1 hour were the same. This rate of the secondary reaction onthe time scale indicates the isotherm measurement is insignificant at 350°C.
Further observation of the absorption isotherms in Figure 8 indicates thatthere appears to be no a-phase-hydride phase transition. The fact that theisotherms are continuous indicates that deuterium absorption occurs bysolution of deuteriumato: _sinto the bulk lattice with no abrupt lattice phasetransition. Given this, it is possible to describe the equilibrium thermo-dynamics with a simple chemical equilibrium expression. The following canbe written for the reaction of deuterium gas with lattice deuterium sites:
(4) D2+ 2S ___2DS,
where S is a vacant absorption site. The equilibrium expression for thisreaction is,
[DS]2
(5) Keq= PD2 [SI2'
where Keq is the equilibrium constant, PD2is the deuterium partial pressure,and [S] and [DS] are the concentrations of vacant, and deuterium-occupiedsites in the metal lattice, respectively. This expression can also be written interms of the getter loading, q, and the value of q at full loading, q*,
_ q2
(6) PDz- Keq(q*- q)2
A value of 15.998 kPa.L.g "1 was used for q*. A plot of PD2 vs.
q2/(q*.q)2wouldbe a straight line with slope l/Keq. Figure 10 shows this plotfor the P-C-T data of Figure 8 at temperatures of 350°C and below. At thehigher temperatures, because of the slow reaction occurring in the lattice, thedata deviated significantly from the model, so these data were excluded fromFigure 10. A van't Hoff plot of the equilibrium constants determined from theslope of the lines in Figure 10 is shown in Figure 11. The value of theequilibrium constant at 400°C is plotted on Figure 11. This point deviatessignificantly from the data at lower temperatures. From the slope of this plot,
an absorption enthalpy, AHaof 101.8 kJ.mole -l, is calculated. Thus, thedeuterium P-C-T data for the full range of loadings and at temperatures of350°C and below are described by,
(7) K0e.(aHa/RT)=(q*.q)2PDz q2'
where Ko was determined from the intercept of Figure 11 to be 3.24 x 10⁻⁸pa-l.
16 93xo473._two

Deuterium Absorption and Material Phase WSRC-TR-92-557Characteristics of SAES St 198 Zr-Fe Alloy Rev 1
0 '1 - I " I I ...... I0 2 4 6 8 10 12
Absorbed Deuterium (kPaLg "1)
Figure 9. Dcu_rium AbsorptionIsothermsat 500°C forEquilibrationTimes of 20 Minutesand 1 HourforSAES St 198
93xo473._,o .................... 17

Deuterium Absorption and Material Phase WSRC-TR.92-557Characteristics of SAES St 198 Zr-Fe Alloy Rev 1
0.0
0 _0 20 30 40 50 60 70
q2/(qo.q)2
Figure 10. AbsorptionPressurevs. q2/(q..q)2for SAES St 198at Tempcratm'esof 200°C, 300°C, and350°C
"18 _3xo_73s_wo

Deuterium Absorption and Material Phase WSRC-TR.92-557Characteristics of SAES St 198 Zr-Fe Alloy Rev 1
10 4
10 3 --
"7,2
13. 10 --
v
10 1 --
O
10 oI I I I I
1.2 1.4 1.6 1.8 2.0 2.2 2.4
IO00/T (KI)
Figure 11. van't Hoff Plot of theEquilibriumConstants
93xo473_wo 19
Deuterium Absorption and Material Phase WSRC-TR-92.557Characteristics of SAES St 198 Zr-Fe Alloy Rev 1
X-Ray Diffraction Analysis of Deuterium-Loaded Samples
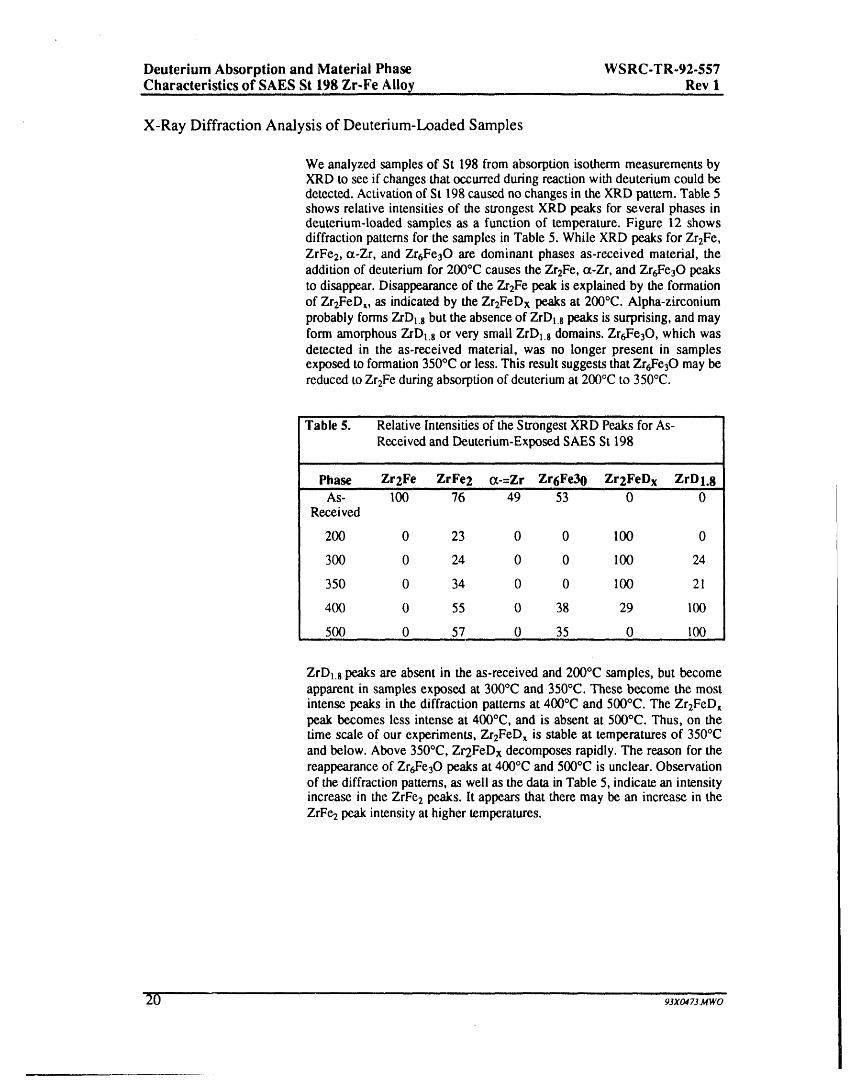
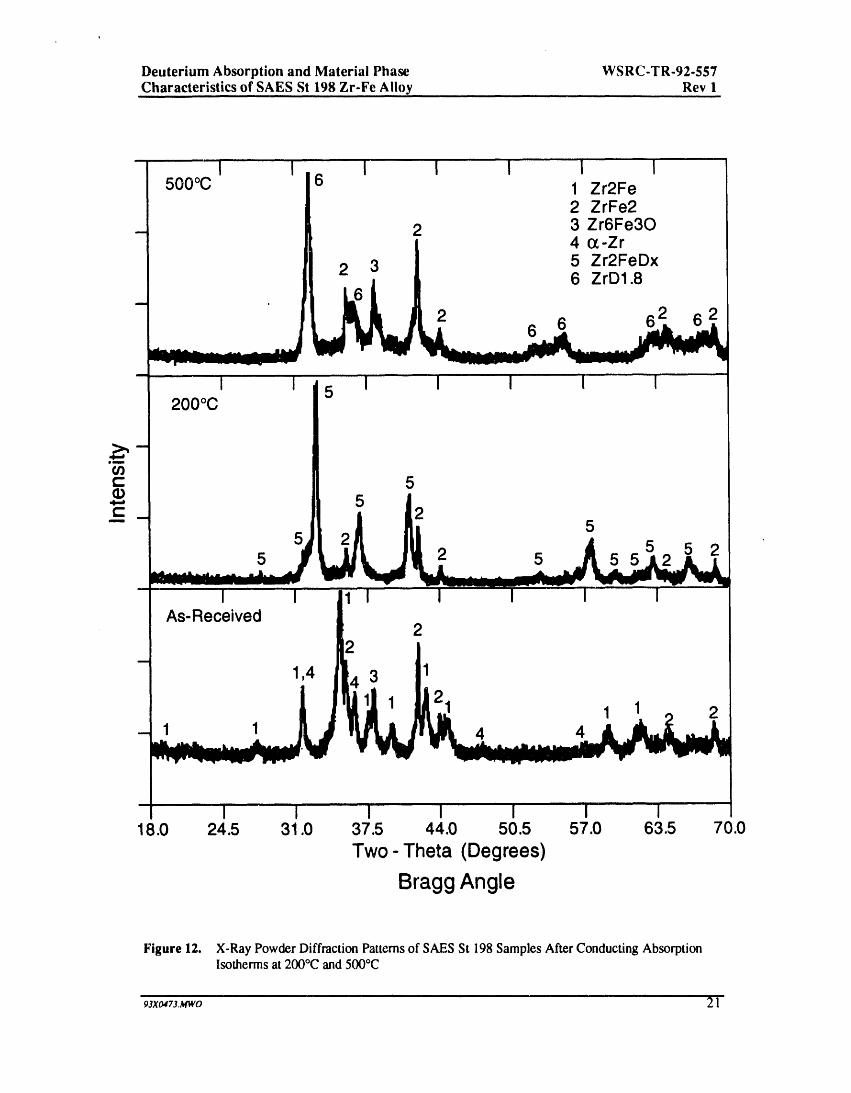
We analyzed samples of St 198 from absorption isotherm measurements byXRD to see if changes that occurred during reaction with deuterium could bedetected. Activation of St 198 caused no changes in the XRD pattern. Table 5shows relative intensities of the strongest XRD peaks for several phases indeuterium-loaded samples as a function of temperature. Figure 12 showsdiffraction patterns for the samples in Table 5. While XRD peaks for Zr2Fe,ZrFe2, ot-Zr, and Zr6Fe30 are dominant phases as-received material, theaddition of deuterium for 200°C causes the Zr2Fe, ot-Zr, and Zr6Fe30 peaksto disappear. Disappearance of the Zr2Fe peak is explained by the formationof Zr2FeD_, as indicated by the ZrEFeDx peaks at 200°C. Alpha-zirconiumprobably forms ZrDl.s but the absence of ZrD_.8peaks is surprising, and mayform amorphous ZrDl.g or very small ZrDl.s domains. Zr6Fe30, which wasdetected in the as-received material, was no longer present in samplesexposed to formation 350°C or less. This result suggests that Zr6Fe30 may bereduced to ZrEFe during absorption of deuterium at 200°C to 350°C.
Table 5. Relative Intensities of the Strongest XRD Peaks for As-Received and Deuterium-Exposed SAES St 198
Phase Zr2Fe ZrFe2 ct-=Zr Zr6Fe30 Zr2FeDx ZrD1.8As- 100 76 49 53 0 0
Received
200 0 23 0 0 100 0
300 0 24 0 0 100 24
350 0 34 0 0 100 21
400 0 55 0 38 29 1130
500 0 57 0 35 0 100
ZrDL8 peaks are absent in the as-received and 200°C samples, but becomeapparent in samples exposed at 300°C and 350°C. These become the mostintense peaks in the diffraction patterns at 400°C and 500°C. The Zr2FeD,peak becomes less intense at 400°C, and is absent at 500°C. Thus, on thetime scale of our experiments, Zr2FeDx is stable at temperatures of 350°Cand below. Above 350°C, Zt'2FeDx decomposes rapidly. The reason for thereappearance of Zr6Fe30 peaks at 400°C and 500°C is unclear. Observationof the diffraction patterns, as well as the data in Table 5, indicate an intensityincrease in the ZrFe2 peaks. It appears that there may be an increase in theZrFe2 peak intensity at higher temperatures.
20 9_xo473.Mwo
Deuterium Absorption and Material Phase WSRC-TR-92-557Characteristics of SAES St 198 Zr-Fe Alloy Rev 1
I I i I I I I500°C 16 1 Zr2Fe
I 2 ZrFe2- 2 3 Zr6Fe30
4 (x-Zr
2 3 5 Zr2FeDx6 ZrD1.8
26 6 6
I I 5 I I I I I200°C
m
t.- 5
5 2_=5 2 5
5 2 5 5 2
I I I I I I I
_ As-Received 22
1,4 3 1
1 1 2
4
I I ! I I I I18.0 24.5 31.0 37.5 44.0 50.5 57.0 63.5 70.0
Two- Theta (Degrees)
Bragg Angle
Figure 12. X-Ray Powder Diffraction Patterns of SAES St 198Samples After Conducting AbsorptionIsotherms at 200°C and 500°C
Deuterium Absorption and Material Phase WSRC-TR-92-557Characteristics of SAES St 198 Zr-Fe Alloy Rev 1
Discussion
Elemental analyses of St 198 detected tin in addition to zirconium and iron.It is uncertain if tin is an inpurity or is an intentional addition. All otherelements are present at impurity levels, and probably do not significantly in-fluence the deuterium absorption behavior of St 198. Detection of primaryZr2Fe by SEM and XRD is consistent with the elemental analysis and the Zr-Fe binary phase diagram,s The Zr-Fe phase diagram indicates that elementalzirconium should be the secondary phase in eutectic. However, ZrsFeSn waspresent along with only pure zinconium (asa-Zr) as a secondary phase ineutectic. Thus, tin appears to play a role in the eutectic behavior of Zr2Fe.Because no ZrsFeSn XRD peaks were detected, it is possible that this phaseis amorphous. The cubic phase identified as Zr6Fe30 seemingly results fromoxygen contamination of Zr2Fe.The iron-zirconium phase diagram indicatesthat, at temperatures less than 775°C, Zr2Fe is unstable and will undergo atransformation to Zr3Fe and ZrFe2. Evidently, the kinetics of thistransformation is slow because no ZraFe was detected in any of our samples.The absence of ZraFe in our samples is surprising because it is often detectedin cast and annealed binary zirconium-iron alloys with compositions similarto St 198.9
Results from the activation study indicate that, at the lower activationtemperature (350°C) and under poor vacuum conditions, initial deuteriumabsorption rates were significantly lower. At the higher activationtemperature (500°C), deuterium absorption rate is not influenced by vacuumconditions, and is rapid for both poor and good vacuum quality. Most likely,the higher gas-phase oxygen, water, and other impurity concentrations underpoor vacuum conditions cannot be adsorbed and diffused into the bulk at asufficiently fast rate to maintain a clean and active getter surface. At thehigher temperature, adsorption and diffusion of impurities into the bulk israpid. There is little bu!ldup of these impurities on the surface. The maineffect value for the influence of activation time on the activation process(Table 4) indicates that time has a small effect on the activation of St 198.
While measuring absorption isothermsat 400°C and 500°C, we noticed that aslow reaction, which consumed deuterium, may be occurring in the lattice(Figure 9). The XRD results presented in Table 5 and in Figure 12 indicatethat on the time scale over which our samples were exposed, Zr2FeDx beginsto decompose rapidly above 350°C. While it is clear that this decompositionproceeds with formation of ZrDl.g, the state of the remaining iron is notcertain. Previous investigators indicate that Zr2FeHx proceeds with formationof ZrH2 and ZrFe2. Van Essen and Buschow5 indicate that for 4 hours at50°C and under hydrogen pressure of 4.05 MPa, the reaction of hydrogenwith Zr2Fe forms ZrH2 and ZrFe2. Although these authors indicate thatresults from x-ray diffraction led to this conclusion, the details of their x-raydiffraction results were not provided. It is uncertain from the Van Essen andBuschow paper which of the decomposition products (ZrH2or ZrFe2) theydetected. It is surprising that the decomposition products were detected atsuch a low temperature. However, the extremely high hydrogen pressure usedmay cause this. From XRD analysis of samples, Aubertin et al.6 also reportthe formation of ZrH2 and ZrFe2. Their samples were exposed totemperatures of 850°C, where migration of atoms is sufficiently fast to allowto form significant quantities of additional phases such as ZrH2 and ZrFe2.Manini et al.3examined the phases present in Zr2Fe samples fully andpartially loaded with hydrogen. XRD analysis of their partially loaded

Deuterium Absorption and Material Phase WSRC-TR-92-557Characteristics of SAES St 198 Zr-Fe Alloy, Rev I
samples suggests some formation of ZrFe2, whereas ZrFe2 peaks indiffraction patterns of the fully loaded _mples were distinct. Their sampleswere held at 500°C for 2 hours.
The XRD results in Table 5 and in Figure 12 indicate that, while it is clearthat ZrDl.s is forming at the higher temperatures, formation of ZrFe2at thehigher temperatures (> 350°C) is not obvious. Our samples were exposed todeuterium for ~ 8 hours, which is significantly longer than the samples thatManini et al. examined. The deuterium loading of our samples was notconstant, so a straightforward comparison between our samples and theMartini et al. samples is not possible. However, the 500°C absorptionisotherms in Figure 9 that were collected for equilibration times of20 minutes and 1 hour indicate that at low loading (<2 kPa.L.g) there is littledifference between the two isotherms. As loading increases, the de-composition reaction is more rapid. Apparently, the decomposition reactionrate increases with loading. Thus, it is likely that fully loaded Zr2Fe samplesthat Manini et al.3 and Aubertin et al.6 examined had significantly higherdecomposition rates because they were fully loaded.
Our samples are probably similar to the partially loaded samples of Manini etal. that showed minor formation of ZrFe2. The reaction of deuterium withZr2Fe and subsequent decomposition of Zr2FeDx to ZrDz and ZrFez can bedescribed as follows:
x
(8) Zr2Fe + _ D2 _-- Zr2FeDx --->fast slow or fastdepending on T
x x I2 ZrD2 + _ ZrFe2 + (1 - _ x) Zr2Fe,
where 0 < x < 3. The first step is a rapid equilibration. The second step isslow at low temperatures, and becomes faster at higher temperature. ZrzFeformed in Equation (8) subsequently reacts with deuterium from the gasphase to restore the equilibrium concentration of Zr2FeD,,,
(9) Zr2Fe + _ D2 _ Zr2FeDx.
This explains the observed slow deuterium consumption from the gas phase.Equation (8) predicts stoichiometric formation of ZrFea. However, Table 5indicates that while formation of ZrD2 is distinct, there is only a slightindication of ZrFe2formation. Therefore, Equation (8) cannot fully explainthe behavior. It is also possible that Zr2FeDx could decompose to ZrD2without forming ZrFe2.For example,
1(10) Zr2FeDx + (2 - _x) D2 --->2 ZrD2 + Fe,
could proceed with formation of Fe as well as ZrD2. Our XRD results do notdetect metallic iron, although iron produced in this reaction might notcrystallize to sufficiently large crystals to be detected by XRD. Similar high-temperature disproportionation reactions have been observed with other
93xo47_.uwo 23

Deuterium Absorption and Material Phase WSRC-TR-92-557Characteristics of SAES St 198 Zr-Fe Alloy Rev 1
intermetallic compounds, where the element having high hydrogen affinityreacts to form a stable metal hydride. It is likely that both Equations (8) and(10) are occurring.
The inherent instability of the Zr2Fe compound, as dictated by the Zr-Fephase diagrams, indicates that at temperatures less than 775°C Zr2Fe shouldtransform to Zr3Fe and ZrFe.z in the absence of hydrogen isotopes. In thepresence of hydrogen isotopes, decomposition occurs by Equations (8) and(10). We detected little decomposition of Zr2Fe in deuterium-loaded samplesat 350°C after about 8 hours. However, in recent experiments with St 198 (tobe reported in the future) where the material was held at 350°C while loadedwith deuterium for longer periods of time (>5 days), we see significantdecomposition of Zr2Fe, as indicated by strong ZrDI.sXRD peaks. Thus,decomposition of Zr2Fe can be expected in applications involving hightemperature and significant hydrogen isotope loading. For applications suchas tritium removal from glovebox atmospheres or process gas streams,extended exposure of the material to high temperature (350°C) will be thecase, but very low tritium loadings are expected. Figure 9 indicates thatdecomposition of Zr2Fe at a ioadings less that about 2 kPa.L.g"_is slow evenat 500°C.
Although previous investigators have indicated that tritium recovery andregeneration of St 198capacity can be achieved by heating the alloy to 700°Cunder vacuum or under noble gas purge,2 we believe that an investigation isneeded to fully characterize this process. Heating tritium-loaded St 198 tohigh temperature will likely cause the reaction of some tritium to form ZrT2.While some tritium will be recovered, it is likely that a portion of the tritiumwill be converted irreversibly to ZrT2. Furthermore, the regenerated materialwould show a decreased capacity for gettering tritium, and possibly othermaterial differences from the freshly activated St 198. A further investigationis probably necessary to establish the optimum regeneration conditions.
It was shown above that the P-C-T data can be correlated with a simpleequilibrium expression (Equation [71). While previous investigators haveused a different expression to correlate P-C-T data for Zr2Fe,3.4Equation (7)represents an improvement to the previous expressions because it applies tothe full range of deuterium ioadings. Because of secondary reactionsoccurring in the lattice at temperatures above 350°C, it is not possible toprovide a reliable correlation at temperatures above 350°C.
Analysis of the P-C-T data resulted in an absorption enthalpy (AH°)of 101.8
kJ'mole _ D2. Other investigators have measured AH°values for other SAESgetters. AH° for deuterium absorption in St 101 is reported to be 138.2kJ.mole-lD2; 10.11AHofor St 707 is 120.6 kJ'mole'lD2 .1° St 101 has muchlower absorption pressures than St 198, and it thus should have a higherabsorption enthalpy. The absorption pressures of St 198 are similar to thoseof St 707, so a similar absorption enthalpy is expected, but the value forSt 198 that we report is lower than that of Boffito et al. _°However, theabsorption enthalpy reported by Boffito et al. was determined from P-C-Tdata for low deuterium loading in the alloy. Our absorption enthalpy resultfor St 198 was extracted from P-C-T data covering the full deuteriumcapacity of the alloy. Because of repulsive interaction effects betweendeuterons in the metal lattice, the absorption enthalpy is most likely afunction of the alloy deuterium loading. Repulsive interactions would likelycause lower absorption enthalpy at higher deuterium loading, and this may bethe reason for our lower absorption enthalpy value.
_-'_ 93XO,I?3MWO
Deuterium Absorption and Material Phase WSRC-TR-92-557
Characteristics of SAES St 198 Zr-Fe Alloy Rev 1
Conclusion
St 198 consists mostly of the Zr2Fe phase with secondaryphases of ZrFe2,ZrsFeSn, t_-Zr, and Zrt,Fe30. The material becomes well activated when
evacuated at temperatures higher than 350°C for 4 hours or longer, as long asa relatively high vacuum is maintained. Higher activation temperaturesshould be considered for systems with poorer vacuum quality. Deuterium P-C-T data for the full range of getter deuterium loadings and at temperaturesof 350°C or lower can be correlated using a simple equilibrium expression.At temperatures higher than 350°C, Zr2FeD_ decomposes at a significant rateto ZrD2, and possibly ZrFe2 and Fe. However, for applications involving lowhydrogen isotope loading, such as stripping low tritium concentrations fromglovebox or process atmospheres, the decomposition reaction probablywould be insignificant. Recovery of tritium absorbed on St 198 by heatingunder vacuum at temperatures higher than 500°C would likely causedecomposition of Zr2FeT x with the formation of irreversible Zr%, and adecreased capacity of the regenerated material. An investigation is necessaryto establish the feasibility and optimum conditions for recovering hydrogenisotopes from St 198.
Acknowledgments
The authors wish to thank many individuals for contributions to this work.Mercury porisimetry was performed by R. A. Malstrom, bulk elementalanalyses by plasma-mass spectroscopy and x-ray fluorescence were providedby C. J. Coleman and A. R. Jurgensen, respectively. F. E. Odum and A. S.Holston prepared the samples for scannirg electron microscopy and electronprobe microanalysis. Scanning electron microscopy examination wasperformed by A. S. Hoiston and J. E. Durden. Electron probe microanalysiswas performed by L. F. Tovo and S. F. McDaniel. A. R. Jurgensen and R. E.Howell provided the x-ray diffractometry analyses. W. L. Moyer assistedwith the activation study and P-C-T measurements.
References
1. Kherani, N. P., Shmayda, W. T., and Jalbert, R. A., Proceedings of the12th Symposium on Fusion Engineering, Monterey, Ca., October 12-16, 1987, I. E. Conf. No. 11702.
2. Shmayda, W. T., Kherani, N. P., Wallace, B., and Mazza, F., Fusion
Technology, Vol. 21,616 (1992).3. Martini, P., Boffito, C., Gasparini, G., Maran, C., and Gallitognotta, A.,
Proceedings of the 2nd European Vacuum Conference, Trieste (1990).4. Boffito, C., Doni, F., and Rosai, L., Journal of the Less-Common
Metals 104, 149 (1984).
5. Van Essen, R. M., and Buschow, K. H. J., Journal of the Less-CommonMetals 64, 277 (1979).
6. Aubertin, F., Gonser, U., and Campbell, S. J., Journal of the Less-Common Metals 101,437 (1984).
7. Powder Diffraction Files compiled by the JCPDS - International Centerfor Diffraction Data.
8. Massalski, T. B., Editor-in-Chief, "Binary Alloy Phase Diagrams",Second Edition, Volume 3, p. 1798, ASM International (1990).
93xo473.Mwo 25
Deuterium Absorption and Material Phase WSRC.TR-92.557Characteristics of SAES St 198 Zr.Fe Alloy Rev 1
9. Malakhova, T.O., andAlekseyeva, Z. M.,Journal of the Less-CommonMetals 8/293 (1981),
10. Boffito, C., Ferrario, B., and Martelli, D., Journal of Vacuum Scienceand Technology A l (2), 1279 (1983).
11. Knize, R. J., Journal of Vacuum Science and Technology 20, 1135(1982).
26 93xo4n_vo

This page intentionallyleft blank.
P
WSRC-TR-92-$57, Rev 1
DISTRIBUTION
Copy ff_,
1. J.R. Knight, 773-A
2. T. Motyka, 773-A
3. J.R. Dollar, 232-H
4. A.F. Reichman, 773-A
5. M.W. Lee, 773-A
6. A. Nobile, LANL, MST-3, C 348
7. W.C. Mosley, 773-A
8. J.S. Holder, 232-H
9. K.N. Brooks, 234-H
10. J.R. Wermer, 232-H
11. J.E. Klein, 773-A
12. L.K. Heung, 773-A
13. D.L. Hayes, 235-H
14. D.J. Green, 235-H
15. R.A. Pedde, 235-H
16. R.D. Buley, 233-5H
17. W.B. Wilson, 703-42A
18. B.S. Strack, 703-43A
19. C.W. Tope, 703-43A
20-23. TIM, 703.43A
Q3XO473.MWO
i