Embed Size (px)
Citation preview

Deutsche BahnFacts & Figures 2018

Environ mental
Eco-pioneer
Economic Profitable quality
leader
Social Top employer
DB2020+ strategy
We drive progress and shape the future
Culture of qualityOperational excellence and customer focus
Digital expertiseInnovative solutionsin our core and new businesses
High performanceShared responsibility andstrong performance
Our customers benefit from first-class and environmentally friendly mobility and logistics solutions driven by dedicated employees and digital expertise.
01001011010 000010101100

Contents 2 DB Group 2 Management Board of Deutsche Bahn AG 2 Organizational structure of Deutsche Bahn Group 3 Supervisory Board of Deutsche Bahn AG
4 Key figures 4 DB2020+ top targets 6 Economic 12 Social 15 Environmental 16 Ratings
17 Figures by business units 17 Overview passenger transport 19 DB Long-Distance 21 DB Regional 22 DB Arriva 24 DB Cargo 25 DB Schenker 26 DB Netze Track 28 DB Netze Stations 29 DB Netze Energy
30 10-year summaries 30 Rail performance figures 30 Employees 32 Statement of income 32 Operating profit figures/value management 34 Cash flow/capital expenditures 34 Balance sheet 36 DB2020+ top targets
37 Contact information 37 Investor Relations 38 Communications 39 Management representatives for the Federal states 40 Service numbers
U2 DB2020+ strategy
U3 Financial calendar

DB GroupManagement Board of Deutsche Bahn AG
Deutsche Bahn AG
Chairman and CEO Human Resources and Legal Affairs
Digitalization and Technology
O R G A N I Z AT I O N A L S T R U C T U R E O F D E U T S C H E B A H N G R O U P
Information regarding CVs at: Πdb.de/management-board
Deutsche Bahn Group Facts&Figures 2018
2

from left to right
Business units
DB Regional DB Schenker
DB Arriva
DB Long-Distance DB Cargo DB Netze Track
DB Netze Stations
DB Netze Energy
Passenger Transport Finance, Freight Transport and Logistics Infrastructure
◊ Michael Odenwald Chairman of the Supervisory Board
◊ Alexander Kirchner* Deputy Chairman of the Supervisory Board
◊ Guido Beermann ◊ Jürgen Beuttler* ◊ Dr. Ingrid Hengster ◊ Jörg Hensel* ◊ Dr. Levin Holle ◊ Klaus-Dieter Hommel* ◊ Prof. Dr. Susanne Knorre
◊ Jürgen Knörzer* ◊ Dr. Jürgen Krumnow ◊ Kirsten Lühmann ◊ Heike Moll* ◊ Stefan Müller ◊ Eckhardt Rehberg ◊ Mario Reiß* ◊ Regina Rusch-Ziemba* ◊ Jens Schwarz* ◊ Veit Sobek* ◊ Oliver Wittke
* Employees’ representative on the Supervisory Board.
Supervisory Board of Deutsche Bahn AG
Berthold HuberPassenger Transport Born 1963 Appointed until 2022 Since 1997 in DB Group
Alexander DollFinance, Freight Transport and Logistics Born 1970 Appointed until 2021Since 2018 in DB Group
Martin SeilerHuman Resources and Legal Affairs Born 1964 Appointed until 2020 Since 2018 in DB Group
Dr. Richard LutzChairman and CEO Born 1964 Appointed until 2022 Since 1994 in DB Group
Prof. Dr. Sabina JeschkeDigitalization and Technology Born 1968 Appointed until 2020 Since 2017 in DB Group
Ronald PofallaInfrastructure Born 1959 Appointed until 2022 Since 2015 in DB Group
DB GRoUP
3

Behind schedule On schedule Ahead of schedule
20 40 60 80 100 120 140 160 180
Behind schedule On schedule Ahead of schedule
20 40 60 80 100 120 140 160 180
Behind schedule On schedule Ahead of schedule
20 40 60 80 100 120 140 160 180
Behind schedule On schedule Ahead of schedule
20 40 60 80 100 120 140 160 180
Behind schedule On schedule Ahead of schedule
20 40 60 80 100 120 140 160 180
Key figuresDB2020+ top targets
Is our progress towards our 2020 target on track? (%)
2018 Improvement. Are we going ahead as planned? Difference between control and 100% shows delay/lead as a proportion of the distance between actual number and target.
E C O N O M I C
Basis 2012 –
2017 75.8
2018 75.1
Target DB2020+ ~79
Basis 2012 94.4
2017 93.9
2018 93.4
Target DB2020+ ≥ 95
Basis 2012 –
2017 70.5
2018 65.5
Target DB2020+ ≥ 73
Basis 2012 8.3
2017 6.1
2018 5.8
Target DB2020+ ≥ 7.0
Reasonable rate of return – ROCE (%)
Basis 2012 22.2
2017 18.7
2018 17.6
Target DB2020+ ≥ 25
Financial stability – redemption coverage (%)
Punctuality DB Group (rail) in Germany (%)
Customer satisfaction freight transport and logistics (SI 1))
Customer satisfaction passengers (SI 1))
2018
2018
2018
2018
2018
Deutsche Bahn Group Facts&Figures 2018
4

Behind schedule On schedule Ahead of schedule
20 40 60 80 100 120 140 160 180
Behind schedule On schedule Ahead of schedule
20 40 60 80 100 120 140 160 180
Behind schedule On schedule Ahead of schedule
20 40 60 80 100 120 140 160 180
Behind schedule On schedule Ahead of schedule
20 40 60 80 100 120 140 160 180
Behind schedule On schedule Ahead of schedule
20 40 60 80 100 120 140 160 180
Behind schedule On schedule Ahead of schedule
20 40 60 80 100 120 140 160 180
S O C I A L
E N V I R O N M E N TA L
Basis 2012 3.6
2017 –
2018 3.7
Target DB2020+ 4.0
Employer satisfaction (SI 1))
Basis 2012 26
2017 13
2018 13
Target DB2020+ ≤ 10
Employer attractiveness rank in Germany
Basis 2012 24.0
2017 44.0
2018 57.2
Target DB2020+ 45
Climate protection – share of renew-able energies in the DB traction current mix (%)
Basis 2012 7,349
2017 39,604
2018 50,409
Target DB2020+ 63,000
Noise reduction – quiet freight cars in Germany as of Dec 31
Basis 2012 –12.0
2017 –29.5
2018 –33.2
Target DB2020+ –30
Climate protection – specific greenhouse gas emissions compared to 2006 (%)
Basis 2012 1,200
2017 1,701
2018 1,758
Target DB2020+ 2,000
Noise reduction –track kilometers noise remediated in total as of Dec 31 (km)
2018
2018
2018
2018
2018
2018
1) Satisfaction index.
Key FiGUReS
5

Economic
Punctuality (%) 2018 2017 2016
DB Group in Germany (rail) 93.4 93.9 94.3 DB rail passenger transport in Germany 93.5 94.1 94.4 DB Long-Distance 74.9 78.5 78.9 DB Regional 94.0 94.4 94.8 DB Cargo (Germany) 72.9 73.4 76.2DB Arriva (rail: Great Britain, Denmark,Sweden, the Netherlands and Poland) 89.8 92.3 91.0DB Regional (bus) 91.0 90.5 90.6DB Cargo (Europe) 72.8 72.7 75.6
Product quality rail infrastructure in Germany (%) 2018 2017 2016
Punctuality in Germany 1) 92.9 93.6 93.9Facilities quality (passenger stations) (grade) 2.88 2) 2.89 2) 2.92Supply reliability (energy) 99.99 3) 99.99 3) 99.99
1) Non-Group and DB Group train operating companies.2) Preliminary figure.3) Preliminary figure (not rounded).
Customer satisfaction (SI) 2018 2017 2016
Passengers 75.1 75.8 76.0 DB Long-Distance 77 77 77 DB Regional (rail) 66 68 69 DB Regional (bus) 74 74 75 DB Arriva (bus and rail in Great Britain) 79 80 81 DB Netze Stations (stations (passenger/visitors)) 68 69 69 DB Sales 82 82 81 DB Connect (car-sharing) 79 78 76 DB Connect (Call a Bike) 79 79 77Freight transport and logistics 1) 65.5 70.5 – DB Cargo 1) 60 67 – DB Schenker 1) 71 74 –DB Netze Track 64 67 69DB Netze Stations Stations (TOC 2) and transport authorities) 61 62 62 Tenants 76 78 78DB Netze Energy 3) 78 – 80 Traction current and diesel 3) 75 – 80 Electricity and gas plus
(DB Group customers) 3) 79 – 79 Electricity and gas plus
(non-Group customers) 3) 81 – 82
1) Survey annually from 2017 onwards.2) Train operating companies.3) No survey in 2017.
Deutsche Bahn Group Facts&Figures 2018
6

Performance figures 2018 2017 ± absolute ± %
PA S SENGER TR AN SP ORT
Passengers (million) 4,669 4,685 –16 – 0.3Passengers per day (million) 12.8 12.8 – –R AIL
Passengers (million) 2,581 2,564 +17 + 0.7 thereof in Germany 2,087 2,075 +12 + 0.6 thereof DB Long-Distance 147.9 142.2 + 5.7 + 4.0Passengers per day (million) 7.1 7.0 + 0.1 +1.4Volume sold (million pkm 1)) 97,707 95,854 +1,853 +1.9Volume produced (million train-path km 2)) 781.3 779.0 +2.3 + 0.3Trains per day 3) 24,068 24,189 –121 – 0.5BUS
Passengers(million) 2,087 2,121 –34 –1.6Passengers per day (million) 5.7 5.8 – –Volume sold 3) (million pkm 1)) 6,942 7,220 –278 –3.9Volume produced (million bus km 4)) 1,602 1,616 –14 – 0.9R AIL FR EIGHT TR AN SP ORT
Freight carried (million t) 255.5 271.0 –15.5 – 5.7Volume sold (million tkm 5)) 88,237 92,651 – 4,414 – 4.8Volume produced (million train-path km 2)) 165.8 175.6 – 9.8 – 5.6Trains per day 2,873 3,133 –260 – 8.3Mean transport distance (km) 345.4 341.9 + 3.5 +1.0Capacity utilization (t per train) 532.3 527.5 + 4.8 + 0.9FR EIGHT FORWAR DING AND LO GI STIC S
Shipments in land transport (thousand) 106,468 100,452 + 6,016 + 6.0Air freight volume (export) (thousand t) 1,304 1,300 + 4 + 0.3Ocean freight volume (export) (thousand TEU 6)) 2,203 2,169 + 34 +1.6Warehouse space contract logistics (million m²) 8.3 8.0 + 0.3 + 3.8INFR A STRU C TUR E
Train kilometers on track infrastructure (million train-path km 2)) 1,086 1,073 +13 +1.2 thereof non-Group railways 349.3 331.4 +17.9 + 5.4Station stops (million) 154.1 153.2 + 0.9 + 0.6 thereof non-Group railways 37.0 36.1 + 0.9 +2.5
1) Passenger kilometers: product of number of passengers and mean travel distance.2) Train-path kilometers: driving performance in km of trains on rail.3) Excluding DB Arriva.4) Bus kilometers: driving performance in km of buses on road.5) Ton kilometers: product of freight carried and mean transport distance.6) TEU: twenty-foot equivalent unit.
Key FiGUReS
7

Financial figures (€ million) 2018 2017 ± absolute ± %
R EVENUE S AND PROFIT
Revenues adjusted 44,024 42,704 +1,320 + 3.1Revenues comparable 44,486 42,703 +1,783 + 4.2Profit before taxes on income 1,172 968 +204 +21.1Net profit for the year 542 765 –223 –29.2EBITDA adjusted 4,739 4,930 –191 –3.9EBIT adjusted 2,111 2,152 – 41 –1.9BAL AN CE SHEET A S OF DEC 31
Non-current assets 46,646 45,625 +1,021 +2.2Current assets 11,881 10,811 +1,070 + 9.9Equity 13,592 14,238 – 646 – 4.5Net financial debt 19,549 18,623 + 926 + 5.0Total assets 58,527 56,436 +2,091 + 3.7VALUE MANAGEMENT
Capital employed as of Dec 31 36,657 35,093 +1,564 + 4.5Return on capital employed (ROCE) (%) 5.8 6.1 – –Redemption coverage (%) 17.6 18.7 – –Net debt/EBITDA(multiple) 4.8 4.5 – –C A SH FLOW/C APITAL E XPENDITUR E S
Gross capital expenditures 11,205 10,464 +741 +7.1Net capital expenditures 3,996 3,740 +256 + 6.8Cash flow from operating activities 3,371 2,329 +1,042 + 44.7
Total revenues (€ million) 2018 2017 ± absolute ± %
DB Long-Distance 4,682 4,347 + 335 +7.7DB Regional 8,968 8,734 +234 +2.7DB Arriva 5,441 5,345 + 96 +1.8DB Cargo 4,460 4,528 – 68 –1.5DB Schenker 17,050 16,430 + 620 + 3.8DB Netze Track 5,511 5,364 +147 +2.7DB Netze Stations 1,314 1,265 + 49 + 3.9DB Netze Energy 2,850 2,794 + 56 +2.0Other 4,990 4,854 +136 +2.8Consolidation –11,242 –10,957 –285 +2.6
DB Group 44,024 42,704 + 1,320 + 3.1
Deutsche Bahn Group Facts&Figures 2018
8

External revenues (€ million) 2018 2017 ± absolute ± %
DB Long-Distance 4,528 4,193 + 335 + 8.0DB Regional 8,862 8,629 +233 +2.7DB Arriva 5,433 5,338 + 95 +1.8DB Cargo 4,177 4,209 –32 – 0.8DB Schenker 16,973 16,345 + 628 + 3.8DB Netze Track 1,559 1,522 + 37 +2.4DB Netze Stations 569 540 +29 + 5.4DB Netze Energy 1,350 1,301 + 49 + 3.8Other 573 627 – 54 – 8.6
DB Group 44,024 42,704 + 1,320 + 3.1
External revenues by regions (€ million) 2018 2017 ± absolute ± %
Germany 24,929 24,093 + 836 + 3.5Europe (not including Germany) 13,593 13,318 +275 +2.1Asia/Pacific 3,035 2,935 +100 + 3.4North America 1,905 1,801 +104 + 5.8Rest of world 562 557 + 5 + 0.9
DB Group 44,024 42,704 + 1,320 + 3.1
ROCE 2018 2017 ± absolute ± %
EBIT adjusted (€ million) 2,111 2,152 – 41 –1.9 Capital employed as of Dec 31
(€ million) 36,657 35,093 +1,564 + 4.5
ROCE (%) 5.8 6.1 – –
Redemption coverage (€ million) 2018 2017 ± absolute ± %
EBITDA adjusted 4,739 4,930 –191 –3.9 Net operating interest – 618 – 682 + 64 – 9.4 Share of depreciation of lease rate 1,114 1,079 + 35 + 3.2 Actual taxes on income –192 –180 –12 + 6.7
Operating cash flow after taxes 5,043 5,147 +104 –2.0
Net financial debt as of Dec 31 19,549 18,623 + 926 + 5.0 Present value operate leases
as of Dec 31 4,245 4,934 – 689 –14.0
Adjusted net financial debt as of Dec 31 23,794 23,557 +237 +1.0
Pension obligations as of Dec 31 4,823 3,940 + 883 +22.4
Adjusted net debt as of Dec 31 28,617 27,497 +1,120 + 4.1
Redemption coverage (%) 17.6 18.7 – –
Key FiGUReS
9

EBITDA adjusted (€ million) 2018 2017 ± absolute ± %
DB Long-Distance 675 611 + 64 +10.5DB Regional 1,126 1,156 –30 –2.6DB Arriva 575 569 + 6 +1.1DB Cargo 54 130 –76 – 58.5DB Schenker 703 676 +27 + 4.0DB Netze Track 1,446 1,484 –38 –2.6DB Netze Stations 362 372 –10 –2.7DB Netze Energy 87 141 – 54 –38.3Other/consolidation –289 –209 – 80 + 38.3
DB Group 4,739 4,930 –191 –3.9
EBIT adjusted (€ million) 2018 2017 ± absolute ± %
DB Long-Distance 417 381 + 36 + 9.4DB Regional 492 508 –16 –3.1DB Arriva 300 301 –1 – 0.3DB Cargo –190 – 90 –100 +111DB Schenker 503 477 +26 + 5.5DB Netze Track 840 687 +153 +22.3DB Netze Stations 221 233 –12 – 5.2DB Netze Energy 21 72 – 51 –70.8Other/consolidation – 493 – 417 –76 +18.2
DB Group 2,111 2,152 – 41 –1.9
Excerpt from statement of income (€ million) 2018 2017 ± absolute ± %
Profit before taxes on income 1,172 968 +204 +21.1Taxes on income – 630 –203 – 427 – Actual taxes on income –192 –180 –12 + 6.7 Deferred tax expenses – 438 –23 – 415 –
Net profit for the year 542 765 –223 –29.2 DB AG shareholders 528 745 –217 –29.1 Other shareholders (non-controlling interests) 14 20 – 6 –30.0Earnings per share (€) Undiluted 1.23 1.73 – 0.50 –28.9 Diluted 1.23 1.73 – 0.50 –28.9
Deutsche Bahn Group Facts&Figures 2018
10

Gross capital expenditures (€ million) 2018 2017 ± absolute ± %
DB Long-Distance 1,081 1,060 +21 +2.0DB Regional 539 674 –135 –20.0DB Arriva 326 374 – 48 –12.8DB Cargo 587 328 +259 +79.0DB Schenker 273 246 +27 +11.0DB Netze Track 6,901 6,601 + 300 + 4.5DB Netze Stations 883 709 +174 +24.5DB Netze Energy 187 177 +10 + 5.6Other/consolidation 428 295 +133 + 45.1
DB Group 11,205 10,464 + 741 + 7.1
Gross capital expenditures by regions (€ million) 2018 2017 ± absolute ± %
Germany 10,682 9,906 +776 +7.8Europe (not including Germany) 506 546 – 40 –7.3Asia/Pacific 79 61 +18 +29.5North America 16 9 +7 +77.8Rest of world 5 5 – –Consolidation – 83 – 63 –20 + 31.7
DB Group 11,205 10,464 + 741 + 7.1
Net capital expenditures (€ million) 2018 2017 ± absolute ± %
DB Long-Distance 1,081 1,060 +21 +2.0DB Regional 526 628 –102 –16.2DB Arriva 312 372 – 60 –16.1DB Cargo 586 324 +262 + 80.9DB Schenker 273 246 +27 +11.0DB Netze Track 564 660 – 96 –14.5DB Netze Stations 164 103 + 61 + 59.2DB Netze Energy 65 53 +12 +22.6Other/consolidation 425 294 +131 + 44.6
DB Group 3,996 3,740 + 256 + 6.8
Net capital expenditures by regions (€ million) 2018 2017 ± absolute ± %
Germany 3,487 3,184 + 303 + 9.5Europe (not including Germany) 492 544 – 52 – 9.6Asia/Pacific 79 61 +18 +29.5North America 16 9 +7 +77.8Rest of world 5 5 – –Consolidation – 83 – 63 –20 + 31.7
DB Group 3,996 3,740 + 256 + 6.8
Key FiGUReS
11

Social
Employee satisfaction (SI) 2018 2017 2016
DB Group 3.7 – 3.7 DB Long-Distance 3.5 – 3.5 DB Regional 3.5 – 3.5 DB Arriva 3.6 – 3.7 DB Cargo 3.5 – 3.4 DB Schenker 3.8 – 3.8 DB Netze Track 3.7 – 3.7 DB Netze Stations 3.7 – 3.7 DB Netze Energy 3.8 – 3.8Follow-up workshop implementation rate DB Group (%) – 97.1 –
The employee survey is conducted every two years. When no survey has been conducted the key figure “Follow-up workshop implementation rate” is used.
Employer attractiveness (rank in Germany) 2018 2017 2016
DB Group 13 13 16 High school students 15 15 26 Students/graduates 17 20 24 Skilled workers 12 13 12 Academically experienced professionals 16 10 9
Young professionals as of Dec 31 (NP 1)) 2018 2017 2016
Trainees 2) 9,923 9,540 9,530Dual degree students 2) 949 900 941Trainees 3) 157 109 114Interns 3) 534 537 503“Chance plus” participants 250 250 250
DB Group 11,813 11,336 11,338
1) NP = natural persons.2) Germany; includes all class years of vocational training
(usually three class years of trainees and dual degree students). 3) Germany (companies with about 98% of domestic employees).
Deutsche Bahn Group Facts&Figures 2018
12
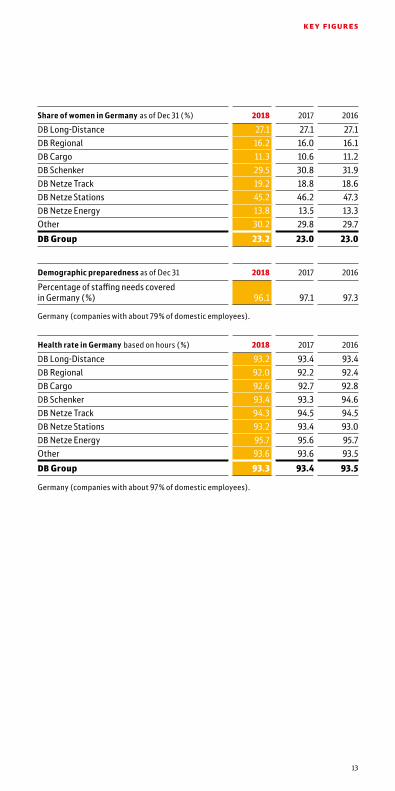
Share of women in Germany as of Dec 31 (%) 2018 2017 2016
DB Long-Distance 27.1 27.1 27.1DB Regional 16.2 16.0 16.1DB Cargo 11.3 10.6 11.2DB Schenker 29.5 30.8 31.9DB Netze Track 19.2 18.8 18.6DB Netze Stations 45.2 46.2 47.3DB Netze Energy 13.8 13.5 13.3Other 30.2 29.8 29.7
DB Group 23.2 23.0 23.0
Demographic preparedness as of Dec 31 2018 2017 2016
Percentage of staffing needs covered in Germany (%) 96.1 97.1 97.3
Germany (companies with about 79% of domestic employees).
Health rate in Germany based on hours (%) 2018 2017 2016
DB Long-Distance 93.2 93.4 93.4DB Regional 92.0 92.2 92.4DB Cargo 92.6 92.7 92.8DB Schenker 93.4 93.3 94.6DB Netze Track 94.3 94.5 94.5DB Netze Stations 93.2 93.4 93.0DB Netze Energy 95.7 95.6 95.7Other 93.6 93.6 93.5
DB Group 93.3 93.4 93.5
Germany (companies with about 97% of domestic employees).
Key FiGUReS
13

Employees as of Dec 31 (FTE 1)) 2018 2017 ± absolute ± %
DB Long-Distance 16,548 15,993 + 555 + 3.5
DB Regional 35,881 35,651 +230 + 0.6DB Arriva 53,056 54,650 –1,594 –2.9DB Cargo 28,842 28,257 + 585 +2.1DB Schenker 75,817 71,888 + 3,929 + 5.5DB Netze Track 46,969 45,375 +1,594 + 3.5DB Netze Stations 5,804 5,463 + 341 + 6.2DB Netze Energy 1,734 1,721 +13 + 0.8Other 53,877 51,937 +1,940 + 3.7
DB Group 318,528 310,935 + 7,593 + 2.4
1) FTE = full-time employees.
Employees by regions as of Dec 31 (FTE 1)) 2018 2017 ± absolute ± %
Germany 196,334 189,423 + 6,911 + 3.6Europe (not including Germany) 92,336 93,655 –1,319 –1.4Asia/Pacific 16,751 15,971 +780 + 4.9North America 9,736 8,921 + 815 + 9.1Rest of world 3,371 2,965 + 406 +13.7
DB Group 318,528 310,935 + 7,593 + 2.4
1) FTE = full-time employees.
Employees as of Dec 31 (NP 1)) 2018 2017 ± absolute ± %
DB Long-Distance 17,626 17,058 + 568 + 3.3DB Regional 37,879 37,519 + 360 +1.0DB Arriva 55,327 56,848 –1,521 –2.7DB Cargo 29,311 28,771 + 540 +1.9DB Schenker 78,780 74,628 + 4,152 + 5.6DB Netze Track 48,143 46,489 +1,654 + 3.6DB Netze Stations 6,187 5,769 + 418 +7.2DB Netze Energy 1,789 1,768 +21 +1.2Other 56,526 54,531 +1,995 + 3.7
DB Group 331,568 323,381 + 8,187 2.5
1) NP = natural persons.
Employees by regions as of Dec 31 (NP 1)) 2018 2017 ± absolute ± %
Germany 205,041 197,985 +7,056 + 3.6Europe (not including Germany) 96,465 97,307 – 842 – 0.9Asia/Pacific 16,885 16,046 + 839 + 5.2North America 9,798 9,055 +743 + 8.2Rest of world 3,379 2,988 + 391 +13.1
DB Group 331,568 323,381 + 8,187 + 2.5
1) NP = natural persons.
Deutsche Bahn Group Facts&Figures 2018
14

Specific greenhouse gas emissions compared to 2006 (%)
2018 ◊ – 33.2
2017 ◊ –29.5
2016 ◊ –27.3
DB traction current mix (%) 2018 / 2017 / 2016
Renewable energies 1) Green offers ◊ 57.2 ◊ 44.0 ◊ 42.0
Nuclear energy ◊ 9.6 ◊ 13.0 ◊ 17.3
Black coal ◊ 18.7 ◊ 23.3 ◊ 26.6
Lignite ◊ 5.7 ◊ 7.5 ◊ 6.0
Natural gas ◊ 8.3 ◊ 11.6 ◊ 7.6
Other ◊ 0.5 ◊ 0.6 ◊ 0.5
Data for 2018 relate exclusively to DB Group companies and are based on findings and estimates available as of February 2019. 2016 including traction current purchased by non-Group train operating companies. 1) Including additionally purchased energy for all green DB products with 100% green
electricity (for example S-Bahn (metro) Hamburg or DBeco plus) and in consideration of a forecasted rate for support in accordance with the German Renewable Energies Act (Erneuerbare-Energien-Gesetz; EEG).
Noise remediation and prevention in Germanyas of Dec 31 2018 2017 2016
NOISE REMEDIATION (EXISTING NETWORK)
Sound barriers erected (km) 1) 44.6 19.9 35.7Homes with passive measures 2,248 1,634 1,495Track kilometers noise remediated in total 1) (km) 1,758 1,701 1,598NOISE PREVENTION (NEW CONSTRUCTION AND EXPANSION LINES)
Sound barriers erected 1) (km) 82.9 32.2 24.4Homes with passive measures 1) 1,571 1,410 1,491
1) Previous year’s figures adjusted.
Environmental
Key FiGUReS
15

Freight cars in operation equipped with V brake shoes of DB Cargo in Germany as of Dec 31 2018 2017 2016
New freight cars 8,470 8,323 8,302Freight cars refitted with whisper brakes 41,939 31,281 24,094
Quiet freight cars 50,409 39,604 32,396
Volume of waste by type of disposal 2018 2017 2016
Total waste (thousand t) 12,807 12,642 12,921 Recycling rate (%) 98.0 98.0 98.6 1)
Share of thermal recovery (%) 0.9 0.9 1.4 Share of disposal (%) 1.2 1.1 1.4 Share of hazardous waste 2) (%) 3.7 3.3 5.1
1) Figure adjusted. 2) Pursuant to the List of Wastes Ordinance, for example waste oil.
Ratings
Credit ratings
First issued
Last update
Current ratings
Short-term
Long- term Outlook
S&P Global RatingsMay 16,
2000August
21, 2018 A–1+ AA– stable
Moody’sMay 16,
2000October
2, 2018 P–1 Aa1 stable
Sustainability ratingsAs of Mar
2019 2018 2017 Scale
ISS-oekom – Corporate Rating B– B– ° B– ° A+ to D– °MSCI ESG Research A A AA AAA to CCC
CDP – Climate Scoring A A A– ° A to F
EcoVadisSilver
(59) Gold Gold
Gold (62 to 100) ° Silver (46 to 61) °
Bronze (37 to 45) °
Deutsche Bahn Group Facts&Figures 2018
16

Overview passenger transport
2018 2017 ± absolute ± %
PUNC TUALIT Y (%)
Rail in Germany 93.5 94.1 – – DB Long-Distance 74.9 78.5 – – DB Regional 94.0 94.4 – –DB Arriva (rail) 89.8 92.3 – –PER FOR MAN CE FIGUR E S
Passengers (million) 4,669 4,685 –16 – 0.3Passengers per day (million) 12.8 12.8 – –R AIL
Passengers (million) 2,581 2,564 +17 + 0.7 DB Long-Distance 147.9 142.2 + 5.7 + 4.0 DB Regional 1,940 1,930 +10 + 0.5 DB Arriva 493.6 488.3 + 5.3 +1.1 Other 0.2 3.7 –3.5 – 94.6Passengers in Germany (million) 2,087 2,075 +12 + 0.6Passengers per day (million) 7.07 7.02 + 0.05 + 0.7 DB Long-Distance 0.41 0.39 + 0.02 + 5.1 DB Regional 5.31 5.29 + 0.02 + 0.4 DB Arriva 1.35 1.34 + 0.01 + 0.7 Other 0.00 0.01 – 0.01 –Volume sold (million pkm) 97,707 95,854 +1,853 +1.9 DB Long-Distance 42,827 40,548 +2,279 + 5.6 DB Regional 41,878 41,876 +2 – DB Arriva 12,999 13,334 –335 –2.5 Other 2.3 96.0 – 93.7 – 97.6Volume produced (million train-path km) 781.3 779.0 +2.3 + 0.3 DB Long-Distance 143.4 140.5 +2.9 +2.1 DB Regional 460.1 459.3 + 0.8 + 0.2 DB Arriva 177.6 177.6 – – Other 0.2 1.6 –1.4 – 87.5Trains per day 1) 24,068 24,189 –121 – 0.5 DB Long-Distance 1,476 1,387 + 89 + 6.4 DB Regional 22,558 22,698 –140 – 0.6 Other 34 104 –70 – 67.3BUS
Passengers (million) 2,087 2,121 –34 –1.6Volume sold 1) (million pkm) 6,942 7,220 –278 –3.9 DB Long-Distance 194.6 176.6 +18.0 +10.2 DB Regional 6,737 7,036 –299 – 4.2 Other 10.0 8.2 +1.8 +22.0Volume produced (million bus km) 1,602 1,616 –14 – 0.9
1) Excluding DB Arriva.
Figures by business units
17
KEY FIGURES | FIGURES bY bUSInESS UnItS

2018 2017 ± absolute ± %
ROLLING STO CK
ICE fleet (trains) 274 271 + 3 +1.1Multiple units 1) 5,345 5,159 +186 + 3.6 S-Bahn (metro) d.c. 830 830 – – S-Bahn (metro) a.c. 1,094 990 +104 +10.5 Diesel multiple units 2,178 2,095 + 83 + 4.0 Rail buses 5 12 –7 – 58.3 Electric multiple units 1,187 1,181 + 6 + 0.5 Trams 51 51 – –Locomotives 1,299 1,378 –79 – 5.7 DB Long-Distance 2) 407 413 – 6 –1.5 DB Regional 871 942 –71 –7.5 DB Arriva 19 21 –2 – 9.5 Other 2 2 – –Passenger cars 3) 5,625 5,902 –277 – 4.7 DB Long-Distance 2,498 2,498 – – DB Regional 3,043 3,317 –274 – 8.3 DB Arriva 84 87 –3 –3.4Seats (thousand) 1,425 1,356 + 69 + 5.1 DB Long-Distance 229 216 +13 + 6.0 DB Regional 997 941 + 56 + 6.0 DB Arriva 197 197 – – Other 2 2 – –Buses 28,797 29,241 – 444 –1.5 DB Regional 11,712 12,256 – 544 – 4.4 DB Arriva 17,049 16,953 + 96 + 0.6 Other 36 32 + 4 +12.5Automobiles (Flinkster) 5) 4,229 3,670 + 559 +15.2 thereof electric vehicles 289 395 –106 –26.8Automobiles (CleverShuttle) 156 78 +78 +100Automobiles (ioki) 40 10 + 30 –Call a Bikes 15,389 15,611 –222 –1.4 thereof e-Call a Bikes 376 98 +278 –OTHER
Automatic ticketing machines 6,502 7,048 – 546 –7.7 DB Regional 482 484 –2 – 0.4 Combined ticketing machines 6,020 6,564 – 544 – 8.3BahnCards as of Dec 31 (thousand) 5,254 5,368 –114 –2.1 BahnCard 100 52.7 50.3 +2.4 + 4.8 BahnCard 50 1,430 1,365 + 65 + 4.8 BahnCard 25 3,772 3,953 –181 – 4.6Participants BahnBonus program as of Dec 31 (thousand) 3,658 3,353 + 305 + 9.1
1) Including ICE T, ICE TD, ICE 3 and ICE 4.2) Including ICE 1 and ICE 2 power cars. 3) Including ICE cars.4) DB Group and externally owned stock.
5) Bookable station-bound vehicles of the Flinkster network in Germany, Austria, the Netherlands and Italy.
Deutsche Bahn Group Facts&Figures 2018
18

DB Long-Distance
2018 2017 ± absolute ± %
Punctuality rail (%) 74.9 78.5 – –Rate of people making connections(long-distance transport/long-distance transport) (%) 83.9 85.8 – –Customer satisfaction (SI) 77 77 – –Total revenues (€ million) 4,682 4,347 + 335 +7.7 thereof external revenues 4,528 4,193 + 335 + 8.0EBIT adjusted (€ million) 417 381 + 36 + 9.4EBITDA adjusted (€ million) 675 611 + 64 +10.5Gross capital expenditures (€ million) 1,081 1,060 +21 +2.0Employees as of Dec 31 (FTE) 16,548 15,993 + 555 + 3.5Employee satisfaction (SI) 3.5 – – –Share of women as of Dec 31 (%) 27.1 27.1 – –Health rate (%) 93.2 93.4 – –Specific end-energy consumption compared to 2006 (related to pkm) (%) –29.3 –26.7 – –PER FOR MAN CE FIGUR E S
R AIL
Passengers (million) 147.9 142.2 + 5.7 + 4.0 ICE 93.9 86.7 +7.2 + 8.3 IC/EC 52.0 53.2 –1.2 –2.3 Other products 2.0 2.3 – 0.3 –13.0Passengers per day (million) 0.41 0.39 + 0.02 + 5.1Volume sold (million pkm) 42,827 40,548 +2,279 + 5.6 ICE 31,066 28,502 +2,564 + 9.0 IC/EC 11,690 11,967 –277 –2.3 Other products 71 79 – 8 –10.1Volume produced (million train-path km) 143.4 140.5 +2.9 +2.1Mean travel distance (km) 289.6 285.1 + 4.5 +1.6 thereof ICE 330.8 328.7 +2.1 + 0.6 thereof IC/EC 224.8 224.9 – 0.1 –Load factor (%) 56.1 55.5 – –Trains per day 1,476 1,387 + 89 + 6.4BUS
Passengers (million) 0.7 0.7 – –Volume sold (million pkm) 194.6 176.6 +18.0 +10.2ROLLING STO CK
Locomotives 243 249 – 6 –2.4 Electric locomotives 214 219 – 5 –2.3 Diesel locomotives 29 30 –1 –3.3Passenger cars 1,481 1,481 – – IC/EC 1,193 1,252 – 59 – 4.7 Restaurant cars 88 94 – 6 – 6.4 Double-deck cars 200 135 + 65 + 48.1
FIGURES bY bUSInESS UnItS
19

2018 2017 ± absolute ± %
ICE fleet (trains) 274 271 + 3 +1.1ICE 1
Trains 59 59 – –Power cars 118 118 – –Intermediate cars 708 708 – – 1st class cars 195 195 – – 2nd class cars 454 454 – – Restaurant cars 59 59 – –ICE 2
Trains 44 44 – –Power cars 46 46 – –Driving trailers 45 45 – –Intermediate cars 264 264 – – 1st class cars 88 88 – – 2nd class cars 132 132 – – Restaurant cars 44 44 – –ICE T
Multiple units 67 67 – –Rail cars 260 260 – –End cars 136 136 – –Intermediate cars 56 56 – –ICE TD
Multiple units – 13 –13 –100Rail cars – 52 – 52 –100 End cars – 26 –26 –100 Intermediate cars – 26 –26 –100ICE 3
Multiple units 79 80 –1 –1.3Rail cars 316 320 – 4 –1.3 1st class cars 79 80 –1 –1.3 2nd class cars 237 240 –3 –1.3Trailer cars 316 320 – 4 –1.3 1st class cars 79 80 –1 –1.3 2nd class cars 158 160 –2 –1.3 Restaurant cars 79 80 –1 –1.3ICE 4
Multiple units 25 8 +17 –Rail cars 150 48 +102 – 1st class cars 25 8 +17 – 2nd class cars 125 40 + 85 –Trailer cars 150 48 +102 – 1st class cars 50 16 + 34 – 2nd class cars 75 24 + 51 – Restaurant cars 28 8 +20 –
Seats 229,259 215,980 +13,279 + 6.1 1st class 49,477 45,915 + 3,562 +7.8 2nd class 179,782 170,065 + 9,717 + 5.7
Deutsche Bahn Group Facts&Figures 2018
20

DB Regional
2018 2017 ± absolute ± %
Punctuality rail (%) 94.0 94.4 – –Punctuality bus (%) 91.0 90.5 – –Customer satisfaction rail (SI) 66 68 – –Customer satisfaction bus (SI) 74 74 – –Total revenues (€ million) 8,968 8,734 +234 +2.7 thereof external revenues 8,862 8,629 +233 +2.7 thereof concession fees 5,472 3,879 +1,593 + 41.1EBIT adjusted (€ million) 492 508 –16 –3.1EBITDA adjusted (€ million) 1,126 1,156 –30 –2.6Gross capital expenditures (€ million) 539 674 –135 –20.0
Employees as of Dec 31 (FTE) 35,881 35,651 +230 + 0.6Employee satisfaction (SI) 3.5 – – –Share of women as of Dec 31 (%) 16.2 16.0 – –Health rate (%) 92.0 92.2 – –Specific end-energy consumption(rail) compared to 2006 (related to pkm) (%) –29.4 –28.5 – –Specific end-energy consumption(bus) compared to 2006 (related to bus km) (%) + 6.0 + 4.8 – –PER FOR MAN CE FIGUR E S
Passengers (million) 2,521 2,562 – 41 –1.6Passengers per day (million) 6.91 7.02 – 0.11 –1.6Volume sold (million pkm) 48,615 48,911 –296 – 0.6PER FOR MAN CE FIGUR E S R AIL
Passengers (million) 1,940 1,930 +10 + 0.5Passengers per day (million) 5.31 5.29 + 0.02 + 0.4Volume sold (million pkm) 41,878 41,876 +2 –Volume produced (million train-path km) 460.1 459.3 + 0.8 + 0.2Trains per day 22,558 22,698 –140 – 0.6Mean travel distance (km) 21.6 21.7 – 0.1 – 0.5ROLLING STO CK
Locomotives 871 942 –71 –7.5 Electric locomotives 748 810 – 62 –7.7 Diesel locomotives 123 132 – 9 – 6.8Multiple units 4,077 3,816 +261 + 6.8 S-Bahn (metro) d.c. 815 815 – – S-Bahn (metro) a.c. 1,094 990 +104 +10.5 Diesel multiple units 1,485 1,308 +177 +13.5 Rail buses 5 3 +2 + 66.7 Electric multiple units 678 700 –22 –3.1
FIGURES bY bUSInESS UnItS
21

2018 2017 ± absolute ± %
Rail cars 11,211 10,664 + 547 + 5.1 S-Bahn (metro) d.c. 1,795 1,796 –1 – 0.1 S-Bahn (metro) a.c. 4,236 3,858 + 378 + 9.8 Diesel rail cars 3,013 2,510 + 503 +20.0 Rail buses 5 3 +2 + 66.7 Electric rail cars 2,162 2,497 –335 –13.4Coaches 3,043 3,317 –274 – 8.3 Double-deck cars 2,215 2,237 –22 –1.0 Other passenger cars
(including baggage cars) 828 1,080 –252 –23.3Seats 996,736 940,710 + 56,026 + 6.0 1st class 64,802 60,545 + 4,257 +7.0 2nd class (including folding seats) 931,934 880,165 + 51,769 + 5.9PER FOR MAN CE FIGUR E S BUS
Passengers (million) 581.4 631.7 – 50.3 – 8.0Volume sold (million pkm) 6,737 7,036 –299 – 4.2Volume produced (million bus km) 518.6 532.0 –13.4 –2.5BUS FLEET
Buses 11,712 12,256 – 544 – 4.4 DB stock 4,969 4,964 + 5 + 0.1 Externally owned stock 6,743 7,292 – 549 –7.5
DB Arriva
2018 2017 ± absolute ± %
Punctuality rail (Great Britain, Denmark, Sweden, the Netherlands and Poland) (%) 89.8 92.3 – –Customer satisfaction bus and rail in Great Britain (SI) 79 80 – –Total revenues (€ million) 5,441 5,345 + 96 +1.8 thereof external revenues 5,433 5,338 + 95 +1.8EBIT adjusted (€ million) 300 301 –1 – 0.3EBITDA adjusted (€ million) 575 569 + 6 +1.1Gross capital expenditures (€ million) 326 374 – 48 –12.8Employees as of Dec 31 (FTE) 53,056 54,650 –1,594 –2.9Employee satisfaction (SI) 3.6 – – –Specific greenhouse gas emis sions rail compared to 2006 (related to rail car units) 1) (%) –12.3 –12.8 – –Specific greenhouse gas emis sions bus compared to 2006 (related to bus km) (%) –18.2 –17.2 – –
1) Previous yearʼs figure adjusted.
Deutsche Bahn Group Facts&Figures 2018
22

2018 2017 ± absolute ± %
PER FOR MAN CE FIGUR E S
Passengers (million) 1,998 1,976 +22 +1.1Passengers per day (million) 5.47 5.41 + 0.06 +1.1PER FOR MAN CE FIGUR E S R AIL
Passengers (million) 493.6 488.3 + 5.3 +1.1Passengers per day (million) 1.35 1.34 + 0.01 + 0.7Volume sold (million pkm) 12,999 13,334 –335 –2.5Volume produced (million train-path km) 177.6 177.6 – –ROLLING STO CK
Locomotives 19 21 –2 – 9.5 Electric locomotives 2 1 +1 +100 Diesel locomotives 17 20 –3 –15.0Multiple units 1,074 1,143 – 69 – 6.0 S-Bahn (metro) d.c. 15 15 – – Diesel multiple units 670 751 – 81 –10.8 Electric multiple units 338 326 +12 + 3.7 Trams 51 51 – –Rail cars 3,133 3,246 –113 –3.5 S-Bahn (metro) d.c. 30 30 – – Diesel rail cars 1,716 1,879 –163 – 8.7 Electric rail cars 1,336 1,286 + 50 + 3.9 Trams 51 51 – –Coaches 84 87 –3 –3.4 EC/IC 70 70 – – Restaurant cars 4 4 – – Other (including baggage cars) 10 13 –3 –23.1Seats 196,652 197,001 –349 – 0.2 1st class 4,397 4,389 + 8 + 0.2 2nd class (including folding seats) 192,255 192,612 –357 – 0.2PER FOR MAN CE FIGUR E S BUS
Passengers (million) 1,504 1,488 +16 +1.1Volume produced (million bus km) 1,074 1,075 –1 – 0.1BUS FLEET
Buses 17,049 16,953 + 96 + 0.5 DB stock 16,397 16,206 +191 +1.2 Externally owned stock 652 747 – 95 –12.7
FIGURES bY bUSInESS UnItS
23

DB Cargo
2018 2017 ± absolute ± %
Punctuality (%) 72.8 72.7 – –Customer satisfaction (SI) 60 67 – –Total revenues (€ million) 4,460 4,528 – 68 –1.5 thereof external revenues 4,177 4,209 –32 – 0.8EBIT adjusted (€ million) –190 – 90 –100 +111EBIT margin (adjusted) (%) – 4.3 –2.0 – –EBITDA adjusted (€ million) 54 130 –76 – 58.5Gross capital expenditures (€ million) 587 328 +259 +79.0Employees as of Dec 31 (FTE) 28,842 28,257 + 585 +2.1Employee satisfaction (SI) 3.5 – – –Share of women in Germany as of Dec 31 (%) 11.3 10.6 – –Health rate in Germany (%) 92.6 92.7 – –Specific end-energy consumption compared to 2006 (related to tkm) (%) –20.4 –17.1 – –Quiet freight cars in Germany as of Dec 31 50,409 39,604 +10,805 +27.3PER FOR MAN CE FIGUR E S
Freight carried (million t) 255.5 271.0 –15.5 – 5.7 thereof German companies 200.4 208.2 –7.8 –3.7Volume sold (million tkm) 88,237 92,651 – 4,414 – 4.8 thereof German companies 64,169 67,566 –3,397 – 5.0Volume produced (million train-path km) 165.8 175.6 – 9.8 – 5.6Trains per day 2,873 3,133 –260 – 8.3Mean transport distance (km) 345.4 341.9 + 3.5 +1.0Capacity utilization (t per train) 532.3 527.5 + 4.8 + 0.9ROLLING STO CK
Locomotives 2,686 2,758 –72 –2.6 Electric locomotives 1,265 1,290 –25 –1.9 Diesel locomotives 1,421 1,468 – 47 –3.2Freight cars 82,895 83,386 – 491 – 0.6 thereof with whisper brakes 61,304 46,610 +14,694 + 31.5 DB stock 73,939 74,470 – 531 – 0.7 Covered wagons 14,265 14,897 – 632 – 4.2 Open wagons 23,522 23,285 +237 +1.0 Flat wagons 35,720 35,841 –121 – 0.3 Tank wagons 432 447 –15 –3.4 Leased wagons 1,184 1,834 – 650 –35.4 Rented from third parties 9,544 8,626 + 918 +10.6 Rented to third parties (–) 1,772 1,544 +228 +14.8
Deutsche Bahn Group Facts&Figures 2018
24

2018 2017 ± absolute ± %
Transport capacity of freight cars (thousand t) 5,220 5,179 + 41 + 0.8 DB stock 4,643 4,616 +27 + 0.6 Covered wagons 717 743 –26 –3.5 Open wagons 1,454 1,420 + 34 +2.4 Flat wagons 2,468 2,440 +28 +1.1 Tank wagons 4 13 – 9 – 69.2 Leased wagons 84 134 – 50 –37.3 Rented from third parties 572 511 + 61 +11.9 Rented to third parties (–) 79 82 –3 –3.7
DB Schenker
2018 2017 ± absolute ± %
Customer satisfaction (SI) 71 74 – –Total revenues (€ million) 17,050 16,430 + 620 + 3.8 thereof external revenues 16,973 16,345 + 628 + 3.8 thereof land transport 7,092 6,608 + 484 +7.3 thereof air freight 3,804 3,530 +274 +7.8 thereof ocean freight 2,930 2,973 –13 – 0.4 thereof contract logistics 2,622 2,634 –12 – 0.5Gross profit margin (%) 34.8 34.3 – –EBIT adjusted (€ million) 503 477 +26 + 5.5EBIT margin (adjusted) (%) 3.0 2.9 – –EBITDA adjusted (€ million) 703 676 +27 + 4.0Gross capital expenditures (€ million) 273 246 +27 +11.0Employees as of Dec 31 (FTE) 75,817 71,888 + 3,929 + 5.5Employee satisfaction (SI) 3.8 – – –Share of women in Germany as of Dec 31 (%) 29.5 30.8 – –Health rate in Germany (%) 93.4 93.3 – –Specific greenhouse gas emissions (land transport) compared to 2006 (related to tkm) (%) –25.8 –20.2 – –Specific greenhouse gas emissions (air freight) compared to 2006 (related to tkm) (%) – 9.3 – 8.8 – –Specific greenhouse gas emissions (ocean freight) compared to 2006 (related to tkm) (%) – 61.2 – 60.7 – –PER FOR MAN CE FIGUR E S
Shipments in land transport (thousand) 106,468 100,452 + 6,016 + 6.0Air freight volume (export) (thousand t) 1,304 1,300 + 4 + 0.3Ocean freight volume (export) (thousand TEU) 2,203 2,169 + 34 +1.6Warehouse space contract logistics (million m²) 8.3 8.0 + 0.3 + 3.8
FIGURES bY bUSInESS UnItS
25

DB Netze Track
2018 2017 ± absolute ± %
Punctuality DB Group (rail) in Germany (%) 93.4 93.9 – –
Punctuality (rail) in Germany 1) (%) 92.9 93.6 – –
Customer satisfaction (SI) 64 67 – –
Total revenues (€ million) 5,511 5,364 +147 +2.7
thereof external revenues 1,559 1,522 + 37 +2.4
Share of external revenues (%) 28.3 28.4 – –
EBIT adjusted (€ million) 840 687 +153 +22.3
EBITDA adjusted (€ million) 1,446 1,484 –38 –2.6
ROCE (%) 4.6 3.8 – –
Capital employed as of Dec 31 (€ million) 18,172 17,866 + 306 +1.7
Net financial debt as of Dec 31 (€ million) 9,499 9,386 +113 +1.2
Redemption coverage (%) 13.9 14.0 – –
Gross capital expenditures (€ million) 6,901 6,601 + 300 + 4.5
Net capital expenditures (€ million) 564 660 – 96 –14.5
Employees as of Dec 31 (FTE) 46,969 45,375 +1,594 + 3.5
Employee satisfaction (SI) 3.7 – – –
Share of women as of Dec 31 (%) 19.2 18.8 – –
Health rate (%) 94.3 94.5 – –
Track kilometers noise remediated in total as of Dec 31 (km) 1,758 1,701 + 57 + 3.4
PER FOR MAN CE FIGUR E S
Volume produced (million train-path km) 1,086 1,073 +13 +1.2
thereof non-Group railways 349.3 331.4 +17.9 + 5.4
thereof DB Netze Track 1,084 1,072 +12 +1.1
1) Non-Group and DB Group train operating companies.
Deutsche Bahn Group Facts&Figures 2018
26

2018 2017 ± absolute ± %
INFR A STRU C TUR E 1)
Length of line operated (km) 33,440 33,488 – 48 – 0.1
thereof electrified 20,286 20,232 + 54 + 0.3
thereof DB Netze Track 33,299 33,348 – 49 – 0.1
Standard gauge 33,293 33,342 – 49 – 0.1
Other gauges 6 6 – –
Length of all track (km) 61,059 60,921 +138 + 0.2
thereof DB Netze Track 60,803 60,653 +150 + 0.2
Switches and crossings 66,280 66,591 –311 – 0.5
thereof DB Netze Track 65,844 66,110 –266 – 0.4
Interlockings 2,641 2,751 –110 – 4.0
thereof DB Netze Track 2,636 2,746 –110 – 4.0
Mechanical 668 716 – 48 – 6.7
Electromechanical 298 307 – 9 –2.9
Relay interlockings/interlockings with push button routing 1,239 1,275 –36 –2.8
Electronic 375 390 –15 –3.8
Other 61 63 –2 –3.2
Level crossings 13,813 13,900 – 87 – 0.6
thereof technically protected 9,736 9,723 +13 + 0.1
thereof DB Netze Track 13,712 13,800 – 88 – 0.6
thereof technically protected 9,676 9,663 +13 + 0.1
Noise protection walls (km) 1,838 1,747 + 91 + 5.2
Tunnels 739 741 –2 – 0.3
Subterranean 589 591 –2 – 0.3
Above ground 150 150 – –
Total length of tunnels (km) 590.7 591.9 –1.2 – 0.2
Length of longest tunnel (m) 10,779 10,779 – –
Railway bridges 25,147 25,156 – 9 –
thereof DB Netze Track 25,127 25,136 – 9 –
Infrastructure sidings 2,351 2,367 –16 – 0.7
1) Including Infra Silesia S.A., Rybnik/Poland, and UBB Usedomer Bäderbahn GmbH.
FIGURES bY bUSInESS UnItS
27

DB Netze Stations
2018 2017 ± absolute ± %
Facilities quality (grade) 1) 2.88 2.89 – –Customer satisfaction traffic stations(passengers/visitors) (SI) 68 69 – –Customer satisfaction traffic stations(TOCs and transport authorities) (SI) 61 62 – –Customer satisfaction tenants (SI) 76 78 – –Total revenues (€ million) 1,314 1,265 + 49 + 3.9 thereof external revenues 569 540 +29 + 5.4 thereof rental and lease revenues 391 384 +7 +1.8EBIT adjusted (€ million) 221 233 –12 – 5.2EBITDA adjusted (€ million) 362 372 –10 –2.7ROCE (%) 8.0 8.4 – –Capital employed as of Dec 31 (€ million) 2,758 2,766 – 8 – 0.3Net financial debt as of Dec 31 (€ million) 1,260 1,268 – 8 – 0.6Redemption coverage (%) 22.7 23.0 – –Gross capital expenditures (€ million) 883 709 +174 +24.5Net capital expenditures (€ million) 164 103 + 61 + 59.2Employees as of Dec 31 (FTE) 5,804 5,463 + 341 + 6.2Employee satisfaction (SI) 3.7 – – –Share of women as of Dec 31 (%) 45.2 46.2 – –Health rate (%) 93.2 93.4 – –Absolute primary energy consump-tion (stations) compared to 2010 (%) –20.5 –17.1 – –PER FOR MAN CE FIGUR E S
Station stops (million) 154.1 153.2 + 0.9 + 0.6 thereof non-Group railways 37.0 36.1 + 0.9 +2.5 DB Netze Stations 150.9 150.0 + 0.9 + 0.6 Other 2) 3.2 3.2 – –INFR A STRU C TUR E
Passenger stations 5,663 5,660 + 3 + 0.1 DB Netze Stations 5,368 5,365 + 3 + 0.1 Other 2) 295 295 – –
1) Preliminary figure.2) DB RegioNetz Infrastruktur GmbH and UBB Usedomer Bäderbahn GmbH.
Deutsche Bahn Group Facts&Figures 2018
28

DB Netze Energy
2018 2017 ± absolute ± %
Supply reliability 1) (%) 99.99 99.99 – –Customer satisfaction 2) (SI) 78 – – – Traction current and diesel 2) (SI) 75 – – – Electricity and gas plus (Group customers) 2) (SI) 79 – – – Electricity and gas plus (non-Group customers) 2) (SI) 81 – – –Total revenues (€ million) 2,850 2,794 + 56 +2.0 thereof external revenues 1,350 1,301 + 49 + 3.8EBIT adjusted (€ million) 21 72 – 51 –70.8EBITDA adjusted (€ million) 87 141 – 54 –38.3ROCE (%) 2.0 6.7 – –Capital employed as of Dec 31 (€ million) 1,053 1,081 –28 –2.6Net financial debt as of Dec 31 (€ million) 623 630 –7 –1.1Redemption coverage (%) 9.8 17.7 – –Gross capital expenditures (€ million) 187 177 +10 + 5.6Net capital expenditures (€ million) 65 53 +12 +22.6Employees as of Dec 31 (FTE) 1,734 1,721 +13 + 0.8Employee satisfaction (SI) 3.8 – – –Share of women as of Dec 31 (%) 13.8 13.5 – –Health rate (%) 95.7 95.6 – –Share of renewable energies in the DB traction current mix (%) 57.2 44.0 – –PER FOR MAN CE FIGUR E S
Traction current(16.7 Hz and direct current) (GWh) 8,245 8,284 –39 – 0.5Traction current pass-through (16.7 Hz) (GWh) 1,576 1,906 –330 –17.3Stationary energy(50 Hz and 16.7 Hz) (GWh) 18,196 19,331 –1,135 – 5.9Diesel fuel (million ) 429.6 436.1 – 6.5 –1.5INFR A STRU C TUR E
Traction current grid (km) 7,936 7,936 – –Power, converter andtransformer stations 51 51 – –Transformer substations 187 187 – –Rectifiers 116 116 – –Gas stations 197 189 + 8 + 4.2Mean voltage networks withtransformer stations 183 187 – 4 –2.1Train preheating plants 197 210 –13 – 6.2
1) Preliminary figures (not rounded). 2) No survey in 2017.
FIGURES bY bUSInESS UnItS
29

10-year summaries Rail performance figures
2018 2017 2016 2015 2014 2013 2012 2011 2010 2009
PA S SENGER TR AN SP ORT
Passengers (million) 2,581 2,564 2,365 2,251 2,254 2,235 2,152 1,981 1,950 1,908 DB Long-Distance 148 142 139 132 129 131 131 125 126 123 Regional transport
(DB Regional and other) 1,940 1,934 1,883 1,883 1,902 1,885 1,844 1,801 1,824 1,785 Regional transport
(DB Arriva) 494 488 343 236 223 219 178 55 – –Volume sold (million pkm) 97,707 95,854 91,651 88,636 88,407 88,746 88,433 79,228 78,582 76,772 DB Long-Distance 42,827 40,548 39,516 36,975 36,102 36,777 37,357 35,565 36,026 34,708 Regional transport
(DB Regional and other) 41,880 41,972 40,905 42,681 43,667 43,660 43,448 42,404 42,556 42,064 Regional transport
(DB Arriva) 12,999 13,334 11,230 8,980 8,638 8,309 7,628 1,259 – –FR EIGHT TR AN SP ORT
Freight carried (million t) 255.5 271.0 277.4 300.2 329.1 390.1 398.7 411.6 415.4 341.0Volume sold (million tkm) 88,237 92,651 94,698 98,445 102,871 104,259 105,894 111,980 105,794 93,948INFR A STRU C TUR E
Train kilometers on track infrastructure (million train-path km) 1,086 1,073 1,068 1,054 1,044 1,035 1,039 1,051 1,034 1,003 thereof non-Group
railways 349 331 322 290 261 247 231 220 195 170
Employees
(FTE) 2018 2017 2016 2015 2014 2013 2012 2011 2010 2009
Average 316,486 308,671 302,204 297,170 296,094 293,765 286,237 282,260 251,810 239,888As of Dec 31 318,528 310,935 306,368 297,202 295,763 295,653 287,508 284,319 276,310 239,382
Deutsche Bahn Group Facts&Figures 2018
30

Rail performance figures
2018 2017 2016 2015 2014 2013 2012 2011 2010 2009
PA S SENGER TR AN SP ORT
Passengers (million) 2,581 2,564 2,365 2,251 2,254 2,235 2,152 1,981 1,950 1,908 DB Long-Distance 148 142 139 132 129 131 131 125 126 123 Regional transport
(DB Regional and other) 1,940 1,934 1,883 1,883 1,902 1,885 1,844 1,801 1,824 1,785 Regional transport
(DB Arriva) 494 488 343 236 223 219 178 55 – –Volume sold (million pkm) 97,707 95,854 91,651 88,636 88,407 88,746 88,433 79,228 78,582 76,772 DB Long-Distance 42,827 40,548 39,516 36,975 36,102 36,777 37,357 35,565 36,026 34,708 Regional transport
(DB Regional and other) 41,880 41,972 40,905 42,681 43,667 43,660 43,448 42,404 42,556 42,064 Regional transport
(DB Arriva) 12,999 13,334 11,230 8,980 8,638 8,309 7,628 1,259 – –FR EIGHT TR AN SP ORT
Freight carried (million t) 255.5 271.0 277.4 300.2 329.1 390.1 398.7 411.6 415.4 341.0Volume sold (million tkm) 88,237 92,651 94,698 98,445 102,871 104,259 105,894 111,980 105,794 93,948INFR A STRU C TUR E
Train kilometers on track infrastructure (million train-path km) 1,086 1,073 1,068 1,054 1,044 1,035 1,039 1,051 1,034 1,003 thereof non-Group
railways 349 331 322 290 261 247 231 220 195 170
Employees
(FTE) 2018 2017 2016 2015 2014 2013 2012 2011 2010 2009
Average 316,486 308,671 302,204 297,170 296,094 293,765 286,237 282,260 251,810 239,888As of Dec 31 318,528 310,935 306,368 297,202 295,763 295,653 287,508 284,319 276,310 239,382
10 -Year summaries
31

Statement of income
(€ million) 2018 2017 2016 2015 2014 2013 2012 2011 2010 2009
Revenues 44,065 42,693 40,557 40,403 39,728 39,107 39,296 37,979 34,410 29,335Inventory changes and internally produced and capitalized assets 3,091 2,900 2,741 2,699 2,694 2,649 2,614 2,457 2,207 1,936
Overall performance 47,156 45,593 43,298 43,102 42,422 41,756 41,910 40,436 36,617 31,271
Other operating income 2,998 2,954 2,834 2,772 2,824 2,853 3,443 3,062 3,120 3,864Cost of materials –22,258 –21,457 –20,101 –20,208 –20,250 –20,414 –20,960 –20,906 –19,314 –15,627Personnel expenses –17,301 –16,665 –15,876 –15,599 –14,919 –14,383 –13,817 –13,076 –11,602 –11,115Depreciation –2,688 –2,847 –3,017 – 4,471 –3,190 –3,228 –3,328 –2,964 –2,912 –2,825Other operating expenses – 6,088 – 5,890 – 5,677 – 5,750 – 5,057 – 4,817 – 4,719 – 4,375 – 4,092 –3,360
Operating profit (EBIT) 1,819 1,688 1,461 –154 1,830 1,767 2,529 2,177 1,817 2,208
Result from investments accounted for using the equity method 12 14 33 22 8 3 14 19 17 9Net interest income – 645 –704 –772 – 800 – 898 – 879 –1,005 – 840 – 911 – 826Other financial result –14 –30 –16 0 –3 –15 –13 3 –23 – 4
Financial result – 647 –720 –755 –778 – 893 – 891 –1,004 – 818 – 917 – 821
Profit before taxes on income 1,172 968 706 – 932 937 876 1,525 1,359 900 1,387
Taxes on income – 630 –203 10 –379 51 –227 – 66 –27 158 – 557
Net profit for the year 542 765 716 –1,311 988 649 1,459 1,332 1,058 830Dividend payment (for previous year) 450 600 850 700 200 525 525 500 – –
Operating profit figures/value management
(€ million) 2018 2017 2016 2015 2014 2013 2012 2011 2010 2009
EBITDA adjusted 4,739 4,930 4,797 4,778 5,110 5,139 5,601 5,141 4,651 4,402EBIT adjusted 2,111 2,152 1,946 1,759 2,109 2,236 2,708 2,309 1,866 1,685Capital employed as of Dec 31 36,657 35,093 33,066 33,459 33,683 33,086 32,642 31,732 31,312 28,596Return on capital employed (ROCE) (%) 5.8 6.1 5.9 5.3 6.3 6.8 8.3 7.3 6.0 5.9Redemption coverage (%) 17.6 18.7 18.1 19.0 20.3 20.8 22.2 22.0 18.8 20.4Gearing (%) 144 131 139 130 112 110 109 110 118 115Net debt/EBITDA (multiple) 4.8 4.5 4.6 4.3 4.0 3.9 3.7 3.8 4.3 4.0
Deutsche Bahn Group Facts&Figures 2018
32

Statement of income
(€ million) 2018 2017 2016 2015 2014 2013 2012 2011 2010 2009
Revenues 44,065 42,693 40,557 40,403 39,728 39,107 39,296 37,979 34,410 29,335Inventory changes and internally produced and capitalized assets 3,091 2,900 2,741 2,699 2,694 2,649 2,614 2,457 2,207 1,936
Overall performance 47,156 45,593 43,298 43,102 42,422 41,756 41,910 40,436 36,617 31,271
Other operating income 2,998 2,954 2,834 2,772 2,824 2,853 3,443 3,062 3,120 3,864Cost of materials –22,258 –21,457 –20,101 –20,208 –20,250 –20,414 –20,960 –20,906 –19,314 –15,627Personnel expenses –17,301 –16,665 –15,876 –15,599 –14,919 –14,383 –13,817 –13,076 –11,602 –11,115Depreciation –2,688 –2,847 –3,017 – 4,471 –3,190 –3,228 –3,328 –2,964 –2,912 –2,825Other operating expenses – 6,088 – 5,890 – 5,677 – 5,750 – 5,057 – 4,817 – 4,719 – 4,375 – 4,092 –3,360
Operating profit (EBIT) 1,819 1,688 1,461 –154 1,830 1,767 2,529 2,177 1,817 2,208
Result from investments accounted for using the equity method 12 14 33 22 8 3 14 19 17 9Net interest income – 645 –704 –772 – 800 – 898 – 879 –1,005 – 840 – 911 – 826Other financial result –14 –30 –16 0 –3 –15 –13 3 –23 – 4
Financial result – 647 –720 –755 –778 – 893 – 891 –1,004 – 818 – 917 – 821
Profit before taxes on income 1,172 968 706 – 932 937 876 1,525 1,359 900 1,387
Taxes on income – 630 –203 10 –379 51 –227 – 66 –27 158 – 557
Net profit for the year 542 765 716 –1,311 988 649 1,459 1,332 1,058 830Dividend payment (for previous year) 450 600 850 700 200 525 525 500 – –
Operating profit figures/value management
(€ million) 2018 2017 2016 2015 2014 2013 2012 2011 2010 2009
EBITDA adjusted 4,739 4,930 4,797 4,778 5,110 5,139 5,601 5,141 4,651 4,402EBIT adjusted 2,111 2,152 1,946 1,759 2,109 2,236 2,708 2,309 1,866 1,685Capital employed as of Dec 31 36,657 35,093 33,066 33,459 33,683 33,086 32,642 31,732 31,312 28,596Return on capital employed (ROCE) (%) 5.8 6.1 5.9 5.3 6.3 6.8 8.3 7.3 6.0 5.9Redemption coverage (%) 17.6 18.7 18.1 19.0 20.3 20.8 22.2 22.0 18.8 20.4Gearing (%) 144 131 139 130 112 110 109 110 118 115Net debt/EBITDA (multiple) 4.8 4.5 4.6 4.3 4.0 3.9 3.7 3.8 4.3 4.0
10 -Year summaries
33

Cash flow/capital expenditures
(€ million) 2018 2017 2016 2015 2014 2013 2012 2011 2010 2009
Cash flow from operating activities 3,371 2,329 3,648 3,489 3,896 3,730 4,094 3,390 3,409 3,133Gross capital expenditures 11,205 10,464 9,510 9,344 9,129 8,224 8,053 7,501 6,891 6,462Net capital expenditures 3,996 3,740 3,320 3,866 4,442 3,412 3,487 2,569 2,072 1,813
Balance sheet
As of Dec 31 (€ million) 2018 2017 2016 2015 2014 2013 2012 2011 2010 2009
Non-current assets 46,646 45,625 45,290 45,199 45,530 43,949 44,241 44,059 44,530 41,308 thereof property,
plant and equipment and intangible assets 44,487 43,207 42,575 42,821 43,217 41,811 41,816 41,541 42,027 39,509
thereof deferred tax assets 1,032 1,416 1,511 1,335 1,604 1,404 1,548 1,461 1,471 1,173
Current assets 11,881 10,811 11,034 10,860 10,353 8,945 8,284 7,732 7,473 5,995 thereof cash and cash equivalents 3,544 3,397 4,450 4,549 4,031 2,861 2,175 1,703 1,475 1,470Equity 13,592 14,238 12,657 13,445 14,525 14,912 14,978 15,126 14,316 13,066 Equity ratio (%) 23.2 25.2 22.5 24.0 26.0 28.2 28.5 29.2 27.5 27.6Non-current liabilities 29,104 27,510 28,525 28,091 28,527 26,284 25,599 24,238 24,762 23,359 thereof financial debt 20,626 19,716 20,042 19,753 19,173 18,066 17,110 16,367 16,394 14,730 thereof retirement
benefit obligations 4,823 3,940 4,522 3,688 4,357 3,164 3,074 1,981 1,938 1,736Current liabilities 15,831 14,688 15,142 14,523 12,831 11,698 11,948 12,427 12,925 10,878 thereof financial debt 2,618 2,360 2,439 2,675 1,161 1,247 1,503 1,984 2,159 1,780Net financial debt 19,549 18,623 17,624 17,491 16,212 16,362 16,366 16,592 16,939 15,011Total assets 58,527 56,436 56,324 56,059 55,883 52,894 52,525 51,791 52,003 47,303
Deutsche Bahn Group Facts&Figures 2018
34

Cash flow/capital expenditures
(€ million) 2018 2017 2016 2015 2014 2013 2012 2011 2010 2009
Cash flow from operating activities 3,371 2,329 3,648 3,489 3,896 3,730 4,094 3,390 3,409 3,133Gross capital expenditures 11,205 10,464 9,510 9,344 9,129 8,224 8,053 7,501 6,891 6,462Net capital expenditures 3,996 3,740 3,320 3,866 4,442 3,412 3,487 2,569 2,072 1,813
Balance sheet
As of Dec 31 (€ million) 2018 2017 2016 2015 2014 2013 2012 2011 2010 2009
Non-current assets 46,646 45,625 45,290 45,199 45,530 43,949 44,241 44,059 44,530 41,308 thereof property,
plant and equipment and intangible assets 44,487 43,207 42,575 42,821 43,217 41,811 41,816 41,541 42,027 39,509
thereof deferred tax assets 1,032 1,416 1,511 1,335 1,604 1,404 1,548 1,461 1,471 1,173
Current assets 11,881 10,811 11,034 10,860 10,353 8,945 8,284 7,732 7,473 5,995 thereof cash and cash equivalents 3,544 3,397 4,450 4,549 4,031 2,861 2,175 1,703 1,475 1,470Equity 13,592 14,238 12,657 13,445 14,525 14,912 14,978 15,126 14,316 13,066 Equity ratio (%) 23.2 25.2 22.5 24.0 26.0 28.2 28.5 29.2 27.5 27.6Non-current liabilities 29,104 27,510 28,525 28,091 28,527 26,284 25,599 24,238 24,762 23,359 thereof financial debt 20,626 19,716 20,042 19,753 19,173 18,066 17,110 16,367 16,394 14,730 thereof retirement
benefit obligations 4,823 3,940 4,522 3,688 4,357 3,164 3,074 1,981 1,938 1,736Current liabilities 15,831 14,688 15,142 14,523 12,831 11,698 11,948 12,427 12,925 10,878 thereof financial debt 2,618 2,360 2,439 2,675 1,161 1,247 1,503 1,984 2,159 1,780Net financial debt 19,549 18,623 17,624 17,491 16,212 16,362 16,366 16,592 16,939 15,011Total assets 58,527 56,436 56,324 56,059 55,883 52,894 52,525 51,791 52,003 47,303
10 -Year summaries
35

DB2020+ top targets
Economic 2018 2017 2016 2015 2014 2013 2012
Customer satisfaction passengers (SI 1)) 75.1 75.8 76.0 76.4 76.1 75.1 –Customer satisfaction freight transport and logistics 2) (SI 1)) 65.1 70.5 – 67.5 – 68.5 –Product quality – punctuality DB Group (rail) in Germany (%) 93.4 93.9 94.3 93.6 94.3 94.0 94.4Reasonable rate of return – ROCE (%) 5.8 6.1 5.9 5.3 6.3 6.8 8.3Financial stability – redemption coverage (%) 17.6 18.7 18.1 19.0 20.3 20.8 22.2
1) Satisfaction index.2) Survey annually from 2017 onwards.
Social 2018 2017 2016 2015 2014 2013 2012
Employee satisfaction 1) (SI 2)) 3.7 – 3.7 – 3.7 – 3.6Employee satisfaction – follow-up workshop implementation rate DB Group 1) (%) – 97.1 – 96.7 – 97.9 –Employer attractiveness (rank in Germany) 13 13 16 20 11 21 26
1) The employee survey is conducted every two years. When no survey has been conducted the key figure “Follow-up workshop implementation rate” is used.
2) Satisfaction index.
Environmental 2018 2017 2016 2015 2014 2013 2012
Climate protection – specific greenhouse gas emissions compared to 2006 (%) –33.2 –29.5 –27.3 –24.5 –22.8 –18.6 –12.0Climate protection – share of renewable energies in the DB traction current mix 1) (%) 57.2 44.0 42.0 42.0 39.6 35.2 24.0Noise reduction – quiet freight cars in Germany as of Dec 31 50,409 39,604 32,396 20,460 14,334 8,408 7,349Noise reduction – track kilometers noise remediated in total as of Dec 31 (km) 1,758 1,701 1,598 – – – –
1) Until 2016 data include energy purchase of third parties. From 2017 on data relate exclusively to DB Group companies.
Deutsche Bahn Group Facts&Figures 2018
36

robert allen strehlHead of Investor RelationsTel. + 49-30-2 97-6 40 30robert.strehl @ deutschebahn.com
sascha FriedrichSenior Manager Investor RelationsTel. + 49-30-2 97-6 40 32sascha.friedrich @ deutschebahn.com
Friederike ThyssenManager Investor RelationsTel. + 49-30-2 97-6 40 33friederike.thyssen @ deutschebahn.com
Larissa Wandert ribeiroManager Investor RelationsTel. + 49-30-2 97-6 41 35larissa.wandert-ribeiro @ deutschebahn.com
Johanna FreundJunior Manager Investor RelationsTel. + 49-30-2 97-6 43 89johanna.f.freund @ deutschebahn.com
Deutsche Bahn aGInvestor RelationsEuropaplatz 110557 Berlin, GermanyTel. + 49-30-2 97-6 40 31Fax + 49-69-2 65-2 01 10ir @ deutschebahn.comŒdb.de/ir-e
Contact informationInvestor Relations
From left to right: Friederike Thyssen, Larissa Wandert Ribeiro, Robert Allen Strehl, Sascha Friedrich, Johanna Freund
10 -Year summaries | ConTaCT inFormaTion
37

Communications
oliver schumacherHead of Communications and MarketingTel. +49-30-2 97-6 14 80oliver.schumacher @ deutschebahn.com
Dagmar KaiserHead of Corporate Press Office/Newsroom and Issues Manage-ment, Head of Communications Human ResourcesTel. +49-30-2 97-6 11 96dagmar.d.kaiser @ deutschebahn.com
andrea BrandtHead of Communications Freight Transport and Logistics/Communications Finance Tel. +49-2 01-87 81-85 56andrea.brandt @ deutschebahn.com
Jürgen KornmannHead of Communications Passenger TransportTel. +49-30-2 97-6 00 10juergen.kornmann @ deutschebahn.com
24/7 Central Press servicePotsdamer Platz 210785 Berlin, GermanyTel. +49-30-2 97-6 10 30presse @ deutschebahn.comŒdeutschebahn.com/en/presse
sonja stötzelHead of Communications Digitalization and TechnologyTel. +49-30-2 97-5 97 80sonja.stoetzel @ deutschebahn.com
Jens-oliver VoßHead of Communications Economy, Legal and Regulatory AffairsTel. +49-30-2 97-6 10 30jens-oliver.voss @ deutschebahn.com
martin WaldenHead of Communications InfrastructureTel. +49-30-2 97-6 27 20martin.walden @ deutschebahn.com
Deutsche Bahn Group Facts&Figures 2018
38

Management representatives for the Federal states
Baden-Württemberg Thorsten Krenz Presselstraße 17 70191 Stuttgart, GermanyTel. +49-7 11-20 92-33 00Fax +49-7 11-20 92-36 00
BavariaKlaus-Dieter JoselRichelstraße 3 80634 Munich, GermanyTel. +49- 89-13 08-33 00Fax +49- 69-2 65-5 90 59
Berlinalexander KaczmarekPotsdamer Platz 2 10785 Berlin, GermanyTel. +49-30-2 97-6 10 10Fax +49-30-2 97-6 19 11
BrandenburgDr.-ing. Joachim TrettinBabelsberger Straße 18 14473 Potsdam, GermanyTel. +49-3 31.2 35-68 00Fax +49-3 31.2 35-68 19
Hamburg, schleswig-Holsteinmanuela HerbortHammerbrookstraße 4420097 Hamburg, GermanyTel. +49-40-39 18-30 00Fax +49-40-39 18-30 06
HesseDr. Klaus VornhusenWeilburger Straße 2260326 Frankfurt am Main, GermanyTel. +49-69-2 65-2 47 00Fax +49-69-2 65-2 47 09
Lower saxony, Bremenmanuela HerbortJoachimstraße 830159 Hanover, GermanyTel. +49-5 11-2 86-33 00Fax +49- 69-2 65-5 57 21
mecklenburg- West PomeraniaDr.-ing. Joachim TrettinGrunthalplatz 4 19053 Schwerin, GermanyTel. +49-3 85-7 50-33 00Fax +49- 69-265-4 98 62
north rhine-WestphaliaWerner LübberinkWilli-Becker-Allee 1140227 Düsseldorf, GermanyTel. +49-2 11-36 80-20 00Fax +49-2 11-36 80-20 50
rhineland-Palatinate, saarlandDr. Klaus VornhusenAm Hauptbahnhof 466111 Saarbrücken, GermanyTel. +49-6 81-3 08-33 00Fax +49- 69-2 65-5 57 17
saxony, saxony-anhalt, Thuringiaeckart FrickeRichard-Wagner-Straße 304109 Leipzig, GermanyTel. +49-3 41-9 68-33 00Fax +49- 69-2 65-5 90 64
ConTaCT inFormaTion
39

Service numbers
DB service number+ 49-1 80-6 99 66 33 — Our service number gives you direct access to all of our telephone services. These services include general information, booking of train tickets, find ing train times, our cus-tomer dialogue and our frequent traveler sys tem (BahnCard). The following charges apply: calls from the German fixed-line network cost 20 ct/call. Calls from the German cell phone network cost 60 ct/call at most. Leisure and business travelers can find further contact infor-mation online.
Passenger transport on social mediaOur passenger transport is available on various social media channels for con versations, discussions, and for service and product questions. You can find us on Facebook, Instagram, Twitter and YouTube.
automatic train schedule information+49-8 00-1 50 70 90 — Free train schedule information is avail able 24 hours a day to callers using the German fixed-line network. Information is provided by our voice dialogue system. Actual information is also available at Œbahn.de/abfahrts-
tafel.
Deutsche Bahn Group Facts&Figures 2018
40

Financial calendarJuly 25, 2019 Interim Results Press Conference, publication of the Interim Report January – June 2019
March 19, 2020 Annual Results Press Conference, publication of the 2019 Integrated Report
ImprintConcept, editing: Deutsche Bahn AG, Investor Relations, BerlinDesign concept, typesetting: Studio Delhi, MainzProofreading: AdverTEXT, DüsseldorfLithography: Koch Prepress GmbH, Wies ba denPrinting: W. Kohlhammer Druckerei GmbH + Co. KG, StuttgartPhotography: µCover page Max Lautenschläger µ2 Max Lautenschläger µ37 Max Lautenschläger
Editorial deadline: March 14, 2019
2018 Integrated Report online Œdb.de/ib-e
Investor Relations Œdb.de/ir-e

Deutsche Bahn AGPotsdamer Platz 2
10785 BerlinGermany
www.deutschebahn.com/en