Embed Size (px)
Citation preview


Kate Edwards
Executive Director
International Game Developers Association
Johanna Weststar
Assistant Professor, Department of Management and Organizational Studies
Western University, Ontario, Canada
Wanda Meloni
CEO & Senior Analyst
M2 Research
Celia Pearce
Associate Professor of Digital Media
Georgia Institute of Technology
Marie-Josée Legault
Professor, École des sciences de l'administration
TÉLUQ, Québec, Canada
Cat Wendt
The International Game Developers Association (IGDA) would like to thank the tremendous
support of our actively engaged volunteer community for their many contributions to this report.
From all the survey respondents to our many Chapter and Special Interest Group leaders who
helped disseminate the survey, as well as our studio affiliates and media partners – we appreciate
your help in making this research possible.
Authors ............................................................................................................................................ 1
Graphic Design ............................................................................................................................... 1
Acknowledgements ......................................................................................................................... 1
Introduction ..................................................................................................................................... 5
Demographics ................................................................................................................................. 7
Snapshot: Age ............................................................................................................................. 7
Snapshot: Country of Origin ....................................................................................................... 7
Snapshot: Marital Status.............................................................................................................. 7
Snapshot: Children ...................................................................................................................... 7
Snapshot: Elderly Care ................................................................................................................ 7
Diversity .......................................................................................................................................... 9
Snapshot: Gender ........................................................................................................................ 9
Snapshot: Race and Ethnicity ...................................................................................................... 9
Snapshot: Sexual Orientation ...................................................................................................... 9
Snapshot: Disabilities .................................................................................................................. 9
Snapshot: Attitudes toward Diversity ....................................................................................... 10
Snapshot: Discrimination .......................................................................................................... 10
Education ...................................................................................................................................... 14
Snapshot: Educational Background .......................................................................................... 14
Snapshot: Specialized Degree in a Game Related Discipline ................................................... 14
Snapshot: Students .................................................................................................................... 15
Employment Profile ...................................................................................................................... 17
Snapshot: Job Roles and Discipline .......................................................................................... 17
Snapshot: Job Tenure and Experience ...................................................................................... 17
Snapshot: Reasons for Joining/Leaving the Industry ................................................................ 17
Snapshot: Worker Commitment to the Industry ....................................................................... 18
Snapshot: Mobility .................................................................................................................... 18
Employment Status ....................................................................................................................... 19
Snapshot: Employment Status ................................................................................................... 19
Snapshot: Types of Contracts – Reality versus Preference ....................................................... 19
Snapshot: Number of Employers .............................................................................................. 19
Snapshot: The Unemployed ...................................................................................................... 19
Snapshot: Why Freelance or Self-Employed? .......................................................................... 20
Hours of Work .............................................................................................................................. 21
Snapshot: Regular versus Crunch Hours ................................................................................... 21
More on Crunch ........................................................................................................................ 21
Snapshot: Necessity of Crunch ................................................................................................. 22
Snapshot: Top Reasons for Crunch ........................................................................................... 22
Compensation ............................................................................................................................... 23
Snapshot: Total Income ............................................................................................................. 23
Snapshot: Raises and Incentives ............................................................................................... 24
Snapshot: Satisfaction with Compensation ............................................................................... 24
Snapshot: Health Coverage ....................................................................................................... 25
Snapshot: Retirement Savings ................................................................................................... 25
Snapshot: Pregnancy and Parental Leave.................................................................................. 25
Snapshot: Time-Off ................................................................................................................... 26
Career Direction and Advancement .............................................................................................. 27
Snapshot: Performance Reviews ............................................................................................... 27
Snapshot: Career Progression ................................................................................................... 27

Snapshot: Job Security .............................................................................................................. 27
Workplace Overview .................................................................................................................... 29
Snapshot: Country of Work....................................................................................................... 29
Snapshot: Type of Business ...................................................................................................... 29
Snapshot: Company Size ........................................................................................................... 29
Snapshot: Growth Rates ............................................................................................................ 30
Snapshot: Development Teams ................................................................................................. 30
Snapshot: Game Platforms ........................................................................................................ 30
Employment Relations .................................................................................................................. 31
Snapshot: Legal Protections ...................................................................................................... 31
Snapshot: Employee Voice ....................................................................................................... 31
Snapshot: Unionization ............................................................................................................. 31
Future Outlook .............................................................................................................................. 33
Snapshot: Important Platforms for the Future ........................................................................... 33
Snapshot: Preferred Type of Company/Studio to Work For ..................................................... 33
Snapshot: The Future of Game Development ........................................................................... 33
Snapshot: Age Ratings for Games ............................................................................................ 34
Snapshot: Localized Versions of Games ................................................................................... 34
Snapshot: Society’s Negative Perceptions of Industry ............................................................. 34
Conclusions and Next Steps.......................................................................................................... 36
As the largest professional association for game developers worldwide, the International Game
Developers Association has been in a unique position to know and understand individual game
developers on a level that most companies and organizations cannot. While we’ve always had a
very good pulse on how developers anecdotally feel about their work and their industry, we
haven’t always been consistent in capturing and conveying that insight.
In 2004, the IGDA launched its initial Quality of Life survey in an effort to gain a much clearer
understanding of the issues that affect life as a game developer – from “crunch time” to
compensation issues. In 2009, the IGDA repeated the Quality of Life survey in partnership with
researchers at Western University in Ontario, Canada and TÉLUQ in Québec, Canada. The
survey once again provided more insights into how the issue was evolving in our industry, and
then a few years ago the IGDA conducted a separate diversity survey to help us obtain a clearer
perception of developer demographics.
In 2014, as the time approached to repeat the Quality of Life survey, we opted to take a different
approach, one that is more systematic in how we understand game developers worldwide,
including both IGDA members and non-members. It’s not just an issue of gathering basic
knowledge for its own sake, but it’s about knowing developers’ priorities and the most pertinent
issues affecting their overall satisfaction. Most critically, these insights will be leveraged to help
prioritize the IGDA’s advocacy efforts and initiatives.
To that end, we launched this new annual survey called the Developer Satisfaction Survey
(DSS), which remains a partnership with Western University and TÉLUQ, as well as our new
partners M2 Research and the Georgia Institute of Technology. The DSS which was open to
anyone involved in the video game industry in a professional or academic capacity, is the
evolution of our previous survey efforts. Moving forward, the DSS will serve as the IGDA’s core
annual method by which we inform ourselves and the industry about the critical questions around
developers’ satisfaction. For the sake of the long-term health of our industry, we will continue to
strive to discern the demographic composition of game developers worldwide and tap into their
knowledge, experiences and opinions on their well-being and on the state of the industry.
Thank you,
Kate Edwards
Executive Director
International Game Developers Association (IGDA)
The IGDA’s Developer Satisfaction Survey for 2014 was opened for responses on 17 March
2014 and closed on 28 April 2014. By the conclusion of the survey period, the survey accrued
2,202 responses.
This report is a preliminary summary of the primary observations from the survey data in each of
the core areas of the survey:
Demographics
Diversity
Education
Employment Status
Employment Profile
Workplace Overview
Hours of Work
Compensation
Benefits
Career and Advancement
Employment Relations
Future Outlook
This report concludes with an overview of the IGDA’s plans for releasing more detailed reports
on each of these topics in subsequent months.
For 2014, the DSS included additional Quality of Life questions that are asked every 5 years as a
research benchmark, thus the “typical” DSS conducted each year will contain only a sub-set of
the larger survey design.

The demographic makeup of the games industry is important to understand. We asked a wide
range of questions to respondents of the Developer Satisfaction Survey in the hopes of obtaining
valuable insights of the industry. The breakdown of survey representation shows that the
majority of respondents (76%) are male, between the ages of 30-35, live in North America and
have some form of University degree. Half of all respondents were single while half were
married, with less than a third having children.
Snapshot: Age
The age range of survey respondents was large with the ages ranging from 14 to 82. However,
the majority of respondents were in the 30-35 year range making up 27% of the sample. The next
largest age group was 25-29 which represented 25% of survey respondents. The third largest age
group was made up of 35-39 year olds at 17%.
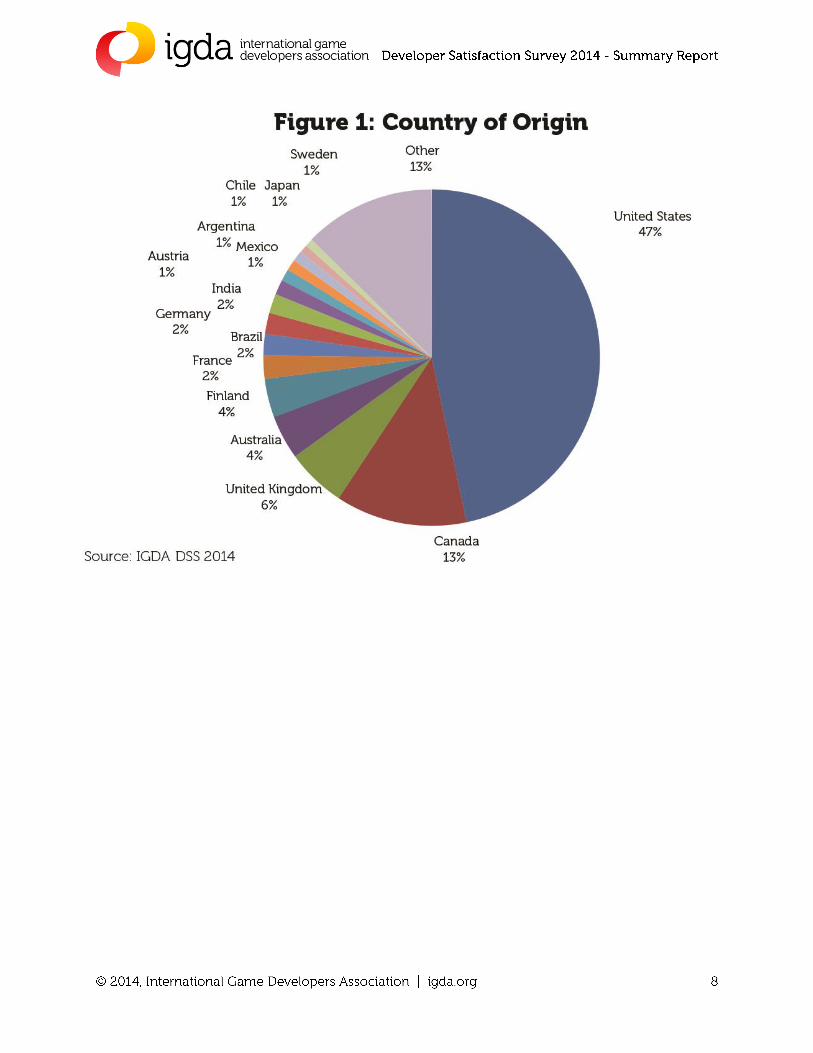
Snapshot: Country of Origin
As seen in Figure 1, the majority of respondents were from the United States and made up a total
of 48%. Canada was second with 17% and with Mexico (0.6%) they bring the overall North
American representation to 66%. Europe represented 20% of survey respondents, Latin America
made up 6.7% and Asia represented 5%. It is important to note that the survey was only released
in English, which may have been a language barrier for many non-English speakers. In all, 14%
of respondents consider themselves to be immigrants to the country where they currently reside,
while the remaining 85% are native born to the country where they reside.
Snapshot: Marital Status
Marital status is one question that seems equally split. There are as many people single as there
are married, with each representing 37% of survey responses. Another 19.5% list themselves as
partnered, while the remaining 5.5% are either separated, divorced, widowed or in polygamous
relationships.
Snapshot: Children
Perhaps not surprisingly given the young age of the sample, 70% of the survey respondents do
not have children. Of the 30% of respondents that do have children, 15% have pre-school
children while 13% have children attending school and 6% have grown children.
Snapshot: Elderly Care
Again as expected given the age of the sample, 87% are not responsible for elder care. There is
however a group of 10% that is responsible for their older family members who either live with
them or live separately. Roughly 3% commented that the question was not applicable to them.
Snapshot: Gender
As the demographic section of the survey shows, 76% of respondents identified their gender as
male, with 22% identifying as female. Only 0.5% identified as male-to-female transgender, and
0.2% as female-to-male transgender. An additional 1.2% selected “other” as their response to
this question. This is a significant change since the IGDA’s 2005 Diversity Survey, in which
women made up 11.5% of the sample. The prior survey did not track for transgendered,
androgynous or other gender identification. It is also interesting to note that of the 12% of
respondents identifying as students, 30% identified as female; 0.7% identified as male-to-female
transgender and 1.4 as androgynous. This could reflect bias or over-sampling of these groups, or
it could suggest that game education programs are doing a reasonably good job of attracting
women and that we might be able to anticipate a shift in gender distribution in the coming years
as these programs grow in influence.
Snapshot: Race and Ethnicity
In terms of race or ethnicity, the overwhelming majority identified as Caucasian at 79%.The next
highest group identified as Hispanic/Latino (8.2%) followed by East/South-East Asian (7.5%);
Africans and African Americans constituted 2.5% of respondents. This represents a slight overall
increase in ethnic diversity since the 2005 Diversity Survey, whose respondents were 83.3%
white, 7.5% Asian, 2.0% black, and 2.5% Hispanic/Latino.
Snapshot: Sexual Orientation
Regarding sexual orientation, 86% of respondents identified as heterosexual, 2.8% as
homosexual, 6.5% as bisexual and 4.7% as “other.” Those that provided additional detail to the
‘other’ category identified themselves as asexual, pansexual or used this option to decline
answering the question as they felt it to be too personal and not relevant to the survey and their
work. The percentage of developers identifying as homosexual remained virtually unchanged;
however more respondents identified as bisexual, 6.52% in the 2014 survey in contrast with
2.7% in 2005.
Snapshot: Disabilities
17.5% of respondents identified as having a disability, as compared with 13% in 2005. By
comparison, 19% in the U.S. are identified as disabled (U.S. Census, 2010), 16% of adults in the
U.K. (Office for Disability Issues, 2014), and nearly 7% reported in Japan (Ministry of Health,
Labour and Welfare, 2011). The largest disability listed was psychiatric and mental illness,
which represented 5% of respondents. The next largest disability category was for visual
impairment and represented 4.4%. The third most listed disability was a learning impairment at
2.7%.
Snapshot: Attitudes toward Diversity
The survey contained a preamble to the set of diversity questions indicating that diversity meant
the differentiation between individuals in regards to age, ethnicity, gender, physical ability, race
and sexual orientation. The overwhelming majority of respondents - 75% - felt diversity was
very or somewhat important in the workplace, and 79% felt it was very or somewhat important
for the industry. A little over a third of developers surveyed (34%) felt the game industry had
increased in diversity over the past two years, while 28% said it was the same, and 3% said it
was less diverse. But another third (35%) said they were not sure, or that the question was not
applicable to them.
Although diversity may have improved since 2005 with female participation in the survey nearly
doubling and modest gains in most ethnic groups, companies could be doing a better job of
implementing, enforcing and communicating diversity and discrimination policies to applicants
and employees.
In terms of diversity in outreach and recruitment, 33% of respondents reported not knowing of
any diversity programs within their companies, and a little less than a third (29%) said their
employers have no diversity programs at all. However, smaller numbers ranging from a little
under 20% to a little under 10% reported that their companies had some type of diversity
programs or partnerships to foster diversity. Also, 15% reported retention and professional
development programs for diverse talent and 11.5% reported targeted advertising aimed at
recruiting diverse applicants. Less than half of respondents (46.5%) reported an equal
opportunity hiring policy. One-quarter did not know if their company had such a policy or not.
Just over 40% said their companies did not consider diversity, but only qualifications in hiring
decisions, while a further 40% were neutral on this question.
In terms of perception of diversity issues, although nearly 80% of respondents felt that diversity
was important, diversity appears “off the radar” for a significant percentage of game developers.
When asked whether or not their companies pursued diverse candidates, 45% were neutral and
the same number were neutral about whether their companies supported diversity initiatives.
Similarly, 43% had a neutral opinion about whether or not obtaining diverse candidates was
challenging but 39% felt that it was.
Snapshot: Discrimination
The industry appears to be doing slightly better in terms of discrimination policies for workers
once they are hired, but are faring poorly at keeping employees informed about these policies, as
well as putting procedures in place to enforce them. While 55% of respondents reported having a
discrimination policy and 48% reported having a sexual harassment policy, only 30% said their
companies actually had a complaint procedure and only 28% had a disciplinary process. One-
quarter of respondents were completely unaware of policies in any of these areas. Just over one-

third of respondents felt these policies were adequately enforced, 6.5% said they were not and
36% were not sure.
It is therefore not surprising that when asked “Do you feel there is equal treatment and
opportunity for all in the game industry?” 47% of respondents definitively answered “No,” while
only 28% answered “Yes,” and 25% answered “Not sure” or “Not applicable.”
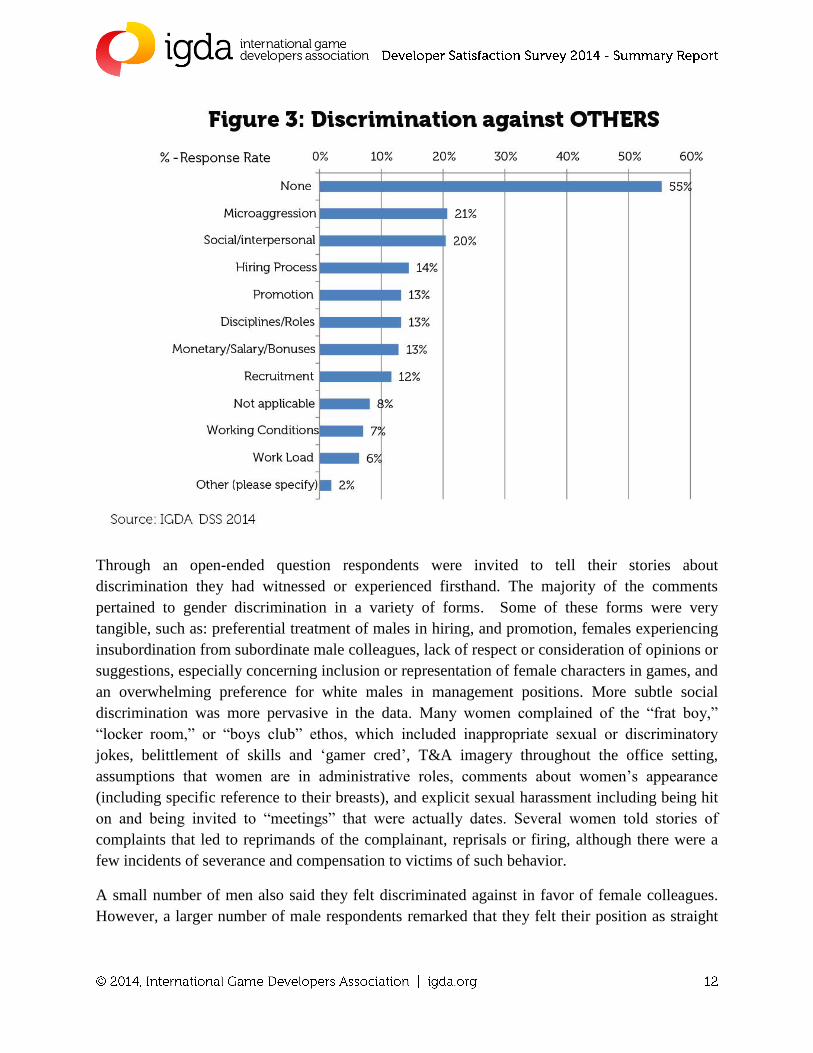
The following charts show responses to the questions “Have you perceived inequity towards
YOURSELF (Figure 2) or towards OTHERS (Figure 3) on the basis of gender, age, ethnicity,
ability, or sexual persuasion in any of the following areas?” The majority of respondents (60%
and 55%, respectively) answered “None” to both questions. However, of those who identified
forms of discrimination, 20% of respondents reported observing both social/interpersonal
discrimination and microaggression, while 15% and 14%, respectively, reported experiencing
these discriminatory behaviors firsthand.
Through an open-ended question respondents were invited to tell their stories about
discrimination they had witnessed or experienced firsthand. The majority of the comments
pertained to gender discrimination in a variety of forms. Some of these forms were very
tangible, such as: preferential treatment of males in hiring, and promotion, females experiencing
insubordination from subordinate male colleagues, lack of respect or consideration of opinions or
suggestions, especially concerning inclusion or representation of female characters in games, and
an overwhelming preference for white males in management positions. More subtle social
discrimination was more pervasive in the data. Many women complained of the “frat boy,”
“locker room,” or “boys club” ethos, which included inappropriate sexual or discriminatory
jokes, belittlement of skills and ‘gamer cred’, T&A imagery throughout the office setting,
assumptions that women are in administrative roles, comments about women’s appearance
(including specific reference to their breasts), and explicit sexual harassment including being hit
on and being invited to “meetings” that were actually dates. Several women told stories of
complaints that led to reprimands of the complainant, reprisals or firing, although there were a
few incidents of severance and compensation to victims of such behavior.
A small number of men also said they felt discriminated against in favor of female colleagues.
However, a larger number of male respondents remarked that they felt their position as straight
white males put them in a position of privilege in which they did not have to deal with these sorts
of issues.
Ageism was cited as the second most common form of discrimination. Older professionals felt
that they were passed over for jobs in favor of younger candidates who didn’t have family
obligations, were willing to work longer hours and expected lower compensation than their older
counterparts.
Discrimination on the basis of race and ethnicity was also mentioned. Some respondents felt that
being foreign (e.g., non-Japanese at a Japanese company) put them at a disadvantage. Language
discrimination was also cited as an issue, most notably in French-speaking Quebec where
English-speaking developers felt discriminated against. One African American developer was
shocked that a colleague used the “n” word at work without repercussions. One Hispanic
respondent reported submitting two resumes for the same job, one with the real, Hispanic
sounding name and one with an Americanized name; recruiters selected the Americanized name,
even though the resumes were otherwise identical.

Snapshot: Educational Background
As more game education programs are being launched internationally, both in vocational and
university contexts, it is important to get a snapshot of the educational backgrounds of
developers. We also collected data on currently enrolled students in game or game-related
programs, which had not been collected in past surveys.
As Figure 4 illustrates, nearly 40% of the sample hold a university degree, a surprising 20% hold
graduate degrees, and 15% hold college, CEGEP or trade diplomas.
Snapshot: Specialized Degree in a Game Related Discipline
Over one third of survey respondents, 35% have a specialized degree that is somewhat relevant
to game design and development. Another third, 32% have degrees that are directly related to
game development. The remaining either do not have relevant educational backgrounds (17%) or
it is not applicable to the work they do (15%). It is important to note here that a number of
survey respondents do not work directly in game development, but rather work in occupations
related to the game industry more broadly. A little over half of respondents had also taken
supplemental training in game design, including high school and college courses, as well as
training by their employers; 26% reported that this training was accredited.
Snapshot: Students
An important sub-sample (11%) of our respondents identified as being either full (8.5%) or part-
time (2.5%) students. Almost 10% of respondents also identified as working in academia or
research. These figures were not captured in previous surveys, so they represent a first baseline.
A little under a third of those identifying as students (30%) were women.
It is interesting to note that in a question targeted to people not currently employed in the game
industry, 46% said they were looking for their first industry job. From this we can surmise that a
little under half of the people currently in the games job market are recent college graduates.
This suggests a high demand for entry-level jobs.
Respondents identifying as students were also asked to specify the type of job they are pursuing.
Nearly a third (30%) indicated that programming was their primary interest. Design was the
second most popular discipline at 19%. Art ranked third at 13% and Production and Writing each
captured 5.5% of the sample. A number of students (6.5%) said they wanted to start their own
companies, 1.0% said they wanted to be game journalists and 3% are interested in teaching.
Smaller numbers said they were interested in quality assurance (2%), audio (1%), business
management (1%) or wanted a game-related position at a non-game company (2%).
Students cited a variety of company types they wanted to work for, including: First-party
developer/publisher (38%), third party developer (5.5%) and publisher-owned second party
developer (4.5%). Perhaps not surprising given the anecdotal reports of the rise of independents,
the second highest company selection was an independent game studio with 34% citing that as
their target company. Smaller numbers of respondents wanted to join a serious games studio
(3.5%), 7% said they were interested in going into academic research, and 1.5% each said a tools
company or a non-game company was their desired employer.
Table 1 below shows the priorities of developers when they’re seeking a new job. Respondents
were asked to check all the options that applied. Note that 73% said that learning new skills was
their top priority. Location was number two at 68%, followed closely by salary at 63%. Other
priorities cited included potential for advancement (58%), creative freedom (54%) and a family-
friendly environment (42%). Interestingly, over a third cited diversity in the workplace as a
priority (38%). Flexibility and mobility (40%) and insurance/retirement benefits (29%) were also
selected by a large minority. Reflecting the high percentage that said they wanted to work at an
independent studio, one-quarter said that building a start-up was a priority in seeking
employment. The same percentage also cited crunch time as a consideration.


Snapshot: Job Roles and Discipline
Unlike previous iterations of IGDA surveys, this time respondents were asked to list their
primary and secondary roles/disciplines and they were instructed to choose all the options that
applied. For primary role, the largest percentage of respondents listed themselves as
programmers/software engineers, making up 33% of the survey population. The second and third
largest groups for primary position were game designers (27%) and team leads (21%). In line
with other data presented in this report about the prevalence of indies and the self-employed,
21% of the respondents listed themselves as founders of their company. Game Designer was
listed as the top secondary discipline at 17% followed by Quality Assurance (13%) and Team
Lead (12%).
Snapshot: Job Tenure and Experience
The average survey respondent has worked in the game industry for 9 years, been at their current
job for three and a half years, worked on 16 distinct projects and has had between 3 and 4
employers in the past five years. However, we believe those averages hide a degree of skew and
some misrepresentation in the data at both the high and low ends. As a result the median and
mode are likely more accurate representations of the data. The following table indicates the
descriptive statistics for these questions.
Snapshot: Reasons for Joining/Leaving the Industry
When individuals were asked to indicate their primary reasons for wanting to join the game
industry, the great majority of respondents indicated it was to “earn a living doing what I enjoy”
(41%) or “share my passion for games by working in the industry.” (40%) This reinforces the
notion that game developers are very enthusiastic and passionate about their craft.
By contrast, when asked for the top reasons for wanting to leave the game industry, the top
reason from respondents was “I want a better quality of life” at 39%. This was followed by
“found a job with better pay and hours” at 15% and “burned out”, also at 15%.
Snapshot: Worker Commitment to the Industry
Reports on past IGDA Quality of Life surveys (2004 and 2009) have indicated high levels of
industry turnover and high numbers of people who intended to leave the industry in the near
future. From a preliminary standpoint, the data in this survey is somewhat mixed. As noted
elsewhere in this report most of those currently unemployed intend to rejoin the industry, yet
many of those currently employed express dissatisfaction with key features of the industry.
When asked directly, 61% of employed respondents said they planned to stay in the industry
indefinitely. Only 5% said they planned to leave after 3 years or less, 8% after 4-10 years, 8%
after 10-20 years and 15% did not know. On the face these numbers seem to be an improvement
on past data, however more analysis is needed to isolate the sentiments of specific sub-groups of
the sample.
Overall, 50% of the sample indicated that their job in the game industry was their career and a
large part of their life. Sixteen percent expressed an even stronger sentiment that their work in
the game industry was their career and their career is their life. An important minority expressed
that their career in the game industry was just one part of their life (21%) and 11% said it was
just a day job amidst other career ambitions. Only 2% stated that their job in games was just a
job and nothing else.
Snapshot: Mobility
With respect to the employment profile of currently employed respondents, the majority (75%)
had not been laid off in the past two years, but 17% had been laid off permanently. As well,
41% of the sample had relocated for work at least once in the past five years. This somewhat
supports the picture of an industry with high churn and job instability, and the necessity of
worker mobility.

Snapshot: Employment Status
The majority of people who answered this survey work in the game industry either as full-time
(76%) or part-time employees (10%). Ten percent of the sample indicated that they are currently
unemployed in the game industry and 11% indicated that they were full-time or part-time
students.1
Snapshot: Types of Contracts – Reality versus Preference
Survey respondents were asked about the nature of their employment contract (the reality) and
they were also asked about the type of employment that they would prefer. We have not yet
conducted a direct comparison of reality versus preference per respondent to determine level of
match, but a quick overview shows a great deal of overlap between what is desired and what
workers experience. Seventy percent are in permanent full-time or part-time positions and 70%
prefer permanent full-time work arrangements. There is some indication of mismatch for other
employment forms. Only 5% of respondents said that they prefer temporary, freelance or
contract work and only 4% preferred part time work; yet 15% and 10% of workers are employed
under those terms, respectively. More respondents would like to be self-employed than the
current distribution: 23% versus 15%.
Snapshot: Number of Employers
While over 70% of respondents indicated being full-time, permanent employees, it is surprising
to see that when asked about the number of employers they’ve had in the past 5 years, the
response average is 3.75. This could be speaking to a high volatility within the game industry in
recent years, with studio closures and acquisitions and frequent movements of employees. It
could also indicate a high propensity for churn in a project-based creative industry where
individuals move on (either by force or by choice) once their work on a specific project is
completed.
Snapshot: The Unemployed
A relatively small number of respondents (166) indicated that they are currently unemployed in
the game industry. As noted in the Education section, just under half of these are people looking
1 As some students also indicated that they work in the industry, these totals do not add up to 100%.
for their first job in the industry. Among the remainder, 25% were recently laid off, 15%
recently ended a contract, 11% quit and 2% retired.
The resulting group of 91 unemployed respondents is quite small to draw any strong conclusions,
but it is worth noting that most wanted to stay in game development. It is likely that these are
the respondents who were recently laid off or reached the end of their contract, though we have
not yet conducted that specific analysis of the data. This cyclical unemployment is a common
feature of the industry’s current structure that causes uncertainty for some workers.
Snapshot: Why Freelance or Self-Employed?
Sometimes people choose to be self-employed or work on a temporary or contract basis. Other
times this is the only option given their unique circumstances and the realities of their regional or
national labor market. This survey captures both of these dimensions. Many respondents said
they work freelance or are self-employed for reasons related to personal control over their work
and life (they could select more than one answer):
To have more control over working conditions like hours (58%)
To have more control over the content of the work (56%)
To make the games you want to make (55%) and work on more varied projects (44%)
To have more control over employment stability/risks (32%)
But over one-third stated that they freelance or are self-employed because they have not been
able to find a permanent job at an established studio where they live. This shows that for some,
this was not purely a personal choice. Additional analysis will identify any patterns in who
experiences this mismatch.

Snapshot: Regular versus Crunch Hours
Similar to the findings from the 2009 IGDA Quality of Life survey, respondents tended to report
working more hours during a regular schedule than are specifically required or expected. The
same seems true during a period of crunch though to a lesser extent. For instance, Figure 5 shows
actual hours versus expected hours in the core distribution range of 35-69 hours per week for
both regular and crunch periods. This shows the general tendency to work longer hours overall
as well as the upward shift in hours during crunch times.
More on Crunch
Only 19% of the sample had not crunched at least once in the past two years. Almost 45%
experienced more than two crunch periods in the past two years. Half of the sample felt that
crunch was expected at their workplace as a normal part of the job; 37% said they did not feel
this way and 10% were not sure.
Snapshot: Necessity of Crunch
The practice of crunch within the games industry has been in use for many years and has had
many critics. The idea of working endless hours to ship a product without additional
compensation, bonuses or other incentives is well known in the industry. When asked
specifically about whether crunch was a necessary practice of game development respondents
agreed that it is not. Over half of all respondents (52%) either do not agree (27%) or strongly
disagree (25.5%) that it is necessary. Only about one-quarter agree (19%) or strongly agree (5%)
that crunch is necessary to game development.
Snapshot: Top Reasons for Crunch
Respondents were asked to list the top three reasons why crunch or extended overtime occurred
at their place of work. Poor/unrealistic scheduling was the most frequent choice (53%), followed
by feature creep (36%), unclear expectations (35%), insufficient staffing (31%) and
inexperienced management (25%). Many of these are related to the project-based system of
game development where the budget, scope and schedule are paramount drivers and deviations
or inadequacies in the system or in the management of the system result in time intensification
for the project team. Also, the relatively lower age of game developers could potentially account
for less experience in managing project schedules.

All of the survey respondents except students and those who had permanently left the industry
were asked questions about compensation. Unemployed respondents were asked about their
most recent job.
Snapshot: Total Income
Most respondents were paid on salary (66%). Approximately 10% reported being paid by the
hour and 4% were paid per deliverable. Approximately 8% reported some combination of those
three components. Perhaps surprisingly 8% of the sample reported that they had not yet been
paid for the work on their current project. More detailed analysis is required to isolate this
sample but it could reflect a start-up situation.
As seen in Figure 6, the annual income of respondents was generally distributed around $50-
74,000. However, this discounts over 20% of the sample who reported that they earn less than
$15,000 per year from sources related to the game industry. Again, additional analysis is
required to understand this figure. Other questions indicate that 22% of respondents were not
primarily employed in the game industry and that for almost 22% of respondents, less than half
of their game-related activity/work generated income.
Snapshot: Raises and Incentives
There seems to be great variation and perhaps a lack of transparency when it comes to raises,
bonuses and other incentives. Among respondents, 20% received no raises as part of their
compensation and a further 10% were not sure if they did or not. One-third of respondents
received no incentives and a further 7% did not know. Others received lump sum bonuses
(32%), stock options (23%), or royalties (16%).
Snapshot: Satisfaction with Compensation
Most respondents felt they were compensated fairly for the amount of experience they have and
the responsibility of their job title. Approximately half (47%) of the sample agreed or strongly
agreed to that statement, while 28% disagreed or strongly disagreed and 20% were neutral.
Yet, 32% of respondents felt that they are not equitably compensated with respect to over-
time/crunch; 30% said compensation for crunch is sometimes equitable and 26% felt that it was
equitable.
Snapshot: Health Coverage
One-quarter of the sample of employed or recently employed respondents either received no
health coverage, did not know if they received health coverage, or they felt this question did not
apply to them. The remaining three-quarters received health coverage from a variety of sources.
Of all the options available to respondents, an employer provided plan was chosen 56% of the
time, a government plan was chosen 22% of the time and an individual plan through a private
insurer was chosen 12% of the time. The numbers for government plans are likely fueled by
respondents who live in countries with universal publicly-funded health care such as Canada or
the more recently implemented Affordable Care Act in the U.S. A very small number received
health coverage through a group provider such as a professional association and almost 10%
received coverage through a partner or parent. Additional analysis is necessary to determine the
precise characteristics of game workers who have coverage versus those that do not and
employers that offer coverage versus those that do not.
Snapshot: Retirement Savings
Retirement savings in most industrialized countries come from three sources: 1) government
plans paid through employer payroll taxes such as Social Security in the US, the Canadian
Pension Plan in Canada, or the State Pension in the UK; 2) employer-sponsored plans that often
require employer and employee contributions; and, 3) individual savings through registered
retirement savings accounts (i.e., RRSP, IRA). The survey data indicates that workers in the
game industry are utilizing each of these sources, though to varying degrees and not to a high
extent. Respondents were asked to indicate all of the retirement plans that applied to them.
Employer plans were selected 37% of the time, individual plans were selected 25% of the time
and government plans were selected only 16% of the time. This latter figure is interesting
because all people who have been in dependent employment relationships should have access to
their state pension plans where they exist. Though this often excludes the self-employed, given
the high number of respondents from the US and Canada, one would expect higher numbers.
This could, therefore, reflect a lack of understanding of the pension system. What is most
striking is that “I have no retirement plan” was chosen 30% of the time.
Snapshot: Pregnancy and Parental Leave
Awareness of pregnancy and/or parental leave seems somewhat limited among respondents; 27%
indicated that they did not know if their employer provided these benefits in any way. As well,
few respondents reported having these benefits. Only one-quarter reported employer-paid leave,
about 15% reported a combination between government and employer-paid leave and 9%
reported unpaid leave. Having children may be off the radar for this young population; however,
this does not do much to support women, families or the aging of the industry.
Snapshot: Time-Off
The majority of respondents have packaged time-off policies where time can be allocated toward
some combination of vacation, sick days and/or other personal days off for a variety of reasons.
Just under 20% of respondents work at companies that treat vacation and sick days separately
and 13% felt that this question was not applicable to their work situation. The majority of
respondents received 2, 3 or 4 weeks (18%, 19% and 15%, respectively) while 12% reported that
they can take as many days as they want or need.
Snapshot: Performance Reviews
According to the compensation data, decisions about whether or how raises or incentives are
given to workers in the game industry are based primarily on managerial discretion in merit
assessments. Performance reviews are a common tool in many organizations beyond game
development for both development and assessment; however, according to a preliminary reading
of this data, formalized assessment might be somewhat sporadic in the game industry. In this
sample, 14% of employed respondents said that their company did not conduct performance
reviews and another 8% were not sure if their company conducted performance reviews. Forty
percent received annual performance reviews, 11% were reviewed every six months and 6%
were reviewed quarterly.
Snapshot: Career Progression
Based on this data, the game industry could improve in promoting career development and
longevity within companies. Just over one-third of respondents said that they did not have a clear
career path in their company and 19% were not sure, while 38% said they did feel that they had a
clear career path in their company. When asked to rate their company on opportunities for
promotion and advancement, 27% selected ‘poor’ or ‘fair’, 30% selected ‘neutral’, 27% selected
‘good’ and only 16% selected ‘excellent’.
When asked about their employment, 18% chose ‘I feel stuck and will have to change companies
for my career to grow’ and 5% indicated that they were not happy with their company, but did
not feel that changing companies would be better. In line with the data about the preference for
self-employment (in the Employment Status section), 6% indicated that they were earning
money so that they could start their own company. That said, many respondents seemed satisfied
with their positions. One-quarter felt there was ample room for growth at their company and one-
quarter said they were happy with what they were doing and did not see a need to move. A
further 12% reported being happy at their company but did not feel that they had job security.
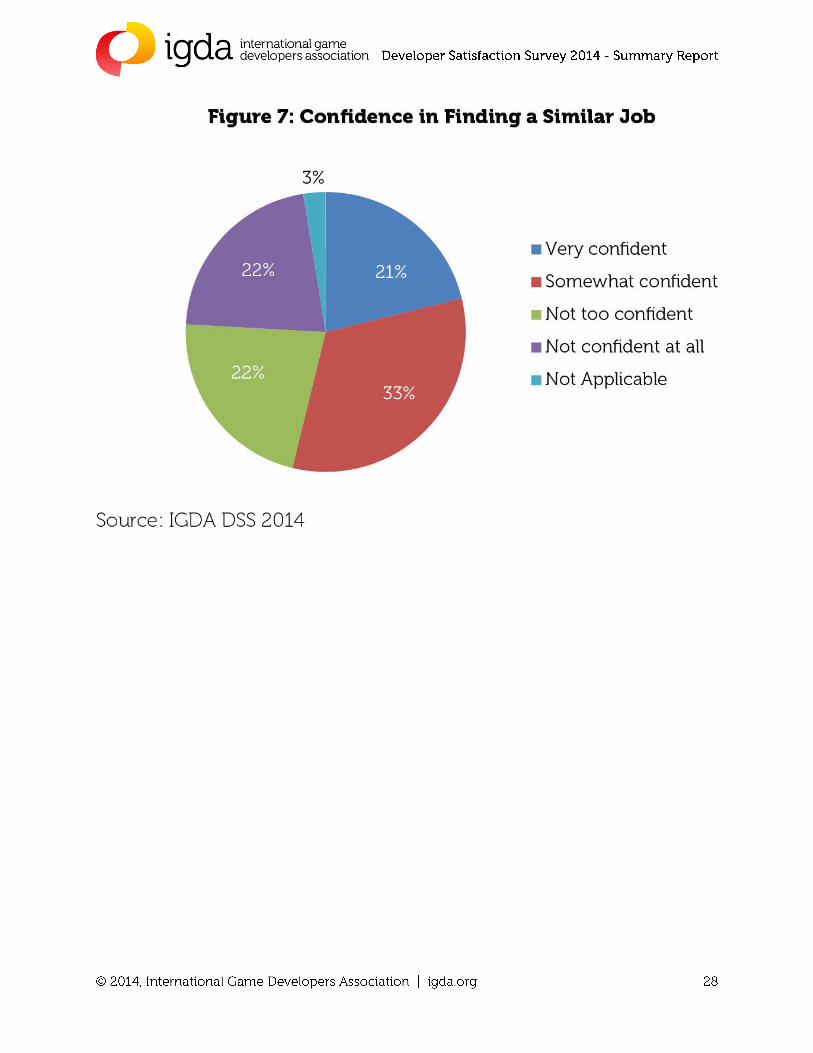
Snapshot: Job Security
High worker mobility is taken as normal in the game industry. This is apparent in the data above
on limited career advancement within companies and in the data elsewhere in this report on short
job tenure and multiple employers. The survey also asked some specific questions about job
security. A startling one-quarter of respondents expressed worry that their job won’t be there
next month and 16% were neutral on that question. As seen in Figure 7, many were not very
confident that they could find a similar job without having to move if they lost their current job.
The Workplace Overview section provides a snapshot of the size, location and general makeup
of companies that were surveyed. Over half of the survey responses came from North America,
representing 58% of respondents. Many respondents were working for smaller independent
studios which made up 48% of survey responses. They were working in large and small teams
and were currently building games for the iPhone, iPad and PC online. By next year they will be
looking to develop more games for Steam and Android platforms. There is a general confidence
in the industry that most companies will see considerable growth in the next three years.
Snapshot: Country of Work
In terms of where survey respondents work, almost half (48%) were located in the United States.
The next largest representation is Canada where 17% of survey respondents work. Rounding out
the next top five countries in which people work are the United Kingdom at 5.4%, Australia at
4.3%, Finland at 3.7%, India at 2.3% and Germany at 2%. Overall, there were a surprisingly
high number of countries represented in the survey given that it was distributed only in English.
Collectively, survey respondents work in 55 countries.
Snapshot: Type of Business
The shift away from large publishers to the growing predominance of independent developers
has happened at a significant pace. Roughly 48% of respondents said they work at independent
studios while first party publishers represent only 27% of where people are working. Though
there is the danger of response bias in who answered the survey, this could be a telling sign of
the evolution of game studios. With the explosion of mobile and free-to-play games, self-
publishing portals such as Steam and Desura, and versatile, inexpensive game engines such as
Unity, fewer development studios need large productions budgets, publishers and marketing
teams to sell their games. The third largest group was made up of game studios for hire which
represents 17% of survey respondents.
Snapshot: Company Size
The number of people working in large companies is surprising. Overall, 20% said they work for
companies that have between 101-500 employees and an additional 17% said they work for
companies with over 500 employees. Rounding out that top three, 19% reported working for
companies with between 11 and 50 employees.
If we look at part-time workers the numbers change significantly with 38% of part-time workers
employed at companies with 2-5 people and another 33.5% saying that they work for themselves.
This represents a degree of polarity in the types of jobs available.
Snapshot: Growth Rates
For the most part game companies and schools appear to be on a positive growth pattern. When
asked about the growth of their company or school for the past three years 46% stated there had
been considerable growth. Looking ahead, respondents were also asked about the next three
years. About the same number (45%) believed the companies they work at and the schools they
attend will have considerable growth while only 10% believed there would be considerable
downsizing. This demonstrates that there is generally confidence in and positive economic
outlook for both companies and education facilities for the coming years.
Snapshot: Development Teams
Development teams are the life source to game development and understanding the size of teams
is important. Team sizes definitely vary in the survey. The largest group of respondents (29%)
worked on teams of between 2-5 people and 22% worked on teams of between 11-50 people.
The frequency then fell off with 17% of the sample working in teams of 6-10 people.
Snapshot: Game Platforms
The majority of respondents were working for companies that are developing for the iPad (59%)
and the iPhone (57%). The next most popular platform was PC online which represented 54% of
total responses. Respondents were also asked what platforms their company would develop for in
12 months and the answers were quite different. Android tablets came out on top, representing
16% with iPhone, iPad and Android phone all coming up at 15%. Development for consoles and
Steam also had significant representation, each making up 14% of the total.
It is good news that 52% of survey respondents rated the relations between employees and
management at their places of work as good or excellent. However that leaves one-third rating
employment relations as only fair or poor (16.5% indicated that this question was not applicable
to them – likely due to self-employment or small or informal ‘companies’ with no clear
managerial distinctions). It is also important to note that this sample includes people in
managerial and non-managerial roles and the opinions of these two groups on these issues are
often quite diverse. More detailed analysis on these distinctions will follow in subsequent
reports.
Snapshot: Legal Protections
In all employment situations it is necessary to acknowledge that problems can arise and
sometimes workers want and need additional support. Employment standards laws are one
avenue, however 50% of this sample said they knew the labor laws where they live “only a little”
and 17% said they did not know them at all. To add to this, 38% did not know whether the
labor/employment laws where they live offered sufficient protection should a grievance or
problem arise between an employer and employee and 24% said that the laws did not offer
sufficient protection.
Snapshot: Employee Voice
Individual workers can raise concerns or issues with their working conditions directly to their
managers. Just over one-quarter of the survey respondents felt comfortable with this approach.
A larger group (43%) felt more comfortable raising issues as a collective through a group like a
professional association, an employee association, or a union. One-quarter responded neutrally
to this question and 4% felt it was not applicable.
Snapshot: Unionization
The 2009 IGDA Quality of Life Survey asked game developers what they would do if a vote to
join a union was held at their workplace tomorrow. The responses were almost a perfect split
into thirds for “vote yes”, “vote no”, and “prefer not to say/don’t know.” In the 2014 survey an
additional category was added to better capture the options workers have in a certification vote.
Just over one-third said that they would vote for the union, 20% said they would vote against the
union and 10% said they would not vote at all. One-quarter felt this question was not applicable
to their work situation and 9% preferred not to say.
But unions that represent workers workplace by workplace are not the only model. Some unions
represent workers and negotiate issues across an entire industry rather than workplace by
workplace. Examples of these unions are the Writer’s Guild of America or the Alliance of
Canadian Cinema, Television and Radio Artists (ACTRA) in Canada. More of the survey
respondents seemed to prefer this kind of union. Over 55% said they would vote in favor of an
industry-wide union, 14% said they would vote against, 9% would not vote at all, 8% preferred
not to say and 13% felt that this question was not applicable to them.
The Future Outlook section is where we look to gauge the general feelings of respondents toward
certain topics. We are also interested in certain trends and capturing the broader views that could
impact the industry in the future.
Snapshot: Important Platforms for the Future
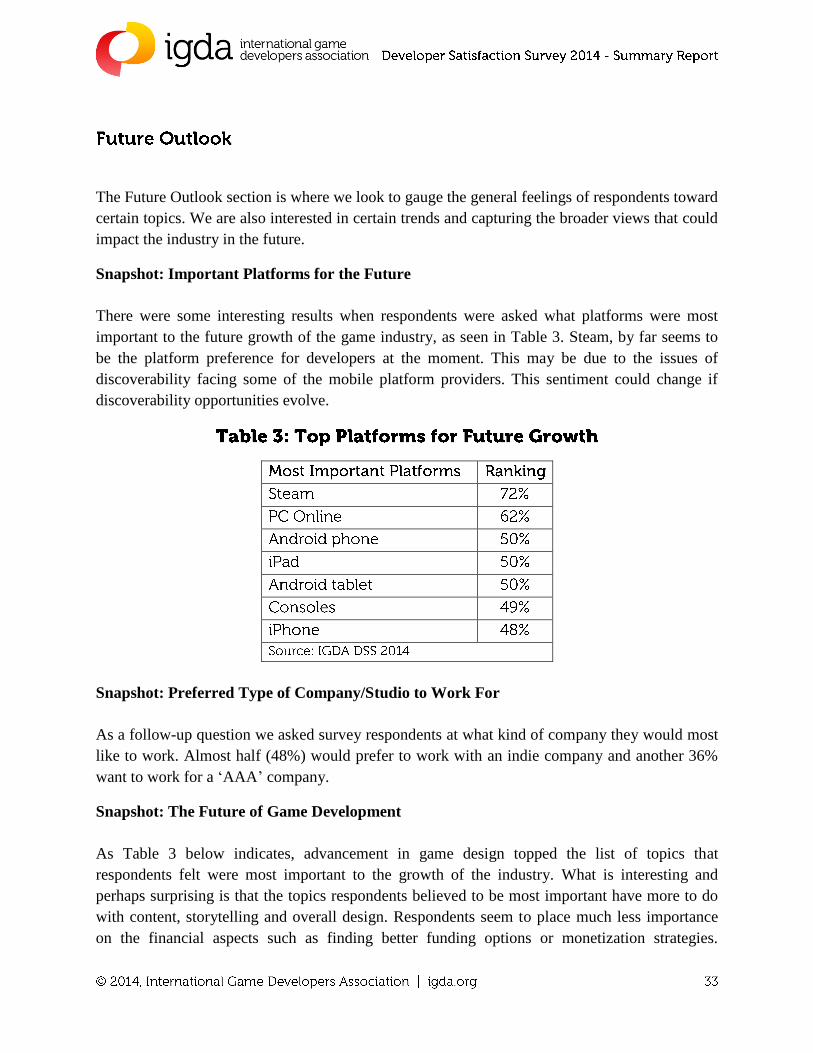
There were some interesting results when respondents were asked what platforms were most
important to the future growth of the game industry, as seen in Table 3. Steam, by far seems to
be the platform preference for developers at the moment. This may be due to the issues of
discoverability facing some of the mobile platform providers. This sentiment could change if
discoverability opportunities evolve.
Snapshot: Preferred Type of Company/Studio to Work For
As a follow-up question we asked survey respondents at what kind of company they would most
like to work. Almost half (48%) would prefer to work with an indie company and another 36%
want to work for a ‘AAA’ company.
Snapshot: The Future of Game Development
As Table 3 below indicates, advancement in game design topped the list of topics that
respondents felt were most important to the growth of the industry. What is interesting and
perhaps surprising is that the topics respondents believed to be most important have more to do
with content, storytelling and overall design. Respondents seem to place much less importance
on the financial aspects such as finding better funding options or monetization strategies.
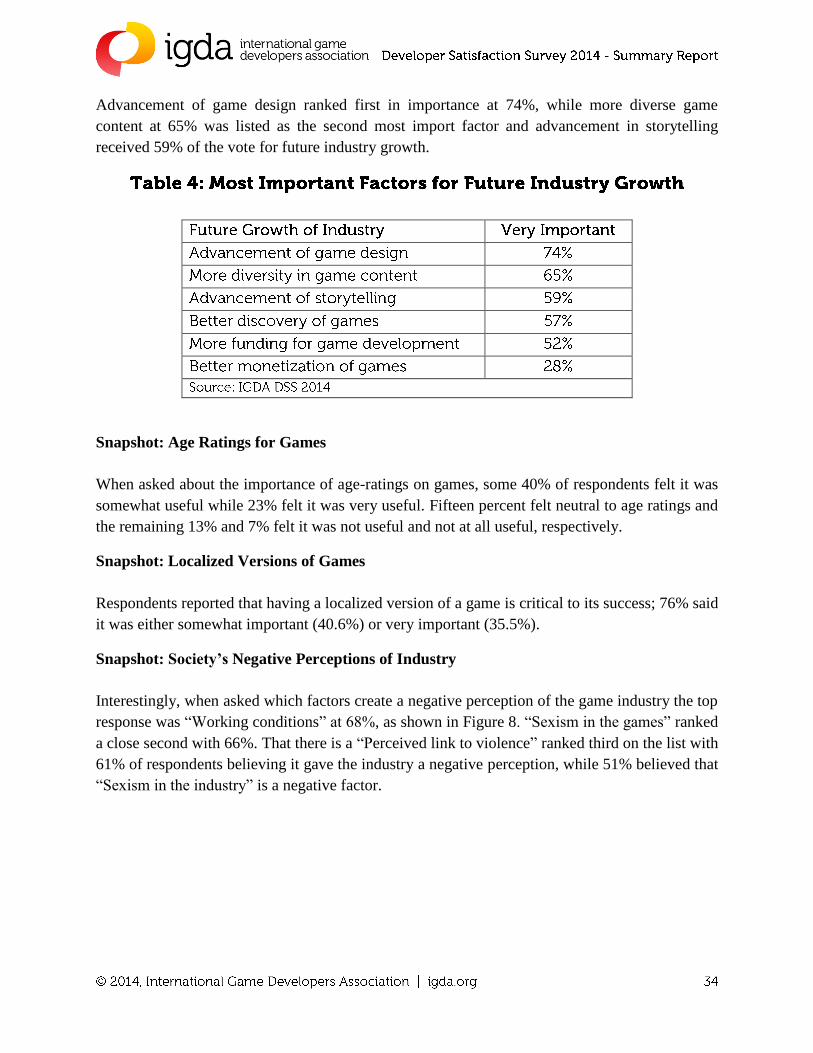
Advancement of game design ranked first in importance at 74%, while more diverse game
content at 65% was listed as the second most import factor and advancement in storytelling
received 59% of the vote for future industry growth.
Snapshot: Age Ratings for Games
When asked about the importance of age-ratings on games, some 40% of respondents felt it was
somewhat useful while 23% felt it was very useful. Fifteen percent felt neutral to age ratings and
the remaining 13% and 7% felt it was not useful and not at all useful, respectively.
Snapshot: Localized Versions of Games
Respondents reported that having a localized version of a game is critical to its success; 76% said
it was either somewhat important (40.6%) or very important (35.5%).
Snapshot: Society’s Negative Perceptions of Industry
Interestingly, when asked which factors create a negative perception of the game industry the top
response was “Working conditions” at 68%, as shown in Figure 8. “Sexism in the games” ranked
a close second with 66%. That there is a “Perceived link to violence” ranked third on the list with
61% of respondents believing it gave the industry a negative perception, while 51% believed that
“Sexism in the industry” is a negative factor.

For being an inaugural effort, we’re pleased with the overall outcome of the Developer
Satisfaction Survey and believe it will continue to be a vital source of actionable information for
the game development community. These data points also provide the IGDA with a better
indication of who the association represents and their concerns, interests and issues, empowering
us with a better foundation for how the IGDA can increase its effectiveness.
Insights from 2014 show that without question, those who work in the game industry are
extremely passionate about their jobs and their desire to contribute to the industry for the entirety
of their careers. The global workforce is slowly increasing in its diversity while developers are
generally gaining better wages and benefits.
However, significant challenges remain, such as these stand-out issues as examples:
The demands on employees’ contributions versus fair compensation for their time spent
at work (i.e., compensation for “crunch” time).
A broad recognition of the problem of sexism, not only in the workforce but in the games
themselves – combined with a perception that the industry doesn’t provide equal
opportunity for all.
A strong desire by employees to give their time and passion to an employer, sharply
contrasted by high rates of job changes over short periods of time.
The IGDA aims to leverage these insights to help the organization focus its energies on key
issues that can be improved for the sake of individual developers as well as for the overall health
of the industry. In subsequent months, the IGDA will release more detailed reports on key
thematic areas of the survey, including the topics of Diversity, Employment Practices and
Compensation/Benefits.
For 2015 and beyond, we have the following goals to improve the reach of the survey as well as
the effectiveness of the survey results:
Increase the number of respondents by continuing to partner with major media outlets,
studios and other avenues for reaching game developers.
Improve the international reach of the survey by providing localized versions in as many
major languages as feasible.
Engage in continual improvement to survey design and language based on respondent
feedback.
Incorporate the survey results into a regular annual report on game developer satisfaction
and well-being.
Create prescriptive guidelines and best practices to help both employers and employees
understand their respective pain points and discern ways to better balance the need for
results and the need for long-term employee happiness and productivity.