Embed Size (px)
Citation preview
Indian Journal of Science and Technology Vol. 4 No. 12 (Dec 2011) ISSN: 0974- 6846
Sci.Technol.Edu. “Fuzzi model for new product development” A.Badizadeh & S.Khanmohammadi Indian Society for Education and Environment (iSee) http://www.indjst.org Indian J.Sci.Technol.
1749
Developing a Fuzzy model for assessment and selection of the best idea of new product development
Ali Badizadeh1* and Sohrab Khanmohammadi2
Department of Industrial Management, Faculty of Management and Economics, Science and Research Branch, Islamic Azad University, Tehran, Islamic Republic of Iran1
Control Engineering Department, Faculty of Electrical and Computer Engineering, University of Tabriz,Tabriz, Iran2
Abstract
This paper introduces a model for evaluating and prioritizing new products development ideas. As the environment of decision making includes full of ambiguities and uncertainties, a fuzzy multi-criteria decision making model is applied to evaluate and prioritize the ideas based on the criteria. To validate the proposed mode, the results of the proposed model are compared with the results of applying the traditional AHP model in a manufacturer of Automobile parts. The comparison indicates that applying the proposed model would lead to more reliable and compatible results than the uncertain environment of decision making process. Keywords: Product innovation, Company, Multi criteria decision making, AHP, Fuzzy logic. Introduction
New product development is a key strategy for the long-term profitability of companies. One important step in this strategy is the decision making on selecting the best alternative or idea for developing new products. A firm's global new product development (NPD) strategy is a primary determinant of performance (De Brentani et al., 2010).
Each company introduces new products by applying the strategies such as: Firms’ ownership, Purchasing the license of products, Design and development of new products, Adjustment of current products and Supplying current products with new brands. Development of new products is one of the most risky activities for companies because of various uncertainties involved in the process. To tackle these uncertainties, evaluation and prioritizing of the new product development ideas play important roles. Managers of a company should consider all these uncertainties, quantify and model them, and finally evaluate and select the best strategy for developing new products.
Bstieler and Gross (2003) considered the influence of uncertainties in effective environmental factors influencing the outcome of the NPD process. They consider two main environmental factors: market and technology. They conclude that uncertainties in the market and the technology may lead to instability in the new product development projects. Ozer (2005) studied the important factors which influence decision making in the process of new product evaluation. In this research, new product development is mentioned as a critical activity for companies to survive. Ozer (2005) stressed that companies may make two mistakes in the decision making process on evaluation of new product development ideas: 1) Companies may want to implement an idea of developing a potentially unsuccessful product; 2) Companies may not want to develop a potentially successful new product. In the investigation, an efficient algorithm for assessment of
ideas of the new products development was proposed. The algorithm included the identification of effective factors/criteria in the decision making of new product evaluation, determining the influence of each factor in evaluation of ideas, and finally presenting guidelines for decrease in negative effects of factors in the decision making.
Frambach et al. (2003) have taken into account how relative insistence of business strategies influences new product and innovation development. They considered the probabilistic role of market orientation and as a consequence, they opened the black box of relations between strategy and new product development activities. Lu and Yang (2004) showed that the involvement of marketing & research and development (R & D) leads to improvement in new product development activities in order to satisfy customer demands. They indicated that environmental uncertainties, affect organizational structure and performance. Petrick and Echols (2004) presented that companies usually decide on new product development based on pressures, abilities, and investment return rate of each new product. The authors suggest that companies should notice the technological changes that are used in the development of new products. Gehin et al. (2008) combined ideas of NPD with principles from concurrent engineering to develop design aids which permits designers to compare their products to Remanufacturable Product Profiles.
Lynn et al. (1999) studied the key factors required for success of a new product development project. They list 10 factors, including 1) structure of new product development, 2) careful and clear supervision on new product development project team, 3) development and producing a product in a creative time, 4) analysis of product after manufacturing, 5) team-work skills, 6) good market understanding and prediction, 7) management team and its support, 8) use of experience gained from previous projects, 9) reliable project team, 10) experienced team. Kuen et al. (2009) investigate the
Indian Journal of Science and Technology Vol. 4 No. 12 (Dec 2011) ISSN: 0974- 6846
Sci.Technol.Edu. “Fuzzi model for new product development” A.Badizadeh & S.Khanmohammadi Indian Society for Education and Environment (iSee) http://www.indjst.org Indian J.Sci.Technol.
1750
critical factors that influence a successful project among manufacturing companies in Penang, Malaysia. They demonstrated empirically that project personnel competency and project mission are critical factors influencing the micro project success and as for macro project success, top management support and project mission are two main critical factors.
Ebrahim et al. (2010) studied critical factors for new product developments in SMEs virtual team. Lee et al. (2011) examined the key success factors of new product development performance from the perspectives of social capital, leadership, modularity and diversification of project team members. Chang and Chen (2004) studied the influence of variables of the new product that has been developed and supplied to the market successfully. March-Chorada et al. (2002) presented competitive pressure, rate of technological changes, change in customer needs, development objectives, need to increase in market share, short life-cycle, top management pressure, and facile new ideas admission as the factors that push companies to commit new product development. Also, eight factors are introduced as the obstacles for innovation and development of new products. These factors are &) technological uncertainties, 2) increasing cost of innovative projects, 3) lack of top management support, 4) fear of previous failures, 5) conservative behaviors in the market, 6) uncertainty in product admission from market side, 7) product innovation failure rate, 8) problems and issues related to failure of product innovation. Based on this research, three factors of top management support, new product development planning, and market demand analysis are introduced as key success factors of new product development.
Cooper and Kleinschmidt (2007) studied success or failure of new product development by use of 10 measures : 1)success rate, 2) selling, 3) marginal profit, 4) technical success rate, 5)selling effect, 6) profit effect, 7) achieving the organization’s selling objectives, 8) achieving organization’s profitability objective, 9) profitability in comparison to Competitors, and 10) total success vis-à-vis competitors. Noke and Hughes (2010) examined strategies used by firms to reposition through creating a NPD capability. In doing so, they seek to resolve gaps in extant literature on NPD in mature SMEs.
Huang et al. (2002) defined new product development strategy as follows: 1) investment for a new product which includes product development, better product to meet customers’ needs better than competitors’, and concentration and distinction of product, 2) considering market specifications by new product s that includes new market’s features, customers, competitors, and new selling channels, 3) commitment and introducing the company’s technical needs that includes percentage of research and development cost selling and determining research and development direction, 4) admitting the technology features in the new product which includes
complex and advanced technologies and that is compatible closely with research and development resources. Chen et al. (2005) considered how uncertainties affect on new product strategies. The authors present uncertainties as mis-prediction of the environment and inability to predict effects of environmental changes. They suggest that uncertainties can be opportunity or threat for organizations. Their model includes 692 projects. Akova et al. (2003) review the capacity of new product development in the electronic industry in Turkey. They collect data from 28 electronic device manufactures by use of questionnaire. The results show that most of small and big companies in electronic industry in Turkey have certain guidelines for new product development process and its implementation with high efficiency.
Thietart and Xuereb (1997) presented that innovation and new product development project always face some uncertainties in technology, market, and competitors. The research aims at studying the effectiveness of different tools which are used by managers to understand and decrease the complexities and uncertainties in the innovation and new product development project. Nair and Radhadevi (2006) indicated that companies capacity and strength of relations with their shareholders. Soldatos and Hardy (2007) stated that new product development is the most important activity for survival and growth of organizations.
Most researchers have proposed using Multi Criteria Decision Making (MCDM) technique both in the crisp and fuzzy environments. Pun et al. (2010) developed a self-assessment model for measuring new product development performance: an AHP approach. They identified the performance criteria and developing the assessment model for managing NPD in industry. Lin et al. (2008) presented a framework that integrates the analytical hierarchy process (AHP) and the technique for order preference by similarity to ideal solution (TOPSIS) to assist designers in identifying customer requirements and design characteristics, and help achieve an effective evaluation of the final design solution. Feyzoğlu and Büyüközkan (2008) presented an integrated group decision-making approach for new product development using fuzzy Choquet integral. Ho and Tsai (2011) presented a novel approach based on structural equation modeling (SEM) and adaptive neuro-fuzzy inference system (ANFIS) to forecast value innovation and the effects of the quality of the NPD process on NPD performance. Wang (2009) applied the group decision-making scenario to assist business managers to measure the performance of NPD manipulates the heterogeneous integration processes and avoids the information loss effectively. Finally, they demonstrated the result of NPD performance evaluation for a high-technology company in Taiwan. Wei and Chang (2011) proposed a new approach based on fuzzy set theory and multi-criteria group decision making method into a NPD project
Indian Journal of Science and Technology Vol. 4 No. 12 (Dec 2011) ISSN: 0974- 6846
Sci.Technol.Edu. “Fuzzi model for new product development” A.Badizadeh & S.Khanmohammadi Indian Society for Education and Environment (iSee) http://www.indjst.org Indian J.Sci.Technol.
1751
portfolio selection model. Their model takes into account project performance, project delivery and project risk, and formulates the selection decision of NPD project portfolio as a fuzzy linear programming problem.
Generally, after reviewing the literature in NPD strategy evaluation problem, we are unable to find a structured approach for selection of NPD idea with uncertain data. The problem of evaluation and selection of the best NPD idea can be formulated as the MCDM problem. Thus, we propose a new Fuzzy-MCDM method for evaluation and selection of NPD idea in the paper. The proposed model
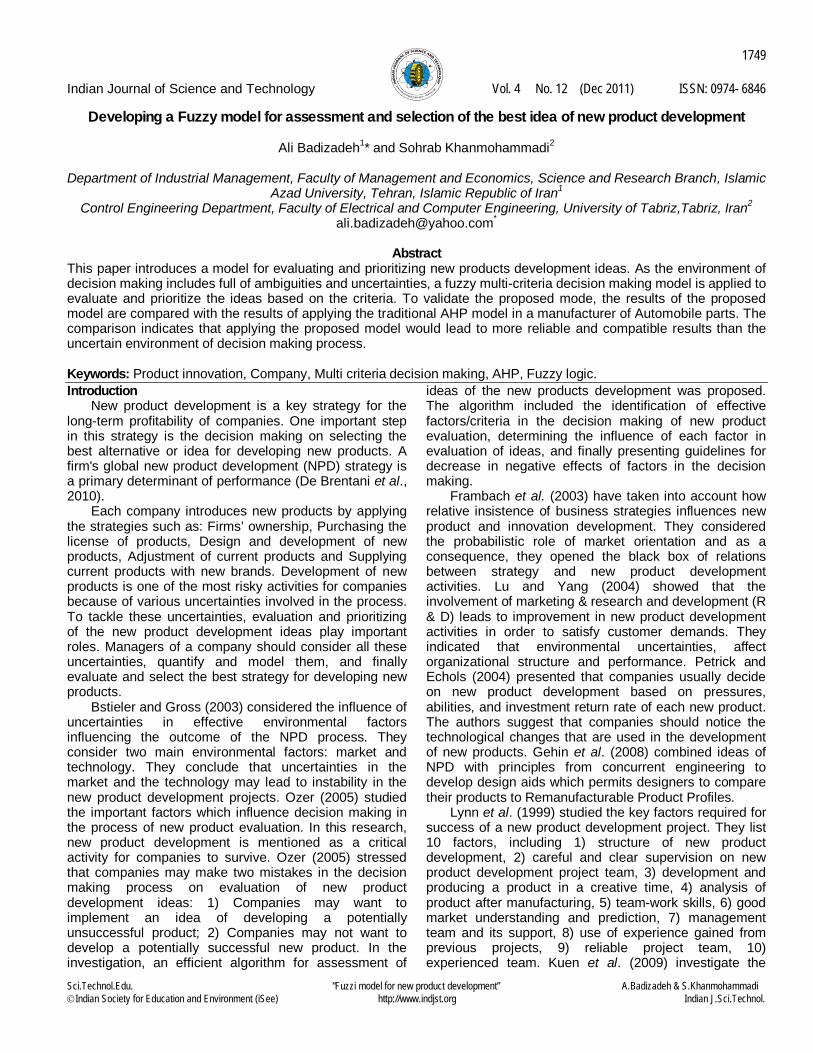
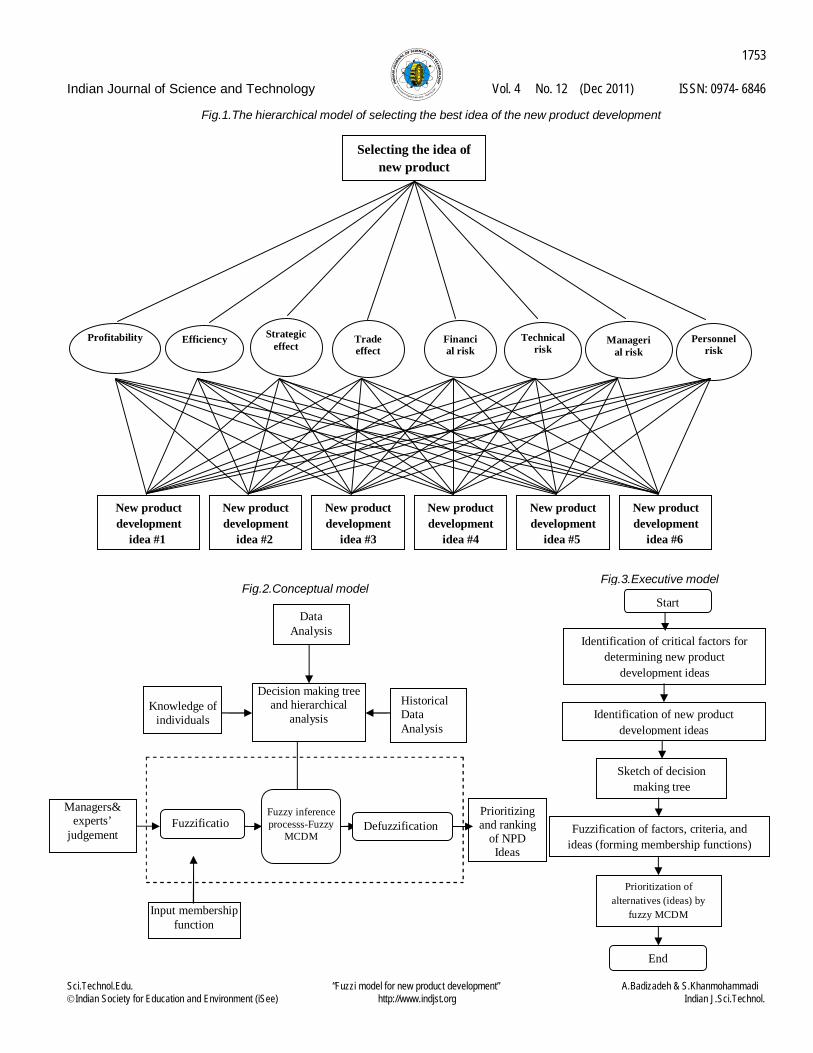
Here, a fuzzy AHP model including fuzzy MCDM is used to determine the best idea for new product development. Comparisons and assigning the weights are completely different from the AHP model proposed by Saaty (1980). The hierarchical model should be able to break the existing complex decision problem into manageable components of different layers/levels (Azadeh et al., 2010). Since fuzzy concept can handle uncertainty, ambiguity and vagueness environments especially in new product development, in this paper a new fuzzy MCDM method is proposed to cover such situation. Fuzzy AHP method has been applied by many researchers for making decision in different fields (e.g. Iranmanesh et al., 2008; Naghadehi et al., 2009; Rezaie et al., 2009 Azadeh et al., 2010; Azadeh et al., 2011). Azadeh et al. (2011) applied fuzzy AHP for assigning productive operators’ in cellular manufacturing systems. Azadeh et al. (2010) used of this approach in evaluating and selecting of simulation software package. Fuzzy AHP is applied for evaluating effective factors of implementing knowledge management by Rezaie et al. (2009); evaluating risk of information technology projects by Iranmanesh et al. (2008); and selecting of optimum underground mining method for Jajarm Bauxite Mine by Naghadehi et al. (2009). In the proposed model, two types of weighting called low-level and high-level are used. Also, because of uncertainties in on hand data, fuzzy logic concepts and fuzzy multi criteria decision making are applied. (Fig.2&3) show the conceptual model and executive model of the proposed model for selecting the best idea of the new product development, respectively. Fig.2 indicates that to rank the ideas of the new product development, eight criteria are defined as profitability, trade effect, strategy effect, efficiency, financial risk, managerial risk, technical risk, and personnel risk. Basically, the mentioned criteria can be classified into two categories: profit and risk. The criteria such as profitability, efficiency, strategic effect (value), and trade effect (value) are grouped into the profit class. On the other hand, the risk class has the criteria such as financial risk, technical risk, managerial risk, and personnel risk.
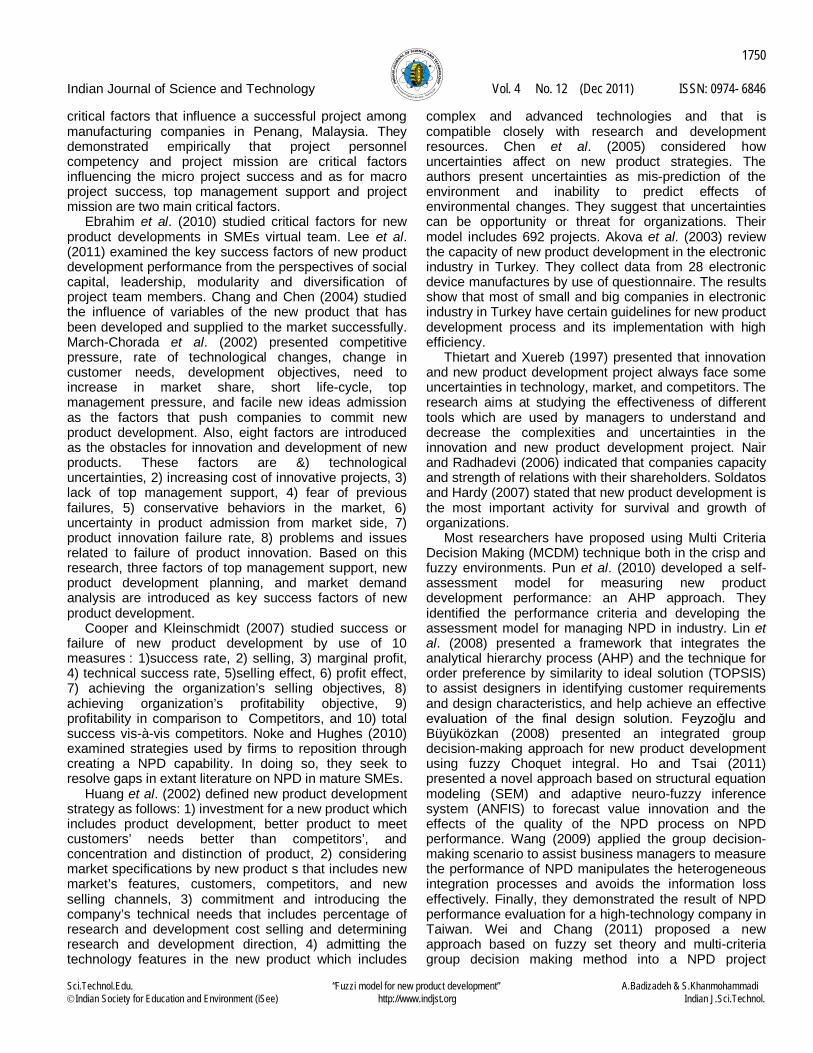
According to the eight criteria, all ideas of the new product development are measured and then, they are ranked. Based on Fig.3, firstly data are gathered and
analyzed. Then, experts answered questionnaires and with collaboration of historical data, decision making tree is sketched. As the there are some uncertainties in the data, the decision making tree should be handled by fuzzy inference system. Membership functions are set for input data. The result of this process is the ranking the NPD ideas to select the best one. Criteria and ideas are determined and decision making tree is provided. Then, the criteria are fuzzified by assigning the membership functions to them. At the end, using the fuzzy MCDM priority of each idea is determined and the best idea is selected. In this paper, ideas for the new product development are identified by literature review and Delphi method.
The tool used for data gathering is the questionnaires which data related to criteria and their importance and the value of idea than each other are collected. In the questionnaires, data are uncertain and linguistics variables “very much (VM), much (M), medium (MD), low (L), very low (VL)” are assigned to each criterion and idea regarding each expert’s preference. To fuzzify the collected data, bell shape membership function is used as follows:
2)(1
1)(cxd
xC
(1)
Where, C and d represent fuzzy value and width of shape (scale factor), respectively. Also, x is the universe set and c is medias (0 for VL, 0.25 for L.). To control the shape of membership function, effectively instead of scale factor, a shape factor S which shows the membership value of border points is used. The value of S is calculated as follows (Khan mohamadi et al. 2000):
44
41
1
]21)10[(1
12
s
dsd
sord
Thus, the membership function is:
2
)(
))(4)4((1
1
cxs
M XC
(2)
Each expert assigns a weight to each criterion. As a number of experts are asked to do that, it is essential to assign just a number to each factor. Thus, average of all weights for a criterion is computed as follows:
Where kip is the weight of criterion i assigned by expert
k. then, by setting C=Wi in equation (2),
pp
Wip
k ki 1
(3)
Indian Journal of Science and Technology Vol. 4 No. 12 (Dec 2011) ISSN: 0974- 6846
Sci.Technol.Edu. “Fuzzi model for new product development” A.Badizadeh & S.Khanmohammadi Indian Society for Education and Environment (iSee) http://www.indjst.org Indian J.Sci.Technol.
1752
2
)(
))(4)4((1
1
cxs
M XC
.
As mentioned in this paper two levels are used for weighting, low-level and high-level. The low-level and high-level weights are calculated by equations (4) and (5), respectively:
pp
wp
k kilil 1
(4)
pp
wp
k kiuiu
1
(5)
Where, kiup and kilp indicate high-level and low-level
weights assigned to factor i by expert k, respectively. Precision of decision maker is calculated by the difference between low-level and high-level weights. In equation (6) s is the shape factor introduced earlier.
iliu wwS (6)
Preferences tables are formed by preference values of factors. To calculate the preference of a criterion than others, linguistic preferences are used for computing the high-level and low-level weights. Fuzzy weights of upper limit and lower limit for each criterion and idea i, are computed by equations (7) and (8):
n
jji
n
jijwiu xk
nxk
nxk
11
)(11),(1max)( (7)
)(xkwiu and )(xkwil show the membership values
of kth element of universe set in the fuzzy weights iuw
and ilw . n indicates the number of criteria or ideas of new
product development )(xkij shows the membership
value of kth element of fuzzy set in linguistic values in the ith row and jth column of preference table. Decision making for this problem, based on Figure 2 which indicates the conceptual model, is done regarding the criteria and alternatives in a hierarchical manner. Firstly, importance of main criteria is calculated by preferences table. Then, low-level and high-level weights of each criterion are assigned by equations (7) and (8). Afterwards, membership functions of main criteria and sub-criteria are set by equations (1) and (2).Then fuzzy
relationships are used to calculate the importance of criteria as follows:
)(),(min),(),( yxyxyx BABAR (9)
),...2,1(,...,2,1, mwcnmwcmwcCriteria nii
Then, importance of ideas is calculated by use of criteria, preferences tables and linguistic values. The low-level and high-level weights of alternatives are computed by equations (7) and (8). The importance of alternatives is shown in niiUtility ,...,2,1, matrix as follows:
mwancmmwancmwanc
cmmwacmwacmwacmmwacmwacmwa
Utility nii
...21..................2...22121...2111
,...,2,1,
For ranking the alternatives, fuzzy MCDM is used. Case study: Experiment and results
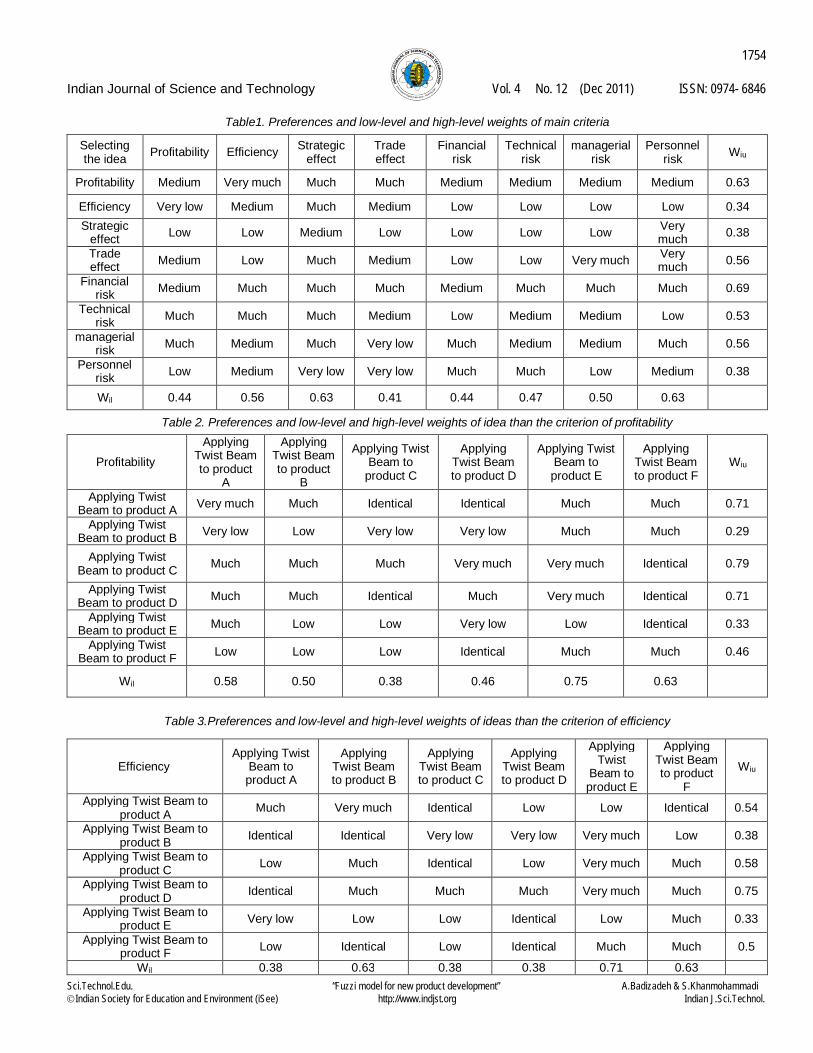
To validate the proposed model, a company dependent to an automobile manufacturing industry in Iran is considered. Data are collected from top managers and experts in the R&D, engineering, finance and trade departments who are involved in the new product development processes. 20 questionnaires were distributed between these experts and managers. The corresponding company intends to apply a new idea called Twist Beam to its new products. According to Fig.1 to 3, different ideas of new product development are ranked. The ranking is performed using the determined criteria. Table.1 indicates the preferences of each of criteria in association with the object of the model (selecting the best idea). All calculations of low-level and high-level weights have been carried out according to the conceptual model sketched in Fig. 2.
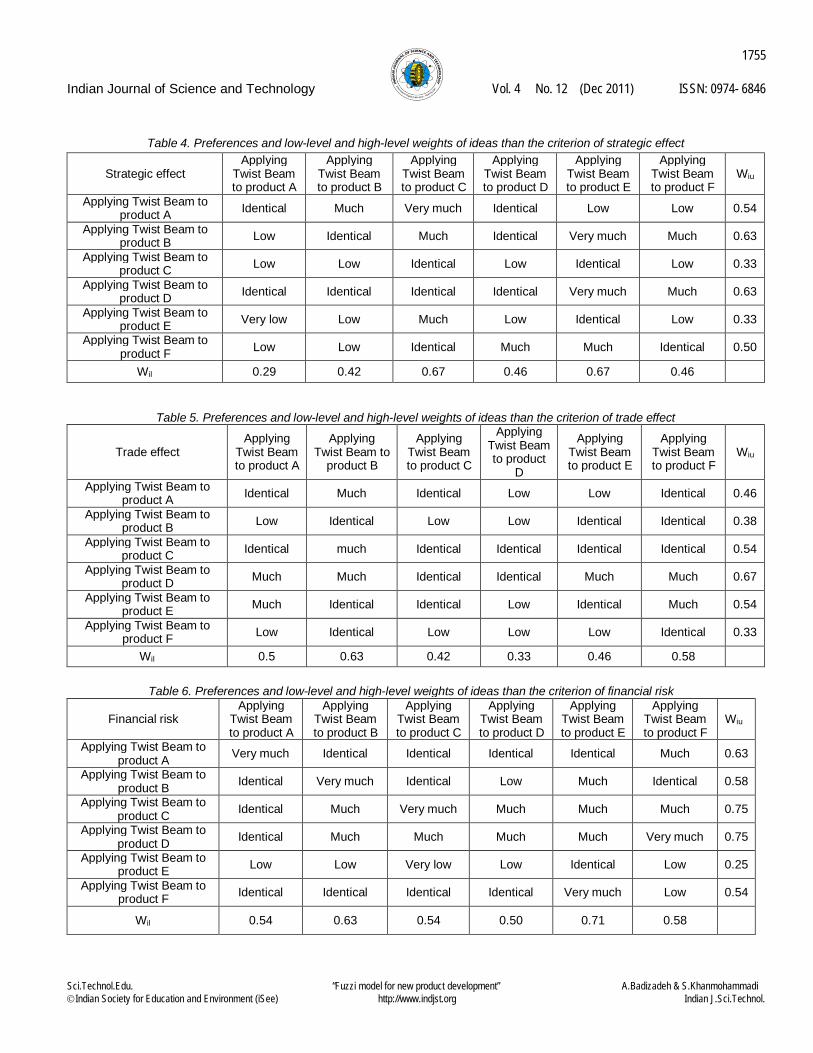
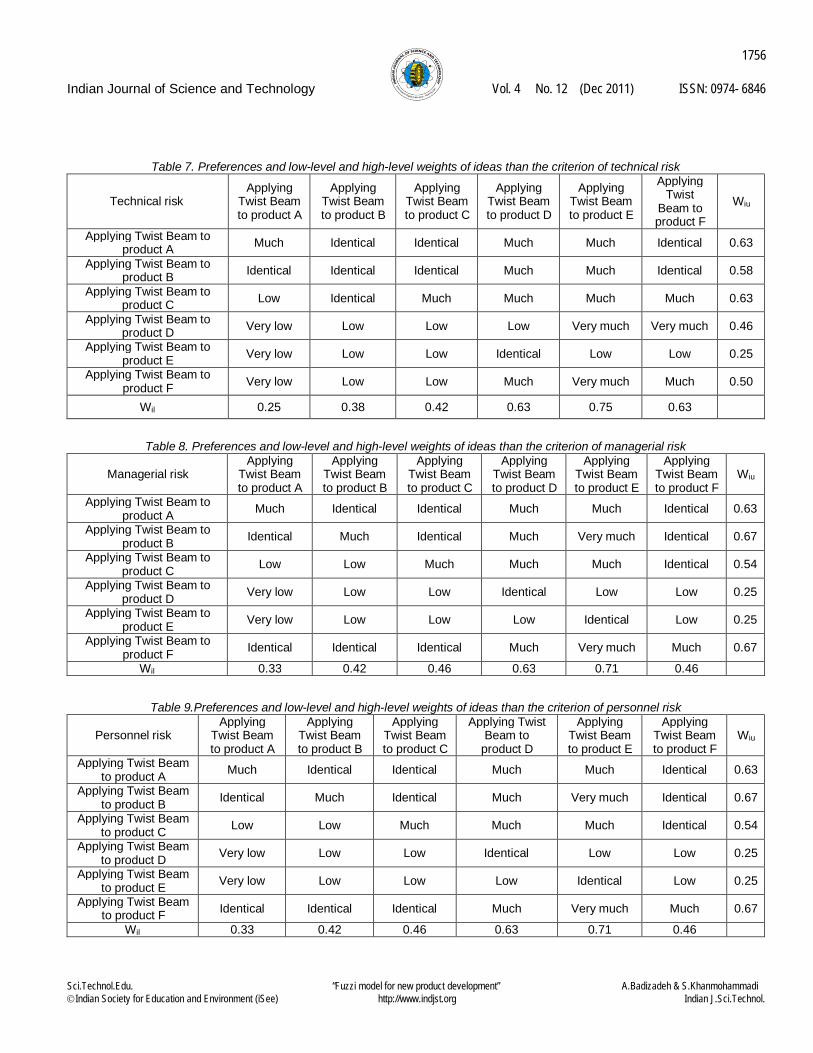
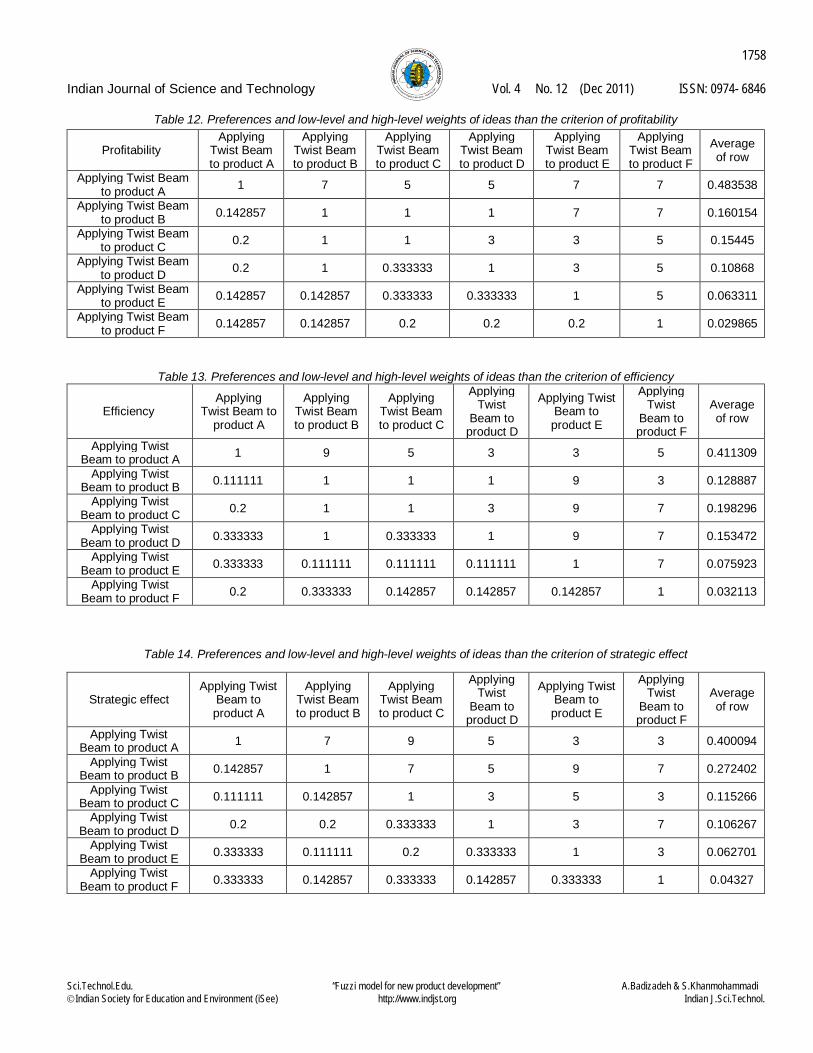
According to Fig.1, preferences and low-level and high-level weights of each idea than each criterion are
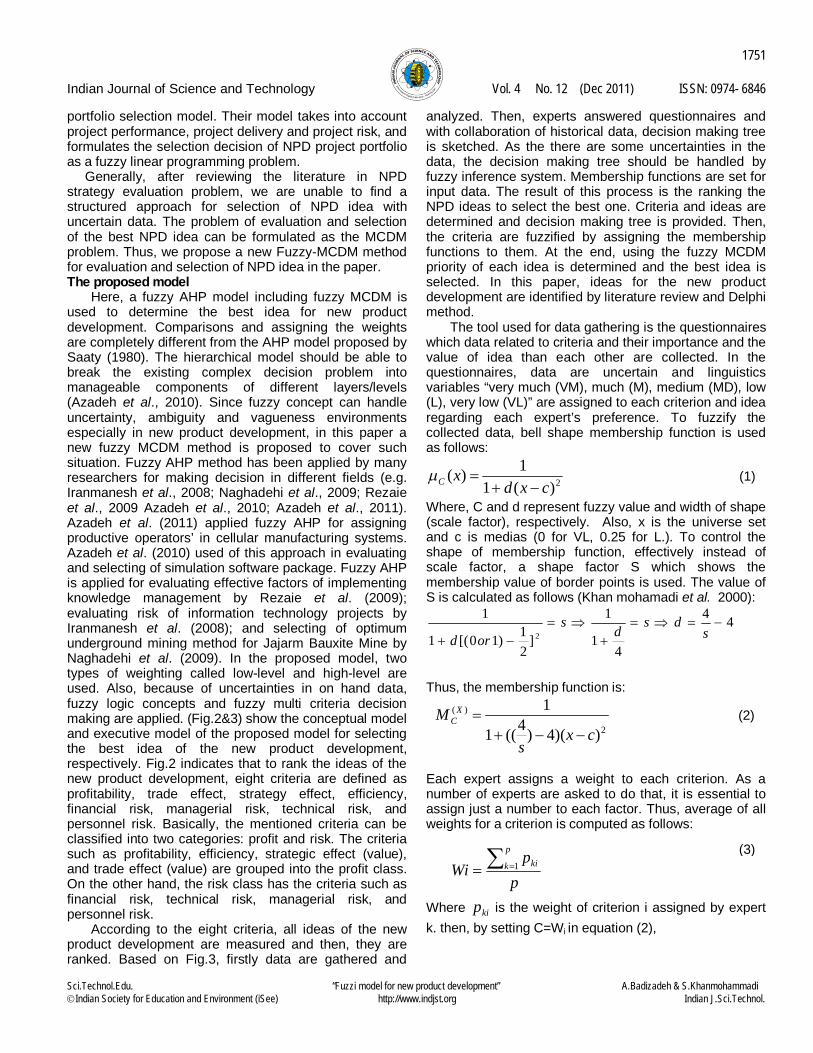
mentioned in following Tables 2 to 9. It should be mentioned that the preferences and high- and low-level weights are used to determine the fuzzy membership functions of idea. After determination of preferences and low-level and high-level weights of ideas than the eight criteria, the ideas should be prioritized. The calculation of priority of ideas is done using the fuzzy multi-criteria decision making method. Prioritization of ideas is performed regarding the W1 and utility matrixes. W1 matrixes include the eight criteria which four of them (financial, technical, managerial and personnel risks) have the negative effect. Utility matrix indicates the preferences of ideas than different criteria. The results of prioritization of ideas using FMCDM are shown in Table.10 and Fig. 4 .
n
jji
n
jijwil xk
nxk
nxk
11
)(11),(1min)(
(8)
Indian Journal of Science and Technology Vol. 4 No. 12 (Dec 2011) ISSN: 0974- 6846
Sci.Technol.Edu. “Fuzzi model for new product development” A.Badizadeh & S.Khanmohammadi Indian Society for Education and Environment (iSee) http://www.indjst.org Indian J.Sci.Technol.
1753
Profitability Efficiency Strategic effect
Trade effect
Financial risk
Technical risk
Managerial risk
Personnel risk
Selecting the idea of new product
New product development
idea #5
New product development
idea #6
New product development
idea #4
New product development
idea #3
New product development
idea #2
New product development
idea #1
Fig.1.The hierarchical model of selecting the best idea of the new product development
Start
Identification of critical factors for determining new product
development ideas
Identification of new product development ideas
Sketch of decision making tree
Fuzzification of factors, criteria, and ideas (forming membership functions)
Prioritization of alternatives (ideas) by
fuzzy MCDM
End
Fig.3.Executive model Fig.2.Conceptual model
Decision making tree and hierarchical
analysis Historical Data Analysis
Knowledge of
individuals
Data Analysis
Fuzzy inference processs-Fuzzy
MCDM
Prioritizing and ranking
of NPD Ideas
Input membership function
Fuzzification
Managers& experts’
judgement Defuzzification
Indian Journal of Science and Technology Vol. 4 No. 12 (Dec 2011) ISSN: 0974- 6846
Sci.Technol.Edu. “Fuzzi model for new product development” A.Badizadeh & S.Khanmohammadi Indian Society for Education and Environment (iSee) http://www.indjst.org Indian J.Sci.Technol.
1754
Table1. Preferences and low-level and high-level weights of main criteria
Wiu Personnel
risk managerial
risk Technical
risk Financial
risk Trade effect
Strategic effect
Efficiency Profitability Selecting the idea
0.63 Medium Medium Medium Medium Much Much Very much Medium Profitability
0.34 Low Low Low Low Medium Much Medium Very low Efficiency
0.38 Very much Low Low Low Low Medium Low Low Strategic
effect
0.56 Very much Very much Low Low Medium Much Low Medium Trade
effect
0.69 Much Much Much Medium Much Much Much Medium Financial risk
0.53 Low Medium Medium Low Medium Much Much Much Technical risk
0.56 Much Medium Medium Much Very low Much Medium Much managerial risk
0.38 Medium Low Much Much Very low Very low Medium Low Personnel risk
0.63 0.50 0.47 0.44 0.41 0.63 0.56 0.44 Wil
Table 2. Preferences and low-level and high-level weights of idea than the criterion of profitability
Wiu Applying
Twist Beam to product F
Applying Twist Beam to product E
Applying Twist Beam to product D
Applying Twist Beam to
product C
Applying Twist Beam to product
B
Applying Twist Beam to product
A
Profitability
0.71 Much Much Identical Identical Much Very much Applying Twist Beam to product A
0.29 Much Much Very low Very low Low Very low Applying Twist Beam to product B
0.79 Identical Very much Very much Much Much Much Applying Twist Beam to product C
0.71 Identical Very much Much Identical Much Much Applying Twist Beam to product D
0.33 Identical Low Very low Low Low Much Applying Twist Beam to product E
0.46 Much Much Identical Low Low Low Applying Twist Beam to product F
0.63 0.75 0.46 0.38 0.50 0.58 Wil
Table 3.Preferences and low-level and high-level weights of ideas than the criterion of efficiency
Wiu
Applying Twist Beam to product
F
Applying Twist
Beam to product E
Applying Twist Beam to product D
Applying Twist Beam to product C
Applying Twist Beam to product B
Applying Twist Beam to product A
Efficiency
0.54 Identical Low Low Identical Very much Much Applying Twist Beam to product A
0.38 Low Very much Very low Very low Identical Identical Applying Twist Beam to product B
0.58 Much Very much Low Identical Much Low Applying Twist Beam to product C
0.75 Much Very much Much Much Much Identical Applying Twist Beam to product D
0.33 Much Low Identical Low Low Very low Applying Twist Beam to product E
0.5 Much Much Identical Low Identical Low Applying Twist Beam to product F
0.63 0.71 0.38 0.38 0.63 0.38 Wil
Indian Journal of Science and Technology Vol. 4 No. 12 (Dec 2011) ISSN: 0974- 6846
Sci.Technol.Edu. “Fuzzi model for new product development” A.Badizadeh & S.Khanmohammadi Indian Society for Education and Environment (iSee) http://www.indjst.org Indian J.Sci.Technol.
1755
Table 4. Preferences and low-level and high-level weights of ideas than the criterion of strategic effect
Wiu Applying
Twist Beam to product F
Applying Twist Beam to product E
Applying Twist Beam to product D
Applying Twist Beam to product C
Applying Twist Beam to product B
Applying Twist Beam to product A
Strategic effect
0.54 Low Low Identical Very much Much Identical Applying Twist Beam to product A
0.63 Much Very much Identical Much Identical Low Applying Twist Beam to product B
0.33 Low Identical Low Identical Low Low Applying Twist Beam to product C
0.63 Much Very much Identical Identical Identical Identical Applying Twist Beam to product D
0.33 Low Identical Low Much Low Very low Applying Twist Beam to product E
0.50 Identical Much Much Identical Low Low Applying Twist Beam to
product F
0.46 0.67 0.46 0.67 0.42 0.29 Wil
Table 5. Preferences and low-level and high-level weights of ideas than the criterion of trade effect
Wiu Applying
Twist Beam to product F
Applying Twist Beam to product E
Applying Twist Beam to product
D
Applying Twist Beam to product C
Applying Twist Beam to
product B
Applying Twist Beam to product A
Trade effect
0.46 Identical Low Low Identical Much Identical Applying Twist Beam to product A
0.38 Identical Identical Low Low Identical Low Applying Twist Beam to product B
0.54 Identical Identical Identical Identical much Identical Applying Twist Beam to product C
0.67 Much Much Identical Identical Much Much Applying Twist Beam to product D
0.54 Much Identical Low Identical Identical Much Applying Twist Beam to product E
0.33 Identical Low Low Low Identical Low Applying Twist Beam to product F
0.58 0.46 0.33 0.42 0.63 0.5 Wil
Table 6. Preferences and low-level and high-level weights of ideas than the criterion of financial risk
Wiu Applying
Twist Beam to product F
Applying Twist Beam to product E
Applying Twist Beam to product D
Applying Twist Beam to product C
Applying Twist Beam to product B
Applying Twist Beam to product A
Financial risk
0.63 Much Identical Identical Identical Identical Very much Applying Twist Beam to product A
0.58 Identical Much Low Identical Very much Identical Applying Twist Beam to product B
0.75 Much Much Much Very much Much Identical Applying Twist Beam to product C
0.75 Very much Much Much Much Much Identical Applying Twist Beam to product D
0.25 Low Identical Low Very low Low Low Applying Twist Beam to product E
0.54 Low Very much Identical Identical Identical Identical Applying Twist Beam to product F
0.58 0.71 0.50 0.54 0.63 0.54 Wil
Indian Journal of Science and Technology Vol. 4 No. 12 (Dec 2011) ISSN: 0974- 6846
Sci.Technol.Edu. “Fuzzi model for new product development” A.Badizadeh & S.Khanmohammadi Indian Society for Education and Environment (iSee) http://www.indjst.org Indian J.Sci.Technol.
1756
Table 7. Preferences and low-level and high-level weights of ideas than the criterion of technical risk
Wiu
Applying Twist
Beam to product F
Applying Twist Beam to product E
Applying Twist Beam to product D
Applying Twist Beam to product C
Applying Twist Beam to product B
Applying Twist Beam to product A
Technical risk
0.63 Identical Much Much Identical Identical Much Applying Twist Beam to product A
0.58 Identical Much Much Identical Identical Identical Applying Twist Beam to product B
0.63 Much Much Much Much Identical Low Applying Twist Beam to product C
0.46 Very much Very much Low Low Low Very low Applying Twist Beam to product D
0.25 Low Low Identical Low Low Very low Applying Twist Beam to
product E
0.50 Much Very much Much Low Low Very low Applying Twist Beam to
product F
0.63 0.75 0.63 0.42 0.38 0.25 Wil
Table 8. Preferences and low-level and high-level weights of ideas than the criterion of managerial risk
Wiu Applying
Twist Beam to product F
Applying Twist Beam to product E
Applying Twist Beam to product D
Applying Twist Beam to product C
Applying Twist Beam to product B
Applying Twist Beam to product A
Managerial risk
0.63 Identical Much Much Identical Identical Much Applying Twist Beam to product A
0.67 Identical Very much Much Identical Much Identical Applying Twist Beam to product B
0.54 Identical Much Much Much Low Low Applying Twist Beam to product C
0.25 Low Low Identical Low Low Very low Applying Twist Beam to product D
0.25 Low Identical Low Low Low Very low Applying Twist Beam to product E
0.67 Much Very much Much Identical Identical Identical Applying Twist Beam to product F
0.46 0.71 0.63 0.46 0.42 0.33 Wil
Table 9.Preferences and low-level and high-level weights of ideas than the criterion of personnel risk
Wiu Applying
Twist Beam to product F
Applying Twist Beam to product E
Applying Twist Beam to
product D
Applying Twist Beam to product C
Applying Twist Beam to product B
Applying Twist Beam to product A
Personnel risk
0.63 Identical Much Much Identical Identical Much Applying Twist Beam to product A
0.67 Identical Very much Much Identical Much Identical Applying Twist Beam to product B
0.54 Identical Much Much Much Low Low Applying Twist Beam to product C
0.25 Low Low Identical Low Low Very low Applying Twist Beam to product D
0.25 Low Identical Low Low Low Very low Applying Twist Beam to product E
0.67 Much Very much Much Identical Identical Identical Applying Twist Beam to product F
0.46 0.71 0.63 0.46 0.42 0.33 Wil

Indian Journal of Science and Technology Vol. 4 No. 12 (Dec 2011) ISSN: 0974- 6846
Sci.Technol.Edu. “Fuzzi model for new product development” A.Badizadeh & S.Khanmohammadi Indian Society for Education and Environment (iSee) http://www.indjst.org Indian J.Sci.Technol.
1757
To validate the results of prioritization of product development ideas using the proposed model, the ideas are prioritized by applying the analytic hierarchy process method developed by Saaty (1980). Table.11 indicates the pair comparison and weights of the eight criteria on the product development ideas. The last column on Table 11 indicates the effect of each criterion on the product development ideas.
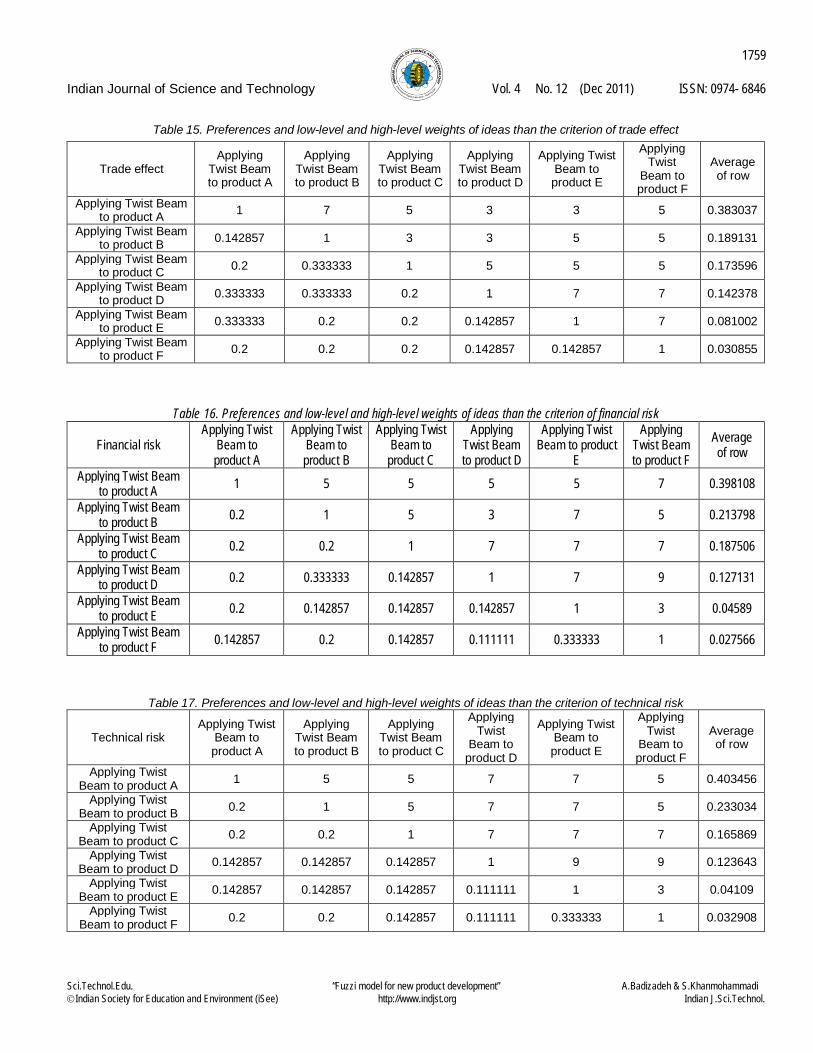
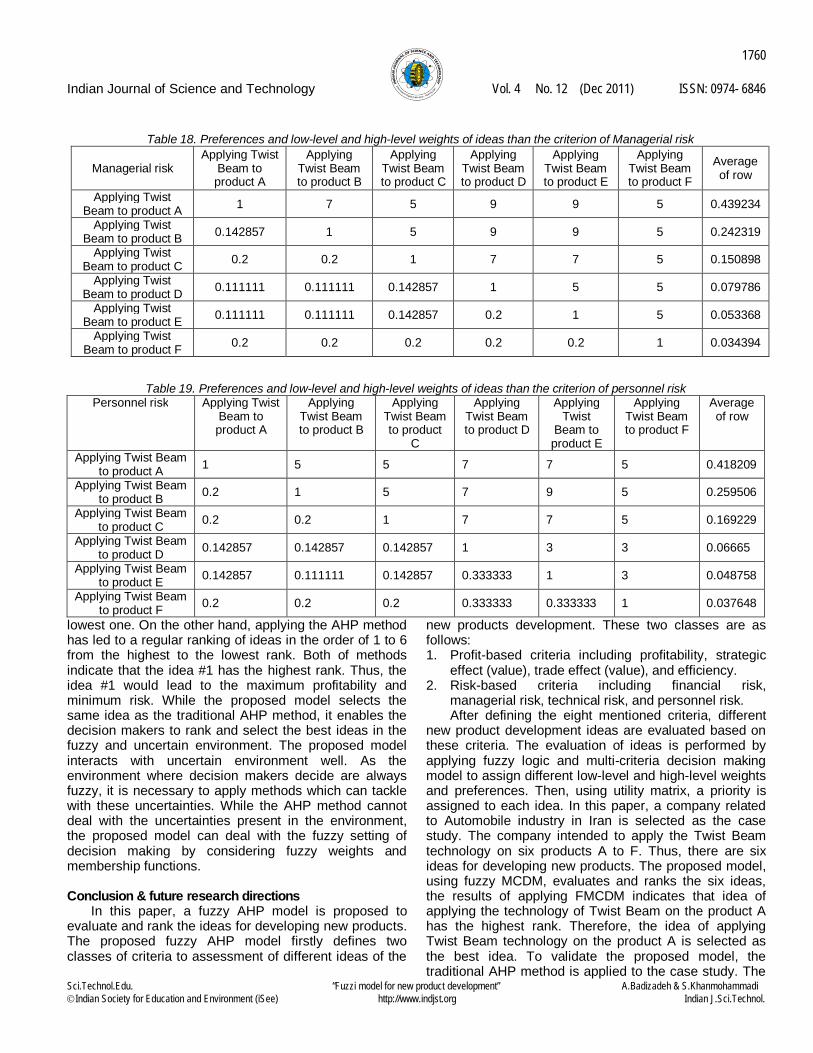
After determining the weights of each criterion on the product development ideas, preferences and the low-level and high-level weights of each criterion should be calculated. The results of preferences and low-level and high level weights are shown in Table 12 to 19. To prioritize the ideas of the product development, above tables and utility matrix are used. The utility matrix used for prioritizing the ideas using the AHP method and the priority of ideas are as follows:
]023.0044.0054.011.12.117.168.359.[Criteria
0376.00343.003290.00275.00308.00432.00321.0029.00487.00533.004109.00458.0081.00627.00759.006.0066.00797.0123.127.142.106.153.10.169.1508.165.187.173.115.198.15.259.242.233.213.189.27.128.16.418.439.403.398.383.40.411.48.
Utility
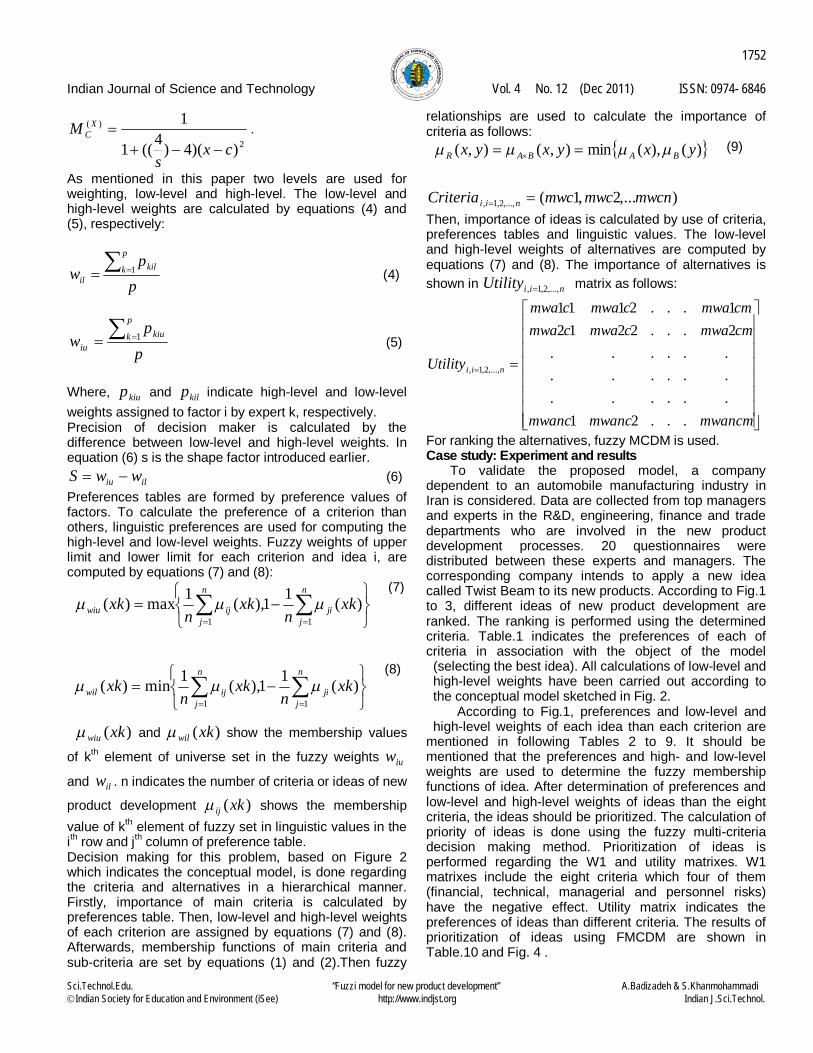
Fig.5. graphically shows the priority of different ideas of the new product development using the AHP method. Based on this figure, idea #1 has the highest rank in developing the new products.
After applying the proposed model and the MCDM method to determine and rank the ideas of the new products development, their results are compared with each other. The comparison of the results of AHP and the proposed model indicates the two methods have led to different ranking. In the proposed model, the order of ideas is # 1, 4, 2, 6, 3 and 5 from the highest rank to the
Table 11. Pair comparison and weights of each effective criterion on the product development ideas
Average of row
Personnel risk
managerial risk
Technical risk
Financial risk
Trade effect
Strategic effect
Efficiency Profitability Product
development idea
0.359577 5 5 5 5 7 7 9 1 Profitability 0.168029 3 3 3 3 5 7 1 0.111111 Efficiency 0.117294 9 3 3 3 3 1 0.142857 0.142857 Strategic effect 0.120665 9 9 3 3 1 0.333333 0.2 0.142857 Trade effect 0.11317 7 7 7 1 0.333333 0.333333 0.333333 0.2 Financial risk 0.054035 3 5 1 0.142857 0.333333 0.333333 0.333333 0.2 Technical risk
0.04423 7 1 0.2 0.142857 0.111111 0.333333 0.333333 0.2 managerial risk
0.023002 1 0.1428570.333333 0.142857 0.111111 0.111111 0.333333 0.2 Personnel risk
Table 10. Results of prioritization of ideas using the FMCDM method
Priority Priority 1 Priority 2 Priority 3 Priority 4 Priority 5 Priority 6
Idea Idea #1 Idea #4 Idea #2 Idea #6 Idea #3 Idea #5
Weight 0.5323 0.5322 0.5233 0.5186 0.5034 0.5
Fig.4.Graph showing the priority of ideas using the FMCDM method
1 2 3 4 5 60
0.05
0.1
0.15
0.2
0.25
0.3
0.35
0.4
0.45
New Product Development Ideas Priority
Wei
ghet
s
Fig.5.Graph showing the priority of the new product development ideas using the AHP
Indian Journal of Science and Technology Vol. 4 No. 12 (Dec 2011) ISSN: 0974- 6846
Sci.Technol.Edu. “Fuzzi model for new product development” A.Badizadeh & S.Khanmohammadi Indian Society for Education and Environment (iSee) http://www.indjst.org Indian J.Sci.Technol.
1758
Table 12. Preferences and low-level and high-level weights of ideas than the criterion of profitability
Average of row
Applying Twist Beam to product F
Applying Twist Beam to product E
Applying Twist Beam to product D
Applying Twist Beam to product C
Applying Twist Beam to product B
Applying Twist Beam to product A
Profitability
0.483538 7 7 5 5 7 1 Applying Twist Beam
to product A
0.160154 7 7 1 1 1 0.142857 Applying Twist Beam
to product B
0.15445 5 3 3 1 1 0.2 Applying Twist Beam to product C
0.10868 5 3 1 0.333333 1 0.2 Applying Twist Beam to product D
0.063311 5 1 0.333333 0.333333 0.142857 0.142857 Applying Twist Beam to product E
0.029865 1 0.2 0.2 0.2 0.142857 0.142857 Applying Twist Beam to product F
Table 13. Preferences and low-level and high-level weights of ideas than the criterion of efficiency
Average of row
Applying Twist
Beam to product F
Applying Twist Beam to product E
Applying Twist
Beam to product D
Applying Twist Beam to product C
Applying Twist Beam to product B
Applying Twist Beam to
product A Efficiency
0.411309 5 3 3 5 9 1 Applying Twist Beam to product A
0.128887 3 9 1 1 1 0.111111 Applying Twist Beam to product B
0.198296 7 9 3 1 1 0.2 Applying Twist
Beam to product C
0.153472 7 9 1 0.333333 1 0.333333 Applying Twist
Beam to product D
0.075923 7 1 0.111111 0.111111 0.111111 0.333333 Applying Twist
Beam to product E
0.032113 1 0.142857 0.142857 0.142857 0.333333 0.2 Applying Twist
Beam to product F
Table 14. Preferences and low-level and high-level weights of ideas than the criterion of strategic effect
Average of row
Applying Twist
Beam to product F
Applying Twist Beam to product E
Applying Twist
Beam to product D
Applying Twist Beam to product C
Applying Twist Beam to product B
Applying Twist Beam to product A
Strategic effect
0.400094 3 3 5 9 7 1 Applying Twist Beam to product A
0.272402 7 9 5 7 1 0.142857 Applying Twist Beam to product B
0.115266 3 5 3 1 0.142857 0.111111 Applying Twist Beam to product C
0.106267 7 3 1 0.333333 0.2 0.2 Applying Twist
Beam to product D
0.062701 3 1 0.333333 0.2 0.111111 0.333333 Applying Twist
Beam to product E
0.04327 1 0.333333 0.142857 0.333333 0.142857 0.333333 Applying Twist
Beam to product F
Indian Journal of Science and Technology Vol. 4 No. 12 (Dec 2011) ISSN: 0974- 6846
Sci.Technol.Edu. “Fuzzi model for new product development” A.Badizadeh & S.Khanmohammadi Indian Society for Education and Environment (iSee) http://www.indjst.org Indian J.Sci.Technol.
1759
Table 15. Preferences and low-level and high-level weights of ideas than the criterion of trade effect
Average of row
Applying Twist
Beam to product F
Applying Twist Beam to product E
Applying Twist Beam to product D
Applying Twist Beam to product C
Applying Twist Beam to product B
Applying Twist Beam to product A
Trade effect
0.383037 5 3 3 5 7 1 Applying Twist Beam to product A
0.189131 5 5 3 3 1 0.142857 Applying Twist Beam to product B
0.173596 5 5 5 1 0.333333 0.2 Applying Twist Beam to product C
0.142378 7 7 1 0.2 0.333333 0.333333 Applying Twist Beam to product D
0.081002 7 1 0.142857 0.2 0.2 0.333333 Applying Twist Beam to product E
0.030855 1 0.142857 0.142857 0.2 0.2 0.2 Applying Twist Beam to product F
Table 17. Preferences and low-level and high-level weights of ideas than the criterion of technical risk
Average of row
Applying Twist
Beam to product F
Applying Twist Beam to product E
Applying Twist
Beam to product D
Applying Twist Beam to product C
Applying Twist Beam to product B
Applying Twist Beam to product A
Technical risk
0.403456 5 7 7 5 5 1 Applying Twist
Beam to product A
0.233034 5 7 7 5 1 0.2 Applying Twist
Beam to product B
0.165869 7 7 7 1 0.2 0.2 Applying Twist
Beam to product C
0.123643 9 9 1 0.142857 0.142857 0.142857 Applying Twist Beam to product D
0.04109 3 1 0.111111 0.142857 0.142857 0.142857 Applying Twist Beam to product E
0.032908 1 0.333333 0.111111 0.142857 0.2 0.2 Applying Twist Beam to product F
Table 16. Preferences and low-level and high-level weights of ideas than the criterion of financial risk
Average of row
Applying Twist Beam to product F
Applying Twist Beam to product
E
Applying Twist Beam to product D
Applying Twist Beam to
product C
Applying Twist Beam to product B
Applying Twist Beam to product A
Financial risk
0.398108 7 5 5 5 5 1 Applying Twist Beam to product A
0.213798 5 7 3 5 1 0.2 Applying Twist Beam to product B
0.187506 7 7 7 1 0.2 0.2 Applying Twist Beam to product C
0.127131 9 7 1 0.142857 0.333333 0.2 Applying Twist Beam to product D
0.04589 3 1 0.142857 0.142857 0.142857 0.2 Applying Twist Beam to product E
0.027566 1 0.333333 0.111111 0.142857 0.2 0.142857 Applying Twist Beam to product F
Indian Journal of Science and Technology Vol. 4 No. 12 (Dec 2011) ISSN: 0974- 6846
Sci.Technol.Edu. “Fuzzi model for new product development” A.Badizadeh & S.Khanmohammadi Indian Society for Education and Environment (iSee) http://www.indjst.org Indian J.Sci.Technol.
1760
lowest one. On the other hand, applying the AHP method has led to a regular ranking of ideas in the order of 1 to 6 from the highest to the lowest rank. Both of methods indicate that the idea #1 has the highest rank. Thus, the idea #1 would lead to the maximum profitability and minimum risk. While the proposed model selects the same idea as the traditional AHP method, it enables the decision makers to rank and select the best ideas in the fuzzy and uncertain environment. The proposed model interacts with uncertain environment well. As the environment where decision makers decide are always fuzzy, it is necessary to apply methods which can tackle with these uncertainties. While the AHP method cannot deal with the uncertainties present in the environment, the proposed model can deal with the fuzzy setting of decision making by considering fuzzy weights and membership functions. Conclusion & future research directions
In this paper, a fuzzy AHP model is proposed to evaluate and rank the ideas for developing new products. The proposed fuzzy AHP model firstly defines two classes of criteria to assessment of different ideas of the
new products development. These two classes are as follows: 1. Profit-based criteria including profitability, strategic
effect (value), trade effect (value), and efficiency. 2. Risk-based criteria including financial risk,
managerial risk, technical risk, and personnel risk. After defining the eight mentioned criteria, different
new product development ideas are evaluated based on these criteria. The evaluation of ideas is performed by applying fuzzy logic and multi-criteria decision making model to assign different low-level and high-level weights and preferences. Then, using utility matrix, a priority is assigned to each idea. In this paper, a company related to Automobile industry in Iran is selected as the case study. The company intended to apply the Twist Beam technology on six products A to F. Thus, there are six ideas for developing new products. The proposed model, using fuzzy MCDM, evaluates and ranks the six ideas, the results of applying FMCDM indicates that idea of applying the technology of Twist Beam on the product A has the highest rank. Therefore, the idea of applying Twist Beam technology on the product A is selected as the best idea. To validate the proposed model, the traditional AHP method is applied to the case study. The
Table 18. Preferences and low-level and high-level weights of ideas than the criterion of Managerial risk
Average of row
Applying Twist Beam to product F
Applying Twist Beam to product E
Applying Twist Beam to product D
Applying Twist Beam to product C
Applying Twist Beam to product B
Applying Twist Beam to product A
Managerial risk
0.439234 5 9 9 5 7 1 Applying Twist
Beam to product A
0.242319 5 9 9 5 1 0.142857 Applying Twist
Beam to product B
0.150898 5 7 7 1 0.2 0.2 Applying Twist Beam to product C
0.079786 5 5 1 0.142857 0.111111 0.111111 Applying Twist Beam to product D
0.053368 5 1 0.2 0.142857 0.111111 0.111111 Applying Twist Beam to product E
0.034394 1 0.2 0.2 0.2 0.2 0.2 Applying Twist Beam to product F
Table 19. Preferences and low-level and high-level weights of ideas than the criterion of personnel risk Average of row
Applying Twist Beam to product F
Applying Twist
Beam to product E
Applying Twist Beam to product D
Applying Twist Beam to product
C
Applying Twist Beam to product B
Applying Twist Beam to product A
Personnel risk
0.418209 5 7 7 5 5 1 Applying Twist Beam
to product A
0.259506 5 9 7 5 1 0.2 Applying Twist Beam to product B
0.169229 5 7 7 1 0.2 0.2 Applying Twist Beam to product C
0.06665 3 3 1 0.142857 0.142857 0.142857 Applying Twist Beam to product D
0.048758 3 1 0.333333 0.142857 0.111111 0.142857 Applying Twist Beam to product E
0.037648 1 0.333333 0.333333 0.2 0.2 0.2 Applying Twist Beam to product F
Indian Journal of Science and Technology Vol. 4 No. 12 (Dec 2011) ISSN: 0974- 6846
Sci.Technol.Edu. “Fuzzi model for new product development” A.Badizadeh & S.Khanmohammadi Indian Society for Education and Environment (iSee) http://www.indjst.org Indian J.Sci.Technol.
1761
results of applying the traditional AHP shows the same selection of product A but it ranks the ideas different from the proposed model. In fact, the proposed model and the AHP model rank the ideas as follows: Fuzzy AHP (The proposed model): Idea #1, Idea #4, Idea #2, Idea #6, Idea #3, Idea #5; The traditional AHP model: Idea #1, Idea #2, Idea #3, Idea #4, Idea #5, Idea #6. The decision making about the selection of the best idea of new product development is always performed in the fuzzy environment. Therefore, always there are numerous uncertainties in the decision making process. These uncertainties come from the large number ideas, unknown states and variables affecting the decisions, unclear relations between variables and criteria, and so on. Therefore, it is necessarily suggested to decision makers to apply methods which are more compatible with such environments. As the FMCDM method considers fuzzy and uncertain nature of the decision making process, it will be more reliable in such environment. In other words, considering the fuzziness by applying membership function reduces the uncertainty and involves it in the process of decision making better. Thus, the proposed model which applies fuzzy MCDM would result in better and more reliable ranking of ideas. Regarding the merits of the proposed model, applying it to other case studies would test it more and different aspects of it including advantage s and disadvantages will get clearer. Therefore, applying the proposed model on other case studies is a valuable future research line. References 1. Akova B, Ulusoy G, Payzın E and Kayla AR (2003)
An integrated new product development model for the Turkish electronics industry. Working Paper, Bogazici University, Istanbul, 2003.
2. Azadeh A, Nazari-Shirkouhi S, Hatami-Shirkouhi L and Ansarinejad A (2011) A unique fuzzy multi-criteria decision making: computer simulation approach for productive operators’ assignment in cellular manufacturing systems with uncertainty and vagueness. Intl. J. Adv. Manufacturing Technol. 6(1-4), 329-343.
3. Azadeh A, Shirkouhi SN and Rezaie K (2010) A robust decision-making methodology for evaluation and selection of simulation software package. Intl. J. Adv.Manufacturing Technol. 47(1), 381–393.
4. Bstieler L and Gross CW (2003) Measuring the effect of environmental uncertainty on process activities, project team characteristics, and new product success. J. Business & Industrial Marketing. 18(2), 146–161.
5. Chang P and Chen K (2004) The influence of input factors on new leading product development projects in Taiwan. Intl. J. Project Management. 22(5), 415-423.
6. Chen J, Reilly RR and Lynn GS (2005) Uncertainty: Is it a threat or opportunity for new product development
teams? Wesley J. Howe School of Technology Management Stevens Institute of Technology. Institute for the Study of Business Markets The Pennsylvania State University.
7. Cooper RG and Kleinschmidt EJ (2007) Winning businesses in product development: The critical success factors. Res. Technol. Mgt. 50(3), 52–66.
8. De Brentani U, Kleinschmidt EJ and Salomo S (2010) Success in global new product development: Impact of strategy and the behavioral environment of the firm. J. Product Innovation Mgt. 27(2), 143-160.
9. Ebrahim NA, Ahmed S and Taha Z (2010) Critical factors for new product developments in SMEs virtual team. Afri. J. Business Mgt. 4(11), 2247–2257.
10. Feyzoğlu O and Büyüközkan G (2008) An integrated group decision-making approach for new product development. Intl. J. Computer Integrated Manufact. 21(4), 366.
11. Frambach RT, Prabhu J and Verhallen TM (2003) The influence of business strategy on new product activity: The role of market orientation. Intl. J. Res. Marketing. 20(4), 377–397.
12. Gehin A, Zwolinski P and Brissaud D (2008) A tool to implement sustainable end-of-life strategies in the product development phase. J. Cleaner Production. 16(5), 566-576.
13. Ho Y and Tsai C (2011) Comparing ANFIS and SEM in linear and nonlinear forecasting of new product development performance. Expert Sys. Applications. 38(6), 6498-6507.
14. Huang X, Soutar GN and Brown A (2002) New product development processes in small and medium-sized enterprises: Some Australian evidence. J. Small Business Mgt. 40(1), 27–42.
15. Iranmanesh H, Shirkouhi SN and Skandari MR (2008) Risk evaluation of information technology projects based on fuzzy analytic hierarchal process. Intl. J. Computer & Information Sci. & Engg. 2(1), 38-44.
16. Iwu CG (2010) Impact of product development and innovation on market share. Afri. J. Business Mgt. 4(13), 2659–2667.
17. Kan Mohammadi S, Hassanzadeh I, Mathur RM and Patil KV (2000) A new fuzzy decision-making procedure applied to emergency electric power distribution scheduling. Engg. Applicat. Artificial Intelligence. 13(6), 731-740.
18. Kuen CW, Zailani S and Fernando Y (2009) Critical factors influencing the project success amongst manufacturing companies in Malaysia. Afri. J. Business Mgt. 3(1), 016–027.
19. Lee LY, Fu CS, Li SM and Chen SM (2011) The effects of a project’s social capital, leadership style, modularity, and diversification on new product development performance. Afr. J. Business Mgt. 5(1), 142-155.
Indian Journal of Science and Technology Vol. 4 No. 12 (Dec 2011) ISSN: 0974- 6846
Sci.Technol.Edu. “Fuzzi model for new product development” A.Badizadeh & S.Khanmohammadi Indian Society for Education and Environment (iSee) http://www.indjst.org Indian J.Sci.Technol.
1762
20. Lin M, Wang C, Chen M and Chang CA (2008) Using AHP and TOPSIS approaches in customer-driven product design process. Computers in Industry. 59(1), 17-31.
21. Lu LY and Yang C (2004) The R&D and marketing cooperation across new product development stages: An empirical study of Taiwan's IT industry. Industl. Marketing Mgt. 33(7), 593–605.
22. Lynn GS, Abel KD, Valentine WS and Wright RC (1999) Key factors in increasing speed to market and improving new product success rates. Industl. Marketing Mgt. 28(4), 319–326.
23. March-Chordā I, Gunasekaran A and Lloria-Aramburo B (2002) Product development process in Spanish SMEs: an empirical research. Technovation. 22(5), 301–312.
24. Naghadehi MZ, Mikaeil R and Ataei M (2009) The application of fuzzy analytic hierarchy process (FAHP) approach to selection of optimum underground mining method for Jajarm Bauxite Mine, Iran. Expert Sys. Applications. 36(4), 8218–8226.
25. Nair B and Radhadevi S (2006) Competitive and collaborative supply chains: The strategic role of product innovation, secondary markets and channel structure. Ph.D. thesis, The University of Texas at Austin.
26. Noke H and Hughes M (2010) Climbing the value chain: Strategies to create a new product development capability in mature SMEs. Intl. J. Operations & Product. Mgt. 30(2), 132-154.
27. Ozer M (2005) Factors which influence decision making in new product evaluation. European J. Operational Res. 163(3), 784–801.
28. Petrick IJ and Echols AE (2004) Technology roadmapping in review: A tool for making sustainable new product development decisions. Technological Forecasting & Social Change. 71(1-2), 81–100.
29. Pun KF, Yiu MY and Chin KS (2010) Developing a self-assessment model for measuring new product development performance: an AHP approach. Intl. J. Adv. Operations Mgt. 2(1), 57–79.
30. Rezaie K, Byat M and Shirkouhi SN (2009) Evaluating effective factors of implementing knowledge management based on FAHP method. Modelling & Simulation, 2009. AMS’09. Third Asia Intl. Conf. pp: 398–403.
31. Saaty TL (1980) The analytic hierarchy process. 1980. McGraw-Hill, NY.
32. Soldatos J and Hardy J (2007) The new product development process in Australian grocery organizations. Mgt. 14(1), 61-67.
33. Thietart R and Xuereb J (1997) Rationality and the management of uncertainty in new product development. Actes de la conf. de MONTREAL.
34. Wang W (2009) Evaluating new product development performance by fuzzy linguistic computing. Expert Sys. Applications. 36(6), 9759-9766.
35. Wei C and Chang H (2011) A new approach for selecting portfolio of new product development projects. Expert Sys. Applications. 38(1), 429-434.