Embed Size (px)
Citation preview
Page 1 of 64
Roadmap to Quality by Design
Developing a Roadmap to
Implement Quality by Design
Barry Gujral
Director, Quality Engineering
Peter Amanatides
Vice President, QA and QC
Noven Pharmaceuticals, Inc.
Miami, Fl 33186
Page 2 of 64
Agenda
Roadmap for Quality by Design
The Roadmap for Quality by Design is a detailed plan or explanation
to guide you in setting standards or determining a course of action
This Presentation includes:
A) Formulation Optimization
B) Process Optimization
C) Design Space and Control Strategy
We have included two case studies that we completed at Noven
Pharmaceuticals, Inc. for Formulation Optimization and Process
Optimization during Development Stage
Page 3 of 64
Introduction
Noven Pharmaceuticals, Inc. is a specialty
pharmaceutical company engaged in the research,
development, manufacture, marketing and sale of
prescription pharmaceutical products
We are engaged in mainly three types of products:
Therapeutics
Hormone
ADHD
The subsequent slides summarize the status of products
marketed, approved and/or under advanced
development by Noven
Page 4 of 64
Noven Key Products
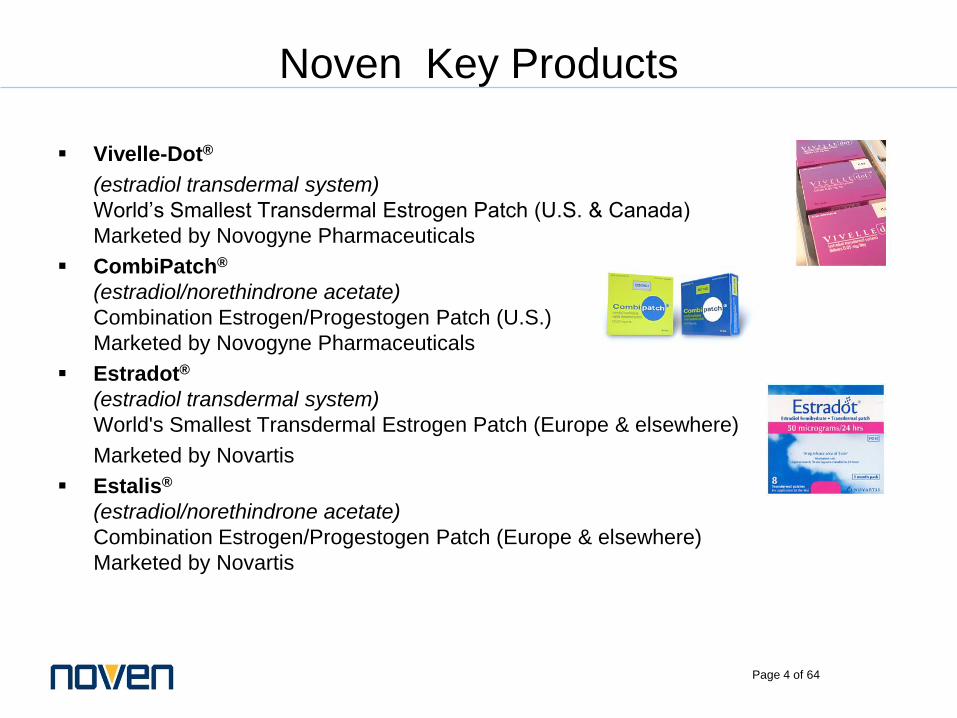
Vivelle-Dot®
(estradiol transdermal system)
World’s Smallest Transdermal Estrogen Patch (U.S. & Canada)
Marketed by Novogyne Pharmaceuticals
CombiPatch®
(estradiol/norethindrone acetate)
Combination Estrogen/Progestogen Patch (U.S.)
Marketed by Novogyne Pharmaceuticals
Estradot®
(estradiol transdermal system)
World's Smallest Transdermal Estrogen Patch (Europe & elsewhere)
Marketed by Novartis
Estalis®
(estradiol/norethindrone acetate)
Combination Estrogen/Progestogen Patch (Europe & elsewhere)
Marketed by Novartis
Page 5 of 64
Noven Key Products (Continued)
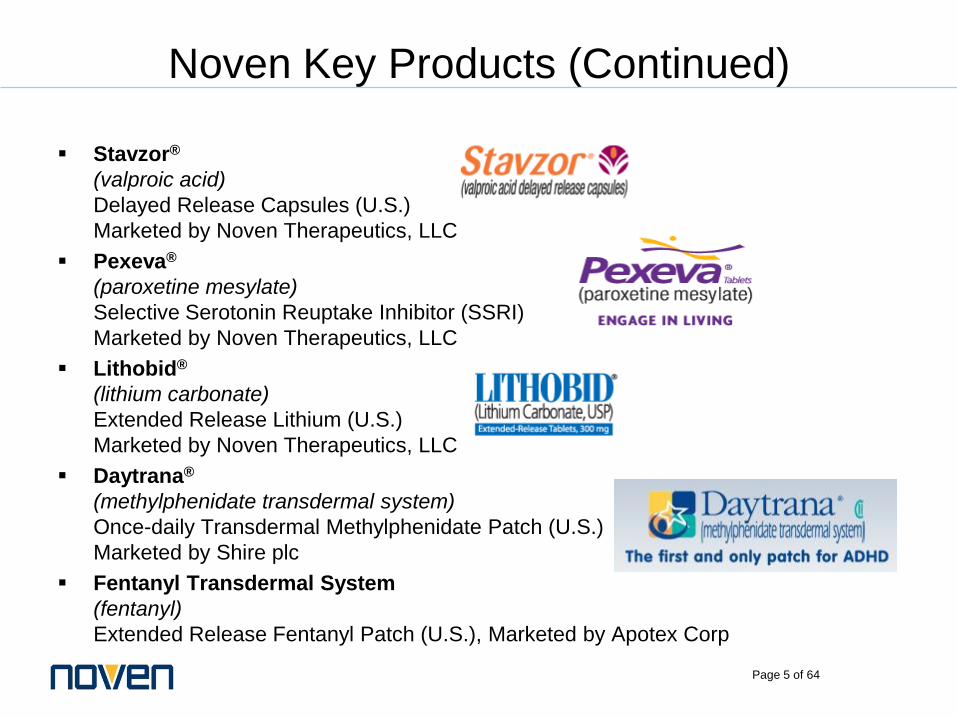
Stavzor®
(valproic acid)
Delayed Release Capsules (U.S.)
Marketed by Noven Therapeutics, LLC
Pexeva®
(paroxetine mesylate)
Selective Serotonin Reuptake Inhibitor (SSRI)
Marketed by Noven Therapeutics, LLC
Lithobid®
(lithium carbonate)
Extended Release Lithium (U.S.)
Marketed by Noven Therapeutics, LLC
Daytrana®
(methylphenidate transdermal system)
Once-daily Transdermal Methylphenidate Patch (U.S.)
Marketed by Shire plc
Fentanyl Transdermal System
(fentanyl)
Extended Release Fentanyl Patch (U.S.), Marketed by Apotex Corp
Page 6 of 64
Introduction
Transdermal therapeutic systems are designed to provide controlled
continuous delivery of drugs via the skin to the systemic circulation
They reduce various side effects like painful delivery of the drugs
and the first pass metabolism of the drug occurred by other means
of drug delivery systems
Many drugs which can be injected directly into the blood stream via
skin have been formulated
The main advantages of this system are that there is controlled
release of the drug and the medication is painless
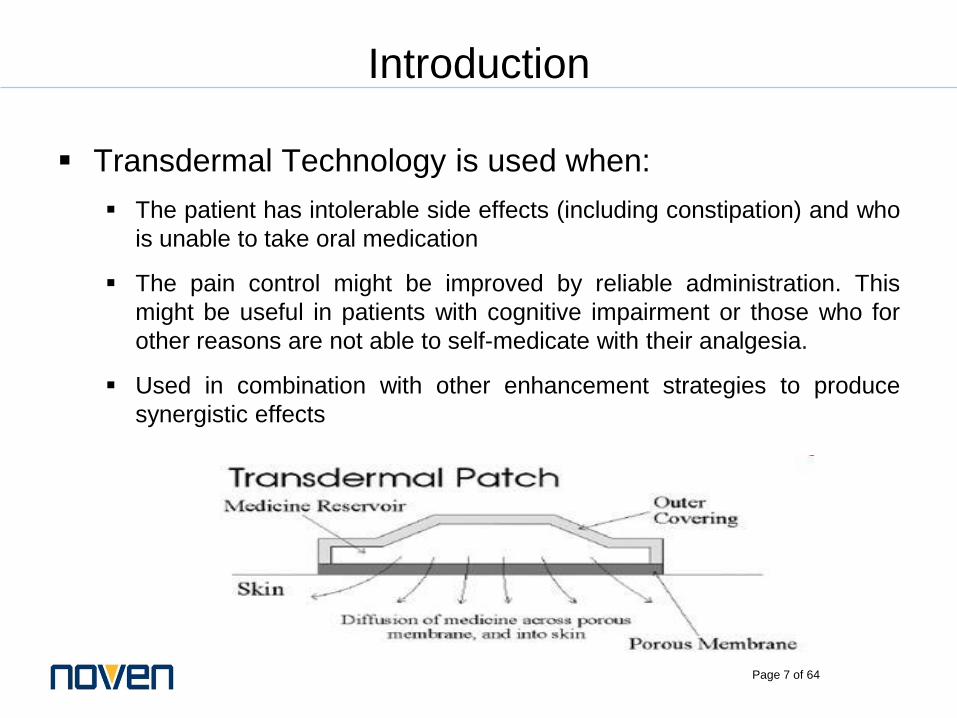
The drug is mainly delivered to the skin with the help of a
transdermal patch which adheres to the skin
Page 7 of 64
Introduction
Transdermal Technology is used when:
The patient has intolerable side effects (including constipation) and who
is unable to take oral medication
The pain control might be improved by reliable administration. This
might be useful in patients with cognitive impairment or those who for
other reasons are not able to self-medicate with their analgesia.
Used in combination with other enhancement strategies to produce
synergistic effects
Page 8 of 64
Formulation Optimization
Steps to follow for Formulation Optimization:
– Select the critical inputs of designed molecule
– Select critical outputs
– Develop Design of Experiment (DOE) between inputs and
outputs
– Develop mathematical modeling between outputs and inputs
– Optimize formulation based upon analysis of DOE
– Perform Risk Analysis based upon Monte Carlo Simulations
– Analyze Sensitivity Studies
Page 9 of 64
Formulation Optimization
What is Mathematical Modeling?
Mathematical modeling is the process of creating a mathematical
representation of some phenomenon in order to gain a better understanding
of that phenomenon
It is a process that attempts to match observation with symbolic statement
The success of a mathematical model depends upon how easily it can be
used and how accurate its predictions are
How to Build a Mathematical Model?
Identify the Problem
State the Assumptions
Identify the Important Variables and Constants and determine how they
relate to each other
Develop an equation that expresses the relationships between the variables
and constants
Page 10 of 64
Formulation Optimization
How to verify a Mathematical Model?
Is the information produced reasonable?
Are the assumptions made during the development of the model reasonable?
Are there any factors that were not considered and could affect the outcome?
How do the results compare with real data?
Page 11 of 64
Formulation Optimization
Why Mathematical Modeling?
Mathematical modeling is the art of translating problems from an
application area into tractable mathematical formulations whose
theoretical and numerical analysis provides insight, answers, and
guidance useful for the originating application
Mathematical Modeling is an interdisciplinary subject bringing
together mathematicians and specialists in other fields to:
– Improve existing products
– Develop better products
– Predict the behavior of certain products
– Future Predictions
Page 12 of 64
Formulation Optimization
This Section includes:
Quality by Design
– Objectives
– Factors Impacting
Case Study #1
Optimal Parameters
Risk Analysis
Thinking Outside the Box
Conclusions
Page 13 of 64
Quality by Design
Objectives of Quality by Design:
Product and process characteristics important to desired
performance must be derived from a combination of prior knowledge
and experimental assessment during product development
From this knowledge and data, a multivariate model linking product
and process measurements and desired attributes may be
constructed
Clinical study would then be viewed as confirmatory performance
testing of the model
Page 14 of 64
Quality by Design
Goals of Case Study # 1:
a) To get a maximum value of Total Delivered Amount
(TDA)
b) To get a minimum value of Jmax/Jmin
We need to get a single scenario where we meet both
the conditions mentioned above
Page 15 of 64
Case Study # 1
BUILDING OF DOE MODEL
Factors
Acrylic as Adhesive
DPG ( Dipropylene Glycol) as Solvent and Enhancer
K-30 (Kollidon) as excipient
E2 is API
Outputs
Total Delivered Amount ( mdg/cm2)
J maximum (Maximum Flux in mcg/cm2/hr)
J minimum (Minimum Flux in Mcg/cm2/hr)
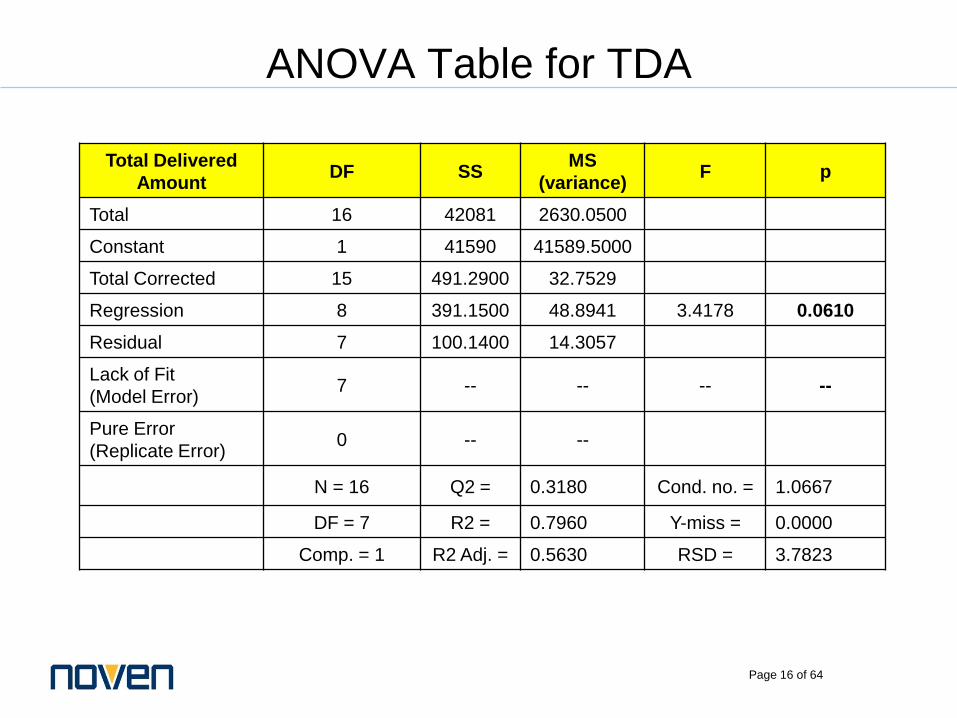
Page 16 of 64
Total Delivered
AmountDF SS
MS
(variance)F p
Total 16 42081 2630.0500
Constant 1 41590 41589.5000
Total Corrected 15 491.2900 32.7529
Regression 8 391.1500 48.8941 3.4178 0.0610
Residual 7 100.1400 14.3057
Lack of Fit
(Model Error)7 -- -- -- --
Pure Error
(Replicate Error)0 -- --
N = 16 Q2 = 0.3180 Cond. no. = 1.0667
DF = 7 R2 = 0.7960 Y-miss = 0.0000
Comp. = 1 R2 Adj. = 0.5630 RSD = 3.7823
ANOVA Table for TDA
Page 17 of 64
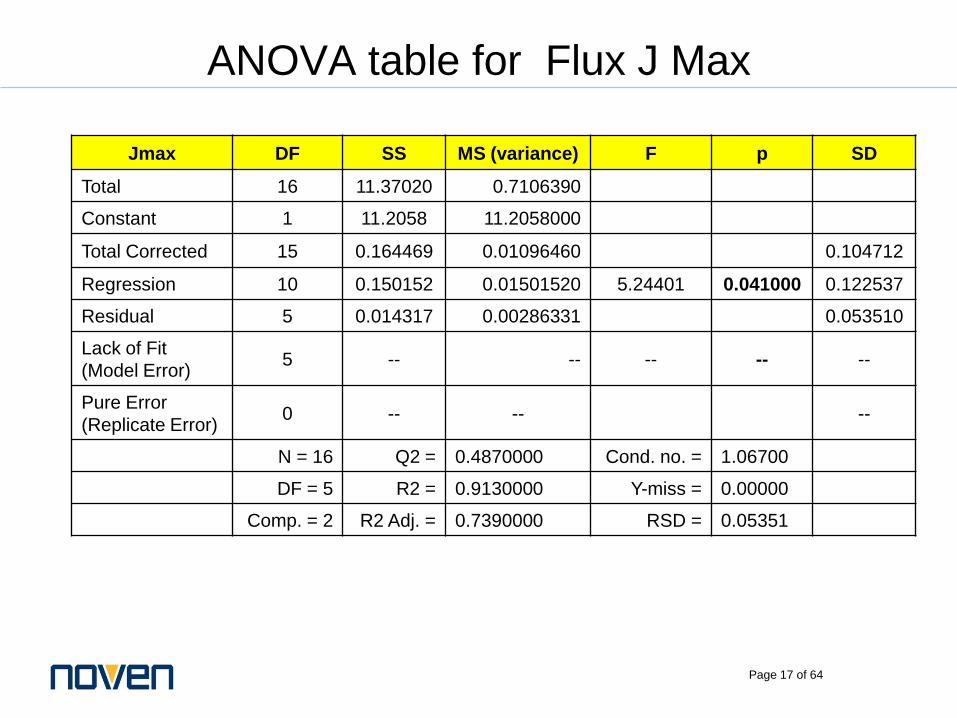
ANOVA table for Flux J Max
Jmax DF SS MS (variance) F p SD
Total 16 11.37020 0.7106390
Constant 1 11.2058 11.2058000
Total Corrected 15 0.164469 0.01096460 0.104712
Regression 10 0.150152 0.01501520 5.24401 0.041000 0.122537
Residual 5 0.014317 0.00286331 0.053510
Lack of Fit
(Model Error)5 -- -- -- -- --
Pure Error
(Replicate Error)0 -- -- --
N = 16 Q2 = 0.4870000 Cond. no. = 1.06700
DF = 5 R2 = 0.9130000 Y-miss = 0.00000
Comp. = 2 R2 Adj. = 0.7390000 RSD = 0.05351
Page 18 of 64
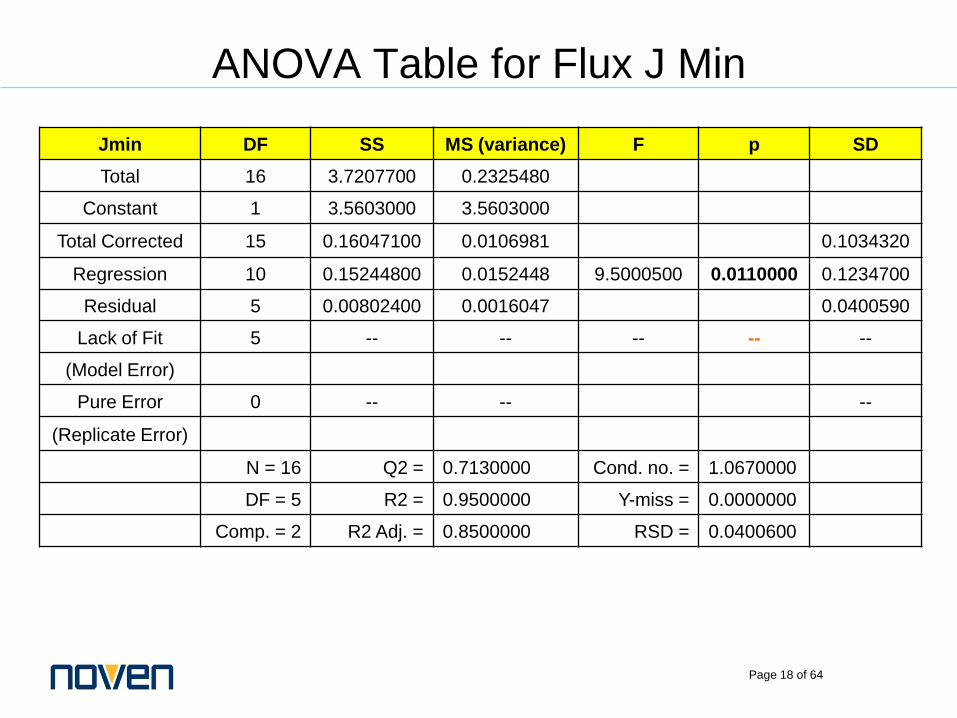
ANOVA Table for Flux J Min
Jmin DF SS MS (variance) F p SD
Total 16 3.7207700 0.2325480
Constant 1 3.5603000 3.5603000
Total Corrected 15 0.16047100 0.0106981 0.1034320
Regression 10 0.15244800 0.0152448 9.5000500 0.0110000 0.1234700
Residual 5 0.00802400 0.0016047 0.0400590
Lack of Fit 5 -- -- -- -- --
(Model Error)
Pure Error 0 -- -- --
(Replicate Error)
N = 16 Q2 = 0.7130000 Cond. no. = 1.0670000
DF = 5 R2 = 0.9500000 Y-miss = 0.0000000
Comp. = 2 R2 Adj. = 0.8500000 RSD = 0.0400600
Page 19 of 64
-5
-4
-3
-2
-1
0
1
2
3
4
5
Acr
DP
G
K-3
0
E2
Acr*
DP
G
Acr*
K-3
0
Acr*
E2
K-3
0*E
2
mdg/c
m2
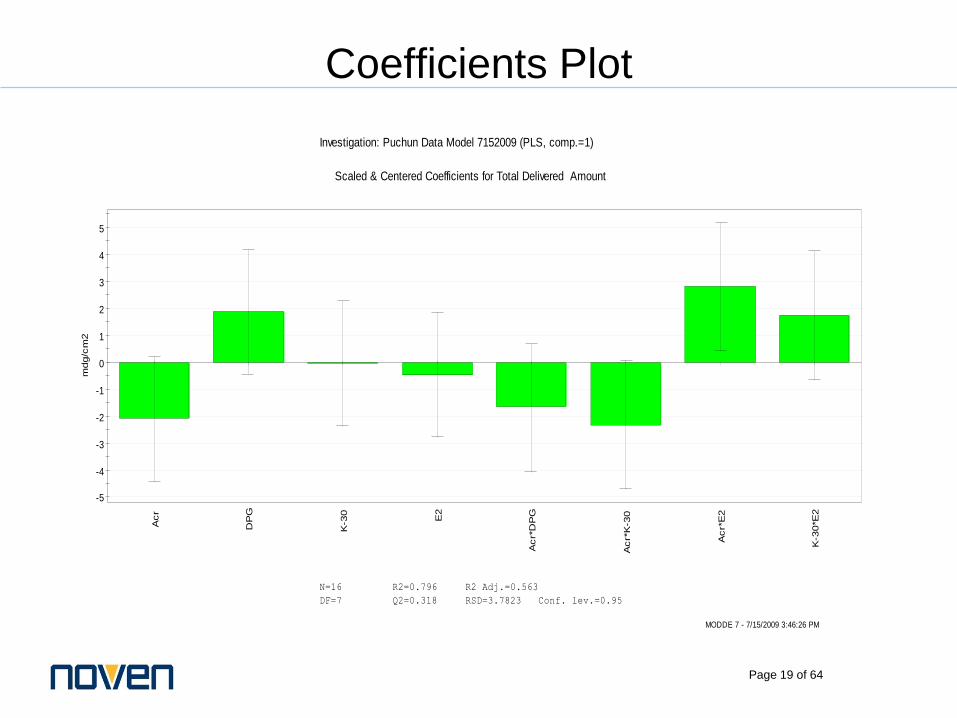
Scaled & Centered Coefficients for Total Delivered Amount
N=16 R2=0.796 R2 Adj.=0.563
DF=7 Q2=0.318 RSD=3.7823 Conf. lev.=0.95
Investigation: Puchun Data Model 7152009 (PLS, comp.=1)
MODDE 7 - 7/15/2009 3:46:26 PM
Coefficients Plot
Page 20 of 64
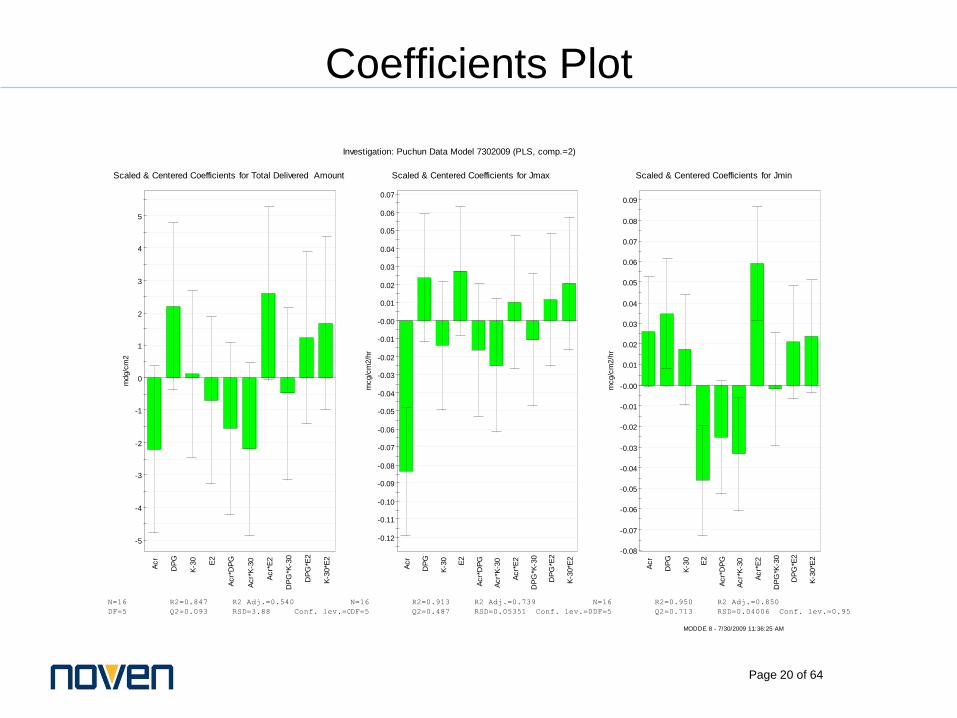
Coefficients Plot
-5
-4
-3
-2
-1
0
1
2
3
4
5
Acr
DP
G
K-3
0
E2
Acr*
DP
G
Acr*
K-3
0
Acr*
E2
DP
G*K
-30
DP
G*E
2
K-3
0*E
2
mdg/c
m2
Scaled & Centered Coefficients for Total Delivered Amount
N=16 R2=0.847 R2 Adj.=0.540
DF=5 Q2=0.093 RSD=3.88 Conf. lev.=0.95
-0.12
-0.11
-0.10
-0.09
-0.08
-0.07
-0.06
-0.05
-0.04
-0.03
-0.02
-0.01
-0.00
0.01
0.02
0.03
0.04
0.05
0.06
0.07
Acr
DP
G
K-3
0
E2
Acr*
DP
G
Acr*
K-3
0
Acr*
E2
DP
G*K
-30
DP
G*E
2
K-3
0*E
2
mcg/c
m2/h
r
Scaled & Centered Coefficients for Jmax
N=16 R2=0.913 R2 Adj.=0.739
DF=5 Q2=0.487 RSD=0.05351 Conf. lev.=0.95
-0.08
-0.07
-0.06
-0.05
-0.04
-0.03
-0.02
-0.01
-0.00
0.01
0.02
0.03
0.04
0.05
0.06
0.07
0.08
0.09
Acr
DP
G
K-3
0
E2
Acr*
DP
G
Acr*
K-3
0
Acr*
E2
DP
G*K
-30
DP
G*E
2
K-3
0*E
2
mcg/c
m2/h
r
Scaled & Centered Coefficients for Jmin
N=16 R2=0.950 R2 Adj.=0.850
DF=5 Q2=0.713 RSD=0.04006 Conf. lev.=0.95
Investigation: Puchun Data Model 7302009 (PLS, comp.=2)
MODDE 8 - 7/30/2009 11:36:25 AM
Page 21 of 64
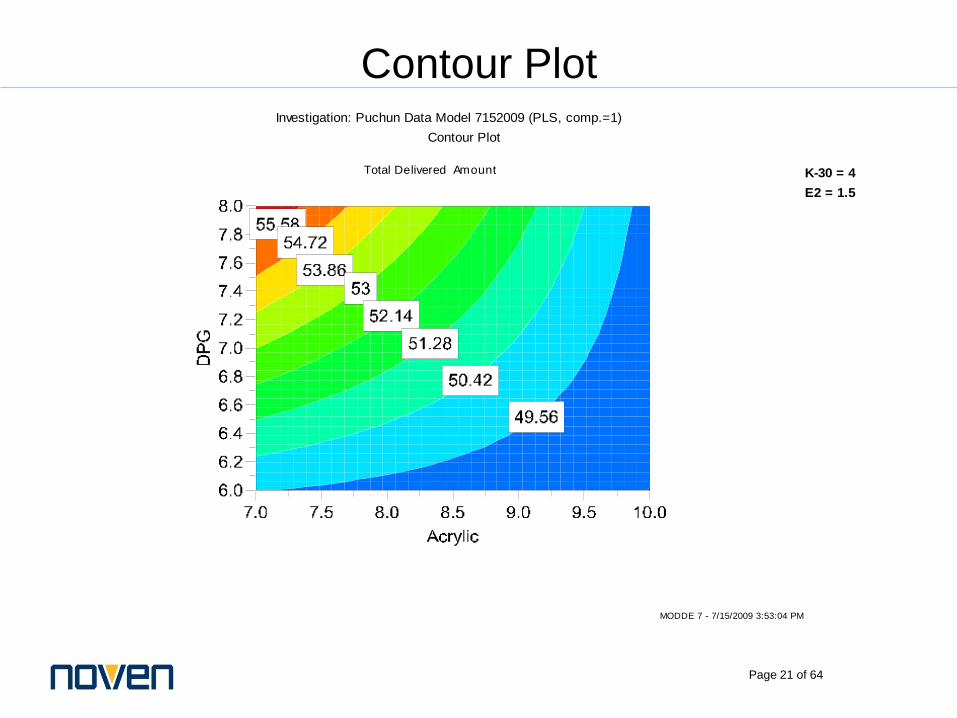
Total Delivered Amount
Investigation: Puchun Data Model 7152009 (PLS, comp.=1)
Contour Plot
MODDE 7 - 7/15/2009 3:53:04 PM
K-30 = 4
E2 = 1.5
Contour Plot
Page 22 of 64
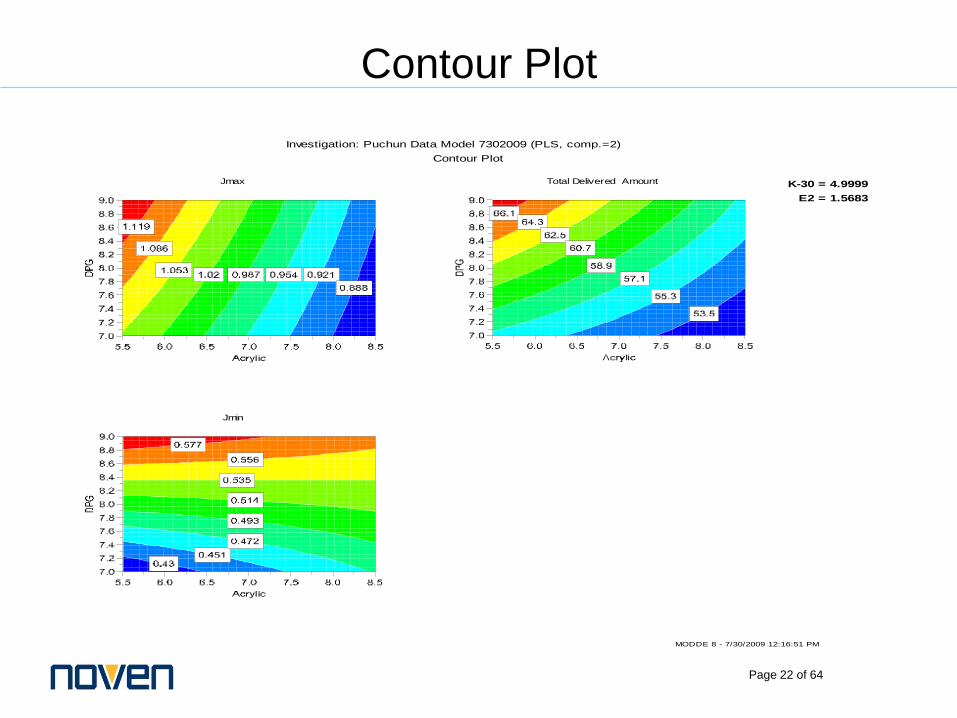
Contour Plot
Jmax Total Delivered Amount
Jmin
Investigation: Puchun Data Model 7302009 (PLS, comp.=2)
Contour Plot
MODDE 8 - 7/30/2009 12:16:51 PM
K-30 = 4.9999
E2 = 1.5683
Page 23 of 64
45
46
47
48
49
50
51
52
53
54
55
56
57
7 8 9 10
Tota
l Deliv
ere
d
Am
ount
Acryli c
45
46
47
48
49
50
51
52
53
54
55
56
57
6.00 6.50 7.00 7.50 8.00
DPG
45
46
47
48
49
50
51
52
53
54
55
56
57
3.00 3.50 4.00 4.50 5.00
K-30
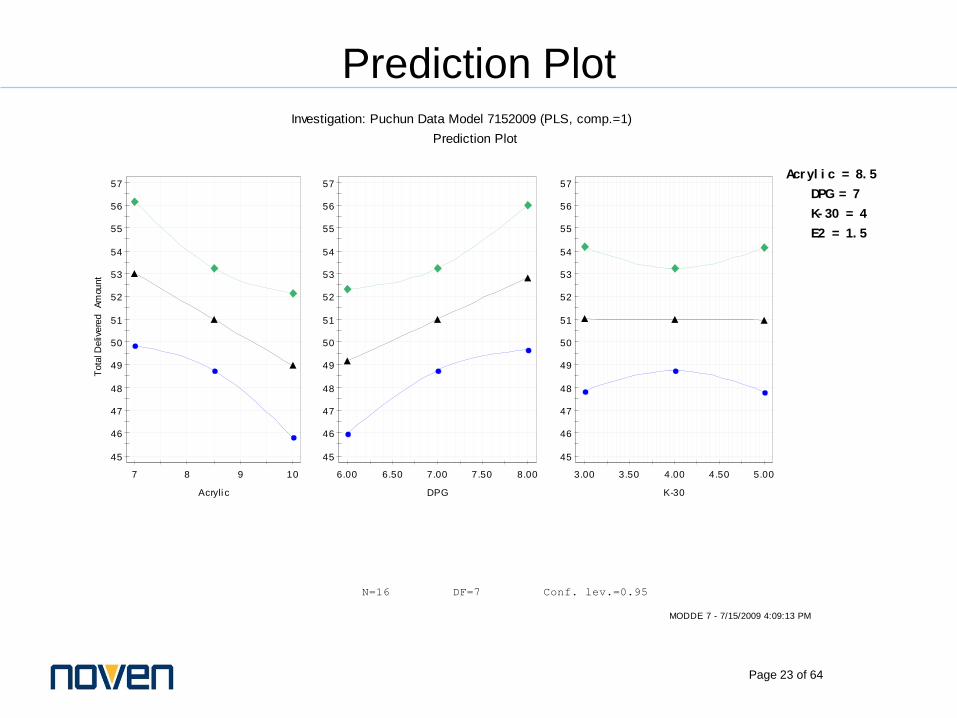
Investigation: Puchun Data Model 7152009 (PLS, comp.=1)
Prediction Plot
MODDE 7 - 7/15/2009 4:09:13 PM
N=16 DF=7 Conf. lev.=0.95
Acr yl i c = 8. 5
DPG = 7
K- 30 = 4
E2 = 1. 5
Prediction Plot
Page 24 of 64
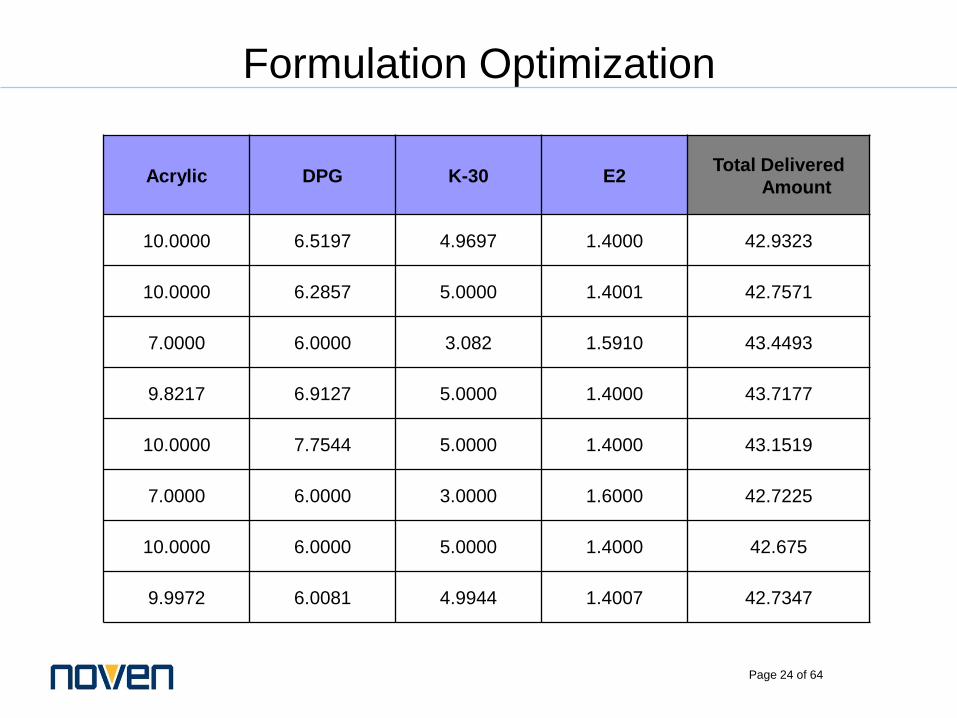
Formulation Optimization
Acrylic DPG K-30 E2Total Delivered
Amount
10.0000 6.5197 4.9697 1.4000 42.9323
10.0000 6.2857 5.0000 1.4001 42.7571
7.0000 6.0000 3.082 1.5910 43.4493
9.8217 6.9127 5.0000 1.4000 43.7177
10.0000 7.7544 5.0000 1.4000 43.1519
7.0000 6.0000 3.0000 1.6000 42.7225
10.0000 6.0000 5.0000 1.4000 42.675
9.9972 6.0081 4.9944 1.4007 42.7347
Page 25 of 64
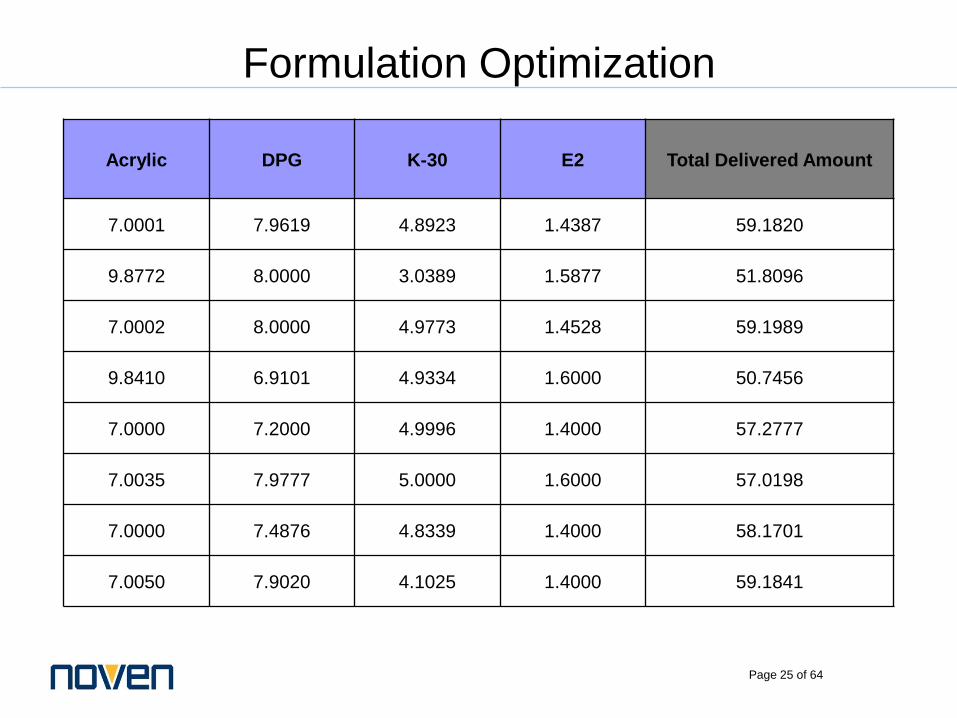
Formulation Optimization
Acrylic DPG K-30 E2 Total Delivered Amount
7.0001 7.9619 4.8923 1.4387 59.1820
9.8772 8.0000 3.0389 1.5877 51.8096
7.0002 8.0000 4.9773 1.4528 59.1989
9.8410 6.9101 4.9334 1.6000 50.7456
7.0000 7.2000 4.9996 1.4000 57.2777
7.0035 7.9777 5.0000 1.6000 57.0198
7.0000 7.4876 4.8339 1.4000 58.1701
7.0050 7.9020 4.1025 1.4000 59.1841
Page 26 of 64
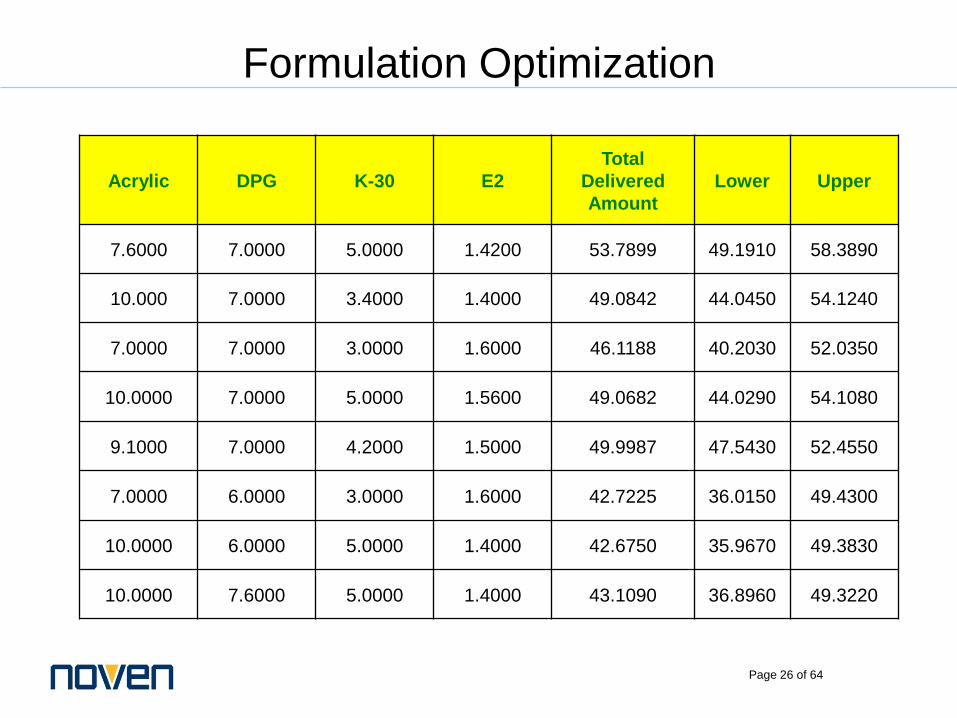
Formulation Optimization
Acrylic DPG K-30 E2
Total
Delivered
Amount
Lower Upper
7.6000 7.0000 5.0000 1.4200 53.7899 49.1910 58.3890
10.000 7.0000 3.4000 1.4000 49.0842 44.0450 54.1240
7.0000 7.0000 3.0000 1.6000 46.1188 40.2030 52.0350
10.0000 7.0000 5.0000 1.5600 49.0682 44.0290 54.1080
9.1000 7.0000 4.2000 1.5000 49.9987 47.5430 52.4550
7.0000 6.0000 3.0000 1.6000 42.7225 36.0150 49.4300
10.0000 6.0000 5.0000 1.4000 42.6750 35.9670 49.3830
10.0000 7.6000 5.0000 1.4000 43.1090 36.8960 49.3220
Page 27 of 64
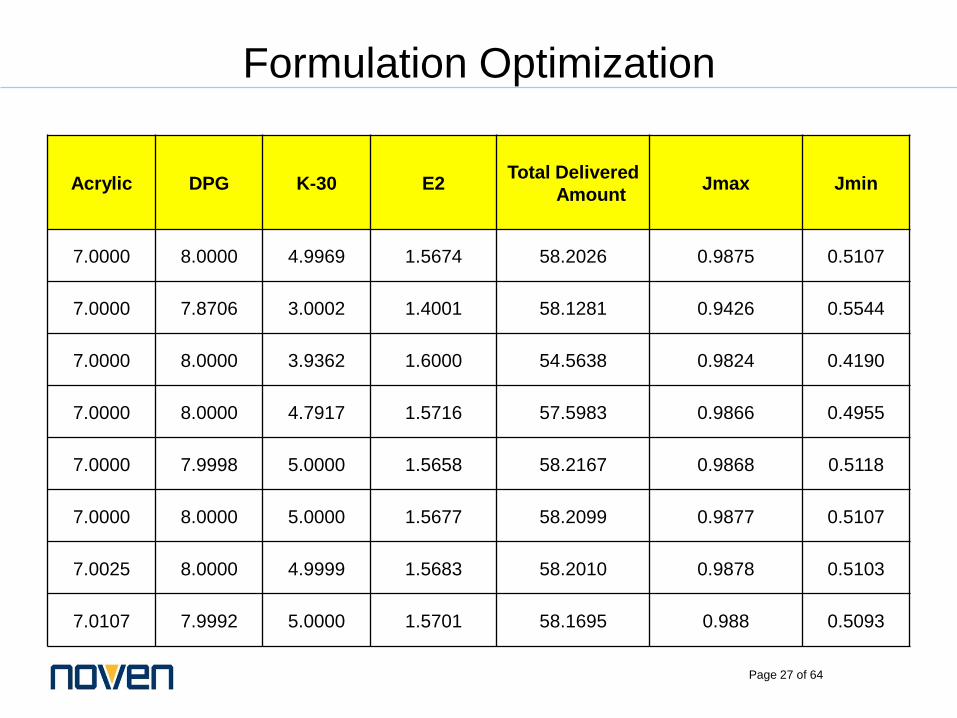
Formulation Optimization
Acrylic DPG K-30 E2Total Delivered
AmountJmax Jmin
7.0000 8.0000 4.9969 1.5674 58.2026 0.9875 0.5107
7.0000 7.8706 3.0002 1.4001 58.1281 0.9426 0.5544
7.0000 8.0000 3.9362 1.6000 54.5638 0.9824 0.4190
7.0000 8.0000 4.7917 1.5716 57.5983 0.9866 0.4955
7.0000 7.9998 5.0000 1.5658 58.2167 0.9868 0.5118
7.0000 8.0000 5.0000 1.5677 58.2099 0.9877 0.5107
7.0025 8.0000 4.9999 1.5683 58.2010 0.9878 0.5103
7.0107 7.9992 5.0000 1.5701 58.1695 0.988 0.5093
Page 28 of 64
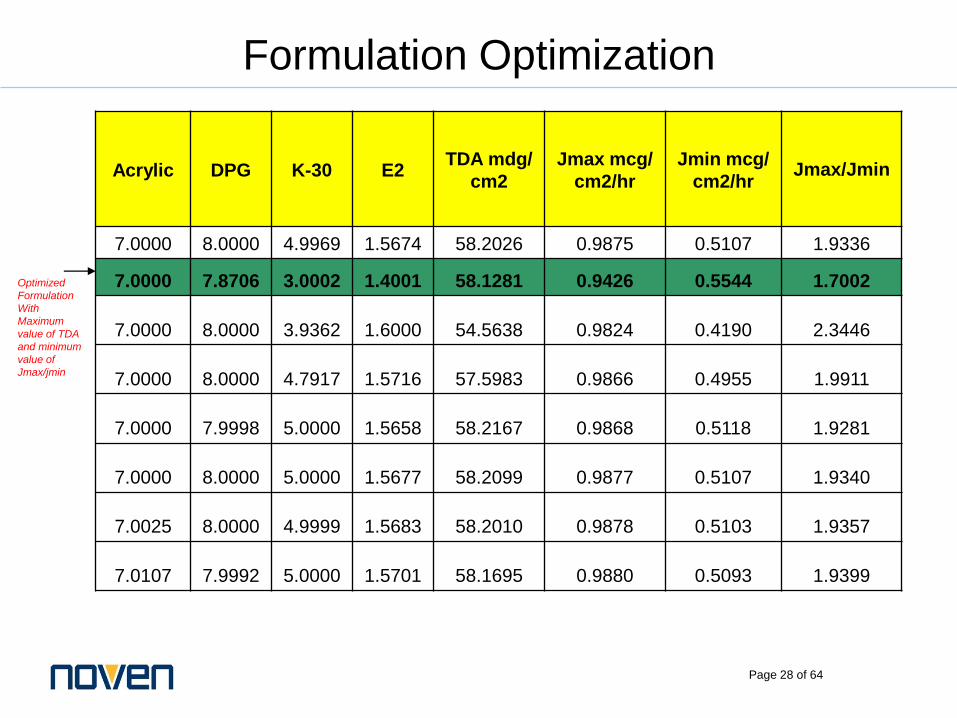
Formulation Optimization
Acrylic DPG K-30 E2TDA mdg/
cm2
Jmax mcg/
cm2/hr
Jmin mcg/
cm2/hrJmax/Jmin
7.0000 8.0000 4.9969 1.5674 58.2026 0.9875 0.5107 1.9336
7.0000 7.8706 3.0002 1.4001 58.1281 0.9426 0.5544 1.7002
7.0000 8.0000 3.9362 1.6000 54.5638 0.9824 0.4190 2.3446
7.0000 8.0000 4.7917 1.5716 57.5983 0.9866 0.4955 1.9911
7.0000 7.9998 5.0000 1.5658 58.2167 0.9868 0.5118 1.9281
7.0000 8.0000 5.0000 1.5677 58.2099 0.9877 0.5107 1.9340
7.0025 8.0000 4.9999 1.5683 58.2010 0.9878 0.5103 1.9357
7.0107 7.9992 5.0000 1.5701 58.1695 0.9880 0.5093 1.9399
Optimized
Formulation
With
Maximum
value of TDA
and minimum
value of
Jmax/jmin
Page 29 of 64
Risk Analysis
What is Risk?
The uncertainty regarding a situation indicates risk,
which is the possibility of loss, damage, or any other
undesirable event
Low risk strategies translate to a high probability of
success, profit, or some form of gain
Risk Analysis is one of the essentials of ProcessAnalytical Technology (PAT) being adopted in thePharmaceutical Industry as per the new guidance of theFDA
Under PAT, the quality is designed into aPharmaceutical product, rather than established bytesting of a finished batch
Page 30 of 64
Risk Analysis
Process Analytical Technology (PAT)
According to the FDA, “Process Analytical
Technology is a system for designing, analyzing,
and controlling manufacturing through timely
measurements (i.e., during processing) of critical
quality and performance attributes of raw and in-
process materials and processes with the goal of
ensuring final product quality.”
Page 31 of 64
Risk Analysis
The 2004 risk-based regulatory approaches
under Process Analytical Technology (PAT)
recognize the level of scientific understanding of
formulations and manufacturing process factors
affecting the product and quality performance
and the capability of process control strategies
to prevent and mitigate the risk of producing a
poor quality pharmaceutical product.
Page 32 of 64
Risk Analysis
This is a basis to understanding the relationship among
various critical process and formulation factors and
developing effective risk mitigation strategies
A desired goal of PAT is to design and develop
processes that will ensure a predefined quality at the end
of the manufacturing process
Page 33 of 64
Risk Analysis
The objective of PAT is to improve understanding andcontrol the manufacturing process, which is consistentwith our current drug quality system: quality cannot betested into products, it should be built in or it should beby design
The increased emphasis of PAT on building quality intoproducts allows us to have more focus on multi-factorialrelationship among raw materials, manufacturingprocesses, and their impact on quality
Page 34 of 64
Risk Analysis
The traditional spreadsheet analysis of quality outcomesdoes not give any probability information on quality. InPAT, the critical product quality variables are identifiedfrom the historical data
The simulation model provides probability data foralmost all possible outcomes by analyzing the statisticsof simulations . The probability of quality in the finalproduct can be predicted with confidence
Page 35 of 64
Risk Analysis
All critical sources of variability are identified and
explained
The variability is managed by the process and product
quality attributes which can be accurately and reliably
predicted over the design space established for the
materials used, process parameters and manufacturing
conditions
Page 36 of 64
Benefits of Risk Analysis
Enhanced patient confidence in decision making on
pharmaceutical quality
Promotes more effective use of regulatory agency
and industry resources
Establishes a systematic, well-informed and
thorough method of decision making which leads to
greater transparency and predictability
Increased knowledge of exposure to risk
Fosters quality by design, continuous improvement
and new technology introduction, which generally
leads to enhanced product quality
Page 37 of 64
Scope of Risk Analysis
This guideline provides a framework that may be applied
to all aspects of pharmaceutical quality including GMP
and submission/review processes throughout the
lifecycle of drug substances (API) and drug (medicinal)
products, biological and vaccine products, and the use of
excipients and packaging materials
This guideline is not intended to apply to risk
management used in a pharmacovigilance setting
involving safety and efficacy
Page 38 of 64
Guiding Principles
The evaluation of the risk should ultimately link back tothe potential risk to the patient
The extent of the risk management process should becommensurate with the level of risk associated with thedecision
A more robust data set will lead to lower uncertainty
It is essential to have a clear delineation of the riskquestion
Risk management should be an iterative process
People who apply risk management should have theappropriate training, skills and experience
The risk management process should be appropriatelydocumented and verifiable
Page 39 of 64
Risk Management
Defining specifically the risk management problem orquestion, including the assumptions leading to thequestion
Assembling background information and data on thehazard, harm or human health impact relevant to theassessment
Defining how the assessment information andconclusions will be used by the decision makers
Identifying the necessary resources, members of theteam who have the appropriate expertise, with the leaderclearly identified
Asking the right risk assessment question(s)
Stating clearly the assumptions in the risk assessment
Assessing the quality and sufficiency of relevant data
Specifying a timeline and deliverables for the riskassessment
Page 40 of 64
Risk Assessment
What can go wrong?
What is the likelihood (probability) it would go wrong?
What are the consequences?
Risk analysis is a systematic use of information toidentify specific sources of harm (hazards) and toestimate the risk
Risk evaluation compares the estimated risk againstgiven risk criteria using a quantitative or qualitative scaleto determine the significance of the risk
Page 41 of 64
Risk Control
Risk control describes the actions of implementing riskmanagement decisions.
– What can be done to mitigate and reduce risks?
– What options for controlling risks are available?
– What are the impacts of current risk managementdecisions on future options for risk management?
Risk mitigation focuses on a reduction of severity ofharm
Risk reduction focuses on the reduction of probabilitiesof occurrence of harm and detection of harm
Risk acceptance is a decision to accept risk, i.e., noadditional risk control activities are necessary at thattime
Page 42 of 64
Risk Communication
Risk communication is the exchange or sharing of
information about risk and risk management between the
decision maker and other stakeholders. The information
can relate to the existence, nature, form, probability,
severity, acceptability, treatment, detectability or other
aspects of risks to quality
The communication among stakeholders concerning
quality risk management decisions can be made through
existing channels
Page 43 of 64
Risk Monitoring and Review
All risk management processes are dynamic/iterative.
Quality risk management when applied should benefit
from new knowledge with each decision cycle and used
to enhance future decisions allowing for continuous
improvement
Page 44 of 64
Current Risk Management Tools
Process mapping
Preliminary Hazard Analysis (PHA)
Hazard Analysis of Critical Control Points (HACCP)
Hazard Operability Analysis (HAZOP)
Fault tree analysis (FTA)
Failure Mode Effects Analysis (FMEA)
Failure Mode, Effects and Criticality Analysis (FMECA)
Risk Ranking and Filtering
Informal Risk Management
Taguchi, variation risk management method
Page 45 of 64
Supporting Statistical Tools
Design of experiments (DOE)
Process Capability Analysis
Control charts:
Acceptance control charts
Shewhart control charts
Accumulative sum charts
Page 46 of 64
Monte Carlo Simulations - A New Tool
Use of Monte Carlo Simulations as a new tool in Risk
Analysis for:
Risk Analysis in Formulation Optimization of
Transdermal Products
Risk Analysis in Quality of Pharmaceuticals-Content
Uniformity
Risk Analysis in Building Capacity Models
Page 47 of 64
Risk Analysis
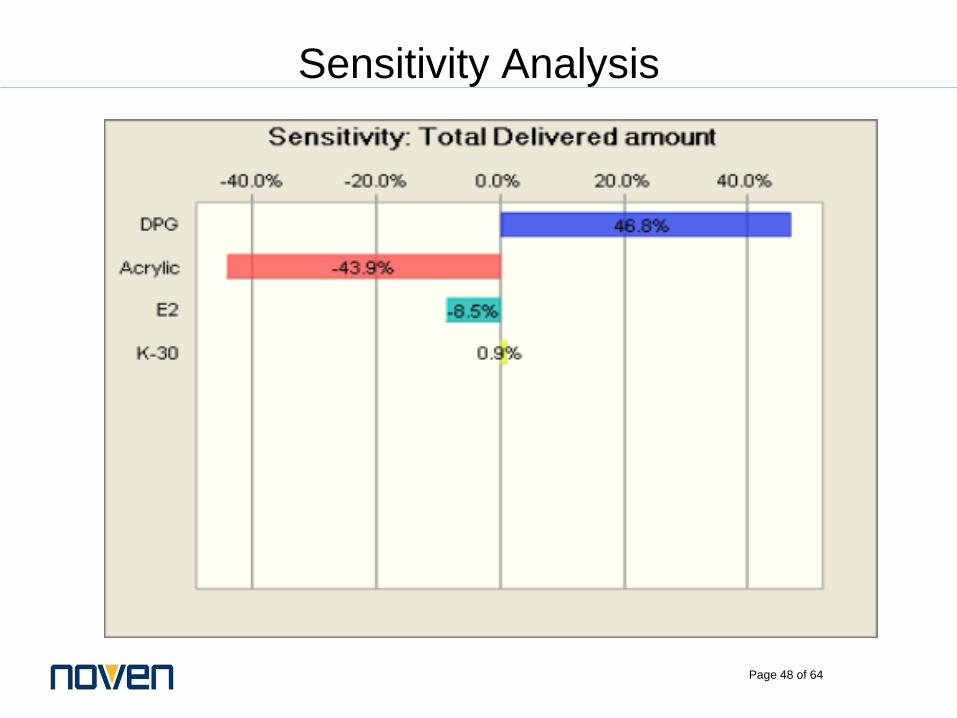
Page 48 of 64
Sensitivity Analysis
Page 49 of 64
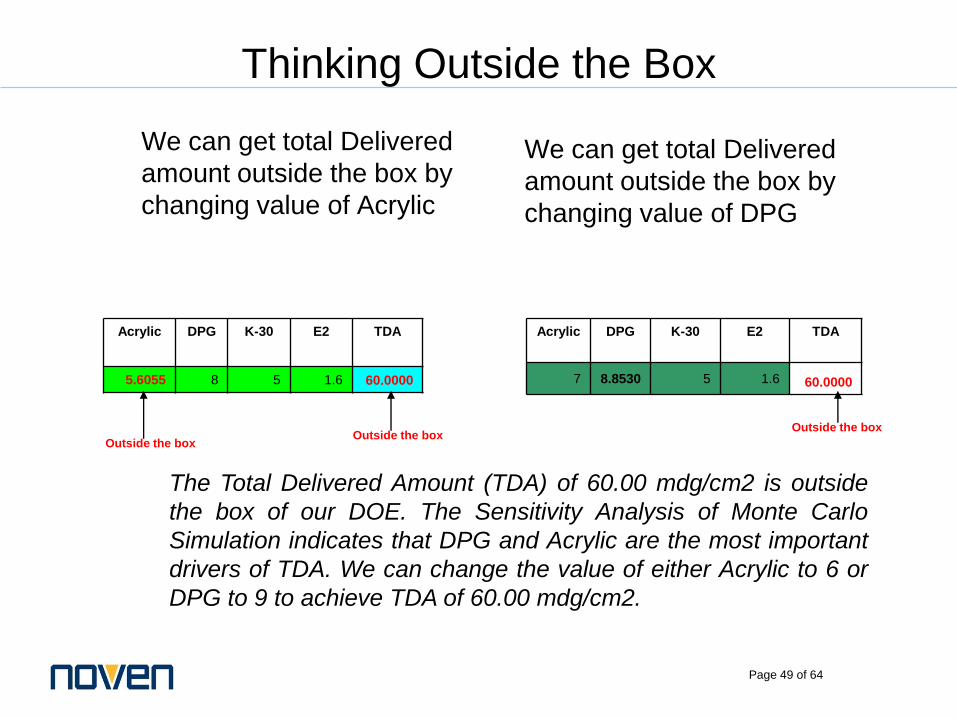
Thinking Outside the Box
We can get total Delivered
amount outside the box by
changing value of Acrylic
We can get total Delivered
amount outside the box by
changing value of DPG
Acrylic DPG K-30 E2 TDA
5.6055 8 5 1.6 60.0000
Acrylic DPG K-30 E2 TDA
7 8.8530 5 1.6 60.0000
The Total Delivered Amount (TDA) of 60.00 mdg/cm2 is outside
the box of our DOE. The Sensitivity Analysis of Monte Carlo
Simulation indicates that DPG and Acrylic are the most important
drivers of TDA. We can change the value of either Acrylic to 6 or
DPG to 9 to achieve TDA of 60.00 mdg/cm2.
Outside the boxOutside the box
Outside the box
Page 50 of 64
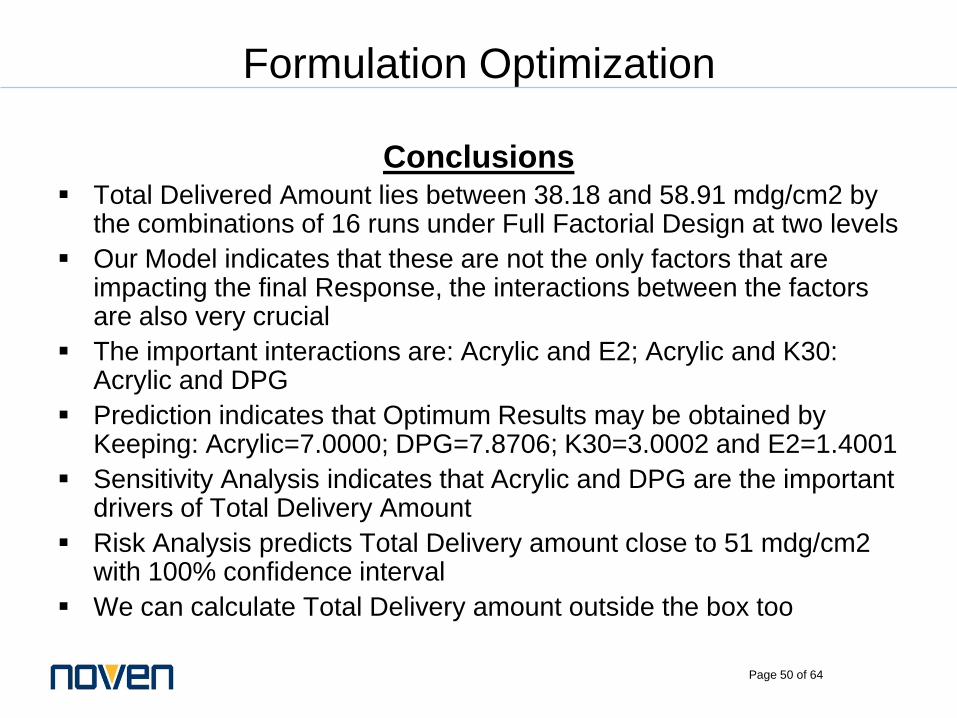
Formulation Optimization
Conclusions Total Delivered Amount lies between 38.18 and 58.91 mdg/cm2 by
the combinations of 16 runs under Full Factorial Design at two levels
Our Model indicates that these are not the only factors that are impacting the final Response, the interactions between the factors are also very crucial
The important interactions are: Acrylic and E2; Acrylic and K30: Acrylic and DPG
Prediction indicates that Optimum Results may be obtained by Keeping: Acrylic=7.0000; DPG=7.8706; K30=3.0002 and E2=1.4001
Sensitivity Analysis indicates that Acrylic and DPG are the important drivers of Total Delivery Amount
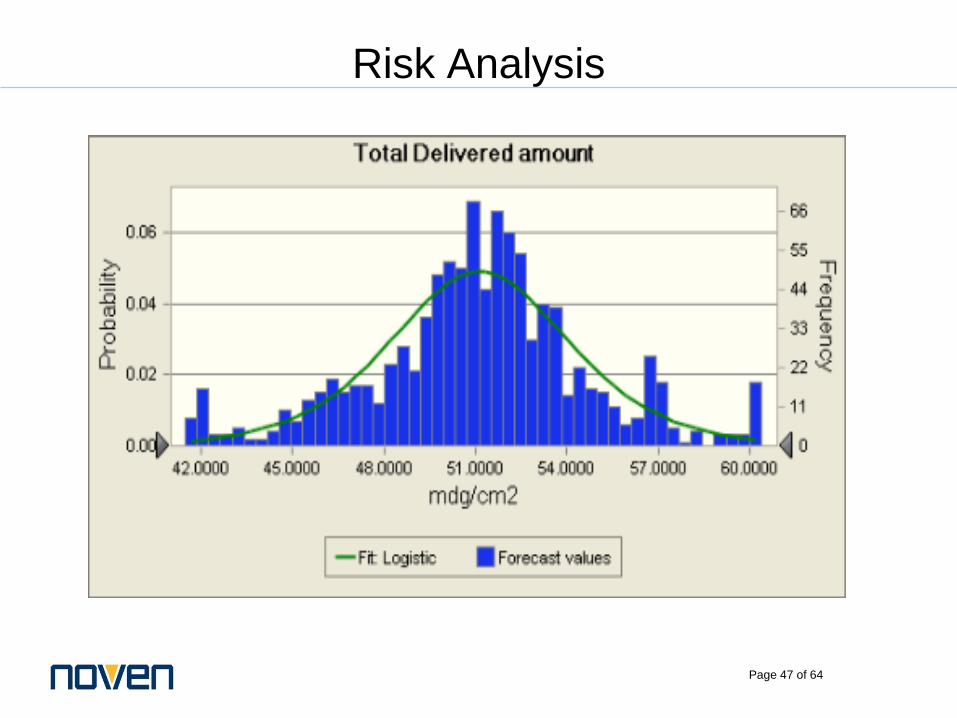
Risk Analysis predicts Total Delivery amount close to 51 mdg/cm2 with 100% confidence interval
We can calculate Total Delivery amount outside the box too
Page 51 of 64
Process Optimization
Steps to follow for Process Optimization:
– Select critical parameters of raw materials and manufacturing
process
– Develop a screening and d-optimal models of outputs with
critical parameters of raw materials and manufacturing
processes
– Optimize the output parameters
– Analyze risk assessment
Page 52 of 64
Process Optimization
This Section Includes:
Case Study # 2
Interactions
Contour Plot
DOE results
Within Box
Outside the Box
Recommendations
Page 53 of 64
Process Optimization
-0.3
-0.2
-0.1
-0.0
0.1
0.2
0.3In
l
Web
Inl*W
eb
%
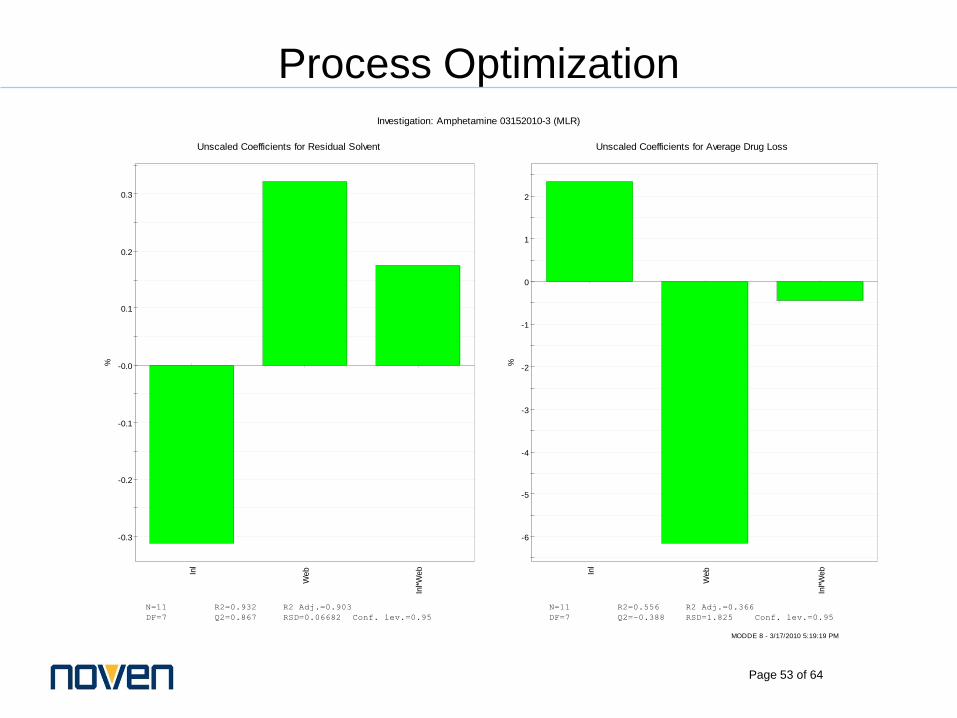
Unscaled Coefficients for Residual Solvent
N=11 R2=0.932 R2 Adj.=0.903
DF=7 Q2=0.867 RSD=0.06682 Conf. lev.=0.95
-6
-5
-4
-3
-2
-1
0
1
2
Inl
Web
Inl*W
eb
%
Unscaled Coefficients for Average Drug Loss
N=11 R2=0.556 R2 Adj.=0.366
DF=7 Q2=-0.388 RSD=1.825 Conf. lev.=0.95
Investigation: Amphetamine 03152010-3 (MLR)
MODDE 8 - 3/17/2010 5:19:19 PM
Page 54 of 64
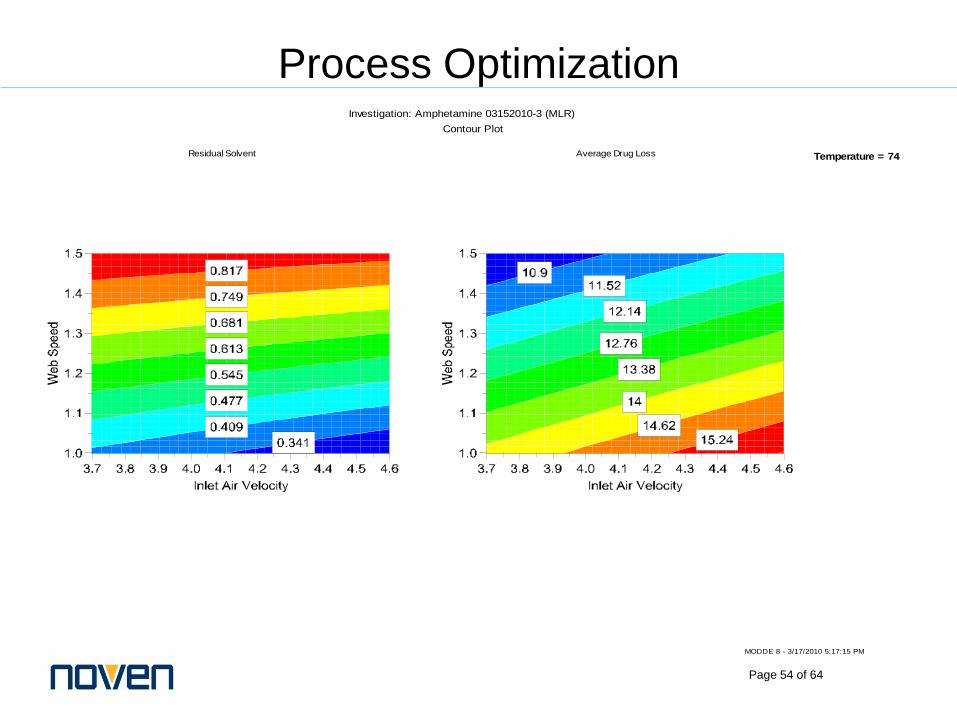
Residual Solvent Average Drug Loss
Investigation: Amphetamine 03152010-3 (MLR)
Contour Plot
MODDE 8 - 3/17/2010 5:17:15 PM
Temperature = 74
Process Optimization
Page 55 of 64
Process Optimization
Page 56 of 64
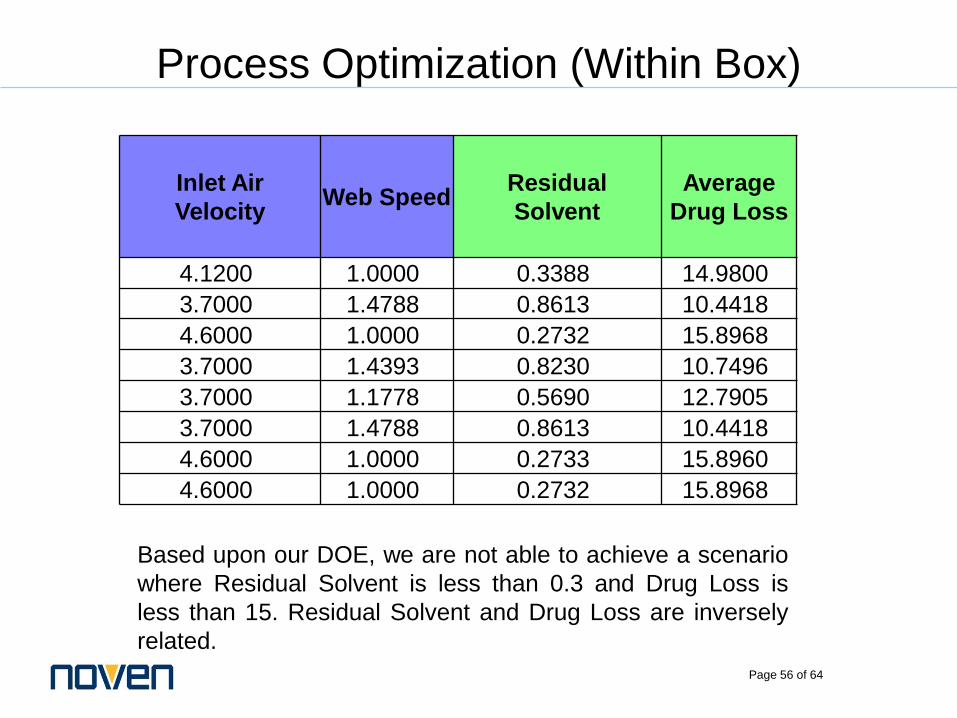
Process Optimization (Within Box)
Inlet Air
VelocityWeb Speed
Residual
Solvent
Average
Drug Loss
4.1200 1.0000 0.3388 14.9800
3.7000 1.4788 0.8613 10.4418
4.6000 1.0000 0.2732 15.8968
3.7000 1.4393 0.8230 10.7496
3.7000 1.1778 0.5690 12.7905
3.7000 1.4788 0.8613 10.4418
4.6000 1.0000 0.2733 15.8960
4.6000 1.0000 0.2732 15.8968
Based upon our DOE, we are not able to achieve a scenario
where Residual Solvent is less than 0.3 and Drug Loss is
less than 15. Residual Solvent and Drug Loss are inversely
related.
Page 57 of 64
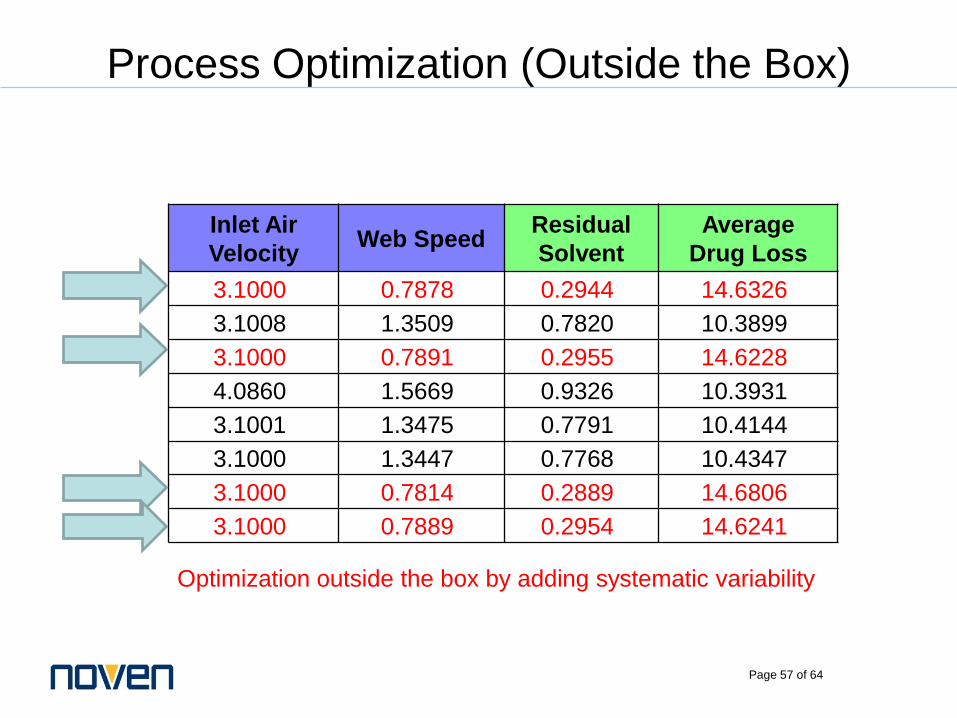
Process Optimization (Outside the Box)
Inlet Air
VelocityWeb Speed
Residual
Solvent
Average
Drug Loss
3.1000 0.7878 0.2944 14.6326
3.1008 1.3509 0.7820 10.3899
3.1000 0.7891 0.2955 14.6228
4.0860 1.5669 0.9326 10.3931
3.1001 1.3475 0.7791 10.4144
3.1000 1.3447 0.7768 10.4347
3.1000 0.7814 0.2889 14.6806
3.1000 0.7889 0.2954 14.6241
Optimization outside the box by adding systematic variability
Page 58 of 64
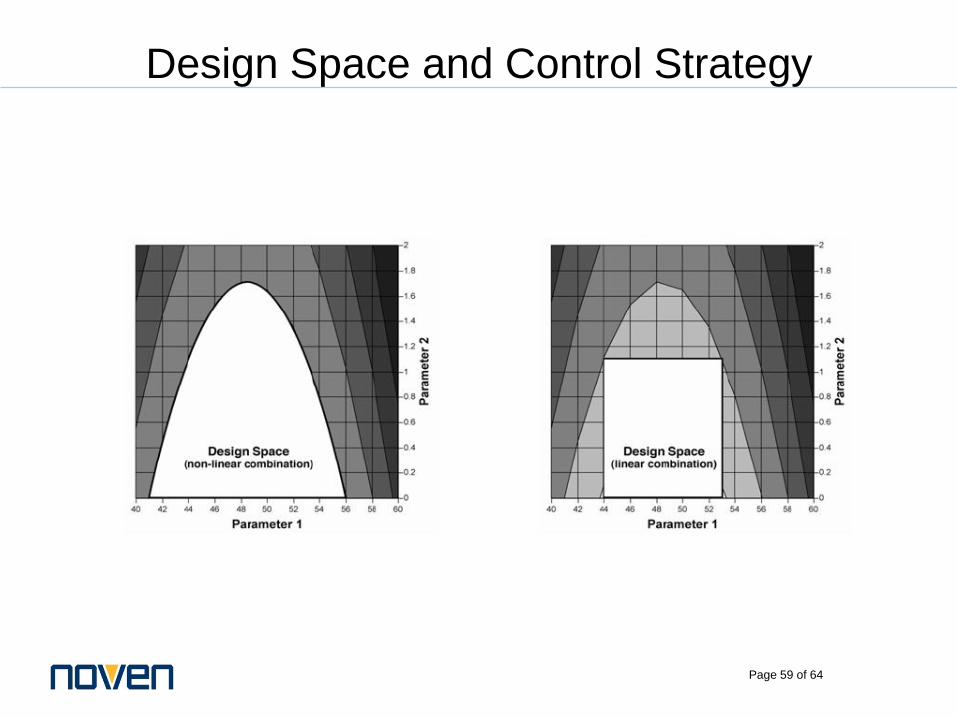
Design Space and Control Strategy
The Role of Design Space Development
in Quality by Design
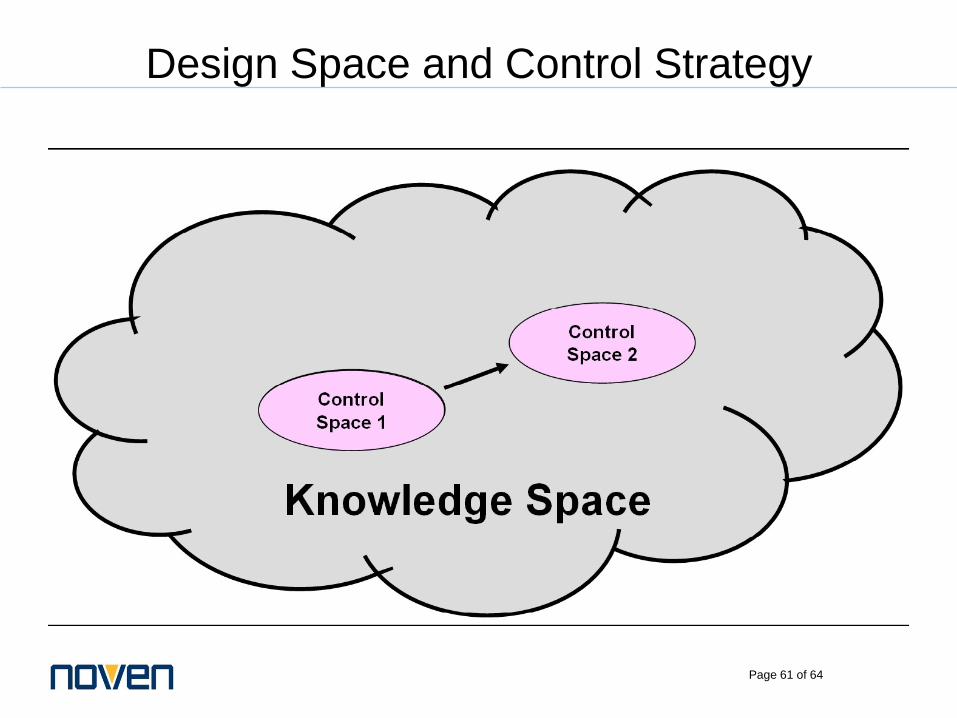
Process development results in the definition and approval of a “Control Space” within the universe of possibilities about a process called a “Knowledge Space.” The approved manufacturing process can be operated within the Control Space to produce material that meets the required specifications for identity, potency, quality, etc.
As the product matures in its life cycle, scale-up, economic and/or other factors can require changes in the control scheme for the process, moving it from Control Space 1 to a new Control Space 2
Page 59 of 64
Design Space and Control Strategy
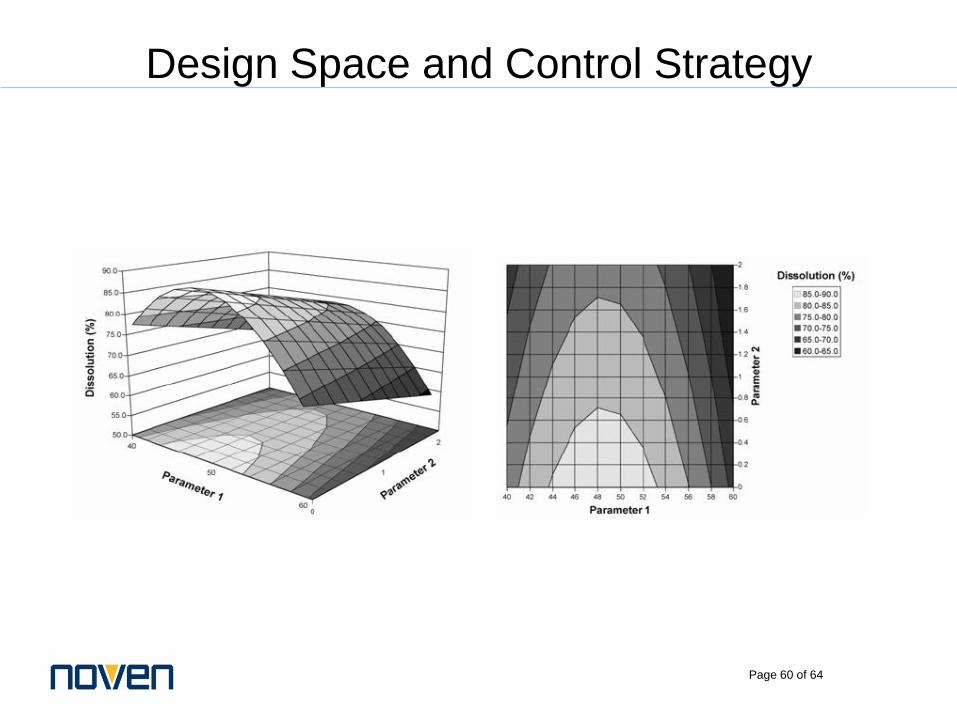
Page 60 of 64
Design Space and Control Strategy
Page 61 of 64
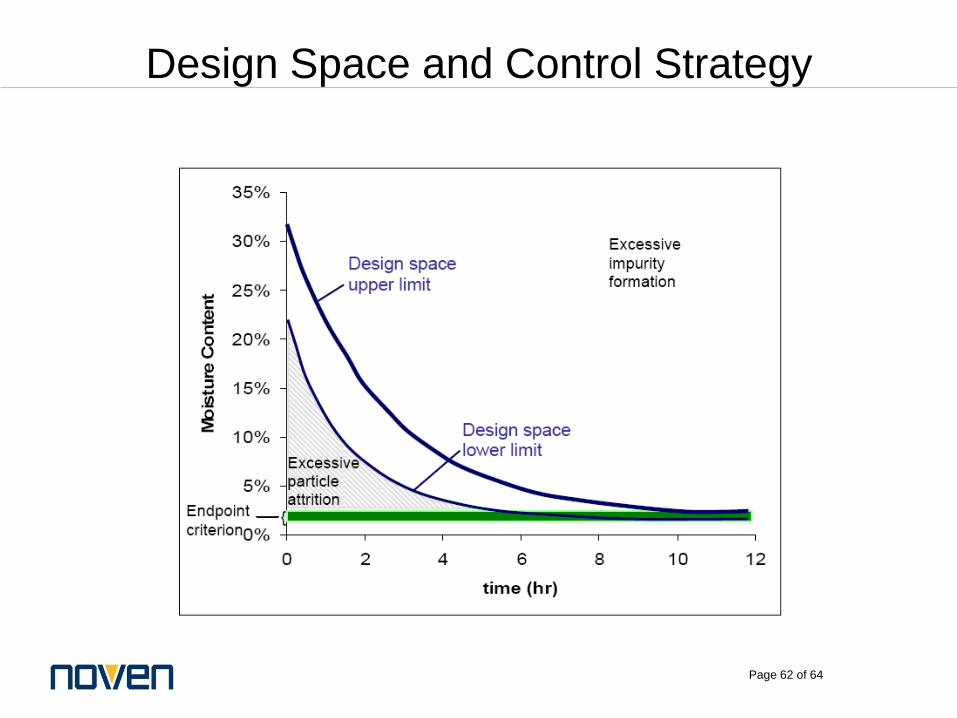
Design Space and Control Strategy
Page 62 of 64
Design Space and Control Strategy
Page 63 of 64
Design Space and Control Strategy
Conclusions
The Process Analytical Technology (PAT) initiative of the FDA provides risk based manufacturing of Pharmaceuticals
Under PAT, the risk is inversely proportional to Process Understanding
Monte Carlo Simulations helps to quantify the risk
Once the risks involved to make a bad Pharmaceutical product are quantified, we can use other statistical tools like Solver to reduce those risks
The Design space will be different for different unit operations. Design Space for each unit operation can be optimized using statistical tools
The Control Strategy will be specific to equipments being used in manufacturing and monitoring

Page 64 of 64
Questions


![[Handout] Laurie Dillon-Schalk - Developing a Digital Strategy & Roadmap](https://img.pdfslide.net/doc/110x75/54bb6fa74a7959ee3c8b47b1/handout-laurie-dillon-schalk-developing-a-digital-strategy-roadmap.jpg)