Embed Size (px)
Citation preview
Developing a scheduling heuristic
for Domo Borculo
Master Thesis, January 2014
Author: Supervisors: Lianne Schmidt University of Twente Dr. ir. J.M.J. Schutten, University of Twente Master: Industrial Engineering and Management Dr. ir. L.L.M. van der Wegen, University of Twente Track: Production and Logistics Management Ing. D. Roessink MBA, FrieslandCampina s0174955 Ir. A.J.C. van den Berg, FrieslandCampina

ii
iii
Preface
This thesis is written to obtain my master’s degree in Industrial Engineering and Management. Reflecting upon this process, I thank some people that were directly or indirectly involved in the completion of this thesis. First, I thank Marco Schutten and Leo van der Wegen, my supervisors from the University of Twente, for guiding me through the process of writing my Master thesis. Their guidance and constructive feedback have been very valuable to the quality of this thesis.
Second, I thank my colleagues from FrieslandCampina. I had a wonderful time at the production facility in Borculo and I learned a lot. Special thanks go to Detmar Roessink and Aart Jan van den Berg, who helped and supported me during the research.
Finally, I thank my family and friends for their unconditional support during my studies. Your patience, support, and encouragement have been of great help for successfully ending my studies. Lianne Schmidt Enschede, January 2014
iv
Management Summary This research is conducted as part of the Master Industrial Engineering and Management at the University of Twente. It aims to improve the control of the lactose production of FrieslandCampina Domo Borculo.
Research motivation The volume development in 2012 of the Ingredients group of FrieslandCampina was limited due to the maximum utilization of the production capacity. This also holds for Domo Borculo; the demand for (most of the) Domo products is higher than its current production. In order to achieve a higher production output, control over the production process is required. The complexity of the production process, the autonomy of the operators, and the uncertainty in the arrival of raw materials makes it difficult to control the production process. This research focusses on the lactose-rich products, since Domo Borculo encounters the most problems with this process. Therefore, the main research question of this research is:
How can FrieslandCampina Domo Borculo get control over the production of lactose-rich products? The theoretical bottleneck of the lactose production is the dissolving street. However, due to the long waiting times of a batch in K1, this is currently the bottleneck. So the output of the production process is lower than possible, while the demand of the lactose production is higher than the current output of the production system. This makes the current way of working in the production system a problem and the control of the lactose production should be improved. Production control is concerned with the coordination of manufacturing activities. At the goods flow level, it is concerned with planning and, at the unit control level, it is linked to scheduling. Scope Since the lactose production is connected to the protein production and the exact arrival times of the raw materials are not known in advance, we set the scheduling scope from the pasta tanks to the dissolving street. We focus this research on the future state of the production system and therefore we have three materials in scope: whey, permeate, and SW Yellow. Method To answer the research question, we developed a scheduling heuristic for the lactose production of Domo Borculo. The initial goal of scheduling is to provide Domo Borculo with control over the production system. The heuristic provides a schedule with all the start and finish times at the production equipment for the chosen product. The main goal of the heuristic is to maximize the utilization of the bottleneck. K1 is currently the bottleneck due to the long waiting times in the tanks. With the scheduling method, we can eliminate unnecessary waiting time and therefore we assume that the dissolving street is the bottleneck. From the main scheduling goal we derived a secondary goal: a minimum number of product switches at the bottleneck.
Results We motivate our choice for the proposed heuristic by means of three case studies and an evaluation by experts. Based on this we conclude that the heuristic improves the number of product switches at the dissolving street, as Table 1 shows. By decreasing the number of switches the switching time is reduced resulting in more available production time at the bottleneck. Also, less lactose product has

v
to be degraded to a lower quality due to mixing, which happens during a product switch. Case study I and II both have significant more lactose product in storage than case study III. So, the heuristic is able to drastically decrease the number of product switches, but only if there is enough lactose product available.
Case study I Case study II Case study III Reduction in product switches 77% 73% 30% Table 1: Results of the case studies
The idle time due to product switching is thus increased. However, we were only able to demonstrate a slightly improvement in idle time that was caused by product unavailability. This was mainly due to the fact that there was not enough raw material available. Nevertheless, the schedule does show when idle time at the dissolving street will occur and how much residual is produced, which is currently not known at Domo Borculo. With this information Domo Borculo is able to improve planning of their special production, maintenance, and processing of residuals. Overall, we conclude that the scheduling heuristic has the potential to become a scheduling support tool to assist schedulers and operators.
Recommendations First, we recommend having a real-life test period before Domo Borculo should implement the scheduling method. When the outcome is positive, Domo Borculo should acquire a professional scheduling tool in which the proposed heuristic can be implemented. Furthermore, we identified two crucial parameters that Domo Borculo should monitor and analyze constantly during the test and further implementation. First parameter is the capacity of the dissolving street; we know that the capacity varies and this cannot be predicted beforehand. Nevertheless, the varying production capacity can influence the production output in such a way that it harms the reliability of the schedule. The second parameter is the amount and the percentage of dry content of SWML, a residual of SW Yellow that emerges at the dissolving street and which is added to the raw material whey. Since the current scheduling method does not include the scheduling of SWML, we cannot indicate if the SWML is always available and is thus added to the whey pasta.
During this study we observed several subjects that are of interest for future research at Domo Borculo:
The scheduling method should consider the pipeline restrictions. The scheduling method must consider the integration of the lactose production with other
production lines. The integration of the scheduling with the planning processes. Research of possible guidelines and restrictions for the arrival of raw material.

vi
Table of Contents Chapter 1: Introduction ..................................................................................................... 1
1.1 Introduction to FrieslandCampina and Domo ..................................................................... 1
1.2 Research Motivation .......................................................................................................... 2
1.3 Problem description ........................................................................................................... 2
1.4 Research questions and methodology ................................................................................ 3
Chapter 2: Production and planning of lactose .................................................................. 6 2.1 Production at the Borculo Factory ...................................................................................... 6
2.2 Detailed description of the lactose production process ...................................................... 6
2.3 Other aspects of the production process .......................................................................... 10
2.4 Planning & Scheduling at Domo Borculo ........................................................................... 10
2.5 Capacity of the lactose production ................................................................................... 12
2.6 Utilization of capacity the bottleneck(s) ........................................................................... 14
2.7 Conclusion ....................................................................................................................... 16
Chapter 3: Literature review ............................................................................................ 17 3.1 Strategic, Tactical and Operational planning ..................................................................... 17
3.2 Characterization of the Domo production process ............................................................ 18
3.3 Classification of scheduling problems ............................................................................... 18
3.4 Classification of solution models ...................................................................................... 19
3.5 Solution models ............................................................................................................... 20
3.6 Measuring the quality of the schedule.............................................................................. 24
3.7 Summary.......................................................................................................................... 25
Chapter 4: Scheduling problem and solving ..................................................................... 26 4.1 Scope ............................................................................................................................... 26
4.2 Basic characteristics of scheduling problem ...................................................................... 28
4.3 Decisions in scheduling problem ...................................................................................... 30
4.4 Scheduling objective, restrictions, and assumptions ......................................................... 32
4.5 Solution method .............................................................................................................. 34
4.6 The proposed heuristic ..................................................................................................... 37
4.7 Motivation for the proposed heuristic .............................................................................. 43
4.8 Conclusion ....................................................................................................................... 48
Chapter 5: Testing the solution ........................................................................................ 50 5.1 Performance measurements ............................................................................................ 50
5.2 Performing the test .......................................................................................................... 51
5.3 Conclusion ....................................................................................................................... 54
vii
Chapter 6: Conclusion & Recommendations.................................................................... 56 6.1 Conclusions ...................................................................................................................... 56
6.2 Limitations ....................................................................................................................... 57
6.3 Recommendations from this research .............................................................................. 57
6.4 Recommendations for future research ............................................................................. 58
Bibliography ....................................................................................................................... 59 Appendix A: Capacity calculation .............................................. Error! Bookmark not defined. Appendix B: Overview of lactose production with pipeline restrictionsError! Bookmark not defined. Appendix C: Schedules from case studies .................................. Error! Bookmark not defined.

viii
List of terms and abbreviations
B&B Branch-and-bound FIS Finite intermediate storage GA Genetic algorithm GOS Galacto-oligosaccharides K1 Crystallization process 1 K2 Crystallization process 2 MILP Mixed Integer Linear Programming ML Mother Liquor NIS No intermediate storage OPL Desugared permeate liquid Post K1 Crystallization process, after K1 SA Simulated annealing STN State task network SW refined Refined sugar water SW WvW Sugar water white from white SW Yellow Sugar water yellow SWML Sugar water mother liquor TS Tabu search UIS Unlimited intermediate storage ZW Zero-wait storage

1
Chapter 1: Introduction This report describes a research performed at FrieslandCampina Domo Borculo in the context of a master thesis for Production and Logistics Management at the University of Twente. We begin with a brief introduction in Section 1.1 to FrieslandCampina and Domo, which is a brand of FrieslandCampina. Section 1.2 provides the motivation of FrieslandCampina for this research, followed by Section 1.3 which describes the problem description at the production site at Borculo. We end this chapter with an overview of our research questions and methodology in Section 1.4.
1.1 Introduction to FrieslandCampina and Domo FrieslandCampina is the largest dairy company in the Netherlands and one of the five largest dairy companies in the world. The company is fully owned by Dairy Cooperation FrieslandCampina, which consists of almost 20,000 members of dairy farmers in the Netherlands, Belgium, and Germany. The current structure of FrieslandCampina is the result of many mergers and acquisitions. Currently, FrieslandCampina has a total of 19,946 employees in 28 countries, an annual revenue of 10.3 billion euro in 2012, and a market of 100 countries (FrieslandCampina, 2013). Its activities are divided into four market-oriented business groups: Consumer Products Europe, Consumer Products International, Ingredients, and Cheese, Butter & Milk powder. Each business group is again divided into different groups per country or product brand.
Figure 1.1: Governance FrieslandCampina
1.1.1 Domo The production chains of the different FrieslandCampina brands are closely linked to each other. This research concerns Domo, which operates in the Ingredients division of FrieslandCampina. In the case of Domo, the main raw material is whey, a liquid that is left after preparing cheese from milk at other FrieslandCampina production locations. Whey is rich in vitamins, minerals, proteins, and lactose. Domo processes these substances into separate ingredients. These ingredients, the final products, have many applications in pharmaceuticals, infant nutrition, and cell nutrition. The products must meet strict quality requirements, because of the vulnerable users: infants and patients. The Domo division has five production locations in the Netherlands: Bedum, Beilen, Borculo, Dronrijp, and Workum. This research is executed in the production location Borculo. The factory in Borculo was established in 1897 and processed the supplied milk from the members of the cooperation into butter and skimmed milk. The production process has changed frequently during the existence of the factory and the different owners. The latest change was from 2001 to 2005,

2
when Friesland Foods decided that the production of high quality products, such as infant food, was more profitable than feed production. Currently, the production process in Borculo is divided in two main flows: the production of protein-rich products and of lactose-rich products. Both production flows produce different qualities of lactose and proteins for different applications. For example, low quality lactose (milk sugar) is used in bakery products, while high quality lactose is used as a carrier in pharmaceuticals by the customers of Domo.
1.2 Research Motivation In 2012, the volume development of the Ingredients group was limited due to the maximum utilization of the production capacity. This also holds for Domo Borculo; the demand for (most of the) Domo products is higher than its current production (FrieslandCampina, 2012).
At the moment, Domo Borculo cannot indicate when and how much product will be ready. The output of the production process is sometimes higher and sometimes lower than expected. For the make-to-order products, this makes them an unreliable partner, since the Sales department has made agreements with customers about delivery dates and quantities, which cannot always be met. In case of the make-to-stock products, Domo Borculo sometimes goes beneath the safety level of inventory, which is undesirable. A reliable planning from Domo Borculo is necessary to be a reliable partner in the process. In order to achieve this, insight and control of the production process is required, which is currently missing. In Section 1.3 we describe the underlying problems why Borculo is currently not able to manage and control the production process.
1.3 Problem description In this research the main focus is on the production of lactose-rich products, because Domo Borculo encounters the most problems with this process. Section 1.3.1 describes the complexities of the production process and Section 1.3.2 describes the current controlling of the process.
1.3.1 Complex production process The production of protein- and lactose-rich products are connected to a certain extent: the whey is split into these two flows (1), as Figure 1.2 shows. Next to that, some of the residuals of the lactose process are used in the protein process (2). The lactose process is divergent, which means that in the output of the process multiple flows emerge. There are also two retour flows (3), where a part of the production flow goes back into an earlier flow of the process and merges with it. Another difficulty that emerges in controlling the process is that all the different processes use the same factory equipment. In other words, there are no dedicated production lines. The divergent production process in combination with the retour flows, no dedicated production lines and the
Figure 1.2: Production process at Domo Borculo
3
exchange of flows between the two main processes is what makes the scheduling of the production process complex. Furthermore, there are many restrictions added to this complexity. For example, most of the semi-finished products are perishable and can only stay a limited time in the buffers before further processing. Due to the high quality standards of the end product and production process, the cleaning of the equipment must be done regularly, because the products must not be ‘contaminated’ with each other or with bacteria. The cleaning process can take up a long time for some equipment and gives long interruptions in production. There are also restrictions on the sequencing of products on certain production equipment.
1.3.2 Current controlling of the process There is no specific software available at Domo Borculo to support the scheduling process. The planning department only schedules two process steps, both concerning the protein process, based on their own insights. For the other process steps, the operators are responsible. They determine the sequence for their process step and decide what the impact will be on the prior or remaining process steps. For some process steps, the operator gets a weekly target that has to be met. Due to the high autonomy of the operator, it can happen that a large part of the production is stopped, because one operator cannot foresee that the buffer of another operator will be full soon. There is no overall synergy by coming up with a consistent schedule.
1.3.3 Uncertainty At the Borculo factory there are two large uncertainties, or in other words variabilities: variability in the degrees of separation and variability in the arrival of the raw material whey.
In the two steps of the lactose production, the flow is separated into the main product and residuals. The exact degree of separation and the new composition of the main flow and residuals is not an exact science, but an approximation. Within the lactose production process, there is currently one part where the degree of separation is not under control, the variation is too large. Reasons for the variability are inter alia the quality of whey, the used equipment, the utilities used, and the settings of the equipment.
Domo is obliged to take all the whey from the cheese factories, where it is released as a waste product. Currently, there are hardly any arrangements about the delivery of the whey to the Borculo factory. The transport of the whey is pushed to Domo, done by the needs of the cheese factory, not those of Domo Borculo.
1.4 Research questions and methodology The causes described in Section 1.3 lead to the following central research question: How can FrieslandCampina Domo Borculo get control over the production of lactose-rich products? Production control is concerned with the coordination of manufacturing activities over a time horizon (McKay et al., 2003). Reinfeld (1987), a founder of the American Production and Inventory Control Society (APICS), describes production control as: ‘’the task of predicting, planning and scheduling work, taking into account manpower, materials availability and other capacity restrictions, and costs so as to achieve proper quality and quantity at the time it is needed and then following up
4
the schedule to see that the plan is carried out, using whatever systems have proven satisfactory for the purpose”. Production control is a large field and is decomposed into several levels. Production control at the goods flow level is concerned with planning, and at the unit control level it is linked to scheduling (McKay et al., 2003). This research focuses on the scheduling of the lactose production process.
To find a solution to the problem statement of this thesis, we divide the central research question into a series of sub questions. Beneath each sub-question we briefly describe the research method. The combined answers to the sub questions form the answer to the central research question.
1. What are the characteristics of the lactose production & planning process and to what
problems do they lead? (Chapter 2) This question gives an overview of characteristics and conditions of the production and planning process to get a better understanding of the underlying problems described in Section 1.3. To obtain information about these subjects, we have a series of interviews with staff of the production and planning department and do observations at the workplace. We collect associated documentation, such as schematic overviews and historical data of the production process, in order to obtain a complete view. With all this knowledge, we analyze the current situation of the production process, which provides a starting point for improvement opportunities.
2. Which methods for scheduling, for a situation similar to Domo Borculo, can be found in literature? (Chapter 3) To answer this question we perform a review and analysis of the relevant scientific literature. We focus on scheduling methods applied in industries with similar characteristics. We describe a review of similarities, differences and applications of the planning and scheduling models and discuss which knowledge can be applied at Domo Borculo. Also, we review the evaluation criteria that are mentioned in literature to review the quality of a schedule and the scheduling process.
3. What is a useful scheduling method for the lactose production at FrieslandCampina Borculo? (Chapter 4) This question provides a solution for the problems described in Chapter 2. First we outline the scheduling problem. The scheduling problem beholds the details and the conditions of the production process as well as the decisions that are needed to solve the scheduling problem. Finally, we propose a method for scheduling the lactose production. The scheduling method is based on the literature study and the main characteristics of the system. We test the model against practical instances and study the differences between the proposed method and the current way of working. To motivate the choice of the proposed solution, we perform a case study based on historical data. Also, we let experts analyze the proposed method and the case studies.
4. How can Domo Borculo test the proposed scheduling method? (Chapter 5) Before Domo Borculo can implement the scheduling method, we propose to first have a testing period. The objective of the test is to measure the quality of the schedules that are

5
generated by the scheduling method. We set up evaluation criteria with the use of the literature review to assess the quality of the schedules that are generated by our scheduling method during the test. Furthermore, we discuss how the project team should be composed, how the schedule is communicated to the operators and who is responsible for recording the criteria.
On the basis of the answers to the above four sub-questions, we answer the central research question and give conclusions and recommendations.
6
Chapter 2: Production and planning of lactose This chapter answers the research question: “What are the characteristics of the lactose production & planning process and to what problems do they lead?”. We provide an overview of the lactose production and planning process at the FrieslandCampina Domo Borculo factory at different abstraction levels. The first part of the chapter, Section 2.1 to Section 2.3, aims at explaining the production process. The second part, Section 2.4, describes the planning and control processes at Domo Borculo. The last part, Section 2.5 and Section 2.6, describes the current performance of the lactose production.
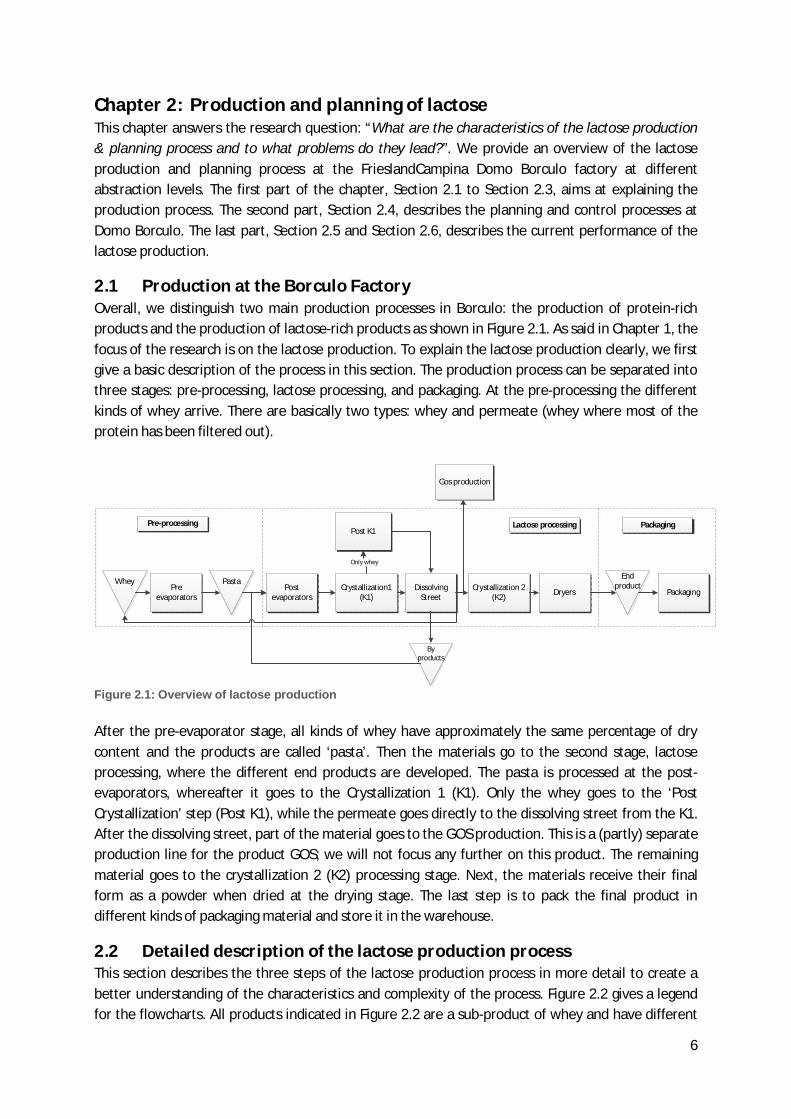
2.1 Production at the Borculo Factory Overall, we distinguish two main production processes in Borculo: the production of protein-rich products and the production of lactose-rich products as shown in Figure 2.1. As said in Chapter 1, the focus of the research is on the lactose production. To explain the lactose production clearly, we first give a basic description of the process in this section. The production process can be separated into three stages: pre-processing, lactose processing, and packaging. At the pre-processing the different kinds of whey arrive. There are basically two types: whey and permeate (whey where most of the protein has been filtered out).
Pre-processing
Pre evaporators
WheyPost
evaporatorsCrystallization1
(K1)Dissolving
Street Dryers PackagingCrystallization 2(K2)
Post K1Lactose processing
End product
Only whey
By products
Gos production
Packaging
Pasta
Figure 2.1: Overview of lactose production After the pre-evaporator stage, all kinds of whey have approximately the same percentage of dry content and the products are called ‘pasta’. Then the materials go to the second stage, lactose processing, where the different end products are developed. The pasta is processed at the post-evaporators, whereafter it goes to the Crystallization 1 (K1). Only the whey goes to the ‘Post Crystallization’ step (Post K1), while the permeate goes directly to the dissolving street from the K1. After the dissolving street, part of the material goes to the GOS production. This is a (partly) separate production line for the product GOS; we will not focus any further on this product. The remaining material goes to the crystallization 2 (K2) processing stage. Next, the materials receive their final form as a powder when dried at the drying stage. The last step is to pack the final product in different kinds of packaging material and store it in the warehouse.
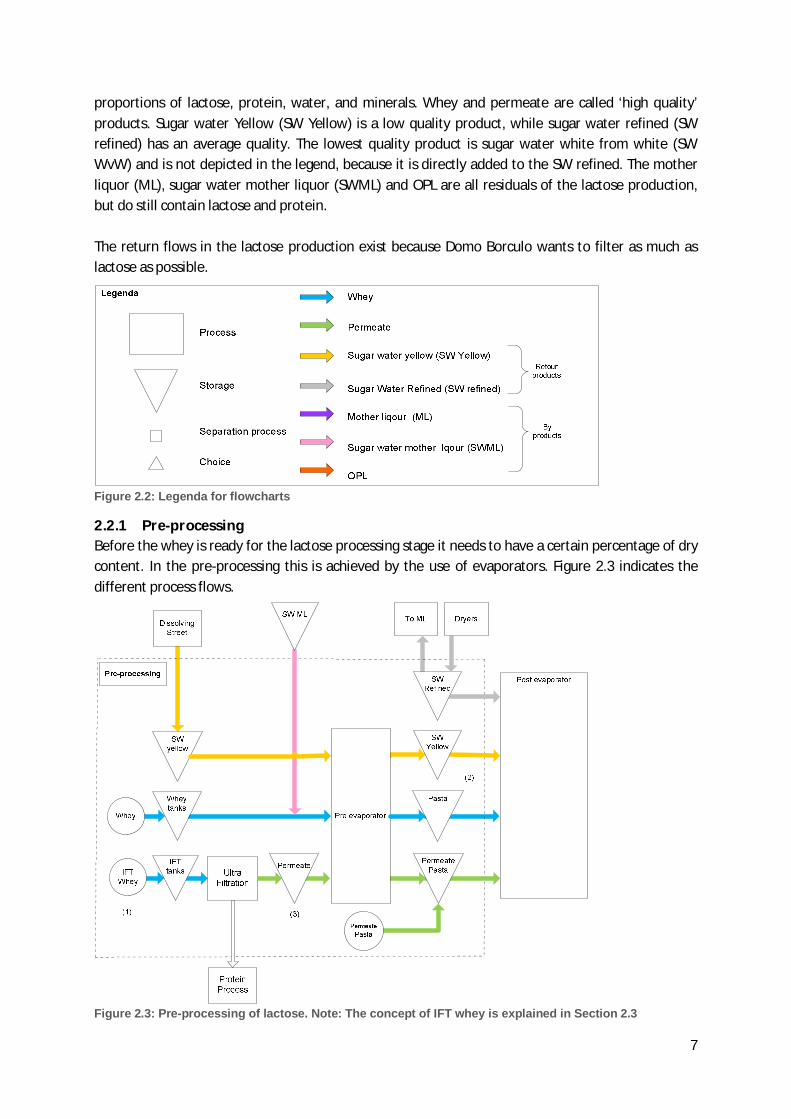
2.2 Detailed description of the lactose production process This section describes the three steps of the lactose production process in more detail to create a better understanding of the characteristics and complexity of the process. Figure 2.2 gives a legend for the flowcharts. All products indicated in Figure 2.2 are a sub-product of whey and have different
7
proportions of lactose, protein, water, and minerals. Whey and permeate are called ‘high quality’ products. Sugar water Yellow (SW Yellow) is a low quality product, while sugar water refined (SW refined) has an average quality. The lowest quality product is sugar water white from white (SW WvW) and is not depicted in the legend, because it is directly added to the SW refined. The mother liquor (ML), sugar water mother liquor (SWML) and OPL are all residuals of the lactose production, but do still contain lactose and protein. The return flows in the lactose production exist because Domo Borculo wants to filter as much as lactose as possible.
Figure 2.2: Legenda for flowcharts
2.2.1 Pre-processing Before the whey is ready for the lactose processing stage it needs to have a certain percentage of dry content. In the pre-processing this is achieved by the use of evaporators. Figure 2.3 indicates the different process flows.
Figure 2.3: Pre-processing of lactose. Note: The concept of IFT whey is explained in Section 2.3
8
There are two storage steps in the pre-processing, where the product can be stored briefly. One is at the arrival of the whey (1) and the other is after the pre-evaporator(2); permeate has a third storage possibility after the Ultrafiltration (3). The SWML is added to the whey in a certain percentage in order to increase the total lactose yield, but only if the product is available. The pre-evaporators consist of continuous production equipment. This means that the lactose product flows through the pre-evaporator while being processed. So during production, the lactose product flows out of the first storage stage, through the pre-evaporator, to the second storage stage.
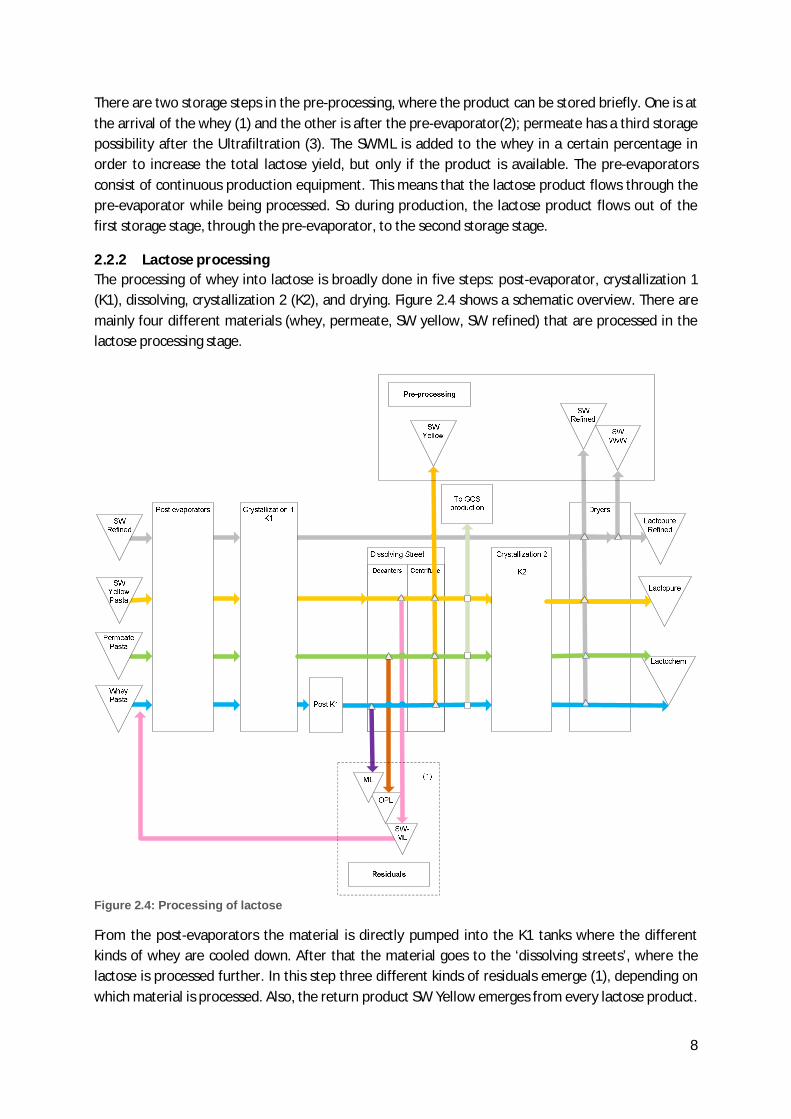
2.2.2 Lactose processing The processing of whey into lactose is broadly done in five steps: post-evaporator, crystallization 1 (K1), dissolving, crystallization 2 (K2), and drying. Figure 2.4 shows a schematic overview. There are mainly four different materials (whey, permeate, SW yellow, SW refined) that are processed in the lactose processing stage.
Figure 2.4: Processing of lactose
From the post-evaporators the material is directly pumped into the K1 tanks where the different kinds of whey are cooled down. After that the material goes to the ‘dissolving streets’, where the lactose is processed further. In this step three different kinds of residuals emerge (1), depending on which material is processed. Also, the return product SW Yellow emerges from every lactose product.
9
The post-evaporators also consist of continuous production equipment. The K1 stage consists of tanks and thus has batch equipment. The dissolving streets have semi-continuous production equipment. After the dissolving street the material can go into two directions: to the GOS production or further to the lactose processing. The operator views if there is material required at the GOS production. If this is the case the material goes to the GOS production, otherwise the material goes further to the crystallization 2. Here the product is cooled down again. Then finally the material goes to the dryers, were it gets its final solid state. The dryers are continuous production equipment. At the drying process, two kinds of residuals arise: the SW WvW contains the lowest amount of lactose and the SW refined contains somewhat more lactose. Domo Borculo adds SW WvW to the SW Yellow at the pre-processing or sells it. The SW refined goes to the pre-processing.
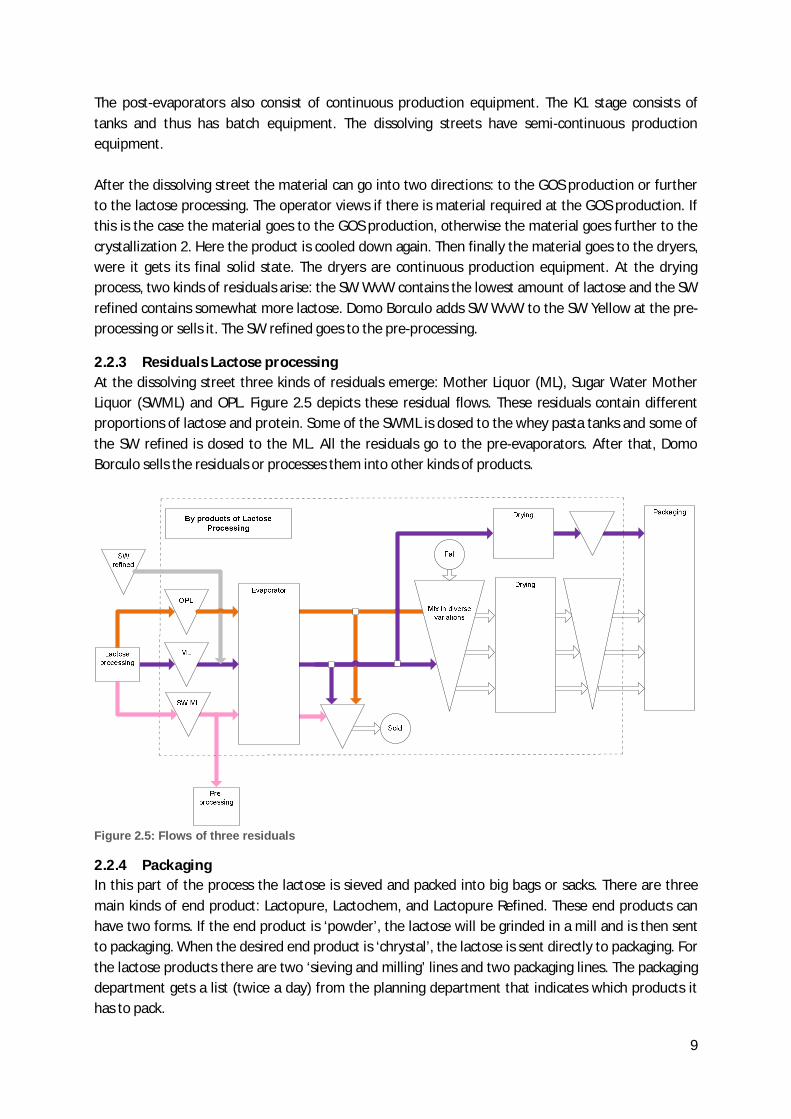
2.2.3 Residuals Lactose processing At the dissolving street three kinds of residuals emerge: Mother Liquor (ML), Sugar Water Mother Liquor (SWML) and OPL. Figure 2.5 depicts these residual flows. These residuals contain different proportions of lactose and protein. Some of the SWML is dosed to the whey pasta tanks and some of the SW refined is dosed to the ML. All the residuals go to the pre-evaporators. After that, Domo Borculo sells the residuals or processes them into other kinds of products.
Figure 2.5: Flows of three residuals
2.2.4 Packaging In this part of the process the lactose is sieved and packed into big bags or sacks. There are three main kinds of end product: Lactopure, Lactochem, and Lactopure Refined. These end products can have two forms. If the end product is ‘powder’, the lactose will be grinded in a mill and is then sent to packaging. When the desired end product is ‘chrystal’, the lactose is sent directly to packaging. For the lactose products there are two ‘sieving and milling’ lines and two packaging lines. The packaging department gets a list (twice a day) from the planning department that indicates which products it has to pack.
10
2.3 Other aspects of the production process Next to the description of the production process, there are other relevant aspects of the production process that we introduce in this section.
2.3.1 Raw material: Whey The main raw material of all end products made in Borculo is whey. The whey is delivered in several forms to the factory. The forms differ in two main ways: (I) the amount of dry content and (II) if the whey is IFT or non-IFT1. The non-IFT whey can only be used for regular production; the IFT whey can be used for regular and special production. So, a shortage in the supply of non-IFT whey can be forestalled. Hence it is more expensive to use the IFT-whey for products that can also be made out of non-IFT whey. Each kind of whey needs a different kind of preparation before it can go to the lactose processing; Figure 2.3 shows this. When the whey is already filtered it arrives as permeate. This process is also done at the factory in Borculo at the ultra-filtration.
2.3.2 Cleaning To prevent contamination of the products, Domo Borculo cleans all equipment with acid, lixivium or a combination. How often the cleaning takes places depends on the equipment, the kind of product switch that is made, and the hours between cleanings. Now we discussed the production flows at Domo Borculo, we explain more about the planning and scheduling of these production flows.
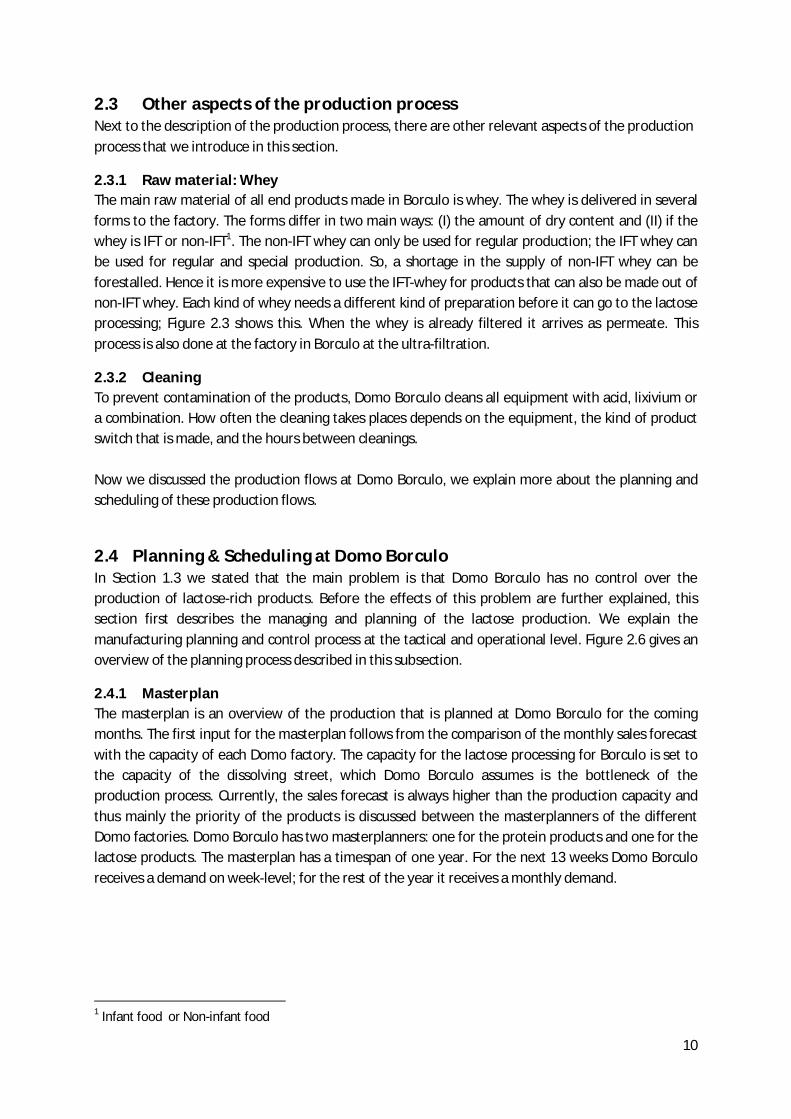
2.4 Planning & Scheduling at Domo Borculo In Section 1.3 we stated that the main problem is that Domo Borculo has no control over the production of lactose-rich products. Before the effects of this problem are further explained, this section first describes the managing and planning of the lactose production. We explain the manufacturing planning and control process at the tactical and operational level. Figure 2.6 gives an overview of the planning process described in this subsection.
2.4.1 Masterplan The masterplan is an overview of the production that is planned at Domo Borculo for the coming months. The first input for the masterplan follows from the comparison of the monthly sales forecast with the capacity of each Domo factory. The capacity for the lactose processing for Borculo is set to the capacity of the dissolving street, which Domo Borculo assumes is the bottleneck of the production process. Currently, the sales forecast is always higher than the production capacity and thus mainly the priority of the products is discussed between the masterplanners of the different Domo factories. Domo Borculo has two masterplanners: one for the protein products and one for the lactose products. The masterplan has a timespan of one year. For the next 13 weeks Domo Borculo receives a demand on week-level; for the rest of the year it receives a monthly demand.
1 Infant food or Non-infant food
11
Figure 2.6: Overview of planning processes at Domo and Domo Borculo
2.4.2 Whey planning The cheese factories give a forecast of the whey they will produce and then the whey is divided on the different Domo production locations. FrieslandCampina is obliged to take all the whey from the internal as well as the external factories. Currently, FrieslandCampina makes more profit from processing of whey than from the direct sales of the whey. Therefore, the factory in Borculo utilizes the production capacity to its fullest. First, the whey is divided over the locations based on sales forecast (market driven) and then divided on available production capacity of each factory (supply driven). The amount of whey that is left after market driven partition is divided over the production location based on capacity of the particular location. In case not all whey can be processed the remaining whey will be sold; in weeks where there is a whey shortage FrieslandCampina buys extra.
2.4.3 Operational: weekly planning The operational planners receive the two-week planning from the masterplanners. They develop a detailed schedule for the UF filter, the packaging department, GOS production, and parts of the protein production. The lactose production has no schedule, but the packaging of the final lactose products is scheduled at day-level. The packaging department and the protein production are out of the scope of this research and we do not discuss them any further.
The operational planners at Domo Borculo create a plan based on experience. They use excel or word to set up the plan. The plans are not specifically linked to each other, while the production processes
12
are. Some schedules, such as the UF-filter schedule, are detailed and describe a plan at hour-level. Other schedules, such as the GOS production, have a production guideline per day. The operator determines the exact execution of the plan. The lactose production does not have a schedule, but the planning department does have a weekly target for the lactose. This weekly target is based on the production capacity of the dissolving streets. The GOS production uses part of the lactose production from the dissolving street as ‘raw material’. The planning department decides how much product goes to the GOS production each week, but in regular production weeks this is about 40%. The operator at the dissolving street decides in consultation with the operator at the GOS production, when lactose product goes to the GOS production. When there is no lactose product needed at the GOS production, the lactose product goes further in the lactose processing to the K2.
2.4.4 Operational whey planning The operational planners send the UF plan to the operational whey planner. The operational whey planner makes a weekly plan for the whey based on the whey plan and the UF plan of Borculo. For every day, the wheyplanner determines for every kind of whey how many ton is sent to each Domo factory. This plan is adapted multiple times a day, depending on the request of the operational planners of the different locations and the available whey.
2.4.5 Day-to-day control of the lactose production The operators of the three stages, pre-processing, processing, and packaging, all work at a different location in the factory. Every 8 hours a new shift starts and thus a new team of operators with one process coordinator is responsible for the lactose and protein production. Each production step, as depicted in Figure 2.1, has its own operator. The exception is for K2, which is operated by the operators from the previous and subsequent processing step. The operators decide themselves which product to process at which equipment, often in consultation with the operators of the subsequent production step. The main policy is to use the ´first in first out’- rule, but it is not always possible to use this rule for different reasons.
What differs in the strategy between the operators is, for instance, the amount of full or empty tanks they buffer before starting production. At the post-evaporators for example, one operator always waits until 3 tanks are empty in K1, while another operator waits until 1.5 tanks are empty. This can have a big influence on the utilization of the production step. There are also many other effects the operator needs to keep in mind such as the by-product buffers and the limited accessibility of the pipe works to and from the different processing equipment. The guidelines each operator works with are hard to capture in data, but have been extracted from conversations with operators.
2.4.6 Conclusion At the tactical level, Domo Borculo bases the plan for the lactose production on the available whey and the production capacity that is based on the target at the dissolving street. At the operational level a daily plan for the arrival of whey is made. No plan or schedule is made for the lactose production; the daily controlling is left to the operators, which leads to a difference in performance at the dissolving street.
2.5 Capacity of the lactose production This section discusses the theoretical capacity and the current capacity used at the lactose production. The starting point of the capacity analysis are the post-evaporators, because before this processing step the last raw material is supplied. For the calculation of the capacity we assume stock
13
and buffers to be infinite. Appendix A shows the exact calculations of the capacity and the accompanying assumptions. All the data is based on calculations from April to July 2013 unless mentioned otherwise.
Figure 2.7 depicts the theoretical capacity of the different steps in the lactose production. We include cleaning time, but do not account for maintenance. As one can see, the calculated capacities of all production steps lie very close to each other. After the dissolving street, part of the lactose production goes to the GOS production, which is approximately 40% of the flow. Thus we conclude that K2 and the drying stage both are not the bottleneck, because the production flow is almost halved.
Not depicted due to confidentiality
Figure 2.7: Theoretical capacity of the lactose production in tons per hour (t/h) Figure 2.7 shows that the dissolving street is the bottleneck of the production system. However, the capacity of the dissolving street is not constant and is thus based on an average. The capacity of the dissolving street depends inter alia on the degree of separation and the amount of product needed for one dissolving charge. Figure 2.8 depicts the amount of lactose product needed per charge and the accompanying capacity of the dissolving street. It is known that Domo Borculo does not have these two variables under control; therefore another research is started at Domo Borculo that focusses on these variables.
Not depicted due to confidentiality
Figure 2.8: Capacity of the dissolving street depending on the amount of product used per charge
Current capacity of the lactose production As stated the capacity of the batch processing stages (K1 & K2) is very dependent on the number of tanks that are available in the stage and the batch time. In reality, the batch time consist for a part of waiting time. The lactose product must wait for a few hours in the tank after the cooling time is completed, before it is processed in the next production stage. Figure 2.9 shows that the long waiting times have a big influence on the capacity of K1 and K2. It is clear that the bottleneck of the process is currently the K1 stage, as it has a lower capacity than the dissolving street.
14
Not depicted due to confidentiality
Figure 2.9: Current capacity of the lactose production
Conclusion The capacity of the lactose production depends on the K1 or the dissolving street. Theoretically both can be the bottleneck in different situations. Currently the K1 stage is the bottleneck due to the long waiting times. About 40% of the lactose product goes to the GOS production after the dissolving street. Therefore K2 and the dryers only get part of the production flow to process, which eliminates these processing stages as potential bottleneck.
2.6 Utilization of capacity the bottleneck(s) In Section 2.5 we concluded that the K1 and the dissolving street can both be the bottleneck. We also showed that the K1 is currently the bottleneck due to the long waiting times of a batch in K1. This section provides a calculation of the utilization of the dissolving street and the K1 stage; Appendix A provides a more detailed calculation.
2.6.1 Current utilization of capacity The utilization of the bottleneck determines the output of the lactose production. Table 2.1 shows the utilization of the dissolving street and K1. The utilization of capacity at the dissolving street can be calculated in two ways. First, by the number of dissolving charges that is processed and second by the tons of product dissolved. Utilization differs between these two concepts, because the amount of product used for one dissolving charge is not always the same. Domo Borculo does not have a firm control over this step of the production process. In the desired situation these two utilizations should be close to one another, which would mean that the variation in the amount of lactose product used per charge is minimal. To determine the utilization of the dissolving street, we decide to use the number of dissolving charges. This shows the time the dissolving street is working, which is currently more accurate than the amount of product processed.
We base the utilization of capacity in the K1 processing stage on the amount of product processed in a certain time period in K1 compared to the theoretical capacity from Figure 2.7.
Note that the utilization calculation accounts for cleaning times and special production (when only one street is used). So the maximum utilization is based on a reachable production figure, which could be met weekly.
Utilization of dissolving street capacity in # dissolving charges 75.1% Utilization of K1 63.9% Table 2.1: Average utilization of capacity adjusted for maintenance, cleaning, and special production
The utilization of K1 is lower than the utilization of the dissolving street. Due to the low utilization of K1, the K1 is currently the bottleneck in the process and not the dissolving street. As stated in Section 1.3 the demand of lactose is higher than the output of the production at Domo Borculo. With their current way of working they have not been able to raise production output by raising the

15
underutilization of K1 and therefore Domo Borculo misses out on production. Section 2.6.2 discusses the causes of the current utilization at K1 and the dissolving street to illustrate where there is room for improvement.
2.6.2 Causes for current utilization of K1 and dissolving street This section first discusses the causes for missed production at the dissolving street and then for the K1 processing stage to illustrate the complexity of eliminating the K1 as a bottleneck.
Dissolving street Since a few months the operators keep track of the causes when the dissolving street is stopped or is tuned to a lower capacity. Table 2.2 shows these different causes. The utilization is based on the tons of product the dissolving street should be able to process. The percentages for each cause are related to the tons of production loss. For example, 15 % of the tons missed production is caused due to the fact there was no material available in K1 and Post-K1. Cause Indicated by operator 1 Not enough product available (K1 & Post K1) 15.4% 2 Cleaning 12.7% 3 Special production 11.6% 4 K2 full 11.1% 5 Switch to other product 9.0 % 6 Maintenance 8.4% 7 By product buffers full 7.2% 8 Technical failure 6.3% 9 Bad filtration 2.6 % 10 SW Yellow buffer full 0.3% 11 Other 15.0 % Table 2.2: Causes of missed production at the dissolving street (from week 17 to 34 2013)
A great part of the causes, 33.9% (1, 4, 7, 10), we can directly relate to the controlling of the lactose production. As a (potential) bottleneck, the dissolving street should always have product available for processing and a possibility to store the outgoing flow. The operators indicated that for 33.89% of all the causes this is not possible. The switching to other products is also related to the controlling of the process and can possible be reduced when having a better control of the process. Maintenance and technical failures are causes that cannot be fully eliminated, but could possibly be reduced.
Causes of underutilization K1 The low utilization for K1 could be caused by two variables: the batch size and the batch time. In Section 2.5 we already showed that the capacity is influenced by the long batch times due to the waiting times in K1. The batch size has influence on the utilization, because the processing times are independent of batch size. When a tank is not filled to maximum, the used capacity is lower. Table 2.3 shows the average filling percentage of a tank in K1. For instance, if whey is in a K1 tank the tank is approximately filled for 89.2%. Whey SW Yellow Permeate SW refined 89.2% 83.2% 90.9% 66.8% Table 2.3: Average usage of tank
16
2.7 Conclusion The lactose production process of Domo Borculo mainly processes four materials: whey, permeate, SW Yellow, and SW refined. SW Yellow and SW refined are actually residuals that emerge during the production process, but are then used as raw material for the production process. These two products are a constant loop in the production process. Three other residuals that emerge (ML, OPL, and SWML) are processed further in another part of the production system. Domo Borculo bases the tactical plan for the lactose production on the available whey and the available production capacity. On daily basis, a plan for the arrival of whey and permeate is made. No schedule is made for the lactose production; the operators are mainly in charge of managing and controlling the lactose production. Due to the number of variables an operator has to take into account, they cannot always foresee the outcome of their actions. Apparently, it is hard to consider the complete complexity of the production system only with human logic. We can relate 33.9% of the missed production directly to the planning of the lactose production. Furthermore, because each operator has his own way of working, the lactose production process becomes unpredictable, since each operator utilizes the K1 and the dissolving street differently. The current way of working results in the occurrence of K1 as bottleneck, when actually the dissolving street is the bottleneck. So, the output of the production process is lower than possible, while the demand of the lactose production is higher than the current output of the production system. This makes the current way of working in the production system a problem. To improve the control over the lactose production process of Domo Borculo, we do a literature review on scheduling theory in Chapter 3.
17
Chapter 3: Literature review In Chapter 2 we did an elaboration of the current situation and a problem analysis. In this chapter we outline the theoretical framework for this research by answering the research question: “Which methods for scheduling, for a situation similar to Domo Borculo, can be found in literature?”. First we give a general description of the manufacturing planning and control processes in Section 3.1. There is a great amount of literature about planning and scheduling. To give a more focused literature review, we characterize the production process at Domo Borculo in Section 3.2. Section 3.3 describes the different characteristics of scheduling problems and Section 3.4 describes the characteristics of solution models. We use these characteristics to classify the solution methods found in literature and discussed in Section 3.5. The chapter closes with a brief summary and discussion.
3.1 Strategic, Tactical and Operational planning Any manufacturing organization develops its production plans traditionally in three stages: strategic, tactical, and operational. These three stages have different types of decisions and objectives, managerial levels, time horizons and planning frequencies, levels of details, and also different modeling assumptions (Hans et al., 2007). Strategic planning has the basic objective to create a production environment that is able to meet the strategic goals of the company and is concerned with a long-term horizon (Hopp et al., 2008). In this stage, organizations develop an aggregate planning module that reflects timing and quantity of total future production over the long-range (APICS, n.d.).
Tactical planning is concerned with the medium-range planning horizon and allocates the resources as profitable and effectively as possible. Generally, the resources to be allocated are machines, workforce, and storage. The aggregated plan works as a constraint on the tactical planning, however, resources can be temporarily decreased or increased (Hans et al., 2007). In companies this information is often presented in a master production schedule, which represents what the company plans to produce expressed in specific configurations, quantities and dates (Das et al., 2000).
Operational planning has a greater level of detail and thus the planning horizon is considerably shorter, i.e. one or two weeks. This short-term planning, mostly referred to as scheduling, provides a feasible production schedule for every day operations; it describes the sequencing and assignment of products to machines (Das et al., 2000).
In this thesis we focus specifically on the operational planning level. However, the boundaries of tactical planning and operational scheduling problems are not well established and there is integration between each of these decision making stages. Therefore, many authors address the planning and scheduling problems simultaneously. Wu et al. (2007) define two categories of the way authors address these integrated problems. The more traditional approach is to cover the planning and scheduling problem in one large model. The second approach is to decompose the problem into sub problems which can be managed separately and is called the hierarchical approach (Hans et al., 2007) (Rutten, 1993). We choose to use the hierarchical approach and to focus only on the operational level.

18
3.2 Characterization of the Domo production process The scientific literature in the scheduling area is extensive. To give a focused literature review, we first characterize the production process of Domo Borculo within the scientific literature.
From literature we find that two types of manufacturing can be distinguished: process and discrete manufacturing. Discrete manufacturing is associated with bills of materials and routing while process manufacturing “adds value to materials by mixing, separating, forming or chemical reactions” (APICS, n.d.). The process industry consists of companies processing homogeneous products in at least one stage of the production process (Artiba et al., 1998). Fransoo et al. (1993) define typical characteristics of process manufacturing businesses such as the variability in the quality of raw materials and the residuals that emerge due to the divergence of the production process. Also, raw materials are often perishable in the process industry, which sets constraints on the production planning (Crama et al., 2001). Note that not all process industries are characterized by these issues, but that they will predominantly be found in the process industry and not in the discrete manufacturing industry (Kallrath, 2002b).
From the above information we conclude that Domo Borculo is in the process industry, since it adds value to whey (a perishable material) by separating it in a number of steps into different final products. Due to the special characteristics of the process industry, the scheduling formulations for discrete manufacturing do not fit and there is not a general technique proposed for scheduling (Crama et al., 2001; Rutten, 1993). In Section 3.3, we give an overview of the characteristics of scheduling problems in the process industry.
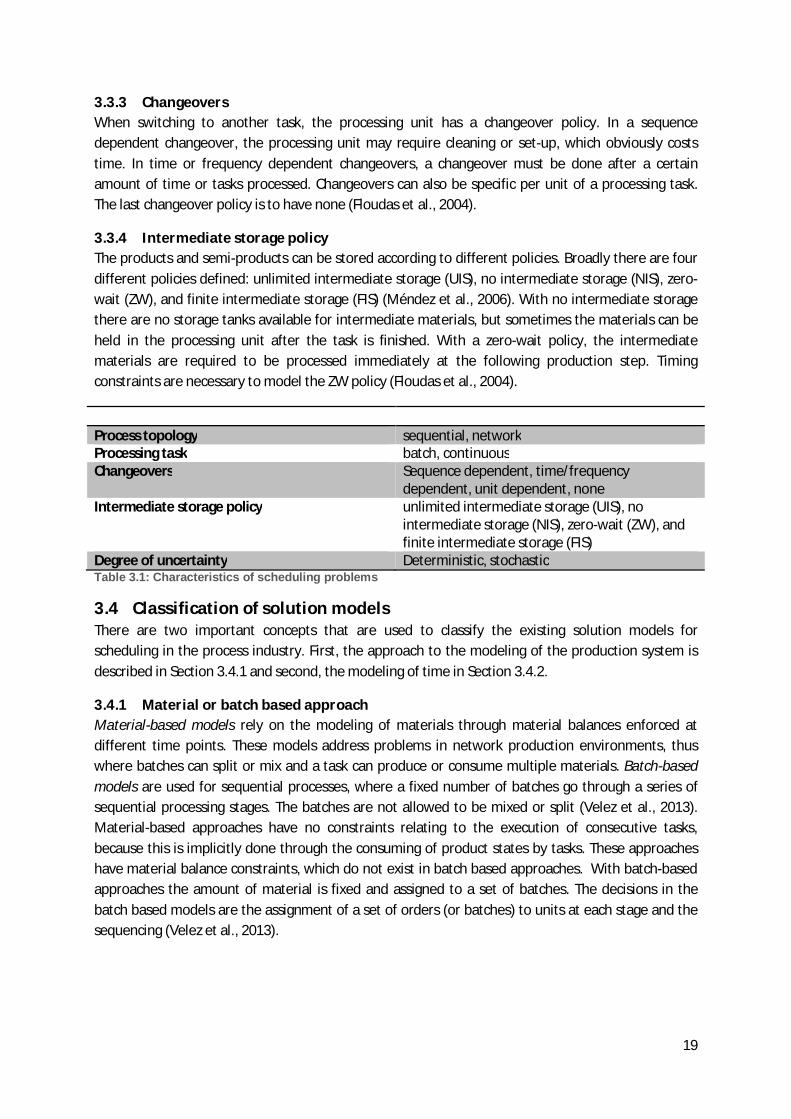
3.3 Classification of scheduling problems The diversity of factors that should be taken into account in the process industry makes the development of a general schedule method difficult (Méndez et al., 2006). Table 3.1 gives an overview of the various characteristics and shows that there are many different scheduling problems. This section highlights a few important characteristics.
3.3.1 Process topology All scheduling problems in the process industry can be broadly classified in network- or sequential-based processes. The basic difference between these two is that in a network-based plant the splitting, mixing, and recycling of batches is allowed. Contrary, with a sequential-based process the batch identity needs to be preserved (Méndez et al., 2006). Production processes of the sequential-based approach are again divided into two groups: multiproduct or multipurpose (Qian et al., 2009). The term multiproduct plant is used for a plant that uses a similar process for the sequential production of different but very similar products. Often these plants only produce a limited number of products. In multipurpose plants there are various products by various routes. Different products often require different settings of equipment and so equipment units can be used for different tasks.
3.3.2 Processing task Two types of processing tasks are distinguished: continuous and batch tasks. Continuous tasks usually have a fixed processing rate. So the duration of the processing increases with an increasing amount of product being processed. Often there is a minimum and maximum restriction on the duration of the task. Also the final products are added to stock during the execution of the tasks instead of at the end time of the task. Batch tasks have a fixed batch size and duration. The entire final products are available at the end of the task execution (Floudas et al., 2004).
19
3.3.3 Changeovers When switching to another task, the processing unit has a changeover policy. In a sequence dependent changeover, the processing unit may require cleaning or set-up, which obviously costs time. In time or frequency dependent changeovers, a changeover must be done after a certain amount of time or tasks processed. Changeovers can also be specific per unit of a processing task. The last changeover policy is to have none (Floudas et al., 2004).
3.3.4 Intermediate storage policy The products and semi-products can be stored according to different policies. Broadly there are four different policies defined: unlimited intermediate storage (UIS), no intermediate storage (NIS), zero-wait (ZW), and finite intermediate storage (FIS) (Méndez et al., 2006). With no intermediate storage there are no storage tanks available for intermediate materials, but sometimes the materials can be held in the processing unit after the task is finished. With a zero-wait policy, the intermediate materials are required to be processed immediately at the following production step. Timing constraints are necessary to model the ZW policy (Floudas et al., 2004).
Process topology sequential, network Processing task batch, continuous Changeovers Sequence dependent, time/frequency
dependent, unit dependent, none Intermediate storage policy unlimited intermediate storage (UIS), no
intermediate storage (NIS), zero-wait (ZW), and finite intermediate storage (FIS)
Degree of uncertainty Deterministic, stochastic Table 3.1: Characteristics of scheduling problems
3.4 Classification of solution models There are two important concepts that are used to classify the existing solution models for scheduling in the process industry. First, the approach to the modeling of the production system is described in Section 3.4.1 and second, the modeling of time in Section 3.4.2.
3.4.1 Material or batch based approach Material-based models rely on the modeling of materials through material balances enforced at different time points. These models address problems in network production environments, thus where batches can split or mix and a task can produce or consume multiple materials. Batch-based models are used for sequential processes, where a fixed number of batches go through a series of sequential processing stages. The batches are not allowed to be mixed or split (Velez et al., 2013). Material-based approaches have no constraints relating to the execution of consecutive tasks, because this is implicitly done through the consuming of product states by tasks. These approaches have material balance constraints, which do not exist in batch based approaches. With batch-based approaches the amount of material is fixed and assigned to a set of batches. The decisions in the batch based models are the assignment of a set of orders (or batches) to units at each stage and the sequencing (Velez et al., 2013).

20
3.4.2 Event representation Time representation can be done in discrete time or continuous time. In discrete-time models the time horizon is divided into finite number of intervals with predefined durations. The beginning and ending of tasks only happen at the boundaries of the time intervals, consequently scheduling constraints only have to be observed at these known time points (Maravelias et al., 2003). This reduces the complexity of the models and makes the model structure simpler and easier to solve (Méndez et al., 2006). A major disadvantage of discrete scheduling is that it can create sub-optimal or even infeasible schedules, because the discrete-time formulations are only an approximation of the actual problem. However, a recent study suggest that discrete representation of time leads to formulations which are at least as effective as continuous time models (Velez et al., 2013).
Another way of handling time is to treat it as continuum, where the problem is divided into a set of events. The time horizon in continuous models is divided into intervals of unequal and unknown duration (Maravelias et al., 2003). The handling of variable time obtains a significant reduction of the number of variables in the model. However, the model complexity is increased due to extensive modeling of resource and inventory limitations (Méndez et al., 2006). Figure 3.1 provides an example of a continuous time representation, however there are different continuous time representations used.
3.5 Solution models This section highlights the scheduling techniques that are often cited in literature. We discuss the mathematical programming methods in Section 3.5.1 and the heuristic methods in Section 3.5.2. For the review of planning and scheduling methodologies in the scientific literature we use the reviews of different authors. Tan et al. (2000) reviewed the integration of production planning and scheduling models. Kallrath (2002a), Stobbe et al. (2000), Crama et al. (2001), Dennis et al. (2000), Neumann et al. (2005), and Méndez et al. (2006) give an overview of scheduling for batch and continuous processes in the process industries. Furthermore, we used the review of Floudas et al. (2004) who provide a review of the scheduling of chemical processes. From all these reviews we discuss the articles that describe similar production process to that of Domo Borculo. Table 3.2 gives an overview of the discussed literature in Section 3.5.1 to Section 3.5.5. Most models for process production scheduling are only suitable to limited classes of problems and use simplified assumptions. Assumptions often made are the batching problem has already been solved (and thus is decoupled from the scheduling problem) or that the batch size is fixed. The assumption that batches are fixed can be done under two conditions: (i) the demand is fixed and (ii) the parallel units in each stage are similar in terms of capacity (Prasad et al., 2008). Another assumption often stated is that of unlimited storage availability.
Figure 3.1: Event representation (Maravelias et al., 2003)
21
3.5.1 Mathematical programming Mathematical programming techniques are the most applied methods for scheduling problems in the process industry. Mixed-Integer Linear Programming (MILP) is used widely, because of its rigorousness, flexibility, extensive modeling capability, and the discrete decisions that are involved in assignment and sequencing decisions (Kopanos et al., 2011) (Grossmann et al.) Although the suggestions for modeling of scheduling problems is extensive, the ability to solve the resulting formulations remains limited (Velez et al., 2013). One of the most important issues in the application of mixed-integer programming techniques is the computational time of the solution due to the fact that realistic problems often produce large scale models. To decrease the computational time several approaches have been proposed. We discuss the most common used approaches: reformulation of the scheduling problem, decomposition methods, and interventions of the brand & bound procedure.
3.5.2 Reformulation The constraints of the MILP can be written in an alternative form to decrease the computational time. Most literature here is aimed at the reduction of binary variables, as they determine the speed of the solution for a large part (Qian et al., 2009).
Neumann et al. (2005) deal with batch, semi-continuous, and continuous production in process industries with different intermediate storage facilities. They formulate a general production scheduling problem use a relaxation principle where the resource constraints are deleted. If any resource conflicts occur, they introduce linear constraints in the relaxation. The resolving of the resource conflicts and refining the resource relaxation is repeated until a feasible schedule is found or the resource conflict cannot be resolved, which results in a branch-and-bound algorithm. For larger problem instances they propose that one should use a truncated procedure.
3.5.3 Intervention of the branch and bound solution procedure Another strategy is to intervene in the branch and bound search process to decrease the computational time. Schilling et al. (1996) present a general STN-based mathematical formulation for process scheduling with a continuous time presentation. They propose a branch-and-bound algorithm for the relaxation of the MILP that branches on the discrete as well as the continuous variables, this method will reduce the integrality gap. They apply their method to an example problem with 5 tasks, two raw materials, two final products, and limited intermediate storage capacity. They find a feasible solution, however they do acknowledge that the computational burden still is substantial and more has to be adjusted to have a practical applicability.
Velez et al. (2013) developed a parallel branch-and-bound algorithm using a discrete time model. A regular branch-and-bound algorithm divides the problem into a series of smaller problems (branching), called nodes, by bounding the integer variable. Nodes that are infeasible or have a lower bound that is greater than the current upper bound (for minimization problems) are pruned. Velez et al. (2013) bound the number of times a task runs in a processing unit. Each node is solved as an MIP for a short time, which allows them to find integer solutions while limiting the time.
3.5.4 Decomposition methods The decomposition methods divide a large and complex problem to smaller sub problems, which can be solved more efficiently. An example of the decomposition method is that of Neumann et al. (2002), who decompose their approach in a batching problem and a batch scheduling problem. The
22
batching problem is modeled as a MILP and solved with CPLEX; the solution provides the number and sizes of batches for all tasks. With this first step they aim to minimize the workload to be scheduled, so that the batch scheduling problem is easier. The batch scheduling problem assigns a processing unit and a time interval to each batch and is solved with a beam search procedure. Beam search is a heuristic, based on branch-and-bound, that explores the most promising node. However, Neumann et al. do not exactly indicate how they select this most promising node. They apply there method to a fictive plant with eight production steps, one raw material and six final products. After each production step there is finite intermediate storage available. They found a feasible solution within a time of 56 seconds.
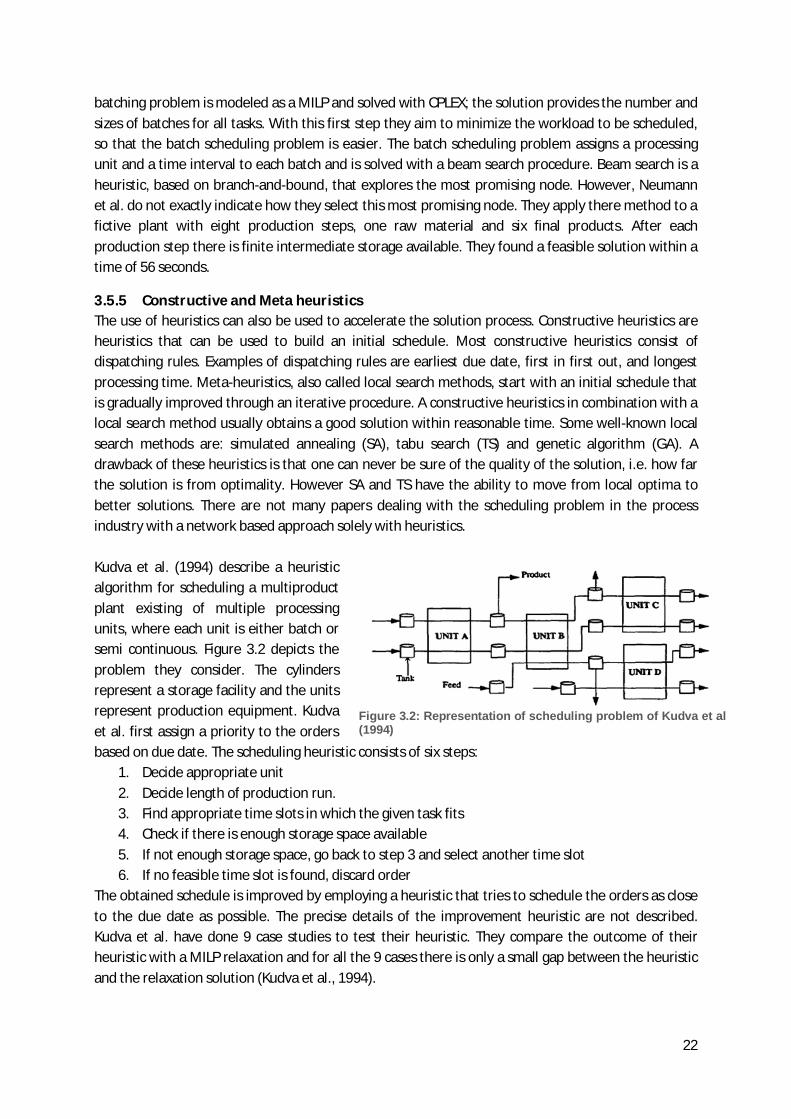
3.5.5 Constructive and Meta heuristics The use of heuristics can also be used to accelerate the solution process. Constructive heuristics are heuristics that can be used to build an initial schedule. Most constructive heuristics consist of dispatching rules. Examples of dispatching rules are earliest due date, first in first out, and longest processing time. Meta-heuristics, also called local search methods, start with an initial schedule that is gradually improved through an iterative procedure. A constructive heuristics in combination with a local search method usually obtains a good solution within reasonable time. Some well-known local search methods are: simulated annealing (SA), tabu search (TS) and genetic algorithm (GA). A drawback of these heuristics is that one can never be sure of the quality of the solution, i.e. how far the solution is from optimality. However SA and TS have the ability to move from local optima to better solutions. There are not many papers dealing with the scheduling problem in the process industry with a network based approach solely with heuristics. Kudva et al. (1994) describe a heuristic algorithm for scheduling a multiproduct plant existing of multiple processing units, where each unit is either batch or semi continuous. Figure 3.2 depicts the problem they consider. The cylinders represent a storage facility and the units represent production equipment. Kudva et al. first assign a priority to the orders based on due date. The scheduling heuristic consists of six steps:
1. Decide appropriate unit 2. Decide length of production run. 3. Find appropriate time slots in which the given task fits 4. Check if there is enough storage space available 5. If not enough storage space, go back to step 3 and select another time slot 6. If no feasible time slot is found, discard order
The obtained schedule is improved by employing a heuristic that tries to schedule the orders as close to the due date as possible. The precise details of the improvement heuristic are not described. Kudva et al. have done 9 case studies to test their heuristic. They compare the outcome of their heuristic with a MILP relaxation and for all the 9 cases there is only a small gap between the heuristic and the relaxation solution (Kudva et al., 1994).
Figure 3.2: Representation of scheduling problem of Kudva et al (1994)
23
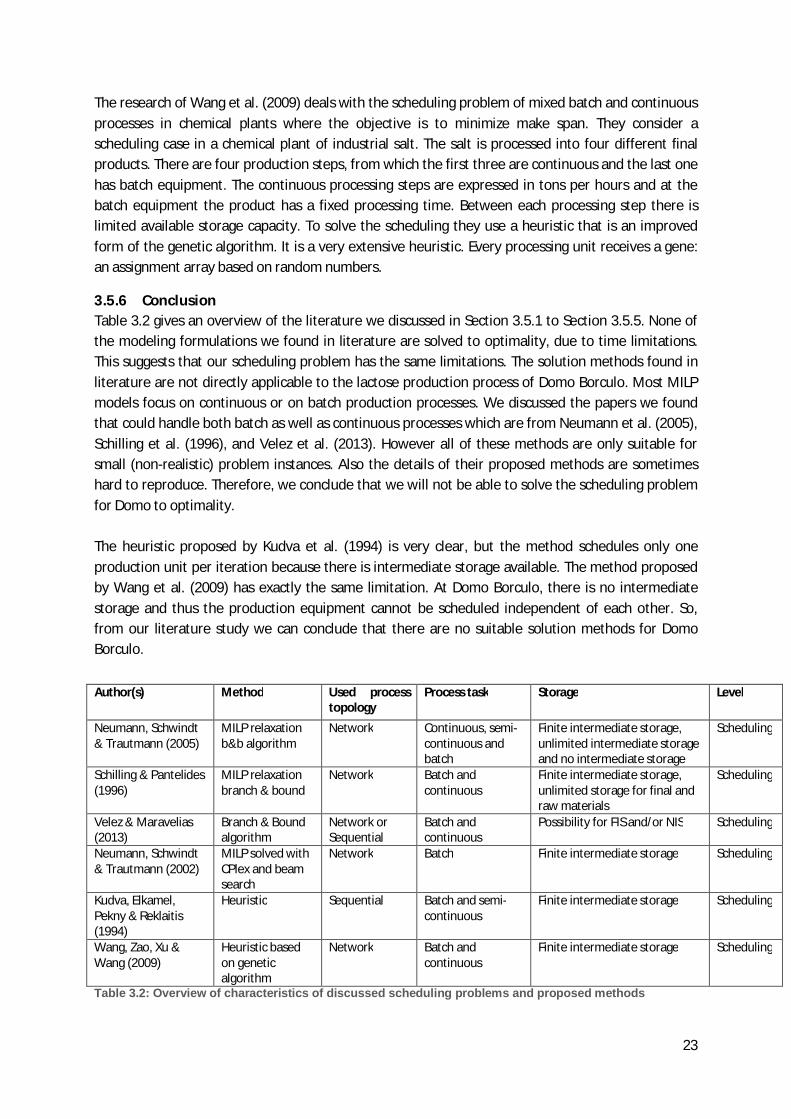
The research of Wang et al. (2009) deals with the scheduling problem of mixed batch and continuous processes in chemical plants where the objective is to minimize make span. They consider a scheduling case in a chemical plant of industrial salt. The salt is processed into four different final products. There are four production steps, from which the first three are continuous and the last one has batch equipment. The continuous processing steps are expressed in tons per hours and at the batch equipment the product has a fixed processing time. Between each processing step there is limited available storage capacity. To solve the scheduling they use a heuristic that is an improved form of the genetic algorithm. It is a very extensive heuristic. Every processing unit receives a gene: an assignment array based on random numbers.
3.5.6 Conclusion Table 3.2 gives an overview of the literature we discussed in Section 3.5.1 to Section 3.5.5. None of the modeling formulations we found in literature are solved to optimality, due to time limitations. This suggests that our scheduling problem has the same limitations. The solution methods found in literature are not directly applicable to the lactose production process of Domo Borculo. Most MILP models focus on continuous or on batch production processes. We discussed the papers we found that could handle both batch as well as continuous processes which are from Neumann et al. (2005), Schilling et al. (1996), and Velez et al. (2013). However all of these methods are only suitable for small (non-realistic) problem instances. Also the details of their proposed methods are sometimes hard to reproduce. Therefore, we conclude that we will not be able to solve the scheduling problem for Domo to optimality. The heuristic proposed by Kudva et al. (1994) is very clear, but the method schedules only one production unit per iteration because there is intermediate storage available. The method proposed by Wang et al. (2009) has exactly the same limitation. At Domo Borculo, there is no intermediate storage and thus the production equipment cannot be scheduled independent of each other. So, from our literature study we can conclude that there are no suitable solution methods for Domo Borculo.
Table 3.2: Overview of characteristics of discussed scheduling problems and proposed methods
Author(s) Method Used process topology
Process task Storage Level
Neumann, Schwindt & Trautmann (2005)
MILP relaxation b&b algorithm
Network Continuous, semi-continuous and batch
Finite intermediate storage, unlimited intermediate storage and no intermediate storage
Scheduling
Schilling & Pantelides (1996)
MILP relaxation branch & bound
Network Batch and continuous
Finite intermediate storage, unlimited storage for final and raw materials
Scheduling
Velez & Maravelias (2013)
Branch & Bound algorithm
Network or Sequential
Batch and continuous
Possibility for FIS and/or NIS Scheduling
Neumann, Schwindt & Trautmann (2002)
MILP solved with CPlex and beam search
Network Batch Finite intermediate storage Scheduling
Kudva, Elkamel, Pekny & Reklaitis (1994)
Heuristic Sequential Batch and semi-continuous
Finite intermediate storage Scheduling
Wang, Zao, Xu & Wang (2009)
Heuristic based on genetic algorithm
Network Batch and continuous
Finite intermediate storage Scheduling

24
3.6 Measuring the quality of the schedule After we develop a good scheduling algorithm for Domo Borculo, we need to evaluate the algorithm in practice. When implementing a scheduling method, the quality of the schedules it produces is very important. The quality of a schedule refers in this case to the gap between the proposed schedule and the execution of it (Chae, 2009). To evaluate the quality of the scheduling method in practice, we use evaluation criteria from literature. Although the literature about performance measurement on strategic level is extensive, the amount of literature on evaluating the quality of a schedule or scheduling method on operational level is minimal. In this section, we review the relevant literature. We use the criteria to evaluate the proposed solution in the test phase in Chapter 5.
Kempf et al. (2000) give three guidelines that one should keep in mind when evaluating a schedule. They state that these three guidelines are crucial to good schedule quality evaluation. First of all, the metrics should support the organizational goals. This is not always as easy as it seems, because often different organizational units have conflicting goals. For example, a sales department wants to have on-time delivery, while a production department wants to reduce costs. Second, there must not be too many layers of metrics between the long-term organizational goals and the schedule measurements. The relationship will become blurred or lost completely. Final, one should raise questions of the relationships between the metrics and explore if an improvement in one metric brings an improvement in the other. These kinds of relationships must be avoided as much as possible.
Bandinelli et al. (2005) propose a schedule evaluation framework consisting of three layers: the effectiveness domain, the robustness domain, and the flexibility domain. The effectiveness domain shows how the manufacturing system performs following the proposed schedule in a steady-state situation. This layer evaluates whether the schedule is reliable (are we able to deliver the correct quantity at the correct time and place), flexible (can it respond to market changes), and responsive (the speed at which the system provides products). In the robustness domain, one must verify the ability of scheduling systems to not degrade their performance in the face of disruptions. They state four robustness indicators: steady-state stability, fault tolerance, reactivity, and dynamic stability. The flexibility domain evaluates how the schedule would perform in a different manufacturing system or to changing circumstances. Changing circumstances can be a change in the size of the system or a change in the production plan.
De Snoo et al. (2010) propose a framework with more concrete scheduling evaluation measures. They divide the criteria into four groups. The product criteria focus on the schedule as a product, while the process criteria see scheduling as a service where information is collected and delivered. They also include indirect scheduling performance criteria and factors influencing the scheduling performance.
The criteria of De Snoo et al. (2010) are most useful since they give concrete criteria that can directly be applied in practice. In Chapter 5 we make a choice between their proposed criteria in consultation with the production manager while we keep the guidelines of Bandinelli et al. (2005) and Kempf et al. (2000) in mind.
25
3.7 Summary Domo Borculo is an organization in the process industry. Companies in the process industry often process homogeneous products, use perishable raw materials and often have residuals emerging; these characteristics are all found at Domo Borculo. Due to the special characteristics of the process industry, the proposed solution formulations for discrete manufacturing do not fit and there is not a general technique proposed for scheduling. Most models for process production scheduling are only suitable to limited classes of problems and use simplified assumptions. The solution methods found in literature are also not directly applicable to the lactose production process of Domo Borculo. Therefore, we propose a solution method specifically for Domo Borculo in Chapter 4. To evaluate our proposed solution in practice we propose to have a test phase which we describe in Chapter 5. This is done by criteria we derived from the framework of De Snoo et al. (2010). In Chapter 5, we explain which evaluation criteria we use in the test. First, we describe and explain the proposed solution in Chapter 4.

26
Chapter 4: Scheduling problem and solving This chapter answers the question: “What is a useful scheduling method for the lactose production at FrieslandCamping Borculo?”. In Chapter 1 we stated that control over the lactose production is acquired by planning and scheduling. Currently, there is no schedule for the lactose production; the operators make their own decisions to their best capability. In Chapter 3, we identified that this led to the K1 as a bottleneck in the lactose production, while actually the dissolving street is the bottleneck. In this chapter, we propose a scheduling method for the lactose production. The goal of scheduling is to improve the utilization of the bottleneck and provide control and insight of the lactose production. K1 is currently the bottleneck due to the long waiting times in the tanks. With the scheduling method, we can eliminate unnecessary waiting time and therefore we assume that the dissolving street is the bottleneck.
This chapter is structured as follows. Section 4.1 explains the scope of the scheduling problem, as the lactose production is connected to the protein process we have to set some scheduling boundaries since we have limited time to execute this research. Section 4.2 describes the basic characteristics of the scheduling problem and Section 4.3 describes the decisions that need to be taken in the scheduling process. Section 4.4 explains the scheduling objective, the restrictions that are set by the production environment, and the assumptions we have to make to schedule the lactose production. Next, in Section 4.5, we explain why the scheduling problem cannot be solved to optimality. Finally, in Section 4.6 we describe the proposed solution to the scheduling problem in the form of a customized heuristic.
4.1 Scope The lactose production consists of 7 processing steps. To simplify the scheduling problem, we limit the scope from the post-evaporation to the dissolving street, as shown in Figure 4.1. We choose this scope for multiple reasons, which we explain in this section. We also explain other scoping decisions.
Figure 4.1: Scope of the scheduling problem
4.1.1 Start scope at the pasta tanks The arrival of the whey and permeate from the cheese factories is not fully predictable; even within a time horizon of a day, the number of freights arriving can change. Also, there are no agreements on the arrival times of the raw material, so the freights arrive irregularly over the day. We capture this variation by beginning the scheduling at the pasta tanks.

27
Table 4.1 gives the average amount of lactose product in the pasta tanks and the standard deviation. In Chapter 3, we calculated that the expected capacity of the lactose production is equal to the capacity of the dissolving street. This production capacity is based on the material state in K1, thus another material state than pasta. The post-evaporator vaporizes the water from the pasta and therefore the amount of ingoing product is larger than the outgoing amount of product. So, we convert the production capacity to the processing of the pasta material state. When only looking at the whey pasta, we conclude that in 84% of the time there is enough pasta to process for the coming 4 hours when assuming a normal distribution. This gives us a first indication that the pasta storage captures the variation in arrival. Next, we look at the available pasta from April to June 2013.
Average in use of total pasta storage Standard deviation Whey 22.4 % 9.4 % Permeate 10.8 % 6.3 % SW Yellow 3.4 % 2.4 % Table 4.1: Average available pasta from April to June in comparison to total pasta storage capacity
Figure 4.2 depicts the cumulative amount of permeate, SW Yellow, and whey in the pasta tanks from April to June. The graph shows that at one small time frame the total pasta amount is beneath 10% of available pasta storage. When there is 10% of the pasta storage utilized, this is enough for more than 3 hours of production. However, if this 10% consist of 3% permeate, 3% SW Yellow, and 4% whey, this would be inconvenient because as said the dissolving street is aimed at multiple hours of processing one kind of lactose product. However, the graph also shows that a majority of the available lactose product always exists out of one kind of lactose product: whey.
Figure 4.2: Available pasta in tons We conclude from this information that there is always enough pasta available for production and thus the pasta tanks capture a great part of the variation in arrival of raw material. So, the arrival of the raw material does not obstruct us for taken on an offline scheduling approach.
4.1.2 K2, the dryers and SW Refined: out of scope K2 and the dryers are out of the scheduling scope, because both have a large overcapacity. So, if these processing stages are not utilized optimally, it does not affect the lactose output. In a non-
0,00%
10,00%
20,00%
30,00%
40,00%
50,00%
60,00%
70,00%
80,00%
April to June
SW Yellow
Permeate
Whey
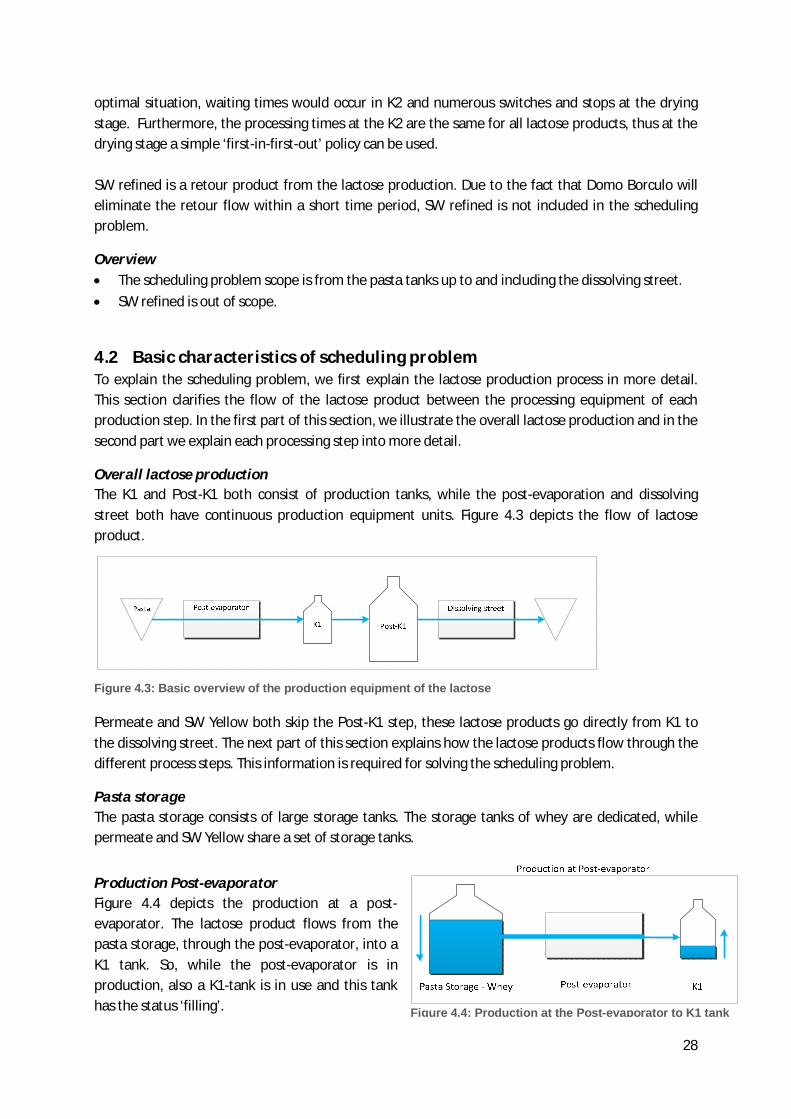
28
optimal situation, waiting times would occur in K2 and numerous switches and stops at the drying stage. Furthermore, the processing times at the K2 are the same for all lactose products, thus at the drying stage a simple ‘first-in-first-out’ policy can be used. SW refined is a retour product from the lactose production. Due to the fact that Domo Borculo will eliminate the retour flow within a short time period, SW refined is not included in the scheduling problem.
Overview The scheduling problem scope is from the pasta tanks up to and including the dissolving street. SW refined is out of scope.
4.2 Basic characteristics of scheduling problem To explain the scheduling problem, we first explain the lactose production process in more detail. This section clarifies the flow of the lactose product between the processing equipment of each production step. In the first part of this section, we illustrate the overall lactose production and in the second part we explain each processing step into more detail.
Overall lactose production The K1 and Post-K1 both consist of production tanks, while the post-evaporation and dissolving street both have continuous production equipment units. Figure 4.3 depicts the flow of lactose product.
Figure 4.3: Basic overview of the production equipment of the lactose Permeate and SW Yellow both skip the Post-K1 step, these lactose products go directly from K1 to the dissolving street. The next part of this section explains how the lactose products flow through the different process steps. This information is required for solving the scheduling problem.
Pasta storage The pasta storage consists of large storage tanks. The storage tanks of whey are dedicated, while permeate and SW Yellow share a set of storage tanks.
Production Post-evaporator Figure 4.4 depicts the production at a post-evaporator. The lactose product flows from the pasta storage, through the post-evaporator, into a K1 tank. So, while the post-evaporator is in production, also a K1-tank is in use and this tank has the status ‘filling’. Figure 4.4: Production at the Post-evaporator to K1 tank
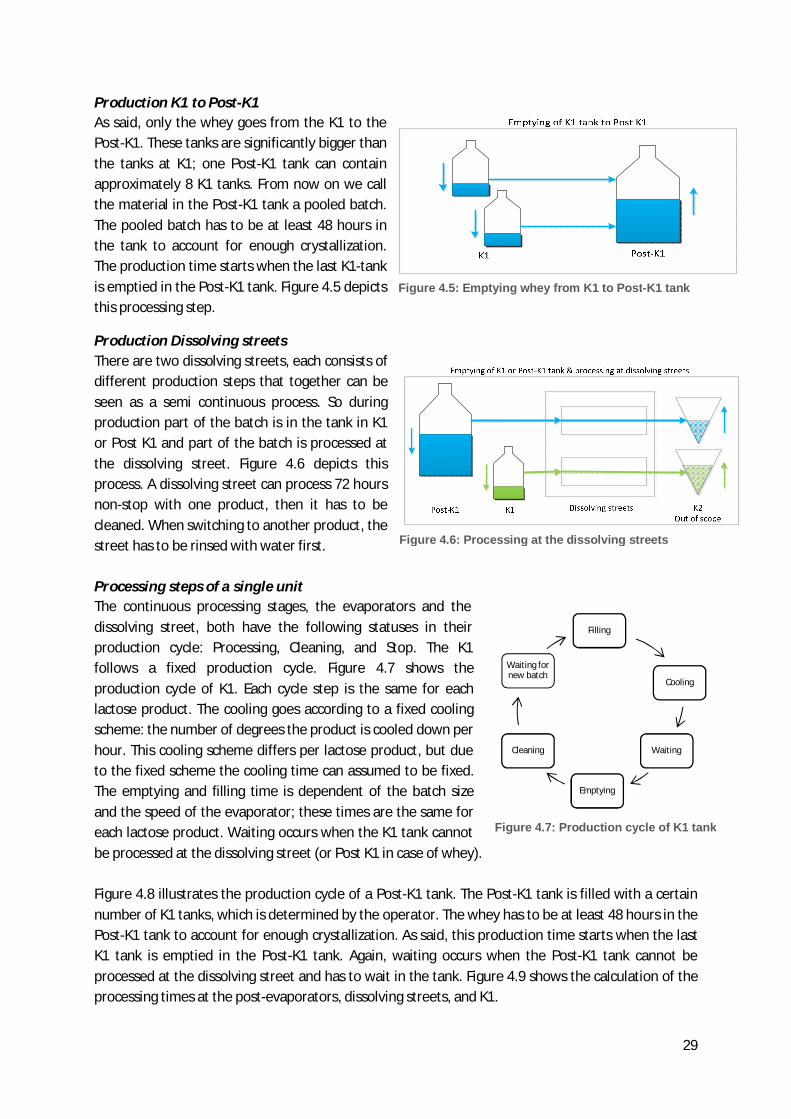
29
Filling
Cooling
Waiting
Emptying
Cleaning
Waiting for new batch
Production K1 to Post-K1 As said, only the whey goes from the K1 to the Post-K1. These tanks are significantly bigger than the tanks at K1; one Post-K1 tank can contain approximately 8 K1 tanks. From now on we call the material in the Post-K1 tank a pooled batch. The pooled batch has to be at least 48 hours in the tank to account for enough crystallization. The production time starts when the last K1-tank is emptied in the Post-K1 tank. Figure 4.5 depicts this processing step.
Production Dissolving streets There are two dissolving streets, each consists of different production steps that together can be seen as a semi continuous process. So during production part of the batch is in the tank in K1 or Post K1 and part of the batch is processed at the dissolving street. Figure 4.6 depicts this process. A dissolving street can process 72 hours non-stop with one product, then it has to be cleaned. When switching to another product, the street has to be rinsed with water first. Processing steps of a single unit The continuous processing stages, the evaporators and the dissolving street, both have the following statuses in their production cycle: Processing, Cleaning, and Stop. The K1 follows a fixed production cycle. Figure 4.7 shows the production cycle of K1. Each cycle step is the same for each lactose product. The cooling goes according to a fixed cooling scheme: the number of degrees the product is cooled down per hour. This cooling scheme differs per lactose product, but due to the fixed scheme the cooling time can assumed to be fixed. The emptying and filling time is dependent of the batch size and the speed of the evaporator; these times are the same for each lactose product. Waiting occurs when the K1 tank cannot be processed at the dissolving street (or Post K1 in case of whey). Figure 4.8 illustrates the production cycle of a Post-K1 tank. The Post-K1 tank is filled with a certain number of K1 tanks, which is determined by the operator. The whey has to be at least 48 hours in the Post-K1 tank to account for enough crystallization. As said, this production time starts when the last K1 tank is emptied in the Post-K1 tank. Again, waiting occurs when the Post-K1 tank cannot be processed at the dissolving street and has to wait in the tank. Figure 4.9 shows the calculation of the processing times at the post-evaporators, dissolving streets, and K1.
Figure 4.5: Emptying whey from K1 to Post-K1 tank
Figure 4.6: Processing at the dissolving streets
Figure 4.7: Production cycle of K1 tank

30
Figure 4.8: Production cycle of Post-K1 tank
Figure 4.9: Explanation of the processing times of the stages of the lactose production
From the above information we already derive some basic constraints of the scheduling problem: When scheduling lactose product at a post-evaporator, a K1-tank must be available. A K1-tank with permeate or SW Yellow can only be emptied if a dissolving street is available. A Post-K1 tank can only be emptied if a dissolving street is available. The K1 or Post-K1 tank becomes available after the whole content is processed at the
dissolving street.
Now that we globally explained the production flow through the different production steps, we explain the decisions involved in the lactose production in the Section 4.3.
4.3 Decisions in scheduling problem This section describes and explains the different decisions that have to be made to solve the scheduling problem. We describe the decisions in order of the production flow depicted in Figure 4.10; this is not necessarily the order in which the scheduling decisions should take place. We also give the parameters on which the decision could be based. The objective of the section is to give a basic understanding of the required decisions; in Section 4.4 we give an explanation of the choices we make considering the decisions and corresponding criteria.
Which product should be processed?
There are three products to process: whey, permeate, and SW Yellow. The first decision is to choose a product to process. Different parameters influence this decision, such as: the availability of raw material and the requested production output. Which post-evaporator must process the product and when? Next, the post-evaporators process the chosen lactose product. There are four evaporators available for the lactose production; each can process every product. Three evaporators have the same production capacity; the fourth evaporator has a production capacity twice as big, which is shown in Figure 4.10. Selecting an evaporator is based on: availability of the evaporator, previous production
31
Not depicted due to confidentiality
Figure 4.10 Detailed overview of the lactose production

32
processed at the post-evaporator, and the existing and available pipeline connections to the K1-tanks. Section 4.4 explains more about the pipeline connections between the different processing stages.
Which K1-tank should be filled and when? There are two different tank sizes in K1, as shown in Figure 4.10. So it matters which tank processes the product. The K1 tank can be filled with a chosen amount of product, but we assume the K1 tank is always filled to its maximum. We explain this decision in Section 4.4. The parameters on which this decision must be based are: availability of the K1 tanks, the size of tank, and the (available) connections from the evaporators and to the dissolving street. Which K1 tanks (containing whey) to assign to a tank in Post-K1 and when? The Post-K1 stage only processes whey and has eight equally sized tanks. The decision to select a Post-K1 tank is based on the number of batches in the tank, and the expected start or finish time of the tank. Which K1 or Post-K1 tank is processed at which street and when? At the dissolving street, the K1 and Post-K1 tanks are processed. Selecting a dissolving street is based on the availability, the lactose product previously processed at the street, and the available connection between the tanks and the dissolving street. All of the above decisions are not standalone decisions, but very dependent on each other. For example the processing time at a post-evaporator depends on the size of the K1 tank, but also the filling time for a K1 tank depends on the evaporator used. Therefore these decisions cannot be made in the above described order. In Section 4.6 we discuss the order in which we make the decisions in the scheduling problem.
4.4 Scheduling objective, restrictions, and assumptions This section first discusses the objective of Domo Borculo. The objective is eventually used to evaluate the proposed scheduling method. Second, we briefly describe the restrictions. Finally, we discuss the assumptions we make to be able to solve the scheduling problem.
Objective Domo Borculo has two goals. First, it wants to have more control, so it wants to predict the amount of final product at a certain time. Second, it wants to maximize production output. The scheduling objective is therefore stated as the maximization of lactose production output. By performing scheduling, Domo Borculo will have more control of the production output.
Restrictions The restrictions are limited to the connections between the different production stages. Appendix B shows the existing pipe-lines at the lactose production. From this figure we state the following restrictions:
At most 2 K1 tanks of the same subset can be filled from the post-evaporators
33
At most 2 K1 tanks can be emptied to the Post-K1 simultaneously. At most 1 K1 tank of the same subset can be emptied.
Note that the filling and emptying subsets in K1 are different subsets. Appendix B shows this information on a more detailed level.
Assumptions To address the scheduling problem we need to make certain assumptions that enable us to schedule the lactose production. K1-tank is always filled to its maximum (=1 batch) Inherently, the maximum batch size is equal to the size of a K1-tank, but a minimum threshold is not immediately clear. Since K1 is currently the bottleneck and we want to utilize its capacity to the fullest, we assume that the batch size is always equal to the size of the tank. From now on, we refer to a processed product as batch. The batch size is equal to the K1-tank in which it is processed. The amount of whey in a Post-K1 tank is always equal to 8 batches As mentioned, currently the operators determine how many K1 tanks to fill with a Post-K1 tank. The capacity calculations in Chapter 3 show that the Post-K1 is the slowest production step for whey. Since the objective is to maximize production output, we assume the Post-K1 tanks must be filled to maximum, which is equal to approximately 8 K1 tanks. Post-K1: after x2 hours of crystallization there is no difference in product yield The longer the product remains in the Post-K1 tank, the more crystallization, the more final product. A minimum limit of x hours is currently set by the Technology department after long research. We assume that after x hours there is no significant change in product yield. Infinite storage of by-products (ML, SWML, and OPL) At the dissolving street, the by-products emerge and directly flow into the accompanying storage tanks. The residuals all go to the post-evaporators before being processed at the protein production or are sold as feed. The by-products are processed on other production equipment that must be shared with other production lines. To schedule these residuals we would interfere with the scheduling of these production lines, therefore we assume infinite storage capacity of the residuals in the scheduling problem. However, in reality it is important that the maximum storage capacity is never reached, because the production of the dissolving street must be put down in that case. Therefore we propose to generate a graph from the schedule which indicates how much by-product emerges which is set against time. This graph must be used by the planner or operator to make sure the maximum storage capacity is never reached. 12.5% SWML is added as a percentage of the whey to be processed at the post evaporator and is always available SWML is dosed to the whey pasta, as shown in Figure 4.10. However this is done only when SWML is available, which is not always the case. Also the added amount of SWML added to each tank depends 2 Not given due to confidentiality
34
on the composition of the SWML that also differs. The amount of SWML matters, because it changes the amount of pasta to process. For the scheduling problem we adopt the assumption of the lactose model of Domo Borculo: 12.5% of SWML is added (as a percentage of the whey in the pasta tank). For example with 100 ton whey pasta, 12.5 ton of SWML is added. There are three evaporators available for the lactose production Since the fourth evaporator is partly used for the processing of products that our outside our scope, we chose to incorporate only three evaporators in the schedule. The capacity of the dissolving street is set at the average amount of lactose product needed In Section 2.5, we explained about the varying capacity of the dissolving street. Since we cannot predict how or when the capacity of the dissolving street varies, we have to assume a fixed average capacity. This assumption probably influences the feasibility of the schedule; we discuss this further in Chapter 6.
4.5 Solution method This section explains the proposed solution method and the choices we make in a number of key scheduling issues. First, in Section 4.5.1, we explain why we chose to propose a heuristic as our solution method. Then, before we describe the proposed heuristic, we explain the basic information that is needed for scheduling. Section 4.5.2 explains the chosen length of the scheduling horizon and when rescheduling must occur. Two of the key input parameters of a schedule are the capacities of the production equipment and the available raw materials. Section 4.5.3 describes how we determine the capacities and Section 4.5.4 how we determine the available raw materials.
4.5.1 Solving to optimality In Chapter 3 we did an extensive literature review of scheduling problems in the process industry. The modeling formulations we found in literature are not solved to the optimum due to time limitations. This suggests that our scheduling problem has the same limitations; we assume that the scheduling problem of Domo Borculo cannot be solved to optimality within reasonable time.
Furthermore, there are no modeling formulations that deal with a production process similar to Domo Borculo’s process. The proposed heuristics we found in literature do not offer a solution to the specific Domo Borculo scheduling problem. Therefore, we propose a heuristic specific for Domo Borculo in Section 4.6. A heuristic accelerates the solution process and although it will not give the optimum solution it gives a good solution. First, we describe our choices in a number of key scheduling issues.
4.5.2 Scheduling horizon We propose to use a rolling horizon for the schedule with periodic scheduling of 1 day which is depicted in Figure 4.11. The schedule horizon must be at least 72 hours (3 days), because the cycle time of the Post-K1 stage is more than 2 days. There are two kinds of rescheduling: planned rescheduling and rescheduling in case of disturbances. Since processing times are large, we assume that planned rescheduling is necessary only once a day. We suggest a fixed rescheduling moment, since in practice it is not possible to schedule on different moments and too often per day. A fixed rescheduling moment enables a workable situation for scheduler and operator.
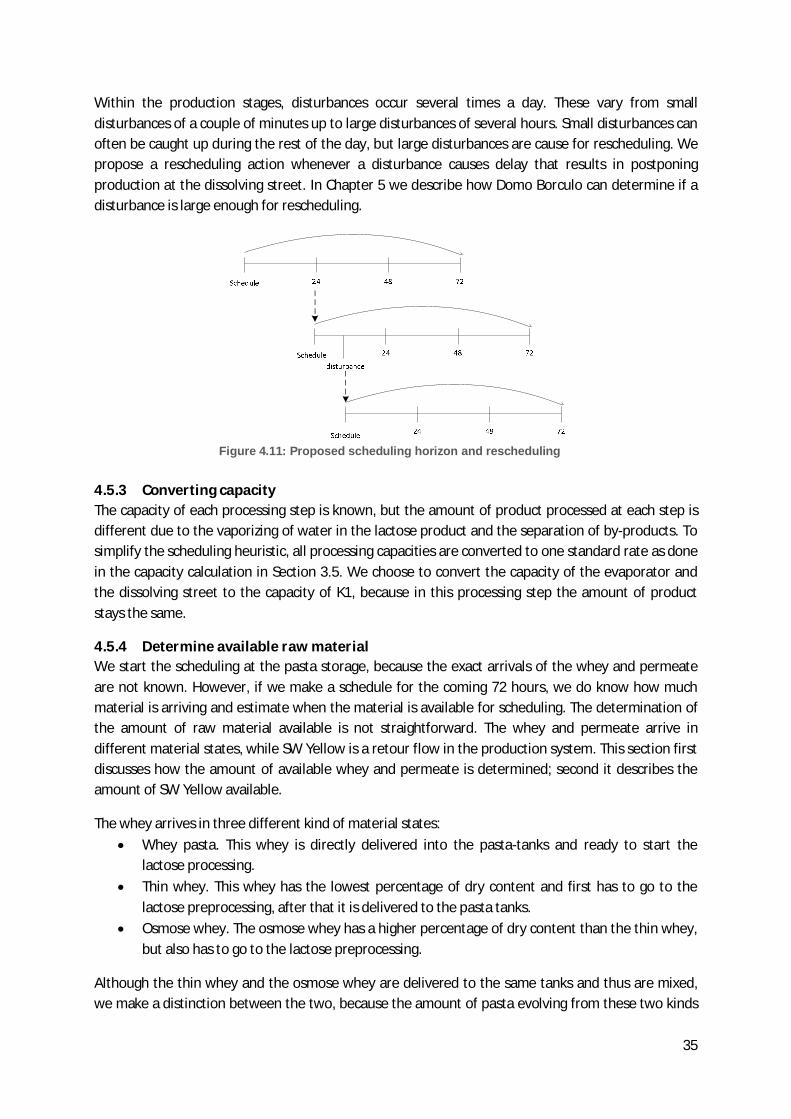
35
Within the production stages, disturbances occur several times a day. These vary from small disturbances of a couple of minutes up to large disturbances of several hours. Small disturbances can often be caught up during the rest of the day, but large disturbances are cause for rescheduling. We propose a rescheduling action whenever a disturbance causes delay that results in postponing production at the dissolving street. In Chapter 5 we describe how Domo Borculo can determine if a disturbance is large enough for rescheduling.
4.5.3 Converting capacity The capacity of each processing step is known, but the amount of product processed at each step is different due to the vaporizing of water in the lactose product and the separation of by-products. To simplify the scheduling heuristic, all processing capacities are converted to one standard rate as done in the capacity calculation in Section 3.5. We choose to convert the capacity of the evaporator and the dissolving street to the capacity of K1, because in this processing step the amount of product stays the same.
4.5.4 Determine available raw material We start the scheduling at the pasta storage, because the exact arrivals of the whey and permeate are not known. However, if we make a schedule for the coming 72 hours, we do know how much material is arriving and estimate when the material is available for scheduling. The determination of the amount of raw material available is not straightforward. The whey and permeate arrive in different material states, while SW Yellow is a retour flow in the production system. This section first discusses how the amount of available whey and permeate is determined; second it describes the amount of SW Yellow available.
The whey arrives in three different kind of material states: Whey pasta. This whey is directly delivered into the pasta-tanks and ready to start the
lactose processing. Thin whey. This whey has the lowest percentage of dry content and first has to go to the
lactose preprocessing, after that it is delivered to the pasta tanks. Osmose whey. The osmose whey has a higher percentage of dry content than the thin whey,
but also has to go to the lactose preprocessing.
Although the thin whey and the osmose whey are delivered to the same tanks and thus are mixed, we make a distinction between the two, because the amount of pasta evolving from these two kinds
Figure 4.11: Proposed scheduling horizon and rescheduling
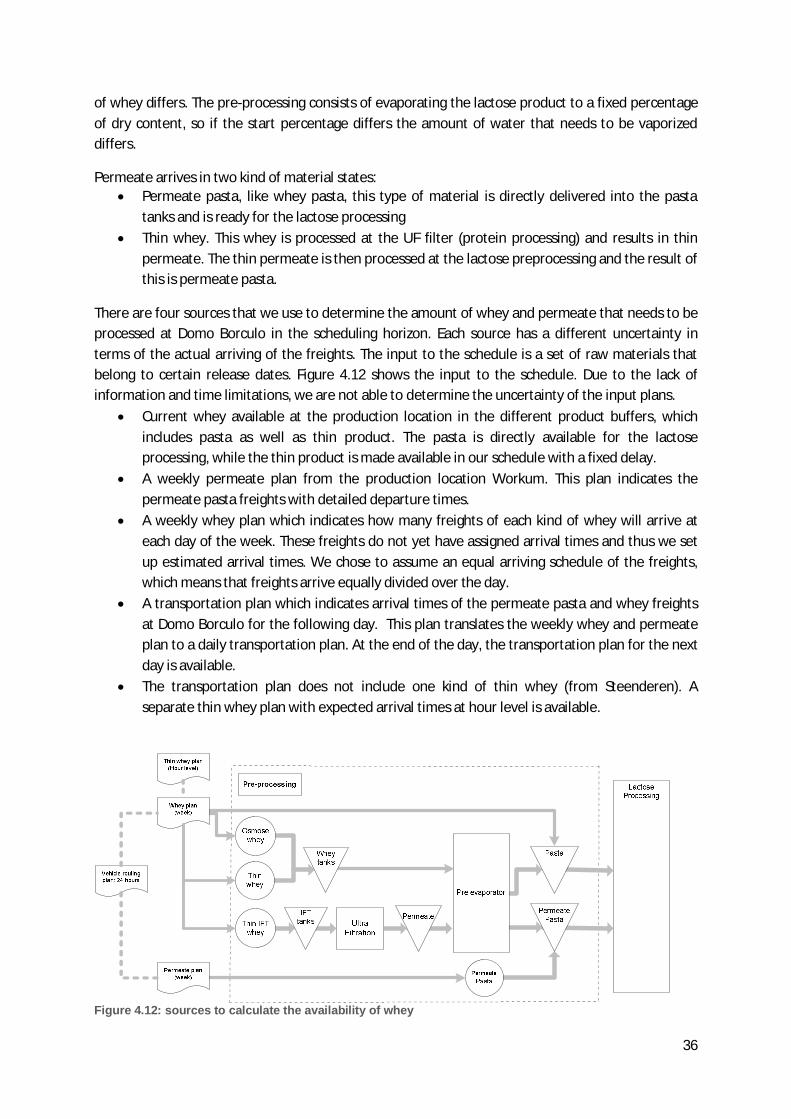
36
of whey differs. The pre-processing consists of evaporating the lactose product to a fixed percentage of dry content, so if the start percentage differs the amount of water that needs to be vaporized differs.
Permeate arrives in two kind of material states: Permeate pasta, like whey pasta, this type of material is directly delivered into the pasta
tanks and is ready for the lactose processing Thin whey. This whey is processed at the UF filter (protein processing) and results in thin
permeate. The thin permeate is then processed at the lactose preprocessing and the result of this is permeate pasta.
There are four sources that we use to determine the amount of whey and permeate that needs to be processed at Domo Borculo in the scheduling horizon. Each source has a different uncertainty in terms of the actual arriving of the freights. The input to the schedule is a set of raw materials that belong to certain release dates. Figure 4.12 shows the input to the schedule. Due to the lack of information and time limitations, we are not able to determine the uncertainty of the input plans.
Current whey available at the production location in the different product buffers, which includes pasta as well as thin product. The pasta is directly available for the lactose processing, while the thin product is made available in our schedule with a fixed delay.
A weekly permeate plan from the production location Workum. This plan indicates the permeate pasta freights with detailed departure times.
A weekly whey plan which indicates how many freights of each kind of whey will arrive at each day of the week. These freights do not yet have assigned arrival times and thus we set up estimated arrival times. We chose to assume an equal arriving schedule of the freights, which means that freights arrive equally divided over the day.
A transportation plan which indicates arrival times of the permeate pasta and whey freights at Domo Borculo for the following day. This plan translates the weekly whey and permeate plan to a daily transportation plan. At the end of the day, the transportation plan for the next day is available.
The transportation plan does not include one kind of thin whey (from Steenderen). A separate thin whey plan with expected arrival times at hour level is available.
Figure 4.12: sources to calculate the availability of whey

37
SW Yellow The SW Yellow is a retour product; it is not supplied externally but emerges with the processing of whey and permeate. The SW Yellow is first processed at the pre-evaporation, before it arrives at the pasta storage. Since the pre-evaporation stage is out of our scope, we have to make an assumption for the arrival of the SW Yellow at the pasta storage. We assume that the SW Yellow is available at the pasta within eight hours from emerging at the dissolving street. This assumption is based on a global calculation. When both dissolving streets are in production, there emerges a certain amount of SW Yellow per hour. The buffer for SW Yellow thin consists of two tanks. It takes approximately seven hours to fill one buffer tank and approximately one hour for production at the pre-evaporator.
4.6 The proposed heuristic This section describes the proposed heuristic to solve the scheduling problem of Domo Borculo. First we outline the basic strategy of the proposed heuristic in Section 4.7.1. Next, Section 4.7.2 discusses the heuristic and the choices we made to set up the proposed heuristic. Section 4.7.3 explains the important details of the heuristic.
4.6.1 Basic strategy of the proposed heuristic The goal of Domo Borculo is to maximize production output for the lactose. The dissolving streets are the bottleneck of the lactose production and thus directly determine the output of the lactose. The main strategy of our heuristic is to maximize the used capacity of the dissolving streets. The switching between two lactose products costs production time at the streets and also causes mixing of different lactose products. Since the dissolving street cannot be emptied completely, always some lactose product is left behind and this way mixing occurs. When two products are mixed the lactose is degraded to the lowest quality. So, the second goal of the heuristic, which follows from the main goal, is to minimize the number of switches between lactose products at the dissolving streets. Figure 4.13 depicts the above described goals. To minimize the switching between the lactose products, we assign a preferred street to each lactose product. When a lactose product is chosen, the preferred street is chosen before the other street. Since whey is the most dominant lactose product (see Figure 4.2), we assign whey to one street (street 2) and SW Yellow and permeate to the other street (street 1). So, when whey is selected as material, the preferred street to schedule is street 2, while for SW Yellow and permeate the preferred street is 1. When needed, whey can still be scheduled on street 1 and both SW Yellow as well as permeate at street 2. Since the main goal is to maximize the used capacity for the dissolving street. In Section 4.2 we already explained that the K1 tanks with whey are batched into a Post-K1 tank. When the last K1 batch is emptied in the Post-K1 tank the sojourn time starts. So, when we are scheduling the first whey K1 tank (of the Post-K1 batch), we do not know at which time the total
Figure 4.13: Goals of the proposed heuristic
38
Post-K1 batch will be ready for the dissolving street. So only when 8 K1 tanks have been assigned to a Post-K1 tank, we schedule this Post-K1 tank at the dissolving street. The K1 tanks filled with permeate and SW Yellow, we schedule directly at the dissolving street. After each scheduled batch at the dissolving street, we initiate an improvement method that allows switching between batches of street 1 and street 2. Next, we discuss the steps of the heuristic in Section 4.7.2.
4.6.2 Heuristic This section explains the basic steps of the proposed heuristic. The heuristic is used to make the five decisions needed to schedule the lactose production:
Which product should be processed? Which post-evaporator should process the product and when? Which K1-tank should be filled and when? Which K1 tanks (containing whey) should be assigned to a Post-K1 tank and when? Which K1 or Post-K1 tank should be processed at which street and when?
Figure 4.14 depicts the heuristic; the characters refer to the different explanations in this section; the numbers refer to a more detailed explanation in Section 4.7.3.
A. Select first available K1 tank
First we select a K1-tank, because the selection of a K1-tank determines the batch size of the lactose product. Furthermore, the post-evaporators can only begin with processing of a lactose product if a K1 tank is available; of course this also applies the other way around. Because the K1 has less capacity than the evaporators, it is more likely that the K1 stage has less availability than the post-evaporators. Also the K1 is a potential bottleneck as appeared in Chapter 3. Therefore we want to use it directly when this is possible; therefore we pick the first available tank in the scheduling heuristic. If there are two or more tanks available at the same time, we select the largest size tank, because this enlarges the production output of K1.
B. Select post-evaporator Next, we select a post-evaporator, because the capacity of the chosen post-evaporator determines the filling time of the K1-tank and it also limits the amount of K1-tanks that can be filled at the same time. There are three post-evaporators and thus only three K1-tanks can be filled at the same time. We must establish the filling time before we can schedule the Post-K1 tanks and dissolving street, because the filling time has influence on the completion time in the K1 tank. Section 4.7.3 explains how we select a preferred evaporator.
C. Check if there is an overflow of product in the storage or a street is almost empty. We set two constraints that are checked first, because these can constrain our schedule. First we check if there is a possibility that the pasta storage is not able to handle the amount of available material. If this is the case, we already set the choice of a lactose product. Second, we check if a dissolving street is almost empty. The most important goal of the schedule is to achieve maximum utilization of the dissolving street capacity and thus minimize the empty time at a dissolving street. With this last constrain, we constricts the choice of a dissolving street. Section 4.7.3 explains the constraints in more detail.
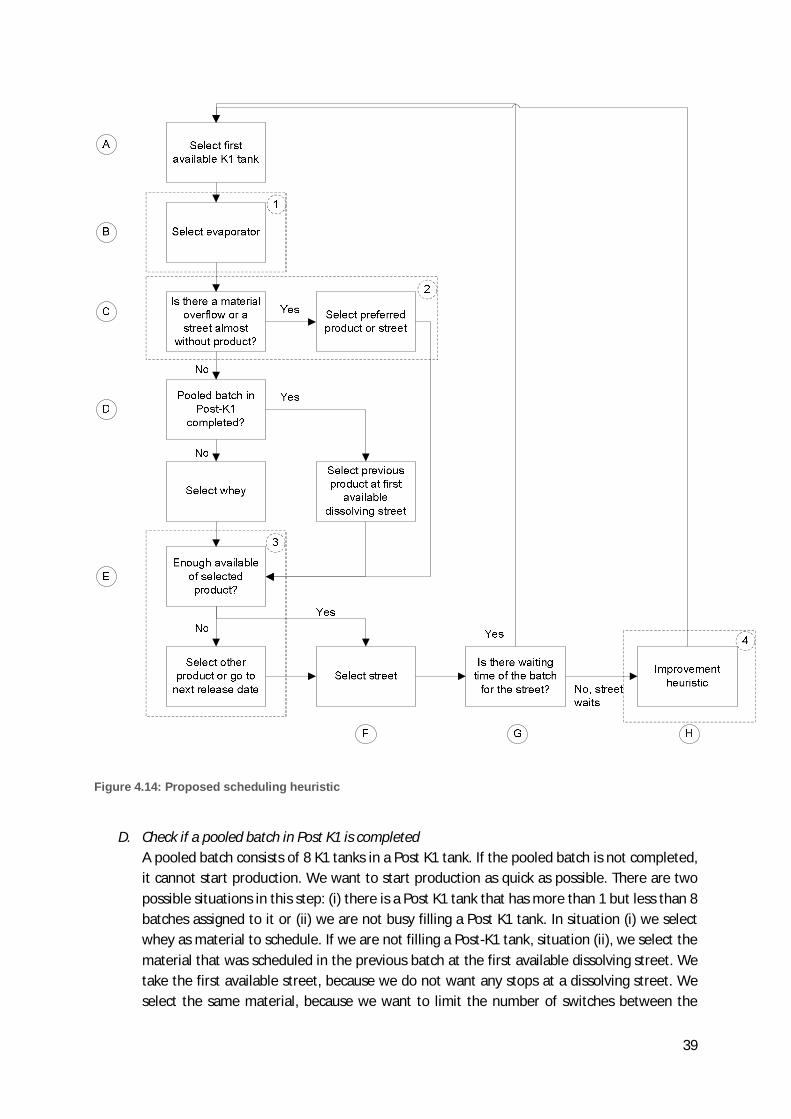
39
Figure 4.14: Proposed scheduling heuristic
D. Check if a pooled batch in Post K1 is completed
A pooled batch consists of 8 K1 tanks in a Post K1 tank. If the pooled batch is not completed, it cannot start production. We want to start production as quick as possible. There are two possible situations in this step: (i) there is a Post K1 tank that has more than 1 but less than 8 batches assigned to it or (ii) we are not busy filling a Post K1 tank. In situation (i) we select whey as material to schedule. If we are not filling a Post-K1 tank, situation (ii), we select the material that was scheduled in the previous batch at the first available dissolving street. We take the first available street, because we do not want any stops at a dissolving street. We select the same material, because we want to limit the number of switches between the
40
different materials. Only when a Post K1 tank is full, we schedule the Post K1 tank at the dissolving street. Since the processing time starts when the last batch is emptied into the Post K1 tank, only then we know when the Post K1 is ready to be processed at the dissolving street.
E. Check availability of selected material Next, we check the availability of the selected material. A logical step, since if we would schedule a non-available material, we would create an infeasible schedule. Based on the situation we select another material or we decide to schedule a subsequent release date. The different choices we make and why are explained in Section 4.7.3.
F. Select dissolving street If a dissolving street has not yet been selected in step 2, we now select a dissolving street. As explained, we assigned a preferred street to each material. In this step we select the preferred street for the material currently being scheduled.
G. Check waiting time of batch When we schedule the batch at one of the dissolving streets, we also calculate the waiting time of the batch for the dissolving street (or in case of whey: the waiting time for the Post-K1 tank). Since the K1 is a potential bottleneck, it is important that the tanks do not have too long waiting times for the dissolving street or the Post K1 tanks. Therefore, we calculate the waiting time for the dissolving street, in case of permeate and SW Yellow, and the waiting time for the Post-K1 tank in the case of whey. If this waiting time is more than three hours, a material for the other street is selected and the waiting time is again calculated. If the waiting time in the K1 tank for this new lactose product is shorter than the product chosen before, we select this new material. If the waiting time is negative, it means that the dissolving street is waiting for the batch instead of the other way around. This is an undesired situation, because the dissolving street loses production time. Since we prefer to maximize production time to the minimization of the number of product switches, we set up an improvement step that looks if a batch can be switched from one street to the other.
H. Improvement step The improvement step inserts all batches from the street to the street where the negative waiting time occurred. We only insert the batches that are ready before the negative waiting time occurs since otherwise this would have no effect at the waiting time. With each insertion it calculates the total negative waiting time at both streets and compares it with the initial negative total waiting time at both streets. If the insertion of the batch is an improvement to the initial situation, the insertion is accepted. Figure 4.15 depicts the improvement step.
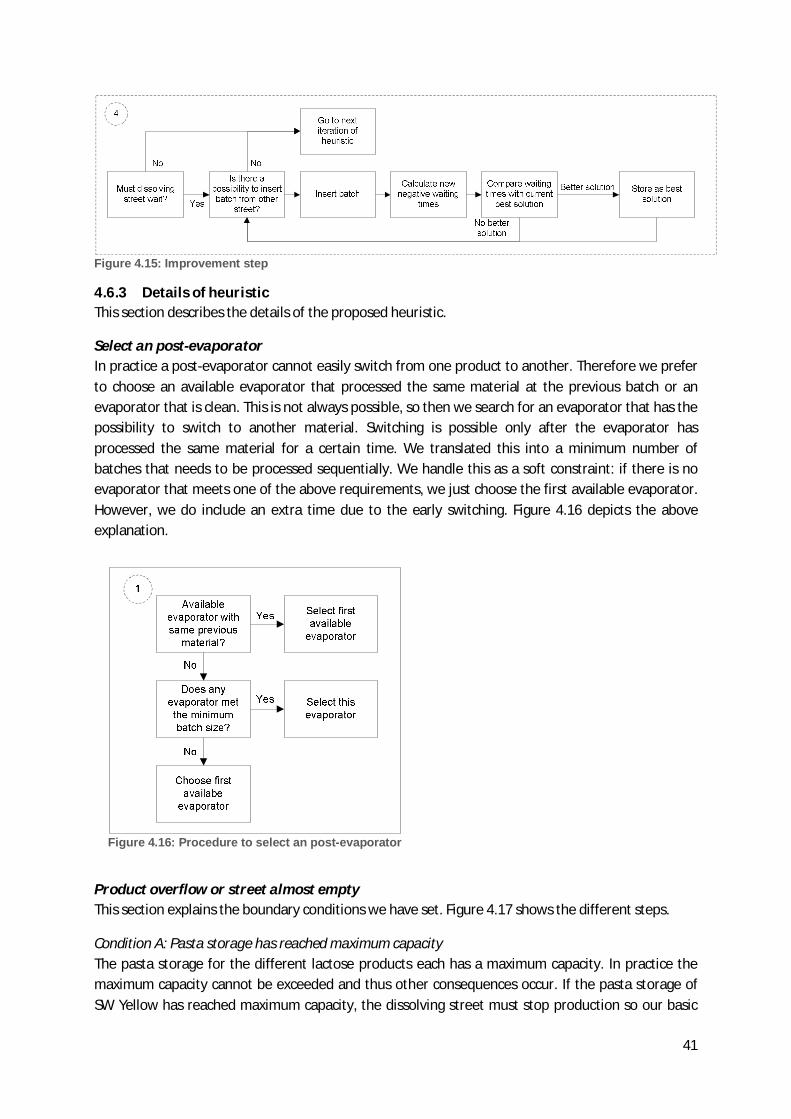
41
Figure 4.15: Improvement step
4.6.3 Details of heuristic This section describes the details of the proposed heuristic.
Select an post-evaporator In practice a post-evaporator cannot easily switch from one product to another. Therefore we prefer to choose an available evaporator that processed the same material at the previous batch or an evaporator that is clean. This is not always possible, so then we search for an evaporator that has the possibility to switch to another material. Switching is possible only after the evaporator has processed the same material for a certain time. We translated this into a minimum number of batches that needs to be processed sequentially. We handle this as a soft constraint: if there is no evaporator that meets one of the above requirements, we just choose the first available evaporator. However, we do include an extra time due to the early switching. Figure 4.16 depicts the above explanation.
Product overflow or street almost empty This section explains the boundary conditions we have set. Figure 4.17 shows the different steps.
Condition A: Pasta storage has reached maximum capacity The pasta storage for the different lactose products each has a maximum capacity. In practice the maximum capacity cannot be exceeded and thus other consequences occur. If the pasta storage of SW Yellow has reached maximum capacity, the dissolving street must stop production so our basic
Figure 4.16: Procedure to select an post-evaporator
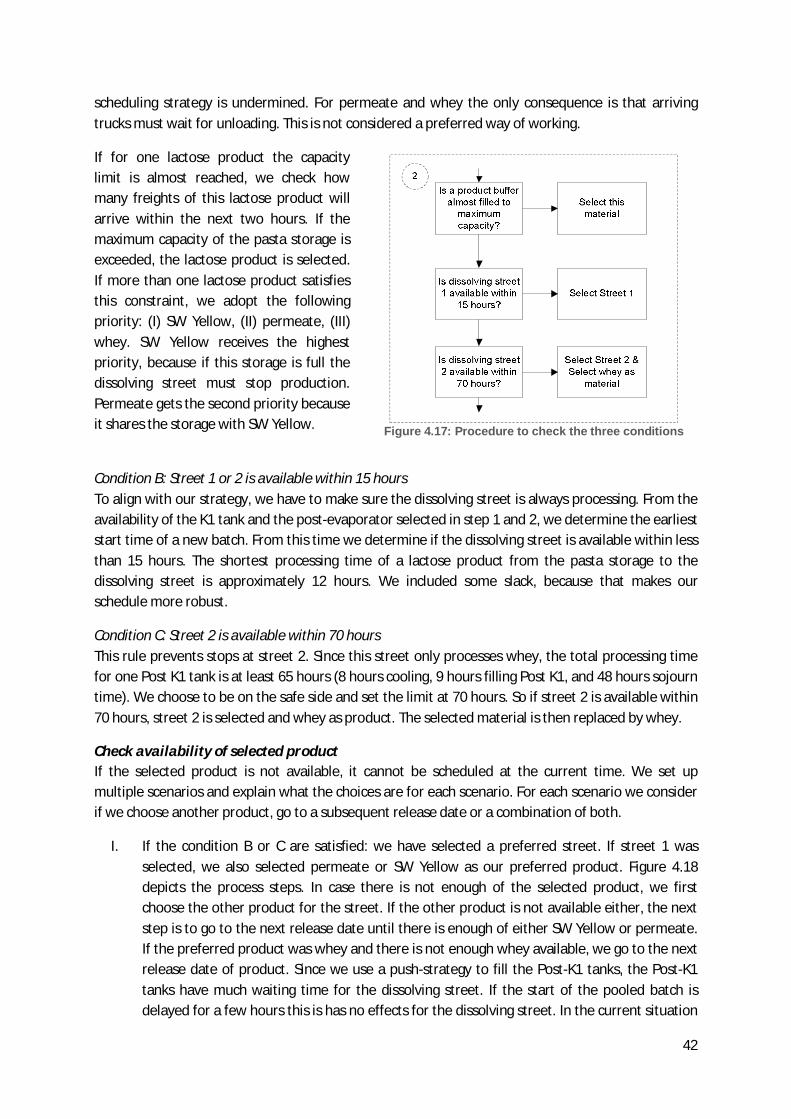
42
scheduling strategy is undermined. For permeate and whey the only consequence is that arriving trucks must wait for unloading. This is not considered a preferred way of working.
If for one lactose product the capacity limit is almost reached, we check how many freights of this lactose product will arrive within the next two hours. If the maximum capacity of the pasta storage is exceeded, the lactose product is selected. If more than one lactose product satisfies this constraint, we adopt the following priority: (I) SW Yellow, (II) permeate, (III) whey. SW Yellow receives the highest priority, because if this storage is full the dissolving street must stop production. Permeate gets the second priority because it shares the storage with SW Yellow.
Condition B: Street 1 or 2 is available within 15 hours To align with our strategy, we have to make sure the dissolving street is always processing. From the availability of the K1 tank and the post-evaporator selected in step 1 and 2, we determine the earliest start time of a new batch. From this time we determine if the dissolving street is available within less than 15 hours. The shortest processing time of a lactose product from the pasta storage to the dissolving street is approximately 12 hours. We included some slack, because that makes our schedule more robust.
Condition C: Street 2 is available within 70 hours This rule prevents stops at street 2. Since this street only processes whey, the total processing time for one Post K1 tank is at least 65 hours (8 hours cooling, 9 hours filling Post K1, and 48 hours sojourn time). We choose to be on the safe side and set the limit at 70 hours. So if street 2 is available within 70 hours, street 2 is selected and whey as product. The selected material is then replaced by whey.
Check availability of selected product If the selected product is not available, it cannot be scheduled at the current time. We set up multiple scenarios and explain what the choices are for each scenario. For each scenario we consider if we choose another product, go to a subsequent release date or a combination of both.
I. If the condition B or C are satisfied: we have selected a preferred street. If street 1 was selected, we also selected permeate or SW Yellow as our preferred product. Figure 4.18 depicts the process steps. In case there is not enough of the selected product, we first choose the other product for the street. If the other product is not available either, the next step is to go to the next release date until there is enough of either SW Yellow or permeate. If the preferred product was whey and there is not enough whey available, we go to the next release date of product. Since we use a push-strategy to fill the Post-K1 tanks, the Post-K1 tanks have much waiting time for the dissolving street. If the start of the pooled batch is delayed for a few hours this is has no effects for the dissolving street. In the current situation
Figure 4.17: Procedure to check the three conditions
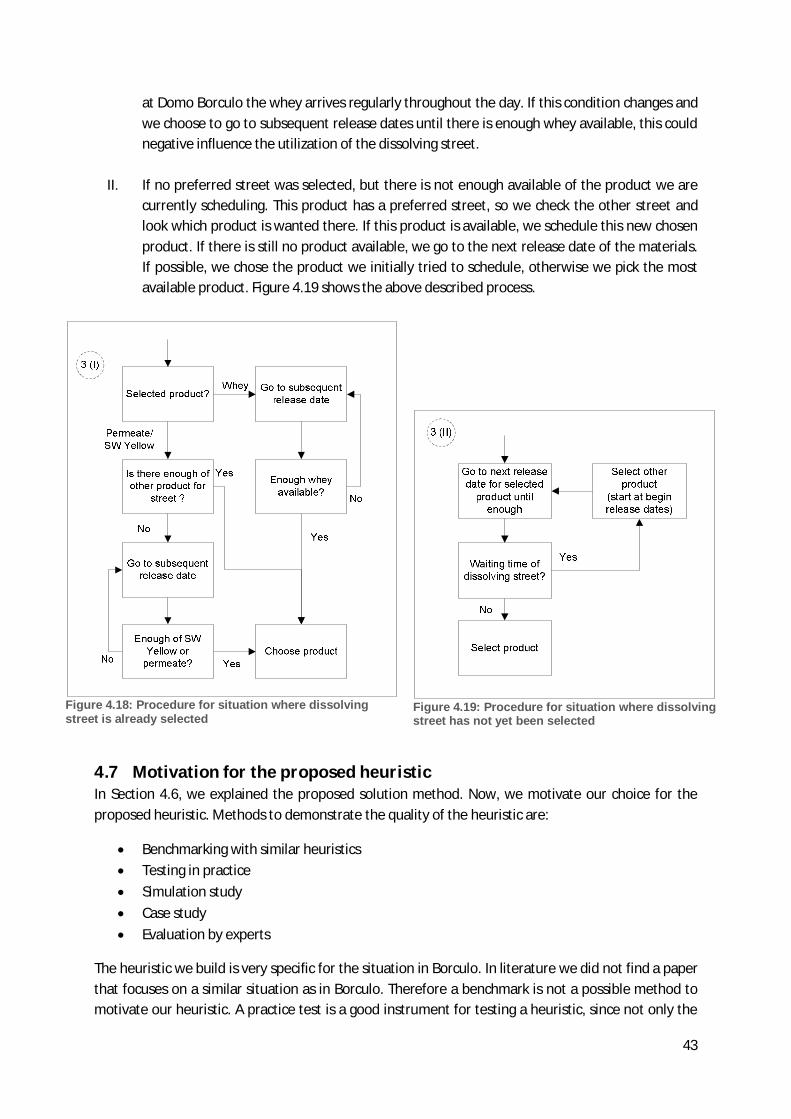
43
at Domo Borculo the whey arrives regularly throughout the day. If this condition changes and we choose to go to subsequent release dates until there is enough whey available, this could negative influence the utilization of the dissolving street.
II. If no preferred street was selected, but there is not enough available of the product we are currently scheduling. This product has a preferred street, so we check the other street and look which product is wanted there. If this product is available, we schedule this new chosen product. If there is still no product available, we go to the next release date of the materials. If possible, we chose the product we initially tried to schedule, otherwise we pick the most available product. Figure 4.19 shows the above described process.
Figure 4.18: Procedure for situation where dissolving street is already selected
Figure 4.19: Procedure for situation where dissolving street has not yet been selected
4.7 Motivation for the proposed heuristic In Section 4.6, we explained the proposed solution method. Now, we motivate our choice for the proposed heuristic. Methods to demonstrate the quality of the heuristic are:
Benchmarking with similar heuristics Testing in practice Simulation study Case study Evaluation by experts
The heuristic we build is very specific for the situation in Borculo. In literature we did not find a paper that focuses on a similar situation as in Borculo. Therefore a benchmark is not a possible method to motivate our heuristic. A practice test is a good instrument for testing a heuristic, since not only the

44
goals but also the fit with reality can be demonstrated. Due to the execution of another project at the lactose production, we were not able to do a practice test. Another option would be to do a simulation study. In such a study we would be able to simulate possible disruptions and how the schedule handles these disruptions. Due to time and resource limitations we are not able to do a simulation study. Therefore we focus on case studies and an evaluation by experts. Section 4.7.1 describes the case study and Section 4.7.2 the evaluation by experts.
4.7.1 Case studies In the case studies we schedule a situation from the past and compare it to the actual situation. This way we can see if the goals stated in Section 4.6 can be achieved and if the schedule is feasible. We choose the time period we schedule based on the following criteria:
There are no large disturbances in the lactose production for the whole scheduling horizon. A large disturbance is defined as the dissolving street or the dryers having disturbances of more than two hours or a post-evaporator having a disturbance of more than three hours.
Incidentally there are a few other lactose products that are processed at (part of) the lactose production, which we do not have within our scope. These particular products must not be processed within our scheduling horizon, because we cannot incorporate them in our schedule.
The chosen moment must lie between August and November 2013, because we want to demonstrate the heuristic in a recent situation.
In Section 4.5.2 we stated that the schedule horizon should be at least 3 days due to the long processing time of a Post K1 tank. However, we prefer to use a somewhat longer schedule horizon since the influence of some decisions is only visible 2 days later. So, with a longer horizon the influence of the decisions made in the schedule becomes more visible. Therefore, we searched for a time period of 4 days that meets the above criteria. Unfortunately, there was no period found and therefore we choose a schedule horizon of 3 days. Since Domo Borculo is a factory that has a 24/7 production process, we cannot start with any empty equipment. First, we initiate the start situation which schedules the current in-use K1 and Post-K1 tanks at the dissolving streets. These are choices already made by the operators, so we have no influence in the chosen product, but we do have an influence in the order the tanks are processed by the dissolving streets. After this step, we apply the proposed heuristic. We compare the proposed heuristic with the actual situation on the two goals we described in Section 4.6.1: maximization of the utilization of the dissolving streets and minimization of the number of product switches at the dissolving streets. We measure the utilization in the amount of idle time at the dissolving street. We do not take idle time due to disturbances into account, because these would also occur when executing the proposed schedule. We split the idle idle time due to product switches from the other idle time. We make this deviation, because this is already included in the second goal. However, we cannot measure how much idle time due to product switches there would be in our schedule, we can only give an indication. The remaining idle time is mainly due to product unavailability, which means that there is no product for the dissolving street. This mainly has three causes: (i) Domo Borculo does not have enough raw material in storage or (ii) the operators started production too late, or (iii) the residual storage is full and only the lactose product that produces this specific residual is available.
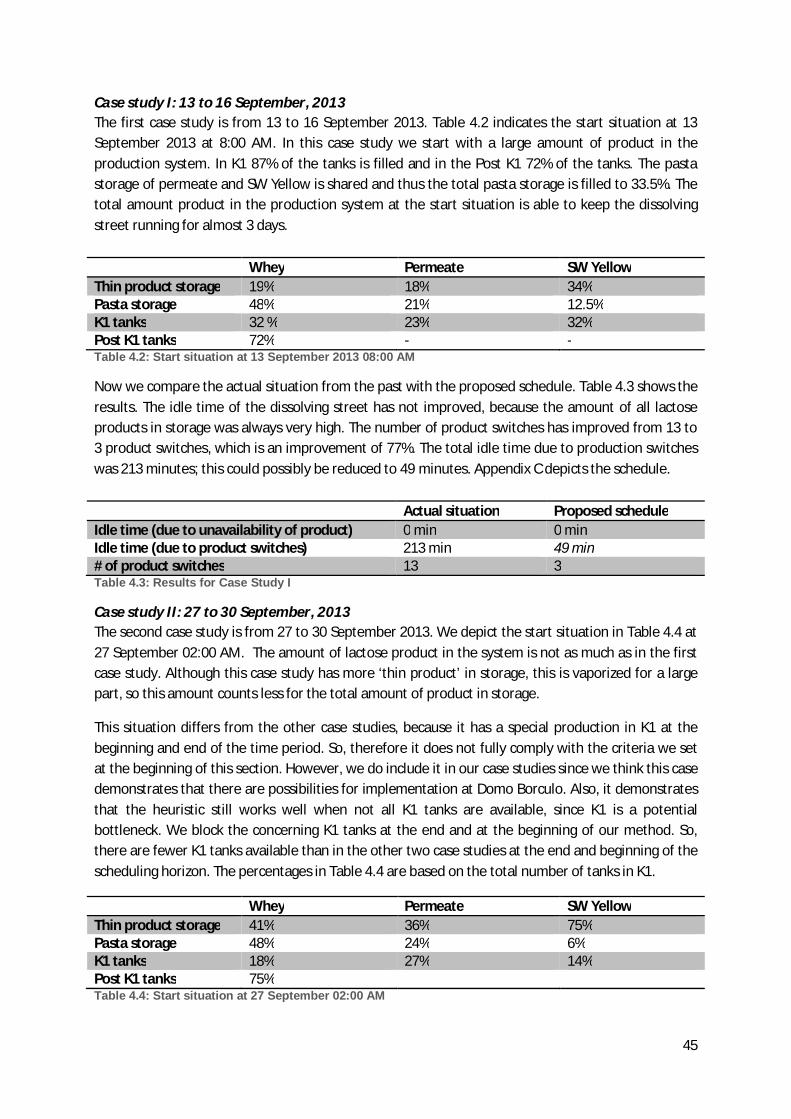
45
Case study I: 13 to 16 September, 2013 The first case study is from 13 to 16 September 2013. Table 4.2 indicates the start situation at 13 September 2013 at 8:00 AM. In this case study we start with a large amount of product in the production system. In K1 87% of the tanks is filled and in the Post K1 72% of the tanks. The pasta storage of permeate and SW Yellow is shared and thus the total pasta storage is filled to 33.5%. The total amount product in the production system at the start situation is able to keep the dissolving street running for almost 3 days. Whey Permeate SW Yellow Thin product storage 19% 18% 34% Pasta storage 48% 21% 12.5% K1 tanks 32 % 23% 32% Post K1 tanks 72% - - Table 4.2: Start situation at 13 September 2013 08:00 AM
Now we compare the actual situation from the past with the proposed schedule. Table 4.3 shows the results. The idle time of the dissolving street has not improved, because the amount of all lactose products in storage was always very high. The number of product switches has improved from 13 to 3 product switches, which is an improvement of 77%. The total idle time due to production switches was 213 minutes; this could possibly be reduced to 49 minutes. Appendix C depicts the schedule. Actual situation Proposed schedule Idle time (due to unavailability of product) 0 min 0 min Idle time (due to product switches) 213 min 49 min # of product switches 13 3 Table 4.3: Results for Case Study I
Case study II: 27 to 30 September, 2013 The second case study is from 27 to 30 September 2013. We depict the start situation in Table 4.4 at 27 September 02:00 AM. The amount of lactose product in the system is not as much as in the first case study. Although this case study has more ‘thin product’ in storage, this is vaporized for a large part, so this amount counts less for the total amount of product in storage.
This situation differs from the other case studies, because it has a special production in K1 at the beginning and end of the time period. So, therefore it does not fully comply with the criteria we set at the beginning of this section. However, we do include it in our case studies since we think this case demonstrates that there are possibilities for implementation at Domo Borculo. Also, it demonstrates that the heuristic still works well when not all K1 tanks are available, since K1 is a potential bottleneck. We block the concerning K1 tanks at the end and at the beginning of our method. So, there are fewer K1 tanks available than in the other two case studies at the end and beginning of the scheduling horizon. The percentages in Table 4.4 are based on the total number of tanks in K1.
Whey Permeate SW Yellow Thin product storage 41% 36% 75% Pasta storage 48% 24% 6% K1 tanks 18% 27% 14% Post K1 tanks 75% Table 4.4: Start situation at 27 September 02:00 AM
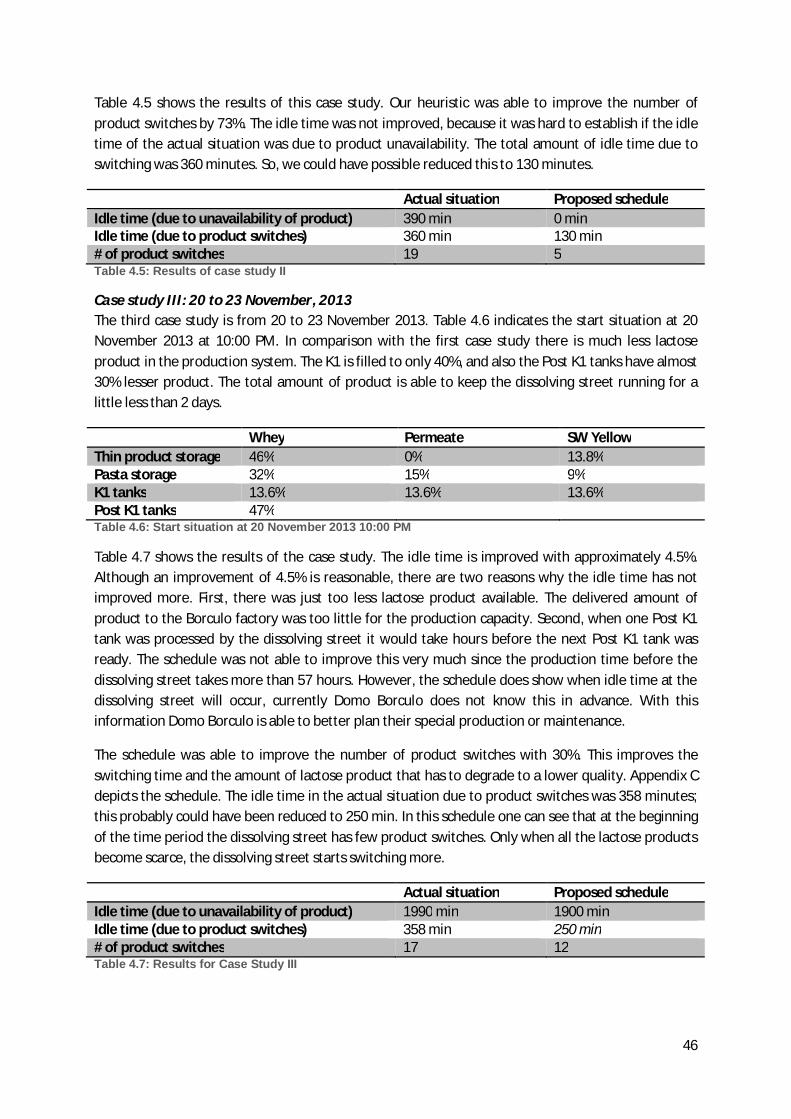
46
Table 4.5 shows the results of this case study. Our heuristic was able to improve the number of product switches by 73%. The idle time was not improved, because it was hard to establish if the idle time of the actual situation was due to product unavailability. The total amount of idle time due to switching was 360 minutes. So, we could have possible reduced this to 130 minutes.
Actual situation Proposed schedule Idle time (due to unavailability of product) 390 min 0 min Idle time (due to product switches) 360 min 130 min # of product switches 19 5 Table 4.5: Results of case study II
Case study III: 20 to 23 November, 2013 The third case study is from 20 to 23 November 2013. Table 4.6 indicates the start situation at 20 November 2013 at 10:00 PM. In comparison with the first case study there is much less lactose product in the production system. The K1 is filled to only 40%, and also the Post K1 tanks have almost 30% lesser product. The total amount of product is able to keep the dissolving street running for a little less than 2 days.
Whey Permeate SW Yellow Thin product storage 46% 0% 13.8% Pasta storage 32% 15% 9% K1 tanks 13.6% 13.6% 13.6% Post K1 tanks 47% Table 4.6: Start situation at 20 November 2013 10:00 PM
Table 4.7 shows the results of the case study. The idle time is improved with approximately 4.5%. Although an improvement of 4.5% is reasonable, there are two reasons why the idle time has not improved more. First, there was just too less lactose product available. The delivered amount of product to the Borculo factory was too little for the production capacity. Second, when one Post K1 tank was processed by the dissolving street it would take hours before the next Post K1 tank was ready. The schedule was not able to improve this very much since the production time before the dissolving street takes more than 57 hours. However, the schedule does show when idle time at the dissolving street will occur, currently Domo Borculo does not know this in advance. With this information Domo Borculo is able to better plan their special production or maintenance.
The schedule was able to improve the number of product switches with 30%. This improves the switching time and the amount of lactose product that has to degrade to a lower quality. Appendix C depicts the schedule. The idle time in the actual situation due to product switches was 358 minutes; this probably could have been reduced to 250 min. In this schedule one can see that at the beginning of the time period the dissolving street has few product switches. Only when all the lactose products become scarce, the dissolving street starts switching more.
Actual situation Proposed schedule Idle time (due to unavailability of product) 1990 min 1900 min Idle time (due to product switches) 358 min 250 min # of product switches 17 12 Table 4.7: Results for Case Study III
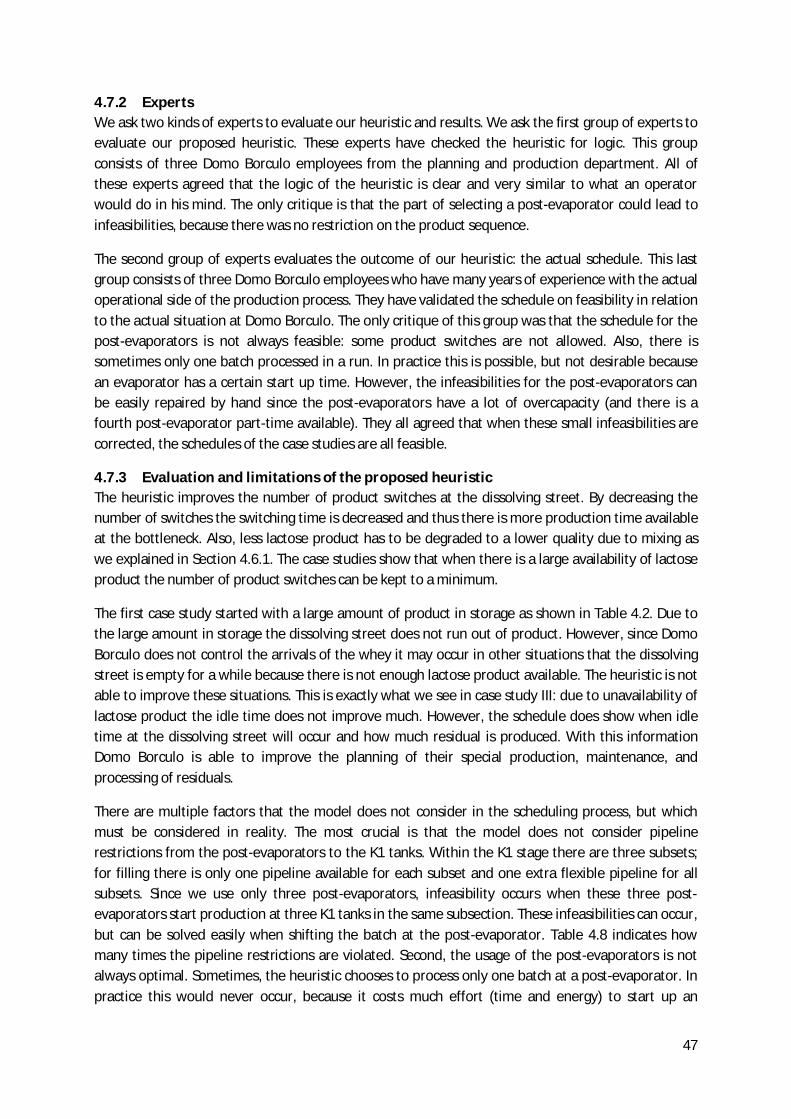
47
4.7.2 Experts We ask two kinds of experts to evaluate our heuristic and results. We ask the first group of experts to evaluate our proposed heuristic. These experts have checked the heuristic for logic. This group consists of three Domo Borculo employees from the planning and production department. All of these experts agreed that the logic of the heuristic is clear and very similar to what an operator would do in his mind. The only critique is that the part of selecting a post-evaporator could lead to infeasibilities, because there was no restriction on the product sequence.
The second group of experts evaluates the outcome of our heuristic: the actual schedule. This last group consists of three Domo Borculo employees who have many years of experience with the actual operational side of the production process. They have validated the schedule on feasibility in relation to the actual situation at Domo Borculo. The only critique of this group was that the schedule for the post-evaporators is not always feasible: some product switches are not allowed. Also, there is sometimes only one batch processed in a run. In practice this is possible, but not desirable because an evaporator has a certain start up time. However, the infeasibilities for the post-evaporators can be easily repaired by hand since the post-evaporators have a lot of overcapacity (and there is a fourth post-evaporator part-time available). They all agreed that when these small infeasibilities are corrected, the schedules of the case studies are all feasible.
4.7.3 Evaluation and limitations of the proposed heuristic The heuristic improves the number of product switches at the dissolving street. By decreasing the number of switches the switching time is decreased and thus there is more production time available at the bottleneck. Also, less lactose product has to be degraded to a lower quality due to mixing as we explained in Section 4.6.1. The case studies show that when there is a large availability of lactose product the number of product switches can be kept to a minimum.
The first case study started with a large amount of product in storage as shown in Table 4.2. Due to the large amount in storage the dissolving street does not run out of product. However, since Domo Borculo does not control the arrivals of the whey it may occur in other situations that the dissolving street is empty for a while because there is not enough lactose product available. The heuristic is not able to improve these situations. This is exactly what we see in case study III: due to unavailability of lactose product the idle time does not improve much. However, the schedule does show when idle time at the dissolving street will occur and how much residual is produced. With this information Domo Borculo is able to improve the planning of their special production, maintenance, and processing of residuals.
There are multiple factors that the model does not consider in the scheduling process, but which must be considered in reality. The most crucial is that the model does not consider pipeline restrictions from the post-evaporators to the K1 tanks. Within the K1 stage there are three subsets; for filling there is only one pipeline available for each subset and one extra flexible pipeline for all subsets. Since we use only three post-evaporators, infeasibility occurs when these three post-evaporators start production at three K1 tanks in the same subsection. These infeasibilities can occur, but can be solved easily when shifting the batch at the post-evaporator. Table 4.8 indicates how many times the pipeline restrictions are violated. Second, the usage of the post-evaporators is not always optimal. Sometimes, the heuristic chooses to process only one batch at a post-evaporator. In practice this would never occur, because it costs much effort (time and energy) to start up an
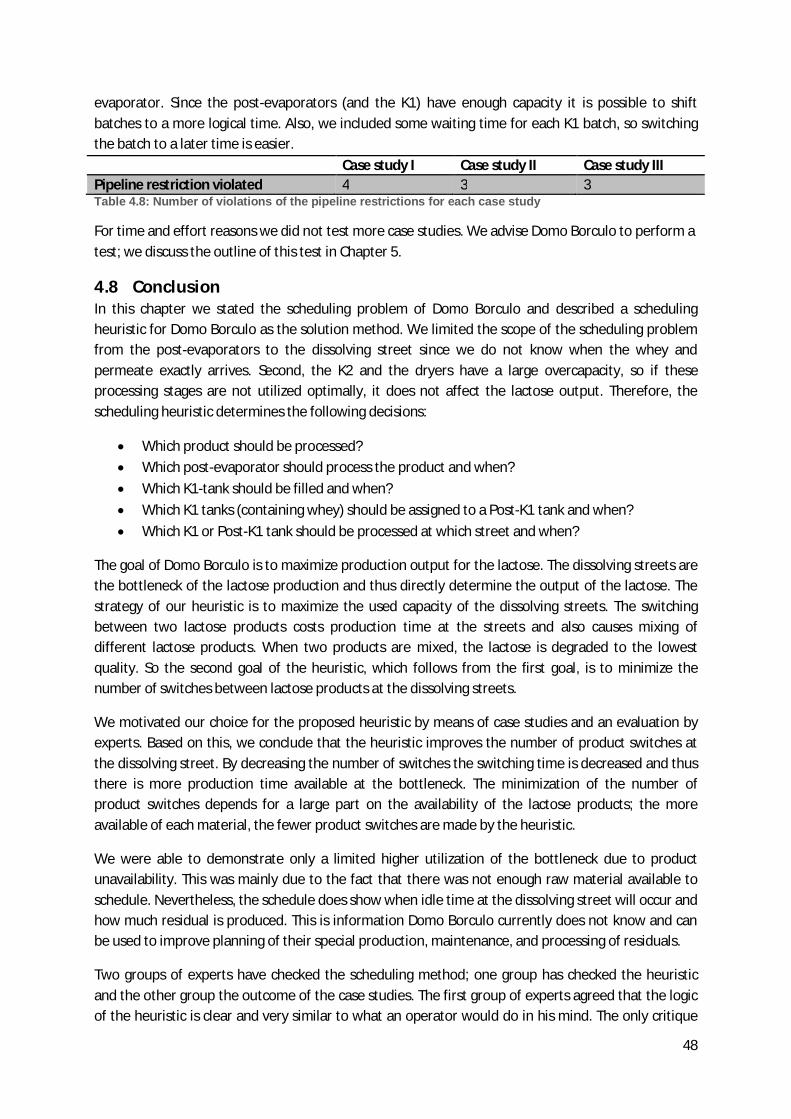
48
evaporator. Since the post-evaporators (and the K1) have enough capacity it is possible to shift batches to a more logical time. Also, we included some waiting time for each K1 batch, so switching the batch to a later time is easier. Case study I Case study II Case study III Pipeline restriction violated 4 3 3 Table 4.8: Number of violations of the pipeline restrictions for each case study
For time and effort reasons we did not test more case studies. We advise Domo Borculo to perform a test; we discuss the outline of this test in Chapter 5.
4.8 Conclusion In this chapter we stated the scheduling problem of Domo Borculo and described a scheduling heuristic for Domo Borculo as the solution method. We limited the scope of the scheduling problem from the post-evaporators to the dissolving street since we do not know when the whey and permeate exactly arrives. Second, the K2 and the dryers have a large overcapacity, so if these processing stages are not utilized optimally, it does not affect the lactose output. Therefore, the scheduling heuristic determines the following decisions:
Which product should be processed? Which post-evaporator should process the product and when? Which K1-tank should be filled and when? Which K1 tanks (containing whey) should be assigned to a Post-K1 tank and when? Which K1 or Post-K1 tank should be processed at which street and when?
The goal of Domo Borculo is to maximize production output for the lactose. The dissolving streets are the bottleneck of the lactose production and thus directly determine the output of the lactose. The strategy of our heuristic is to maximize the used capacity of the dissolving streets. The switching between two lactose products costs production time at the streets and also causes mixing of different lactose products. When two products are mixed, the lactose is degraded to the lowest quality. So the second goal of the heuristic, which follows from the first goal, is to minimize the number of switches between lactose products at the dissolving streets.
We motivated our choice for the proposed heuristic by means of case studies and an evaluation by experts. Based on this, we conclude that the heuristic improves the number of product switches at the dissolving street. By decreasing the number of switches the switching time is decreased and thus there is more production time available at the bottleneck. The minimization of the number of product switches depends for a large part on the availability of the lactose products; the more available of each material, the fewer product switches are made by the heuristic.
We were able to demonstrate only a limited higher utilization of the bottleneck due to product unavailability. This was mainly due to the fact that there was not enough raw material available to schedule. Nevertheless, the schedule does show when idle time at the dissolving street will occur and how much residual is produced. This is information Domo Borculo currently does not know and can be used to improve planning of their special production, maintenance, and processing of residuals.
Two groups of experts have checked the scheduling method; one group has checked the heuristic and the other group the outcome of the case studies. The first group of experts agreed that the logic of the heuristic is clear and very similar to what an operator would do in his mind. The only critique

49
of the second group was that the schedule for the post-evaporators is not always feasible: some product sequences are not allowed. Also, there is sometimes only one batch processed in a run. All experts agreed that when these small infeasibilities are corrected, the schedules of the case studies are all feasible.
The heuristic does not take pipeline restrictions into account, which could cause infeasibilities in the schedule. Also, the usage of the post-evaporators is not always optimal. Both infeasibilities can be solved easily by hand, since there is much overcapacity at the post-evaporators and we included some waiting time for each batch in a K1 tank.
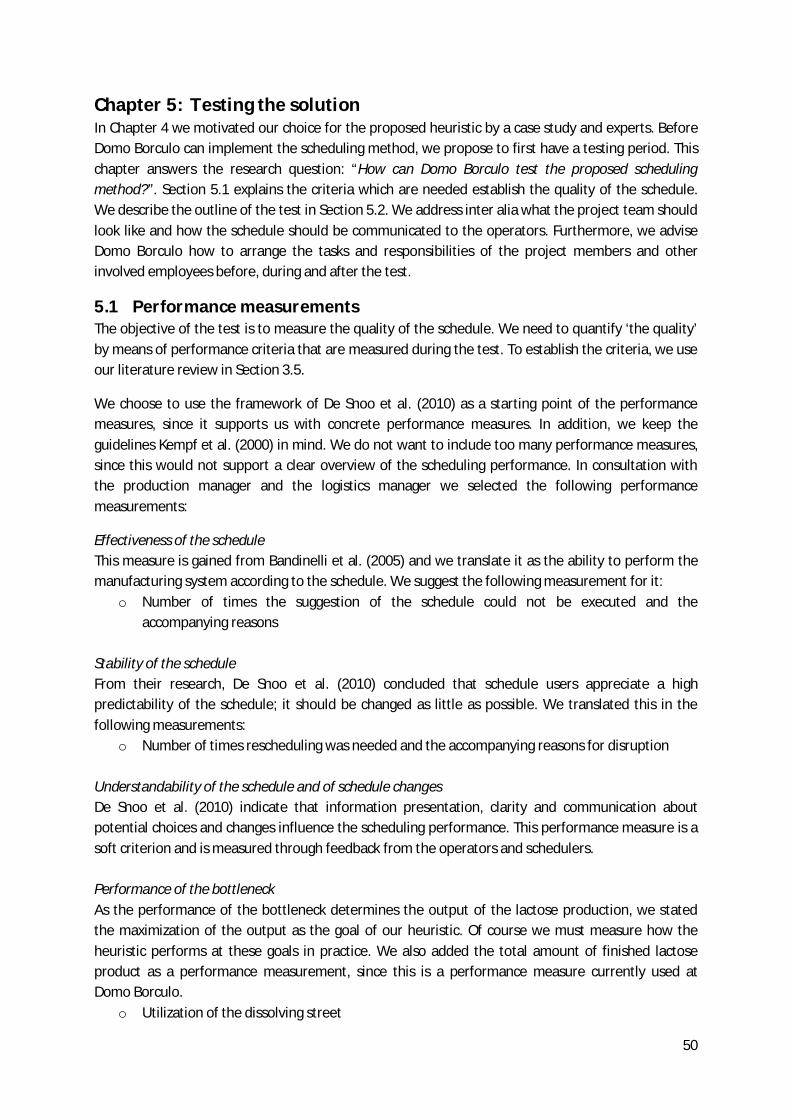
50
Chapter 5: Testing the solution In Chapter 4 we motivated our choice for the proposed heuristic by a case study and experts. Before Domo Borculo can implement the scheduling method, we propose to first have a testing period. This chapter answers the research question: “How can Domo Borculo test the proposed scheduling method?”. Section 5.1 explains the criteria which are needed establish the quality of the schedule. We describe the outline of the test in Section 5.2. We address inter alia what the project team should look like and how the schedule should be communicated to the operators. Furthermore, we advise Domo Borculo how to arrange the tasks and responsibilities of the project members and other involved employees before, during and after the test.
5.1 Performance measurements The objective of the test is to measure the quality of the schedule. We need to quantify ‘the quality’ by means of performance criteria that are measured during the test. To establish the criteria, we use our literature review in Section 3.5.
We choose to use the framework of De Snoo et al. (2010) as a starting point of the performance measures, since it supports us with concrete performance measures. In addition, we keep the guidelines Kempf et al. (2000) in mind. We do not want to include too many performance measures, since this would not support a clear overview of the scheduling performance. In consultation with the production manager and the logistics manager we selected the following performance measurements:
Effectiveness of the schedule This measure is gained from Bandinelli et al. (2005) and we translate it as the ability to perform the manufacturing system according to the schedule. We suggest the following measurement for it:
o Number of times the suggestion of the schedule could not be executed and the accompanying reasons
Stability of the schedule From their research, De Snoo et al. (2010) concluded that schedule users appreciate a high predictability of the schedule; it should be changed as little as possible. We translated this in the following measurements:
o Number of times rescheduling was needed and the accompanying reasons for disruption Understandability of the schedule and of schedule changes De Snoo et al. (2010) indicate that information presentation, clarity and communication about potential choices and changes influence the scheduling performance. This performance measure is a soft criterion and is measured through feedback from the operators and schedulers. Performance of the bottleneck As the performance of the bottleneck determines the output of the lactose production, we stated the maximization of the output as the goal of our heuristic. Of course we must measure how the heuristic performs at these goals in practice. We also added the total amount of finished lactose product as a performance measurement, since this is a performance measure currently used at Domo Borculo.
o Utilization of the dissolving street
51
o Number of product switches at the dissolving street o Lactose output (in tons)
5.2 Performing the test This section outlines how the test should be set up. We discuss inter alia how the project team should be composed, how the schedule is communicated to the operators, and who is responsible for recording the criteria.
5.2.1 Project team The project team is responsible for the conduction of the test. We advise to have three members with different expertise in the project team. One member should be from the planning staff, one member should be from the production staff, and the last member should have extensive knowledge of scheduling. The knowledge of the three members complements each other and strengthens the project performance.
5.2.2 Test duration We advise the test duration to be ten weeks. Other recent projects at Domo Borculo learned that this is a suitable time period. This period is long enough to average out the disturbances at the production equipment. It also gives a good impression of the different proportions of lactose product arriving and how the proposed solution is able to handle this.
5.2.3 Schedule tool We developed the heuristic in VBA Excel, which is available for all employees of Domo Borculo. The heuristic uses up-to-date information from the factory with use of the add-in Proficy Historian. Together with the arrival plans as described in Section 4.5.4, this information is the input for the heuristic. The output of the schedule is the start and finish times of the batches at the different production equipment. We did not develop a visual tool for the heuristic. Microsoft Project (or a similar program) must be used to make a Gantt chart of the schedule.
The schedule tool is aimed at the future situation of Domo Borculo. Currently there are two other products that make use of the K1 production stage, but these products will have new production routings within a few months. In the testing stage these products still make use of K1. For the SW White we block one K1 tank all the time, so we create flexibility for the operator to determine when they process it. Another type of product, GOS10, is also not incorporated in the schedule. This product is always produced in batches of 4 or 5 K1 tanks. We can block these specific tanks in the schedule, but we cannot exactly time this blockage. So, the solution would be to block the tanks for a considerable time.
5.2.4 Communication of the schedule As we stated in Section 5.1 the understandability of the schedule is very important for the performance of the schedule. Therefore, Domo Borculo must pay a lot of attention how the schedule is communicated to the operators. The proposed heuristic gives precise details of the start and finish times of each batch at each production equipment. However, we do not want to communicate all these times to each operator of the lactose production, since we think that would be too confusing. The operators of the post-evaporators, the K1, and the dissolving street receive the following information:
Start times (within a range) of K1 tanks (for the coming 24 hours)
52
Start times of batches at the dissolving street (for the coming 24 hours) Gantt chart of whole suggested schedule
With the above information operators can determine themselves when and which post-evaporators processes each batch. We do not see this as a deviation from the schedule.
5.2.5 Time horizon of schedule In Section 4.5.2 we suggested that the schedule should have a rolling horizon with a periodic scheduling of 1 day. The scheduling horizon is 4 days since the cycle time of the Post K1 is more than 2 days and this with this horizon the influence of the decisions are more visible than with a minimum schedule horizon of 3 days.
There should be a fixed scheduling moment, because this supports structure in the scheduling process. We do not want too much time between the scheduling and the release date of the schedule, since this enlarges the unreliability of the proposed schedule. We suggest that the start of the schedule is at 4:00 PM, since at 3.30 PM there is a fixed meeting between the production and planning department. At this meeting the scheduler and the process coordinator can discuss the proposed schedule.
The production of Domo Borculo is 24 hours a day, seven days a week. The schedulers are only present during the day and not in weekends. So, we advise scheduling in the weekends should take place by a member of the operating staff. For the test it will costs too much time and effort to educate two members of each operating team. So, we advise Domo Borculo to let a scheduler or a project member work during the weekends.
5.2.6 Preparatory work Before the actual test can take place, a lot of preparatory work needs to be done. This subsection briefly describes the tasks that need to be organized by the project team.
Establish parameters The parameters currently used in the model are based on an average from April to June. Since the parameters influence the performance of the schedule, we advise that the parameters are recalculated from more recent historical data.
Establish guidelines for rescheduling We indicated that when large disturbances occur, rescheduling must follow. However, it is not immediately clear what a large disturbance is. Therefore we suggest the following guidelines:
There is a disturbance of more than 1 hour at the dissolving street. This is the bottleneck of the production system and a disturbance influences all the subsequent production equipment, therefore we choose to set a tight restriction.
The post-evaporators have a lot of spare capacity. So, if a disturbance at one post-evaporator occurs, there is probably production time available at another evaporator. Also, when there is enough raw material, all batches have a waiting time of at least 2 hours for the dissolving street. In situations where raw material is scarce, the waiting time is much less. Therefore we handle two guidelines. When there is enough material available, rescheduling takes place with disturbances of more than 2 hours, otherwise with a disturbance of more than 1 hour.

53
There is a breakdown of one or more K1 or Post K1 tanks. If one of the tanks breaks down and there is a batch assigned to it, rescheduling must take place. From experience we found that a tank breakdown does not happen often. However, when it occurs the tank is out of production for a couple of days.
When a disturbance occurs the concerning process coordinator together with the technical department should estimate beforehand if the disturbance is large enough for rescheduling. They inform the scheduler that rescheduling is needed and the accompanying reason. During the test these guidelines should also be evaluated. Since having to tight guidelines would cause too much rescheduling and too loose guidelines would cause an infeasible schedule.
Kick-off meeting In the kick off meeting the test is explained to all involved. Also any questions are answered and the first feedback is received. The people present at the kick-off meeting are: operators of the lactose production, process coordinators, and planning staff.
Establish formats for the performance measurements The formats must be developed in consultation with the employees responsible recording the performance measurement.
Exercise with scheduler As we explained in Section 4.7.3 the schedule could have some infeasibility with concern to the pipeline restrictions, also the post-evaporators are not used optimally. Therefore the scheduler must do some manual adjustments to guarantee the feasibility of the schedule. To get familiar with the manual rescheduling, we advise to let the scheduler practice with some example situations. This way the scheduling during the test will go easier and lead to an improved schedule.
Exercise with operators All the concerned operators must get acquainted with the schedule before the test starts. Therefore we suggest setting up short workshops to let the operators practice with the interpretation of the schedule and how to use the schedule. From the workshops the project team collects feedback and if needed the way the schedule is communicated is adjusted.
5.2.7 During the test This subsection describes the responsibilities and tasks during the test of the involved employees.
Responsibilities of the scheduler The scheduler is responsible for making the schedule. The first few days of the test the whole project team is involved in setting up the schedule. Hereafter, only the scheduler prepares the schedule as it should be done in practice. We advise the scheduler to keep in close contact with the operators and ask for feedback on a daily basis. The scheduler is required to keep a logbook during the testing period. All suggestions and feedback that the scheduler has and receives is recorded in the logbook. Furthermore, the scheduler is responsible for recording the following performance measure:
o Number of times rescheduling was needed and accompanying reason of the disruption
Responsibilities of operators The operators at the lactose production are required to keep up a logbook during the test period. Within each team one operator is appointed the responsibility for updating this logbook. The operators are also responsible for the recording of the following performance measure:
54
o Number of times the suggestion of the schedule could not be executed and accompanying reason
Monitoring of the parameters The input parameters of the schedule must not differ too much from reality. Therefore it is important that the parameters are monitored during the conduction of the test. The project team is responsible for monitoring the parameters. If a crucial parameter differs too much, the project team must try to trace the underlying cause. The project team must establish if a parameter is crucial.
Daily evaluation The project team has a daily evaluation of the progress of the project. Every day the performance of the day before is evaluated. The inputs for the evaluation are the logbooks and verbal update of the scheduler and the operators, the performance measurements and the input parameters. The project team is responsible for monitoring the performance of the bottleneck. After the evaluation, possible adjustments are done.
5.2.8 Evaluation of the test After the test is finished, it should be evaluated. This should be a very broad evaluation, not only on the performance criteria. Persons included in the evaluation should be operators from the lactose production, process coordinators, the schedulers, production manager, and the planning department manager. We suggest the following evaluation points:
Evaluation criteria (Section 5.1) Comparison of used parameters for the schedule and actual parameters Timeline of release of the schedule Fulfillment of wishes of employees using the schedule Guidelines for rescheduling
The outcome of this evaluation should be a conclusion on if the proposed scheduling method is possible to use in practice at Domo Borculo and if so, which adjustments should be made.
5.3 Conclusion In this chapter we advised Domo Borculo how to outline the testing in practice of the proposed scheduling method. The objective of the test is to measure the quality of the schedule. We established the following criteria that should be used during the test to measure the quality:
Effectiveness of the schedule Stability of the schedule Understandability of the schedule Performance of the bottleneck
We advise Domo Borculo to arrange a project team that is responsible for the operation of the test. We propose to let the duration of the test be ten weeks, since other recent projects at Domo Borculo learned that this is a suitable time period. The schedule is communicated to the operators in the form of a Gantt chart with an accompanying list of start and finish times. A new schedule should be communicated every day after the fixed meeting between planning and production at 4.00 PM. During the test, a scheduler or project member should work during weekends to make the schedule and do rescheduling if necessary. The operators are responsible for keeping up a logbook. The project team should have a daily evaluation where the logbook is used as input. After the test, the

55
whole project should be evaluated with all employees involved. Then, Domo Borculo can decide if the proposed scheduling method is truly possible to use in practice.
56
Chapter 6: Conclusion & Recommendations This chapter states the conclusions of this study in Section 6.1. Section 6.2 discusses the limitations of the study. Section 6.3 outlines the recommendations from this research and Section 6.4 the recommendations for further research.
6.1 Conclusions The volume development of the Ingredients group of FrieslandCampina was limited due to the maximum utilization of the production capacity in 2012. This also holds for Domo Borculo; the demand for (most of the) Domo products is higher than its current production. In order to achieve a higher production output, control on the production process is required. The complexity of the production process, the autonomy of the operator, and the uncertainty in the arrival of raw material makes it difficult to control the production process. This research focuses on the production of lactose-rich products, because Domo Borculo encounters most problems with this process. Therefore, we define the following main research question:
How can FrieslandCampina Domo Borculo get control over the production of lactose-rich products? Production control is concerned with the coordination of manufacturing activities. At the goods flow level, it is concerned with planning and, at the unit control level, it is linked to scheduling. This research focuses on the scheduling of the lactose production process. In order to answer the research question, we study the production and planning processes at FrieslandCampina Domo Borculo. From this we conclude that the theoretical bottleneck of the lactose production is the dissolving street. However, due to the long waiting times of a batch in K1, this is currently the bottleneck. So, the output of the production process is lower than possible, while the demand of the lactose production is higher than the current output of the production system. This makes the current way of working in the production system a problem and the control of the lactose production should be improved.
We characterized Domo Borculo as an organization in the process industry. Due to the special characteristics of the process industry, the model formulations for discrete manufacturing scheduling problems do not fit and a general technique proposed for scheduling does not exists. After a thorough literature research of the process industry scheduling literature, we conclude that due to time limitations none of the modeling formulations we found in literature are solved to optimality. Also, the solution methods found are not directly applicable to the lactose production process of Domo Borculo. With the gathered knowledge, we developed a scheduling heuristic. The initial goal of scheduling is to provide Domo Borculo control over the production system. The heuristic is aimed at improving the utilization of the bottleneck. With the scheduling method, we can eliminate unnecessary waiting time and therefore we assume that the dissolving street is the bottleneck. The main strategy of our heuristic is: a maximum utilization of the bottleneck. From this main goal, we derive a second goal: a minimum number of product switches at the bottleneck. With the scheduling method, we can eliminate unnecessary waiting time and therefore we assume that the dissolving street is the bottleneck.
We motivated our choice for the proposed heuristic by means of three case studies and an evaluation by experts. Based on this, we conclude that the heuristic reduces the number of product switches at the dissolving street. By decreasing the number of switches the switching time is reduced
57
resulting in more available production time at the bottleneck. Also, less lactose product has to be degraded to a lower quality due to mixing which happens during a product switch. However, we were only able to demonstrate a slightly improvement in idle time that was caused by product unavailability. This was mainly due to the fact that there was not enough raw material available to schedule. Nevertheless, the schedule does show when idle time at the dissolving street will occur and how much residual is produced, which is currently not known at Domo Borculo. With this information Domo Borculo is able to improve planning of their special production, maintenance, and processing of residuals.
Two groups of experts have checked the scheduling method; one group has checked the heuristic and the other group, the outcome of the case studies. The first group of experts agreed that the logic of the heuristic is clear. The only critique of the second group was that the schedule for the post-evaporators is not always feasible: some product sequences are not allowed. Also, there is sometimes only one batch processed in a run. All experts agreed that when these small infeasibilities are corrected, the schedules of the case studies are all feasible.
Overall, we conclude that the scheduling heuristic has the potential to become a scheduling support tool to assist schedulers and operators at Domo Borculo.
6.2 Limitations There are multiple factors that the model does not consider in the scheduling process, but which must be considered in reality. The most crucial is that the model does not consider pipeline restrictions from the post-evaporators to the K1 tanks. Infeasibility occurs when the three post-evaporators start production at three K1 tanks in the same subsection. The case studies show that this restriction is occasionally violated. However, due to the waiting time we added to each batch in K1 and the overcapacity of the post-evaporators, this can easily be fixed. Also, the usage of the post-evaporators is not always optimal, but this can also easily be adjusted by a scheduler.
The testing of the heuristic is limited. We tested the heuristic thoroughly with many experimental data. Nonetheless we performed only three case studies due to time and effort reasons. Therefore, we advise Domo Borculo to do a real-life test to establish the quality of the heuristic, which Chapter 5 describes.
The heuristic is specifically developed for Domo Borculo. Domo Borculo has a very specific production process. Therefore the model is probably not applicable for other organizations in the process industry.
6.3 Recommendations from this research Domo Borculo wants to have more control over the lactose production process. Therefore, we recommend implementing the scheduling method. We developed a custom-made scheduling heuristic that will give a high utilization at the bottleneck with a minimum number of product switches. First, Domo Borculo should test our proposed heuristic with a ten week long testing period. If the test is positive, Domo Borculo should acquire a professional scheduling tool in which the proposed heuristic can be implemented. The proposed heuristic does not give schedules that can be copied one- on-one, but gives a starting point which the schedulers can easily improve.
58
Domo Borculo needs the professional scheduling tool to visualize the proposed schedule and to easily make changes to the schedule. With a scheduling tool an operator can indicate whether or not he started a batch on time. Also, the batch can be traced back quicker through the production process if quality does not meet up to standards. This is a very important aspect, since Domo Borculo produces infant food which must meet very high quality.
To establish the heuristic we made assumptions. Two of those assumptions should be researched further and appointed as a crucial parameter in the test. We recommend constant monitoring and analyzing of these parameters. So when there is a deviation in the parameter, the parameter should be adjusted in the schedule.
The first assumption is that we use a calculation of the average of the capacity of the dissolving street. The variation in the production capacity cannot be predicted beforehand and thus the proposed scheduling method does not take it into account. Nevertheless, the varying production capacity can influence the production output in such a way that it harms the reliability of the schedule. We recommend improving the certainty of the dissolving street with further research. The second assumption is the amount and the percentage of dry content of SWML that emerges at the dissolving street. Since the current scheduling method does not include the scheduling of SWML, we cannot indicate if the SWML is always available and is thus added to the whey pasta. Thus Domo Borculo should monitor the dry content of SWML and the availability of SWML.
6.4 Recommendations for future research During this study we observed several subjects that are of interest for future research at Domo Borculo.
A good improvement would be to incorporate the pipeline restrictions in the scheduling method. The manual adjustments a scheduler should do to make the schedule feasible, would decrease.
In order to improve the current scheduling method further, it should consider the integration of the lactose production with the other production lines. For instance, part of the lactose production goes to the GOS production line. The control of the total production system would improve if the schedule indicated which batches are designated for the lactose production and which for the GOS.
Furthermore, we recommend integrating the scheduling and planning processes. In this research we considered the scheduling process as a separate entity. Of course, in reality the scheduling process must be integrated with the planning processes. The schedule must follow the outlines of the plan and also provide feedback towards the execution of the plan.
As we pointed out in this research, Domo Borculo has hardly any arrangements about the delivery of whey and permeate. There is a whey plan, but this plan is changed several times a day. For the arrival of whey the exact arrival times do not have to be known, because of the large storage facility. However, the amount of whey is important. For permeate both are important with respect to the utilization of the bottleneck, because there is less storage capacity available and the processing time to the bottleneck is much smaller than with whey. Domo Borculo should research guidelines and restrictions for the arrival of raw material and their inventory levels of raw material, communicate these to the parties involved, and monitor them.
59
Bibliography APICS. (Ed.) (n.d.) (Vols. 2013). http://www.apics.org/gsa-main-search?q=#|dictionary. Artiba, A., & Riane, F. (1998). An application of a planning and scheduling multi-model approach in
the chemical industry. Computers in Industry, 36, 209-229. Bandinelli, R., Cavalieri, S., & Terzi, S. (2005). Proposal of a framework for the evaluation and
comparison of production schedules. Paper presented at the International Federation of Automatic Control, Czech Republic.
Chae, B. (2009). Developing key performance indicators for the supply chain: An industry perspective. Supply chain Management: an international Journal, 14, 422-428.
Crama, Y., Pochet, Y., & Wera, Y. (2001). A discussion of production planning approaches in the process industry. 1-36.
Das, B.P., Rickard, J.G., Shah, N., & Macchietto, S. (2000). An investigation on integration of aggregate production planning, master production scheduling and short-term production scheduling of batch process operations through a common data model. Computers & Chemical Engineering, 24(1625-1631).
De Snoo, C., Van Wezel, W., & Jorna, R.J. (2010). An empirical investigation of scheduling performance criteria. Journal of operations management(29), 181-193. doi: 10.1016/j.jom.2010.12.006
Dennis, D.R., & Meredith, J.R. (2000). An analysis of process industry production and inventorymanagement systems. Journal of Operations Management, 18, 683-699.
Floudas, C.A., & Lin, X. (2004). Continuous-time versus discrete-time approaches for scheduling of chemical processes: A review. Computers & Chemical Engineering, 28(11), 2109-2129. doi: 10.1016/j.compchemeng.2004.05.002
Fransoo, J.C., & G.M.M., R.W. (1993). A typology of production control in process industries. Production Control Situations, 47-57.
FrieslandCampina. (2012). Jaarverslag 2012. Amersfoort: FrieslandCampina N.V. FrieslandCampina. (2013). About frieslandcampina. Retrieved June, 2013, from
http://www.frieslandcampina.com/english/about-us/frieslandcampina-and-you.aspx Grossmann, I.E., Heever, S.A., & Harjunkoski, I. Discrete optimization methods and their role in the
integration of planning and scheduling. 150-168. Hans, E.W., Leus, R., Wullink, G., & Herroelen, W. (2007). A hierarchical approach to multi-project
planning under uncertainty. International Journal of Management Science, 35(5), 563-577. Hopp, W., & Spearman, M.L. (2008). Factory physics (Vol. 3rd): McGraw Hill Irwin. Kallrath, J. (2002a). Combined strategic and operational planning - an milp success story in chemical
industry. OR Spectrum, 24, 315-341. Kallrath, J. (2002b). Planning & scheduling in the process industrie. OR Spectrum, 24, 219-250. Kempf, K., Uzsoy, R., Smith, S., & Gary, K. (2000). Evaluation and comparison of production schedules.
Computers in Industry(42), 203-220. Kopanos, G.M., Puigjaner, L., & Georgiadis, M.C. (2011). Resource-constrained production planning in
semicontinuous food industries. Computers & Chemical Engineering, 35(12), 2929-2944. doi: 10.1016/j.compchemeng.2011.04.012
Kudva, G., Elkamel, A., Pekny, J.F., & Reklaitis, G.V. (1994). Heuristic algorithm for scheduling batch and semi-continuous plants with production deadlines, intermediate storage limitations and equipment changeover costs. Computers & Chemical Engineering, 18(9), 859-875.
Maravelias, C.T., & Grossmann, I.E. (2003). New general continuous time state-task network formulation for short-term scheduling of multipurpose batch plants. Ind. Eng. Chem Res., 42, 3056-3074.
McKay, K.N., & Wiers, V.C.S. (2003). Planning, scheduling and dispatching tasks in production control. Cognition, Technology & Work, 5(2), 82-93. doi: 10.1007/s10111-002-0117-4
60
Méndez, C.A., Cerdá, J., Grossmann, I.E., Harjunkoski, I., & Fahl, M. (2006). State-of-the-art review of optimization methods for short-term scheduling of batch processes. Computers & Chemical Engineering, 30(6-7), 913-946. doi: 10.1016/j.compchemeng.2006.02.008
Neumann, K., Schwindt, C., & Trautmann, N. (2002). Advanced production scheduling for batch plants in the process industries. OR Spectrum, 24, 251-279.
Neumann, K., Schwindt, C., & Trautmann, N. (2005). Scheduling of continuous and discontinuous material flows with intermediate storage restrictions. European Journal of Operational Research, 165(2), 495-509. doi: 10.1016/j.ejor.2004.04.018
Prasad, P., & Maravelias, C.T. (2008). Batch selection, assignment and sequencing in multi-stage multi-product processes. Computers & Chemical Engineering, 32, 1106-1119. doi: 10.1016/j.compchemeng.2007.06.012
Qian, Y., Pan, M., & Huang, Y. (2009). Modeling and optimization for scheduling of chemical batch processes. Chinese Journal of Chemical Engineering, 17(1).
Reinfeld, N.V. (1987). Handbook of production and inventory control. Englewood: Prentice-Hall. Rutten, W.G.M.M. (1993). Hierarchical mathematical programming for operation planning in a
process industry. European Journal of Operational Research, 64, 363-369. Schilling, G., & Pantelides, C.C. (1996). A simple continuous-time processing scheduling formulation
and a novel solution algorithm. Computers & Chemical Engineering, 20, s1221-s1226. Stobbe, M., Lohl, T., Schulz, C., & Engell, S. (2000). Consolidated review of research and applications:
Planning and scheduling in the process industry. Tan, W., & Khoshnevis, B. (2000). Integration of process planning and scheduling: A review. Journal of
Intelligent Manufacturing, 11, 51-63. Velez, S., & Maravelias, C.T. (2013). A branch-and-bound algorithm for the solution of chemical
production scheduling mip models using parallel computing. Computers & Chemical Engineering, 55, 28-39. doi: 10.1016/j.compchemeng.2013.03.030
Wang, H.-y., Zhao, Y.-w., Xu, X.-l., & Wang, W.-l. (2009). Scheduling batch and continuous process production based on an improved differential evolution algorithm. Systems Engineering - Theory & Practice, 29(11), 157-167. doi: 10.1016/s1874-8651(10)60086-5
Wu, D., & Ierapetritou, M. (2007). Hierarchical approach for production planning and scheduling under uncertainty. Chemical Engineering and Processing: Process Intensification, 46(11), 1129-1140. doi: 10.1016/j.cep.2007.02.021

61