Embed Size (px)
Citation preview

Developing a Simple and Rapid Test for Monitoring the Heat Evolution of Concrete Mixtures for Both Laboratory and Field Applications
Phase II ReportJanuary 2007
Sponsored bythe Federal Highway Administration (Project 17, Phase II)
Iowa State University’s Center for Transportation Research and Education is the umbrella organization for the following centers and programs: Bridge Engineering Center • Center for Weather Impacts on Mobility
and Safety • Construction Management & Technology • Iowa Local Technical Assistance Program • Iowa Traffi c Safety Data Service • Midwest Transportation Consortium • National Concrete Pavement
Technology Center • Partnership for Geotechnical Advancement • Roadway Infrastructure Management and Operations Systems • Statewide Urban Design and Specifications • Traffic Safety and Operations

About the National Concrete Pavement Technology Center
The mission of the National Concrete Pavement Technology Center is to unite key transportation stakeholders around the central goal of advancing concrete pavement technology through research, tech transfer, and technology implementation.
Disclaimer Notice
The contents of this report refl ect the views of the authors, who are responsible for the facts and the accuracy of the information presented herein. The opinions, fi ndings and conclusions expressed in this publication are those of the authors and not necessarily those of the sponsors.
The sponsors assume no liability for the contents or use of the information contained in this document. This report does not constitute a standard, specifi cation, or regulation.
The sponsors do not endorse products or manufacturers. Trademarks or manufacturers’ names appear in this report only because they are considered essential to the objective of the document.
Nondiscrimination Statement
Iowa State University does not discriminate on the basis of race, color, age, religion, national origin, sexual orientation, gender identity, sex, marital status, disability, or status as a U.S. veteran. Inquiries can be directed to the Director of Equal Opportunity and Diversity, (515) 294-7612.

Technical Report Documentation Page
1. Report No. 2. Government Accession No. 3. Recipient’s Catalog No. FHWA DTF61-01-00042 (Project 17, Phase II)
4. Title and Subtitle 5. Report Date January 2007 6. Performing Organization Code
Developing a Simple and Rapid Test for Monitoring the Heat Evolution of Concrete Mixtures for Both Laboratory and Field Applications
7. Author(s) 8. Performing Organization Report No. Kejin Wang, Zhi Ge, Jim Grove, J. Mauricio Ruiz, Rob Rasmussen, and Ted Ferragut
9. Performing Organization Name and Address 10. Work Unit No. (TRAIS) 11. Contract or Grant No.
Center for Transportation Research and Education Iowa State University 2711 South Loop Drive, Suite 4700 Ames, IA 50010-8664
12. Sponsoring Organization Name and Address 13. Type of Report and Period Covered Phase II Report 14. Sponsoring Agency Code
Federal Highway Administration U. S. Department of Transportation 400 7th Street SW, HIPT-20 Washington, DC 20590
15. Supplementary Notes Visit www.ctre.iastate.edu for color PDF files of this and other research reports. 16. Abstract Recently, activities and interest in monitoring the heat evolution of cement hydration in concrete have increased. This is because the development of early-age concrete properties (such as workability, setting time, strength gain, and thermal cracking resistance) is predominantly influenced by the kinetics of cement hydration. Various test methods are currently available for measuring heat of cement hydration; however, most existing methods require expensive equipment, complex testing procedures, and/or extensive time, thus making them unsuitable for field application. Although ASTM C 186 is used for determining the heat of hydration of cement, there is no standard test method for concrete. The overall object of this three-phase study is to identify, develop, and evaluate a standard test procedure for monitoring pavement concrete using a calorimetry technique. It is envisioned that the newly developed calorimetry test method will be able to verify appropriate concrete proportions, to identify potentially incompatible materials and conditions, and to predict concrete performance. The primary objective of Phase II (presented in this report) is to establish a standard test procedure as well as the methods for interpreting the calorimeter test results. The newly developed calorimeter test is completed more quickly than ASTM C 186, in approximately 24 hours. Among a number of uses, the test can be utilized as a quality control measure for prescreening concrete materials and a prediction tool for early-age cracking. The Phase II results demonstrate that the new calorimetry test method has a high potential for detecting concrete incompatibility problems, predicting fresh concrete properties (such as set time), and assessing hardened concrete performance characteristics (such as strength gain and thermal cracking). 17. Key Words 18. Distribution Statement calorimetry—cement hydration—early-age properties—heat evolution—pavement performance
No restrictions.
19. Security Classification (of this report) 20. Security Classification (of this page)
21. No. of Pages
22. Price
Unclassified. Unclassified. 58 NA
Form DOT F 1700.7 (8-72) Reproduction of completed page authorized


DEVELOPING A SIMPLE AND RAPID TEST FOR MONITORING THE HEAT EVOLUTION OF
CONCRETE MIXTURES FOR BOTH LABORATORY AND FIELD APPLICATIONS
Phase II Report January 2007
Principal Investigator Kejin Wang
Associate Professor of Civil, Construction, and Environmental Engineering Iowa State University
Co-Principal Investigator
Jim Grove PCC Engineer
Center for Transportation Research and Education, Iowa State University
Research Assistant Zhi Ge
Authors
Kejin Wang, Zhi Ge, Jim Grove, J. Mauricio Ruiz, Rob Rasmussen, and Ted Ferragut
Sponsored by the Federal Highway Administration (Project 17, Phase II)
A report from Center for Transportation Research and Education
Iowa State University 2711 South Loop Drive, Suite 4700
Ames, IA 50010-8664 Phone: 515-294-8103 Fax: 515-294-0467
www.ctre.iastate.edu


TABLE OF CONTENTS
ACKNOWLEDGMENTS ............................................................................................................ IX
EXECUTIVE SUMMARY .......................................................................................................... XI
INTRODUCTION ...........................................................................................................................1 Background and Problem Statement....................................................................................1 Research Approach and Scope ............................................................................................2 Summary of Phase I Study...................................................................................................3
EXPERIMENTAL WORK..............................................................................................................5 Materials ..............................................................................................................................5 Specimens ............................................................................................................................7 Experimental Design............................................................................................................7 Experimental Methods .........................................................................................................8
LAB TEST RESULTS...................................................................................................................14 Isothermal Calorimeter Test: Equipment Evaluation ........................................................14 Isothermal Calorimeter Test: Material Characterization ...................................................16 Set Time Tests....................................................................................................................19 Mortar Strength..................................................................................................................22
INTERPRETATION AND APPLICATION OF THE TEST RESULTS .....................................23 Potential Application of Calorimetry Results....................................................................23 Calorimeter Test Result Interpretation: Heat Index Development ....................................30 Application of the Heat Indexes and Calorimeter Results.................................................31
USE OF CALORIMETRY RESULTS IN HIPERPAV................................................................38 Evaluate DOH with Semi-Adiabatic versus Isothermal Test Results................................39 Evaluate DOH with Semi-Adiabatic for Seven-Day versus 24-Hour Testing ..................39 Examine HIPERPAV Performance Predictions for DOH Computed with Seven-Day versus 24-Hour Testing......................................................................................................40 Recommendations for Future Testing................................................................................40
FIELD TEST RESULTS ...............................................................................................................41
SUMMARY...................................................................................................................................43
REFERENCES ..............................................................................................................................45
v
LIST OF FIGURES Figure 1. Calorimeter unit................................................................................................................9 Figure 2. Configuration of the calorimeter module .........................................................................9 Figure 3. Calibration units .............................................................................................................10 Figure 4. Connection of the calibration units ................................................................................10 Figure 5. Output of the calibration process....................................................................................11 Figure 6. AdiaCal calorimeter unit ................................................................................................12 Figure 7. Determining initial set time from the derivatives method..............................................13 Figure 8. Determining final set time from the derivatives method................................................13 Figure 9. Determining set times from the fractions method ..........................................................13 Figure 10. Variation for different channels ...................................................................................14 Figure 11. Repeatability of calorimeter tests performed by a given operator at different times ...15 Figure 12. Repeatability of the calorimeter test with three different operators.............................15 Figure 13. Effect of cement type on heat of hydration ..................................................................16 Figure 14. Effect of cement sources on heat of hydration .............................................................17 Figure 15. Effect of water-to-cement ratio on heat of hydration ...................................................17 Figure 16. Effect of fly ash replacement level on heat of hydration (source B, cured at 20ºC) ....18 Figure 17. Effect of w/c ratio on heat of hydration (30% replacement, cured at 20ºC) ................18 Figure 18. Effect of curing temperature on heat of hydration (Type I cement) ............................19 Figure 19. Determination of set times ...........................................................................................20 Figure 20. Effect of cement type and temperature on set times.....................................................20 Figure 21. Effect of fly ash replacement and temperature on set times (source O).......................21 Figure 22. Effect of fly ash type and temperature on set times .....................................................21 Figure 23. Effect of cement type on strength development (cured at 20ºC)..................................22 Figure 24. Effect of fly ash replacement level on strength development (cured at 40ºC).............22 Figure 25. Effect of fly ash type on strength development (cured at 30ºC, 40% replacement) ....23 Figure 26. Development of the heat indexes .................................................................................30 Figure 27. Development of heat indexes for mortar containing fly ash ........................................31 Figure 28. Comparison of the set times from ASTM C 403 and calorimetry tests .......................33 Figure 29. Calorimetry results for the incompatible materials ......................................................34 Figure 30. Heat indexes for different types of cement ..................................................................35 Figure 31. Heat indexes for samples with different fly ash replacement levels ............................36 Figure 32. Heat indexes for samples with different fly ashes........................................................36 Figure 33. Heat indexes for samples with different w/c ratios ......................................................36 Figure 34. Heat indexes for samples under different curing conditions........................................37 Figure 35. Relationship between strength and generated heat ......................................................38 Figure 36. Typical sample temperature profiles from the AdiaCal tests .......................................41 Figure 37. Set times for the New York and South Dakota field tests............................................42 Figure 38. Average temperature history of samples cured in different environments ..................43
vi

LIST OF TABLES Table 1. Chemical composition of cement ......................................................................................6 Table 2. Chemical composition of fly ash .......................................................................................7 Table 3a. TWG member ranking on the potential applications of calorimetry tests .....................28 Table 3b. Comparison of calorimetry test with other available tests.............................................29 Table 4. Summary of heat indexes for the incompatible materials................................................35 Table 5. Summary of heat indexes (initial and final set) for different materials ...........................37
vii


ACKNOWLEDGMENTS
This project is sponsored by the National Concrete Pavement Technology Center (CP Tech Center) and the Federal Highway Administration (FHWA). The authors would like to express their gratitude to the CP Tech Center and FHWA for their support.
Special thanks are extended to the technical working group (TWG) members: Paul Sandberg (WR Grace), Peter Taylor (CTL), Wes Woytowich (Lafarge), Anton Schindler (Auburn University), Todd Hanson (Iowa DOT), Gary Knight (Holcim), Gary Crawford (FHWA), Leif Wathne (ACPA), Steve Otto (Holcim), Karthia Obla (NRMCA), Heather Houck (NRMCA), and Geoffrey Kurgan (FHWA). The authors are particularly indebted to Sandberg for his valuable advices on the use of calorimeter equipment and test data analyses and to Woytowich, Otto, and Taylor for their additional support regarding cementitious materials.
Finally, the authors would like to thank Bob Steffes, Jiong Hu, and Gang Lu at Iowa State University for their great help in the lab. The project might not have been completed on schedule without the support from all the individuals listed above.
ix


EXECUTIVE SUMMARY
This project was designed to identify, develop, and evaluate a standard test procedure for monitoring performance of pavement concrete materials using a relatively simple, economical, and reliable calorimetry device.
The project includes three phases. Phase I, completed in December 2005, aimed to identify the user needs for a calorimeter test and potential applications of calorimeter test results. The goals of Phase II were to establish a standard test procedure as well as the methods for interpreting the calorimeter test results. Phase III, a future project, will verify the major applications of the calorimeter test method and develop the specification for calorimeter testing of field concrete.
Phase II included the following work items:
• Performed a series of lab tests for approximately 120 mortar mixes using a Thermometric isothermal calorimeter
• Tested the set time and strength development for these mortar mixes • Developed the heat index method for interpretation of the calorimetry test results • Studied the relationships between the mortar set times obtained from the calorimetry and
ASTM tests • Identified the potential applications of the calorimeter test results • Performed two field tests using AdiaCal semi-adiabatic calorimeter • Estimated pavement performance using HIPERPAV and field calorimetry data
The Phase II results demonstrate that the calorimetry test method has a high potential for detecting concrete incompatibility problems, predicting fresh concrete properties (such as set time), and assessing hardened concrete performance (such as strength gain and thermal cracking). Some specific findings of the Phase II study include the following:
• The test method developed for the selected isothermal calorimeter device is easy and repeatable.
• The calorimeter test can be used to differentiate the heat evolution of mortars made with different materials and subjected to different curing conditions.
• The calorimeter test can be used to identify material incompatibility and to flag cementitious changes.
• The heat indexes, related to the first derivative of the calorimeter curve and the area under the curve, are able to characterize the features of mortar. They can also be used to predict the mortar set time and early-age strength (up to two days).
• Incorporated with the HIPERPAV computer program, calorimeter test results are able to provide insight into the risk of thermal cracking in field concrete.
• The selected semi-adiabatic calorimeter test device (AdiaCal) is also easy to use. The test result provides a very good prediction on the set time of field concrete.
xi


INTRODUCTION
Background and Problem Statement
Recently, activities and interest in monitoring the heat evolution of cement hydration in concrete have increased. This is because the development of early-age concrete properties (such as workability, setting time, strength gain, and thermal cracking resistance) is predominantly influenced by the kinetics of cement hydration. Hydration of cementitious materials in a concrete mixture results in a number of exothermic chemical reactions that liberate heat. The heat evolution process is strongly influenced by the chemical and physical properties of Portland cement, supplementary cementitious materials (SCMs), chemical admixtures, concrete mix proportions, construction procedures, and curing conditions of concrete. As a result, deviations in the quantities and characteristics of the concrete constituents can be detected, as well as the effects of construction conditions, and concrete performance can be predicted by monitoring the heat of cement hydration (1, 2).
Modern concrete mixtures have a very complex chemical system. The complexity of the mixtures results from the number of ingredients used (such as various SCMs and chemical admixtures) and the various types and sources of the ingredients supplied to any given project. The compatibility issue related to the adequate use of concrete materials is quickly gaining attention. Abnormal early hydration resulting from “incompatibility” of concrete materials has resulted in erratic set and strength-gain behavior and the associated finishing, curing, and early-age cracking behaviors. The influences of construction and environmental conditions, such as cold and hot weather, often aggravate these problems. However, the existing guidance lacks information on the proper test methods for identifying these problems.
Lately, the advances in using thermal measurements of the early heat development of concrete mixtures in the laboratory have demonstrated that calorimetry tests have a high potential for detecting concrete incompatibility problems, predicting fresh concrete properties (such as set time), and assessing hardened concrete performance (such as strength gain and thermal cracking) under various climatic conditions (3, 4).
Various test methods are currently available for measuring heat of cement hydration; however, most existing methods require expensive equipment, complex testing procedures, and/or extensive time, thus making them unsuitable for field application. Although ASTM C 186 is used for the determination of the heat of hydration of cement, there is no standard test method for concrete. The urgent need for standardization of concrete calorimeters has been addressed in Task 15 of the project report “Concrete Pavement Technology Long Term Research and Technology Plan” (5).
The overall object of the proposed study is to identify, develop, and evaluate a standard test procedure for monitoring pavement concrete using a calorimetry technique. It is envisioned that the newly developed calorimetry test method will be able to verify appropriate concrete proportions, identify potentially incompatible materials and conditions, and predict concrete performance.
1
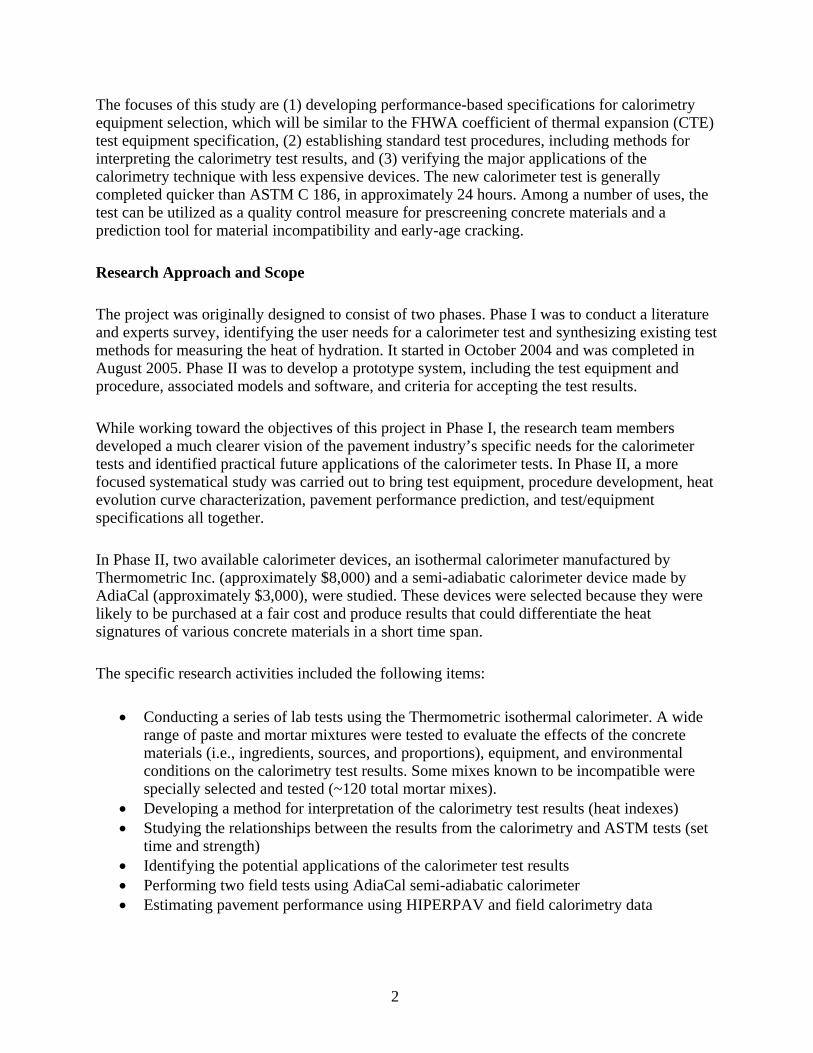
The focuses of this study are (1) developing performance-based specifications for calorimetry equipment selection, which will be similar to the FHWA coefficient of thermal expansion (CTE) test equipment specification, (2) establishing standard test procedures, including methods for interpreting the calorimetry test results, and (3) verifying the major applications of the calorimetry technique with less expensive devices. The new calorimeter test is generally completed quicker than ASTM C 186, in approximately 24 hours. Among a number of uses, the test can be utilized as a quality control measure for prescreening concrete materials and a prediction tool for material incompatibility and early-age cracking.
Research Approach and Scope
The project was originally designed to consist of two phases. Phase I was to conduct a literature and experts survey, identifying the user needs for a calorimeter test and synthesizing existing test methods for measuring the heat of hydration. It started in October 2004 and was completed in August 2005. Phase II was to develop a prototype system, including the test equipment and procedure, associated models and software, and criteria for accepting the test results.
While working toward the objectives of this project in Phase I, the research team members developed a much clearer vision of the pavement industry’s specific needs for the calorimeter tests and identified practical future applications of the calorimeter tests. In Phase II, a more focused systematical study was carried out to bring test equipment, procedure development, heat evolution curve characterization, pavement performance prediction, and test/equipment specifications all together.
In Phase II, two available calorimeter devices, an isothermal calorimeter manufactured by Thermometric Inc. (approximately $8,000) and a semi-adiabatic calorimeter device made by AdiaCal (approximately $3,000), were studied. These devices were selected because they were likely to be purchased at a fair cost and produce results that could differentiate the heat signatures of various concrete materials in a short time span.
The specific research activities included the following items:
• Conducting a series of lab tests using the Thermometric isothermal calorimeter. A wide range of paste and mortar mixtures were tested to evaluate the effects of the concrete materials (i.e., ingredients, sources, and proportions), equipment, and environmental conditions on the calorimetry test results. Some mixes known to be incompatible were specially selected and tested (~120 total mortar mixes).
• Developing a method for interpretation of the calorimetry test results (heat indexes) • Studying the relationships between the results from the calorimetry and ASTM tests (set
time and strength) • Identifying the potential applications of the calorimeter test results • Performing two field tests using AdiaCal semi-adiabatic calorimeter • Estimating pavement performance using HIPERPAV and field calorimetry data
2

Summary of Phase I Study
In Phase I, a collaborative research team consisting of members from the PCC Center, Iowa State University (ISU), and the Transtec Group worked on the following two major tasks:
• Task 1: Identify the user needs for a calorimeter test, including performance requirements and precision and bias limits.
• Task 2: Identify and synthesize existing test procedures for measuring the heat of hydration of concrete using calorimetry and other methods, including efforts both in the U.S. and abroad.
These tasks have been accomplished through three major activities: (1) collecting inputs and advice from the project technical working group (TWG), (2) conducting a literature survey, and (3) performing some trial tests at the PCC Center’s research lab.
The project started with a kickoff meeting on October 1, 2004. All TWG and research team members attended the meeting. The TWG members included Mr. Gary Knight (Holcim), Dr. Paul Sandberg (WR Grace), Mr. Wes Woytowich (Lafarge), Dr. Peter Taylor (CTL), Dr. Anton Schindler (Auburn University), Mr. Todd Hanson (Iowa DOT), Mr. Gary Crawford (FHWA), and Mr. Leif Wathne (FHWA). Valuable inputs on the needs, importance, and current practices of various calorimeter tests were provided by the TWG members at the meeting. Broad discussions were held that addressed specific issues on the product development (e.g., product configuration, cost, test procedure, result interpretation, and application). These inputs and discussions have been summarized and thoroughly considered by the research team members in their recommendations for the new device development of the Phase II study.
A literature review on heat evolution tests was conducted, and the results were synthesized to provide the following information:
• Factors affecting the concrete heat evolution • Existing devices and test methods for heat evolution measurement (type of calorimeter,
configurations, procedures, measurements, advantages, disadvantages, applications, and accuracy)
• Existing temperature sensors and dataloggers (temperature range and sensitivity) • Existing models for predicting heat of hydration and interpreting raw data • Potential applications of the test results (such as predicting concrete set time, determining
sawing/finishing time, identifying incompatibility problems, and checking cement characteristics for various sulfate phases)
A series of mini-tests was performed at the PCC Center using different Dewar devices to investigate the effects of device insulation, sample size, curing temperature, and mineral admixtures on heat evolution curves.
3

The results from the Phase I study indicate the following:
1. The factors affecting concrete heat evolution include cementitious material properties (such as chemical composition, sulfate content, and fineness), concrete mix design (water-to-cement ratio (w/c), replacement level of SCMs, and type and amount of chemical admixtures), and construction conditions (such as placement and curing temperatures). Limited research has been reported regarding the effects that dimensions of concrete pours or sample sizes have on heat measurements.
2. Existing calorimetry tests can be divided into three major categories: adiabatic, semi-adiabatic/isothermal, and isothermal calorimetry tests. • Adiabatic calorimeters (temperature loss < 0.02 k/h) are most commonly used for
concrete tests. The materials used for heat insulation of the devices can be water, air, and heated containers, of which water insulation is the most popular choice. A major drawback of adiabatic calorimeters is that the test method does not account for the effect of curing temperature on concrete heat evolution.
• Isothermal calorimetry tests, often used for studying the reaction of kinetics of cement pastes, are conducted at a constant temperature. The heat of cement hydration is directly measured by monitoring the heat flow from the specimen. The total heat evolution can be readily determined from the sum of the measured heat over time. However, isothermal tests do not take into account the cement reactivity change due to the change of temperature. It is hard to predict the temperature increase of concrete from these results. Thus, the conditions in the real structure where the temperature continually changes are not reflected. Both adiabatic and isothermal calorimeter tests generally take as long as a week to complete. Semi-adiabatic calorimeters allow some heat loss to the environment (maximum heat loss < 100 J/ (h⋅K)).
• The semi-adiabatic curve of a tested material is generally lower than the curve from an adiabatic test. This heat loss is measured and accounted for in the calculation of heat flow under adiabatic conditions. Semi-adiabatic calorimetry test methods are suitable for pastes, mortars and concrete samples.
• RILEM has conducted a “Round Robin” test program to compare the performances of different types of calorimeters. Fourteen different organizations participated in the program, using different calorimeters with the same materials and mixing proportions. They found that for all adiabatic tests, 50% of the adiabatic temperature rise variations were in a narrow range spanning only 2 K, and the specimen size and the temperature did not significantly affect the temperature rise. For the semi-adiabatic tests, the mean temperature rises were 2–3% below the results from the adiabatic tests, and the semi-adiabatic calorimeters were able to predict the adiabatic temperature rise.
3. Many simple and inexpensive calorimetry tests have been practically used by the cement and concrete industry. Most of these tests are semi-adiabatic calorimetry tests, and some (such as the unthermostated heat conduction test) are semi-isothermal calorimetry tests. The simple, inexpensive devices identified for heat evolution tests include Dewar, coffee cup, and sprayed-foam basket. These test methods generally provide critical feedback within 12–48 hours. They have been used for investigating the effects of SCMs or chemical admixtures on hydration and identifying the compatibility of these materials. However, the accuracy and sensitivity of such simple
4

tests are rarely reported. 4. There also are many different types of temperature sensors and dataloggers available
for monitoring cement and concrete heat evolution. With different temperature ranges and accuracies, their costs range from $20 to $1,000. Models and computer programs for test data analyses are often developed for specific sophisticated heat evolution devices and sensors, rather than simple and inexpensive ones.
5. In addition to the maturity/strength prediction, concrete heat evolution test results can also be used for • flagging changes in cementitious materials, • prescreening materials and/or mix design, • identifying incompatibility of cementitious materials, • verifying mix proportions, • forecasting setting time, • estimating sawing and finishing time, and • predicting risk of thermal cracking.
After reviewing the initial results from the Phase I study, the research team members discussed and identified the major gaps between the existing calorimeter tests and the needs of the pavement industry regarding calorimeter tests. The research team found that, although various calorimeter tests have been conducted for assorted purposes and the potential uses of calorimeter tests are clear, there is no consensus on how to utilize the heat evolution curves to characterize concrete materials or how to effectively relate the characteristics of heat evolution curves to concrete pavement performance. The research team determined that the goal of the Phase II study should be to close these gaps.
EXPERIMENTAL WORK
Materials
Nine cements (one Type I, one Type III, two Type ISM, and five Type I/II from different sources) and six Class C fly ashes (from different sources) were used in this research project. Type I and III cements were from the Holcim plant at Mason City, Iowa. Type I/II cements were from the Lafarge plants at Davenport, Iowa; Grand Chain, Illinois; Sugar Creek, Missouri; Fredonia, Kansas; and Tulsa, Oklahoma. Type ISM cements were from the Lafarge plant at Davenport, Iowa, and the Holcim plant at Mason City, Iowa. The chemical properties of the cements are shown in Table 1. The Type III cement had a much higher Blaine value (551 m2/kg) than the Type I cement (368 m2/kg). The Type I cement had higher C3S content and lower C2S content (58.83% and 10.64%, respectively) than the Type III cement (53.3% and 20.74%, respectively). Both cements had about 10% C3A. The five Type I/II cements from different sources had different chemical compositions. The C3S in these cements ranged from 43.5% to 66.0%. C2S content was 7.7%–28.8%. The C3A content was similar for all five cements (6.4–8%). The SO3 contents ranged from 2.66% to 3.5%.
5
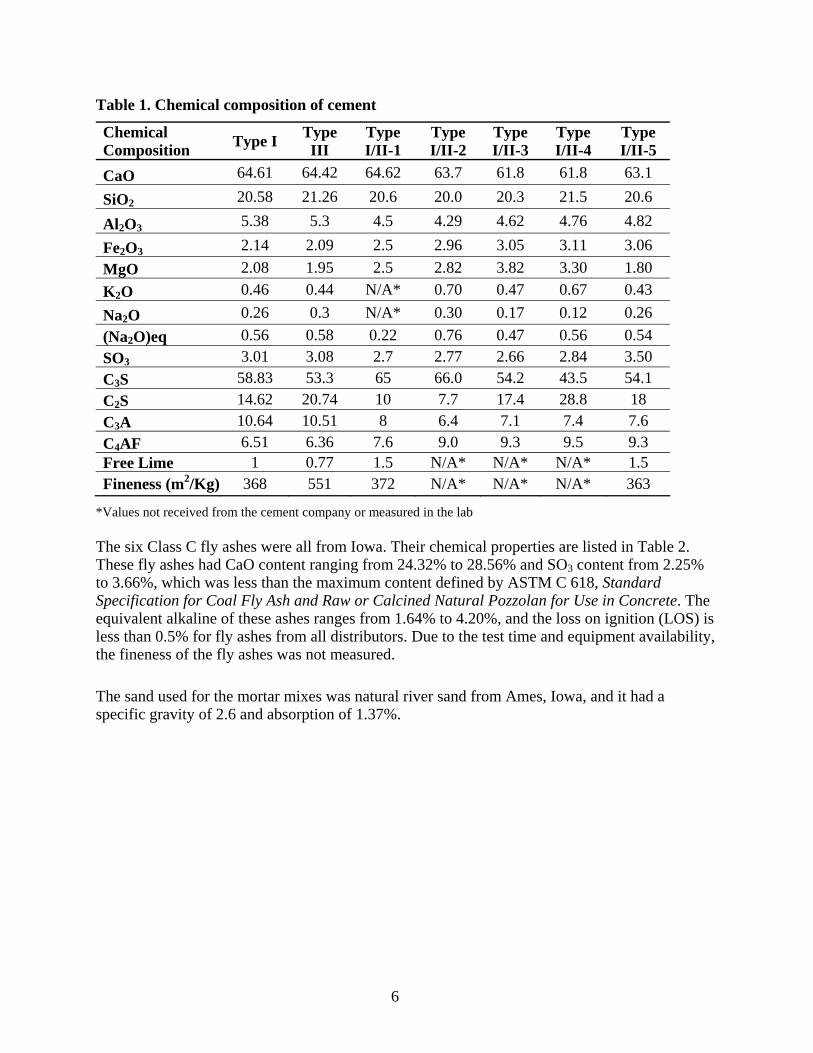
Table 1. Chemical composition of cement
Chemical Composition Type I Type
III Type I/II-1
Type I/II-2
Type I/II-3
Type I/II-4
Type I/II-5
CaO 64.61 64.42 64.62 63.7 61.8 61.8 63.1
SiO2 20.58 21.26 20.6 20.0 20.3 21.5 20.6
Al2O3 5.38 5.3 4.5 4.29 4.62 4.76 4.82
Fe2O3 2.14 2.09 2.5 2.96 3.05 3.11 3.06 MgO 2.08 1.95 2.5 2.82 3.82 3.30 1.80 K2O 0.46 0.44 N/A* 0.70 0.47 0.67 0.43 Na2O 0.26 0.3 N/A* 0.30 0.17 0.12 0.26 (Na2O)eq 0.56 0.58 0.22 0.76 0.47 0.56 0.54 SO3 3.01 3.08 2.7 2.77 2.66 2.84 3.50 C3S 58.83 53.3 65 66.0 54.2 43.5 54.1 C2S 14.62 20.74 10 7.7 17.4 28.8 18 C3A 10.64 10.51 8 6.4 7.1 7.4 7.6 C4AF 6.51 6.36 7.6 9.0 9.3 9.5 9.3 Free Lime 1 0.77 1.5 N/A* N/A* N/A* 1.5 Fineness (m2/Kg) 368 551 372 N/A* N/A* N/A* 363
*Values not received from the cement company or measured in the lab The six Class C fly ashes were all from Iowa. Their chemical properties are listed in Table 2. These fly ashes had CaO content ranging from 24.32% to 28.56% and SO3 content from 2.25% to 3.66%, which was less than the maximum content defined by ASTM C 618, Standard Specification for Coal Fly Ash and Raw or Calcined Natural Pozzolan for Use in Concrete. The equivalent alkaline of these ashes ranges from 1.64% to 4.20%, and the loss on ignition (LOS) is less than 0.5% for fly ashes from all distributors. Due to the test time and equipment availability, the fineness of the fly ashes was not measured.
The sand used for the mortar mixes was natural river sand from Ames, Iowa, and it had a specific gravity of 2.6 and absorption of 1.37%.
6

Table 2. Chemical composition of fly ash
Fly Ash Source* Chemical Composition (%) P C L K O B SiO2 34.12 35.74 34.58 35.99 33.53 32.15 Al2O3 17.75 20.66 18.80 15.74 17.23 16.87 Fe2O3 6.65 5.80 6.25 6.89 5.72 6.26 SiO2 +Al2O3 +Fe2O3 58.52 62.2 59.63 58.62 56.48 55.28 SO3 2.69 2.39 2.25 2.48 3.66 2.64 CaO 27.34 24.32 26.38 26.76 25.75 28.56 MgO 5.13 4.24 4.78 6.12 5.99 7.20 Na2O 1.38 1.60 1.93 1.95 3.80 2.31 K2O 0.38 0.44 0.33 0.43 0.61 0.34 (Na2O)eq 1.63 1.89 2.15 2.23 4.2 2.5 LOI (%) 0.33 0.47 0.16 0.27 0.32 0.40
*Fly ash P was from Port Neal; C from Council Bluffs; L from Lousia; K from Kapp; O from Ottumwa; and B from Burlington, Iowa. Specimens
Mortar samples were used both for tests of calorimetry and ASTM C 403, Standard Test Method for Time of Setting of Concrete Mixtures by Penetration Resistance. The samples were mixed according to ASTM C 305, Standard Practice for Mechanical Mixing of Hydraulic Cement Pastes and Mortars of Plastic Consistency.
All mortar mixes, except those used for studying the effect of water-to-cement ratio (w/c), had the same sand-to-cementitious material ratio (s/cm) of 2.22 and water-to-cementitious materials ratio (w/cm) of 0.43. These two ratios are similar to those in a typical pavement concrete mix used in Iowa. The air entraining agent MB-AE 90 from Master Builder Inc. was used in this project.
Experimental Design
The experimental work conducted in the Phase II study included (1) calorimeter equipment evaluation, (2) cementitious material characterization, and (3) field trial of simple calorimeter device.
As mentioned before, two available calorimeter devices, an isothermal calorimeter manufactured by Thermometric Inc. and a semi-adiabatic calorimeter device manufactured by AdiaCal were studied in the Phase II study. The equipment evaluation has been completed for the isothermal calorimeter and the evaluation for the AdiaCal is still in progress. In addition to the equipment
7
calibration, experiments were also conducted to study (1) variation of the test results from the eight channels of the isothermal calorimeter used, (2) repeatability of the test results obtained by a given operator for a given mix performed at different times, and (3) repeatability of tests performed by three different operators for a given mix.
Using the selected isothermal calorimeter, cementitious material characterization was performed on mortar samples in the consideration of six major factors that affect cement hydration: cement type and source, Class C fly ash source and replacement level, w/cm ratios, and curing condition. In addition to heat evolution, the set time and strength development of the mortar were also evaluated. Besides the use of nine cements and six Class C fly ashes, four fly ash replacement levels (10%, 20%, 30%, and 40%) were also studied under four different curing temperatures (10ºC, 20ºC, 30ºC, and 40ºC). In addition, one set of mortar materials was selected to study the effect of w/cm ratio on heat evolution, where ratios of 0.5, 0.43, and 0.35 were used. Another set of mortar mixes, with and without water-reducing agents (WRA), were selected to evaluate whether or not an incompatibility problem could be identified by the selected isothermal calorimeter. In total, 124 calorimetry tests, 118 ASTM set time tests, and 117 mortar strength tests were performed in Phase II.
Two field calorimeter tests were conducted, one in New York state and the other in South Dakota. In addition to the tests performed regularly in the Portland cement concrete mobile lab, the AdiaCal calorimetry test and set time test were also performed in the field.
Experimental Methods
ASTM Standard Tests
Two ASTM standards tests, ASTM C 403 and C 109, were performed to determine the set time and strength. To conduct an ASTM C 403 test, a mortar sample was placed in a 6 x 7 in. (15.2 x 17.8 cm) steel container, and its surface was leveled using a spatula after mixing and casting. The sample was cured under the designed condition and covered with wet burlap. After a certain elapsed time, penetration needles of different sizes were forced to penetrate 1 in. (25 mm) over a 10-second period. The penetration resistance and time were recorded for each measurement. The size of needle was progressively decreased as concrete stiffened. The initial set and final set times are determined based on the measured penetration resistance.
The strength tests were conducted following ASTM C 109. The 2 x 2 in. cubes were cast and cured under the designed the environment. The samples were demolded after one day and put in water for further curing until the testing time. The strength was tested at 1, 3, 7, 28 and 56 days.
Isothermal Calorimetry Test
In order to control the test condition, the isothermal calorimeter manufactured by Thermometric Inc. was placed in a temperature control chamber as shown in Figure 1. The isothermal calorimeter contains eight separate channels, or units, that will hold eight samples during a test. As illustrated in Figure 2, each unit has an aluminum sample holder. The sample holder rests on
8

a heat flow sensor (peltier) that is placed on a common heat sink, which is a large block of aluminum. On the other side of the heat sink is another heat flow sensor and a piece of 129-gram aluminum block. This aluminum block is used as a reference to reduce the noise signal in this conduction calorimeter.
Figure 1. Calorimeter unit
Heat Sink (Al)
Sample
Al 129 g
Heat Flow Detector (Peltier)
Aluminum sample holder
125 ml plastic cup
Figure 2. Configuration of the calorimeter module
When a sample is placed in the unit, the heat produced by hydration will flow rapidly to its surroundings. The main route for heat exchange between the sample and the surroundings is through the heat flow detector. The heat flow, caused by the temperature difference across the
9
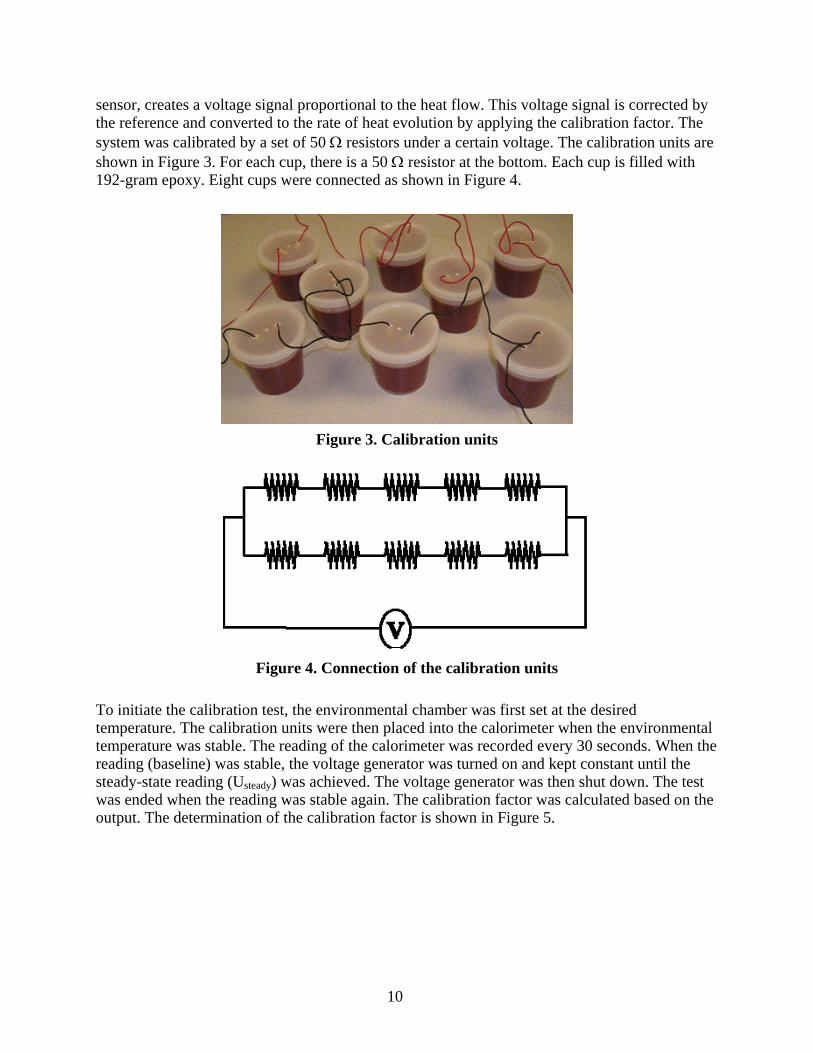
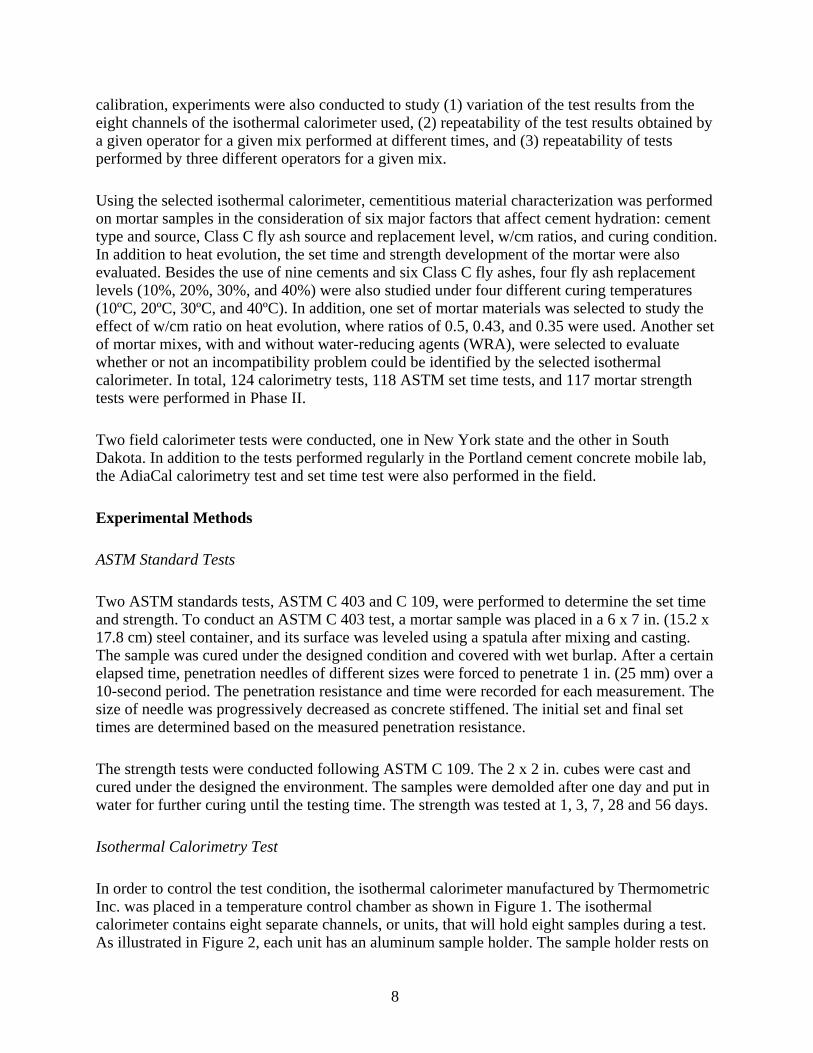
sensor, creates a voltage signal proportional to the heat flow. This voltage signal is corrected by the reference and converted to the rate of heat evolution by applying the calibration factor. The system was calibrated by a set of 50 Ω resistors under a certain voltage. The calibration units are shown in Figure 3. For each cup, there is a 50 Ω resistor at the bottom. Each cup is filled with 192-gram epoxy. Eight cups were connected as shown in Figure 4.
Figure 3. Calibration units
Figure 4. Connection of the calibration units
To initiate the calibration test, the environmental chamber was first set at the desired temperature. The calibration units were then placed into the calorimeter when the environmental temperature was stable. The reading of the calorimeter was recorded every 30 seconds. When the reading (baseline) was stable, the voltage generator was turned on and kept constant until the steady-state reading (Usteady) was achieved. The voltage generator was then shut down. The test was ended when the reading was stable again. The calibration factor was calculated based on the output. The determination of the calibration factor is shown in Figure 5.
10
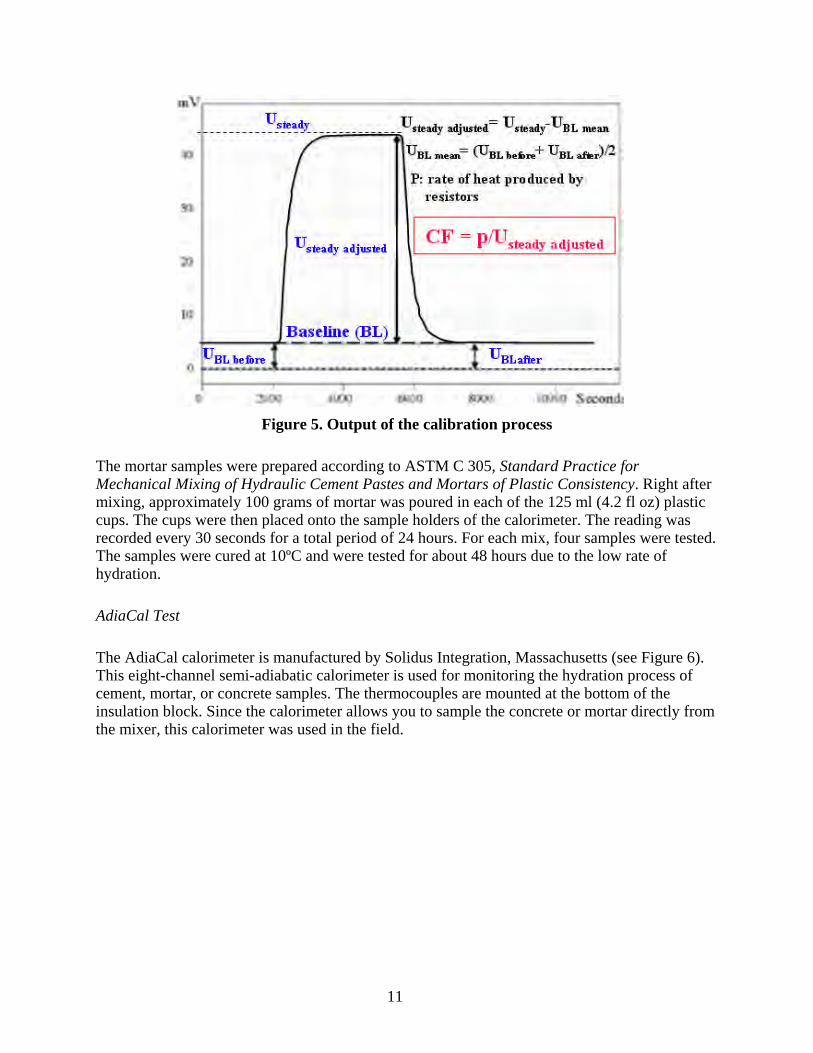
Figure 5. Output of the calibration process
The mortar samples were prepared according to ASTM C 305, Standard Practice for Mechanical Mixing of Hydraulic Cement Pastes and Mortars of Plastic Consistency. Right after mixing, approximately 100 grams of mortar was poured in each of the 125 ml (4.2 fl oz) plastic cups. The cups were then placed onto the sample holders of the calorimeter. The reading was recorded every 30 seconds for a total period of 24 hours. For each mix, four samples were tested. The samples were cured at 10ºC and were tested for about 48 hours due to the low rate of hydration.
AdiaCal Test
The AdiaCal calorimeter is manufactured by Solidus Integration, Massachusetts (see Figure 6). This eight-channel semi-adiabatic calorimeter is used for monitoring the hydration process of cement, mortar, or concrete samples. The thermocouples are mounted at the bottom of the insulation block. Since the calorimeter allows you to sample the concrete or mortar directly from the mixer, this calorimeter was used in the field.
11

Figure 6. AdiaCal calorimeter unit
The thermal setting times can be determined from the measured sample temperature history by two methods—the ASTM-proposed “derivatives” and “fractions” methods. The two methods are defined as the following:
The ‘derivatives’ method defines the initial set time as the time corresponding to the peak of the second derivative of temperature versus time function (see Figure 7). It defines the final set time as the time corresponding to the peak of the first derivative of temperature versus time function (see Figure 8). This method works well for very clean sets of data (no noise or crosstalk), but it is sensitive to any extraneous peaks in the data and to changes in the environment. The ‘fractions’ method defines the initial and final set times as the times corresponding to the temperature reaching the corresponding fractional value of the peak-baseline range (see Figure 9). E.g. if the baseline temperature is 15°C and the temperature peaks at 25°C, and the initial set time fraction is defined as 0.25 and the final fraction is 0.50, then the initial and final set times will be times corresponding to the temperature reaching 17.5°C and 20°C respectively. This method is more robust than the ‘derivatives’ method with respect to environmental changes, crosstalk, and noise, but it is more sensitive to determination of the baseline temperature. (6)
12

Figure 7. Determining initial set time from the derivatives method
Figure 8. Determining final set time from the derivatives method
Figure 9. Determining set times from the fractions method
13

For the field test, ixing station and the right before the paver. The tests were performed in a controlled environment (inside the
ws the results of the calorimetry, set time, and strength tests. The isothermal calorimeter tests include two parts. One is the evaluation of the calorimeter
e pical
ter Test: Equipment Evaluation
rom the eight channels of the isothermal calorimeter. As the figure indicates, the variation between results is very small. In
the 3 x 6 in. concrete samples were collected at two places, the m
ISU mobile lab) and also in the field environment. The temperature was monitored for around 24hours and then analyzed by the software to determine the set times.
LAB TEST RESULTS
The following section sho
performance; another is material characterization. The calorimetry results will be used for thheat index development and concrete performance prediction. In this section, only several tyresults are presented.
Isothermal Calorime
Figure 10 shows the variation of the test results obtained f
terms of the peak value, all results are within 5% variation from the mean value.
Figure 10. Variation for different channels
Figure 11 indicates that th f eight channels before the peak. However, after the peak, the two tests results are almost the same. Figure 12 shows the
ere is a slight difference in the average results o
variation caused by different operators using the same mix. The average results of eight channels from different operators are very close. These results indicate that the new calorimeter test is repeatable and suitable for testing the process of the heat evolution.
14
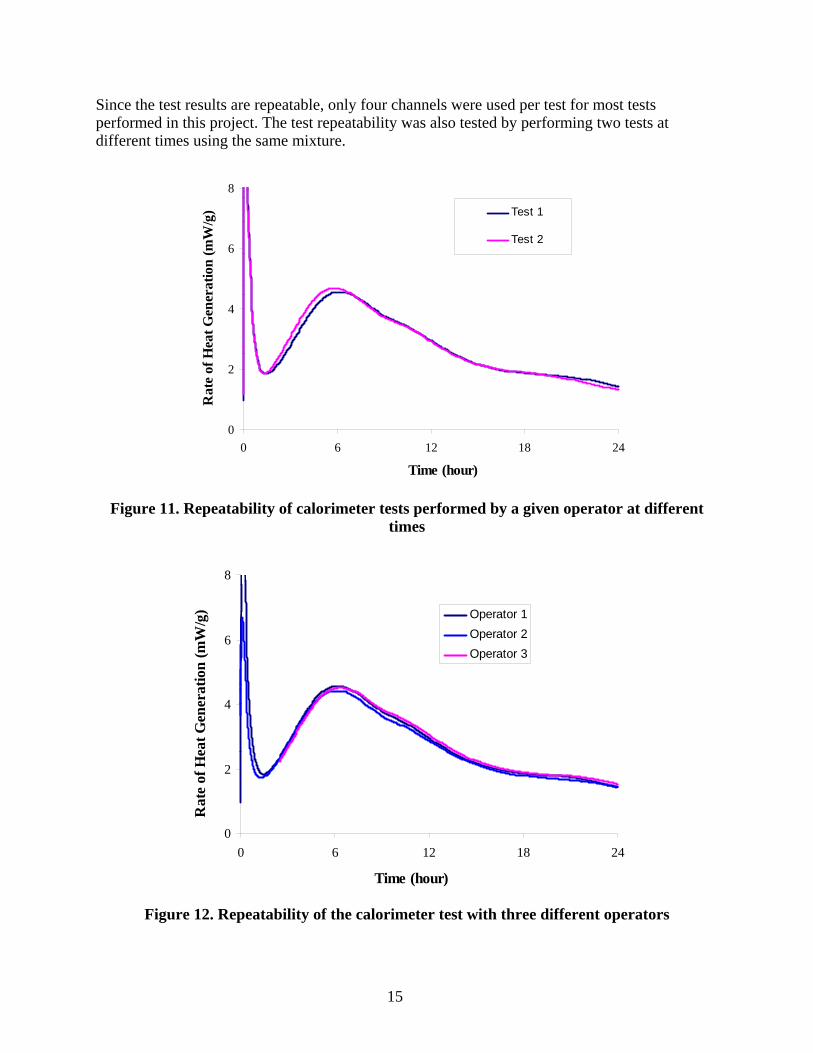
Since the test results are repeatable, only four channels were used per test for most tests performed in this project. The test repeatability was also tested by performing two tests at different times using the same mixture.
0
2
4
6
8
0 6 12 18 24
Time (hour)
Rat
e of
Hea
t Gen
erat
ion
(mW
/g) Test 1
Test 2
Figure 11. Repeatability of calorimeter tests performed by a given operator at different
times
0
2
4
6
8
0 6 12 18 24
Time (hour)
Rat
e of
Hea
t Gen
erat
ion
(mW
/g) Operator 1
Operator 2Operator 3
Figure 12. Repeatability of the calorimeter test with three different operators
15

Isothermal Calorimeter Test: Material Characterization
Effect of the Cement Type and Sources
Figure 13 shows the rate of heat generation for different types of cement. The first peak corresponds to the initial hydration of cement, mainly caused by wetting and by the C3A reaction with gypsum. The second peak corresponds to the primary hydration of cement, mainly caused by the C3S and C2S reactions. The differences among these cements are primarily due to variations in chemical composition and physical properties, which are listed in Table 1. Type I and III cements have similar chemical composition, but Type III cement has much higher fineness. Since hydration occurs at the surface of cement particles and since higher specific area means there is more area in contact with water, finely ground cement will have a higher rate of hydration. Figure 13 shows that the Type III cement has a much higher rate of heat evolution than Type I cement. Type ISM cement is blended cement, which contains 85% Type I cement and 15% slag. The addition of the slag decreases the rate of hydration at early age. The second peak (at approximate 12 hours) is mainly caused by the reaction of slag (7).
8
0
2
0 6 12 18 24Time (hour)
Rat
e of
Hea
t G
Figure 13. Effect of cement type on heat of hydration
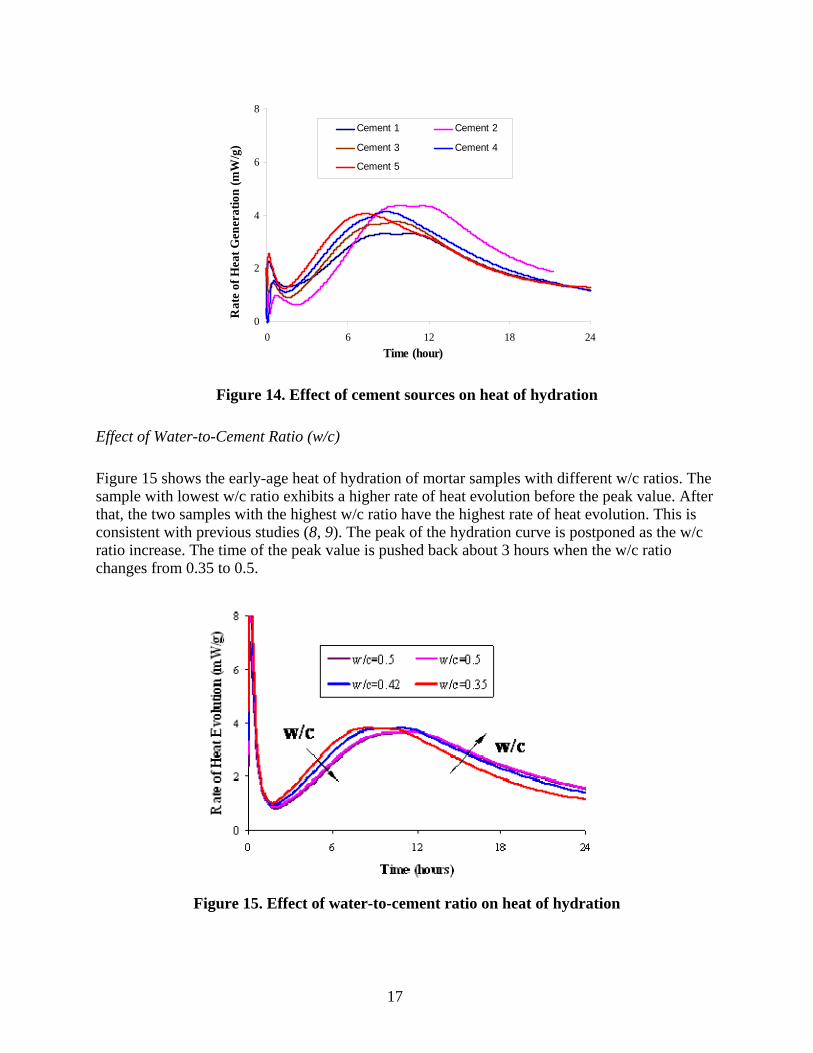
Figure 14 shows the hydration curves for five Type I/II cements from different sources.
4ene
(g) III
I
ents are Type I/II cement, their chemical compositions are different (as shown Table 1), possible due to differences in the raw materials. All five cements have different heat
evolution curves. Cement 2 has the lowest rate of hydration for the first few hours and the highest peak value, which may be caused by the low C3A and high C3S contents, respectively. Figure 14 indicates that the calorimeter is able to identify the cements from different sources.
6mW
/
ISM
ratio
n
Although all cemin
16
17
0
2
4
6
8
0 6 12 18 24Time (hour)
Rat
e of
Hea
t Gen
erat
ion
(mW
/g)
Cement 1 Cement 2
Cement 3 Cement 4
Cement 5
Figure 14. Effect of cement sources on heat of hydration
After
tio increase. The time of the peak value is pushed back about 3 hours when the w/c ratio
hanges from 0.35 to 0.5.
Fig n
Effect of Water-to-Cement Ratio (w/c)
Figure 15 shows the early-age heat of hydration of mortar samples with different w/c ratios. The sample with lowest w/c ratio exhibits a higher rate of heat evolution before the peak value. that, the two samples with the highest w/c ratio have the highest rate of heat evolution. This is consistent with previous studies (8, 9). The peak of the hydration curve is postponed as the w/crac
ure 15. Effect of water-to-cement ratio on heat of hydratio
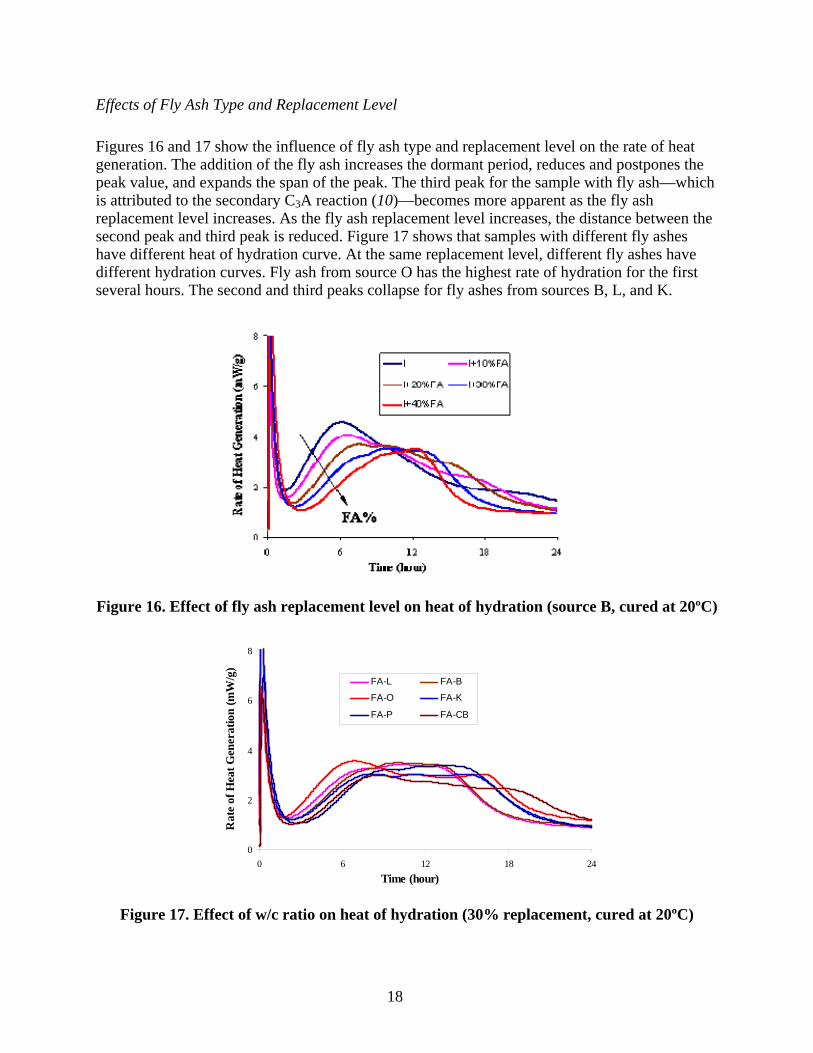
Effects of Fly Ash Type and Replacement Level
h
n the is reduced. Figure 17 shows that samples with different fly ashes
have different heat of hydration curve. At the same replacement level, different fly ashes have different hydration curves. Fly ash from source O has the highest rate of hydration for the first several hours. The second and third peaks collapse for fly ashes from sources B, L, and K.
on heat of hydration (source B, cured at 20ºC)
Figures 16 and 17 show the influence of fly ash type and replacement level on the rate of heat generation. The addition of the fly ash increases the dormant period, reduces and postpones the peak value, and expands the span of the peak. The third peak for the sample with fly ash—whicis attributed to the secondary C3A reaction (10)—becomes more apparent as the fly ash replacement level increases. As the fly ash replacement level increases, the distance betweesecond peak and third peak
Figure 16. Effect of fly ash replacement level
0
2
4
6
8
e of
Hea
t Gen
erat
ion
(mW
/g)
0 6 12 18 24Time (hour)
Rat
FA-L FA-B
FA-O FA-K
FA-P FA-CB
Figure 17. Effect of w/c ratio on heat of hydration (30% replacement, cured at 20ºC)
18
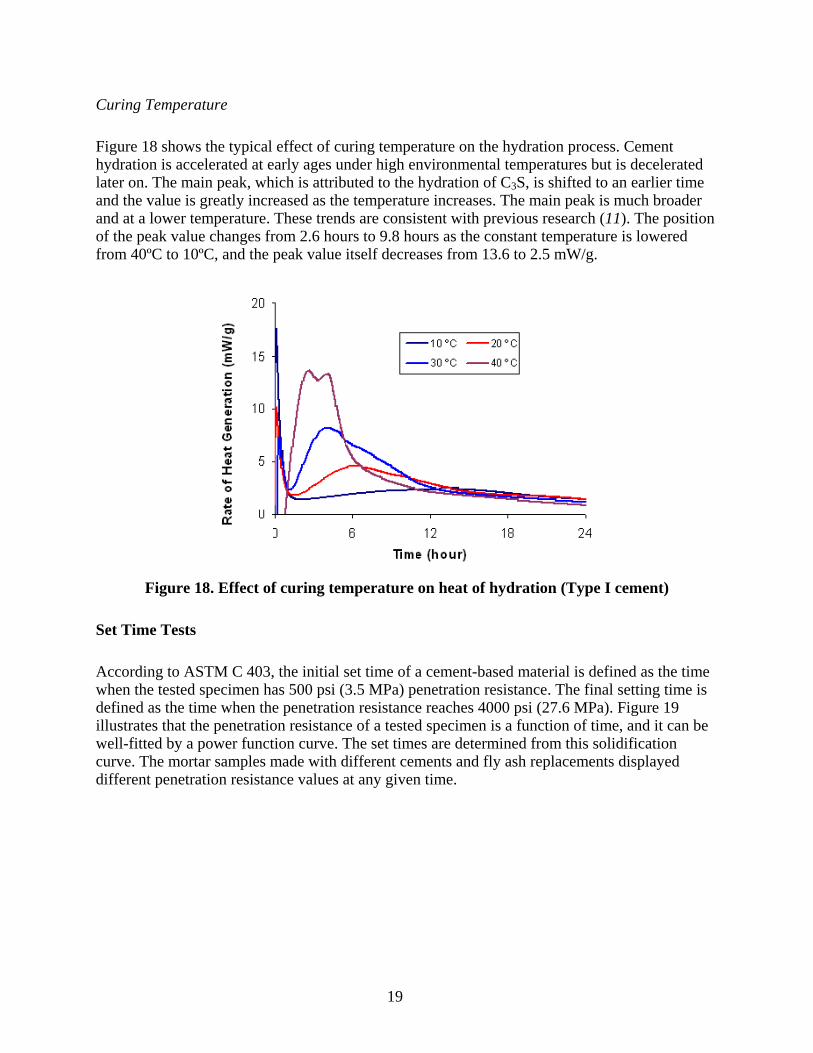
Curing Temperature
Figure 18 shows the typical effect of curing temperature on the hydration process. Cement hydration is accelerated at early ages under high environmental temperatures but is decelerated later on. The main peak, which is attributed to the hydration of C3S, is shifted to an earlier time and the value is greatly increased as the temperature increases. The main peak is much broader and at a lower temperature. These trends are consistent with previous research (11). The position of the peak value changes from 2.6 hours to 9.8 hours as the constant temperature is lowered from 40ºC to 10ºC, and the peak value itself decreases from 13.6 to 2.5 mW/g.
Figure 18. Effect of curing temperature on heat of hydration (Type I cement)
Set Time Tests
According to ASTM C 403, the initial set time of a cement-based material is defined as the time whe s defined as the time when the penetration resistance reaches 4000 psi (27.6 MPa). Figure 19
etration resistance of a tested specimen is a function of time, and it can be unction curve. The set times are determined from this solidification
n the tested specimen has 500 psi (3.5 MPa) penetration resistance. The final setting time i
illustrates that the penwell-fitted by a power fcurve. The mortar samples made with different cements and fly ash replacements displayed different penetration resistance values at any given time.
19

0
1000
2000
3000
4000
5000
6000
0 50 100 150 200 250 300 350 400
Time (Minutes)
Pene
trat
ion
Res
istan
ce (p
si)
I ISM III
Final Set
Initial Set
0
1000
2000
3000
4000
5000
6000
0 50 100 150 200 250 300 350 400 450 500
Time (Minutes)
Pene
trat
ion
Res
istan
ce (p
si)
I I+10%FA-OI+20%FA-O I+30%FA-OI+40%FA-O
Final Set
Initial Set
Figure 19. Determination of set times
Figure 20 show the set timortars made with Type III cement have the lowest initial and final set
higher surface area. Since hydration occurs at the surface of anhydrated cement particles, finely ground cement will have a higher rate of hydration which, in turn, results
n
ut ively. These increases were about 2.6
and 4.1 hours for the Type III cement.
es of different types of cement under different curing conditions. For all curing conditions, mtimes due to their
in shorter set times. Unlike Type III cement, ISM cement has longer set times compared with Type I cement due to slag replacement. At 20ºC, there are 36 and 48 minutes of delay for the initial and final set times, respectively. This is consistent with the research results from Hogaand Meusel, which indicate a 10- to 20-minute delay for each 10% addition of slag (12). The curing temperature has the same effect on the set times for all different mortars. The set times decrease when the curing temperature increases. The set times of Type I cement increase abo3.4 and 5.5 hours for the initial and final set times, respect
III I ISM
40 C30 C
20 C10 C
0
2
4
6
8
10
12
Initi
al S
et T
ime
(hr)
ISMIII I ISM
40 C30 C
20 C10 C
0
2
4
6
8
10
12
Fina
l Se
t Tim
e (h
r)
Figure 20. Effect of cement type and temperature on set times
20

Figure 21 and 22 show the typical effects of fly ash source, fly ash replacement levels, and temperature on concrete set time. The addition of fly ash increased both initial and final set timregardless of curing temperature, which is consistent with previous research results (13, 14The increased set times are due to the hydration retardation effect of fly ash. Set times increase as the temperature decrease. The effect of temperature is more apparent for high fly ash replacement levels. For 40% fly ash (source O), the set times increase 6.3 and 9.3 hours for initial and final set times, respectively, when the set curing temperature decreases from 40ºC to 10ºC. For 10% fly ash replacement level, the set times only increases 4.1 and 6.3 hours for iniand final set times, respectively.
es , 15).
tial
10% 20% 30% 40% 40C
30C
20C
10C
0
2
4
6
8
10
12
10% 20% 30% 40% 40C
30C
20C
10C
0
2
4
6
8
10
12
14 14
Initi
al S
et T
ime
(hr)
Fina
l Se
t Tim
e (h
r)
Figure 21. Effect of fly ash replacement and temperature on set times (source O)
Figure 22 shows that the set times are also different for cements with fly ash from different sources. The ce h cements with other fly ashes. This may be caused by the different chemical composition and physical
ment with fly ash from source O has shorter set times compared wit
properties of each fly ash.
FA-O FA-B FA-L
40 C30 C
20 C10 C
0
2
4
6
FA-O FA-B FA-L
40 C30 C
20 C10 C
0
2
4
8
10
12
Tim
e (h
r
6
8
10
12
l Set
Tim
e (h
rIn
itia
)
Fina
l Se
t)
Figure 22. Effect of fly ash type and temperature on set times
21
22
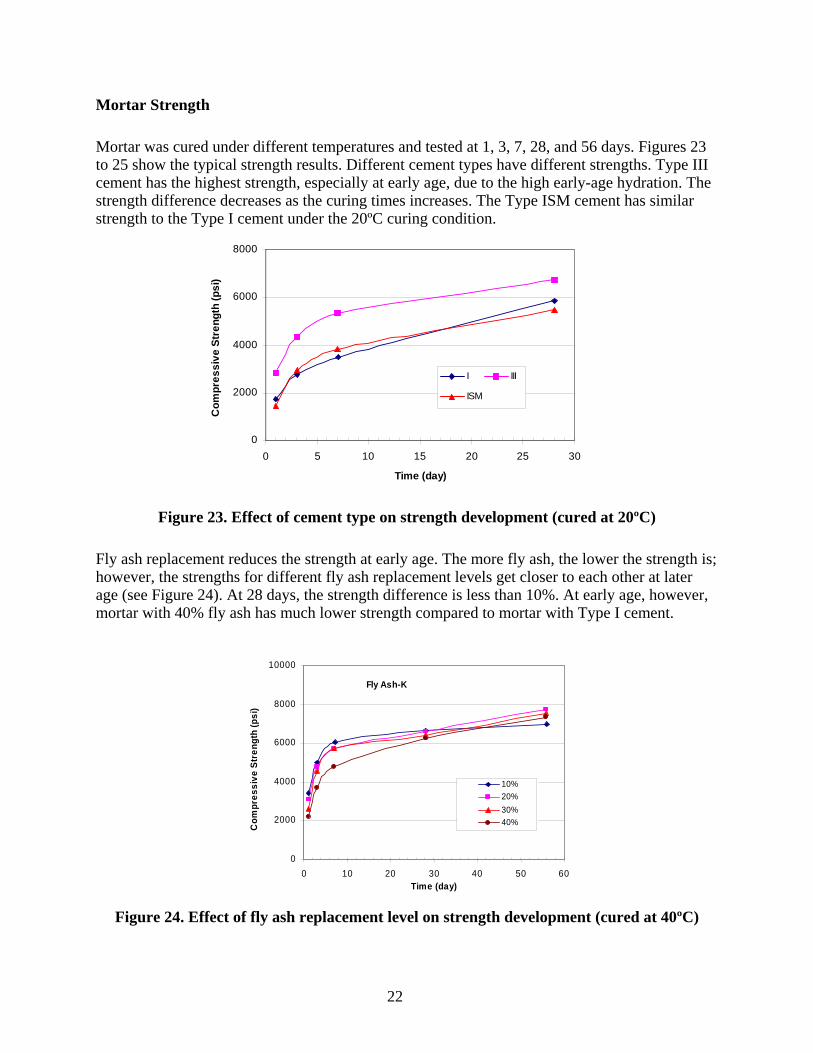
Mortar Strength
Mortar was cured under different temperatures and tested at 1, 3, 7, 28, and 56 days. Figures 23 to 25 show the typical strength results. Different cement types have different strengths. Type III cement has the highest strength, especially at early age, due to the high early-age hydration. The strength difference decreases as the curing times increases. The Type ISM cement has similar strength to the Type I cement under the 20ºC curing condition.
Figure 23. Effect of cement type on strength development (cured at 20ºC)
Fly ash replacement reduces the strength at early age. The more fly ash, the lower the strength is; however, the strengths for different fly ash replacement levels get closer to each other at later age (see Figure 24). At 28 days, the strength difference is less than 10%. At early age, however, mortar with 40% fly ash has much lower strength compared to mortar with Type I cement.
4000
ve S
0
2000
0 10 20 30 40 50 60Time (day)
Com
4000
8000
10000
pres
sive
Str
psi)
6000
engt
h (
10%20%30%40%
Fly Ash-K
Figure 24. Effect of fly ash replacement level on strength development (cured at 40ºC)
0
2000
0
Com
p
6000
8000
5 10 15 20 25 30
Time (day)
ress
itr
engt
h (p
si)
I III
ISM

Mortars made with different types of fly ash have different strengths (see Figure 25). The difference is small for the first 3 days but becomes more apparent at 28 and 56 days. The strength difference is caused by the properties of the different fly ashes.
INTERPRETATION AND APPLICATION OF THE TEST RESULTS
Potential Application of Calorimetry Results
During the second TWG meeting on April 11, 2006, there was a discussion on the importance of the calorimetry test for use in concrete paving projects. To incorporate the results of this project into an implementable and valuable product, it was important to identify the needs that it would fulfill and to assess its viability. This section will precisely identify the applications for a calorimetry test in concrete paving projects.
The TWG identified eight potential techniques, then ranked each one regarding feasibility of use, predictive capability, importance of the value, and competing procedures. The TWG also looked at other critical values that would impact future implementation: assessment steps to gage coresults, strengths and weaknesses of the technique, future steps, and competing procedures.
ons,
• Forecasting time of set • Predicting strength gain
Figure 25. Effect of fly ash type on strength development (cured at 30ºC, 40% replacement)
mplexity and time toward implementation, level of difficulty or complexity in interpreting
The use of calorimetry devices on concrete paving projects can have a number of applicatiincluding the following:
23

• Evaluating risk of thermal cracking • Estimating sawing time and finishing time • Flagging cementitious changes • Identifying materials incompatibility • Verifying mix proportions • Prescreening mix designs and materials
Each of the above applications is briefly described in the sections below.
Forecasting Time of Set
ASTM is currently in the process of developing an ASTM test procedure for determining setting time directly from the heat evolution curve. The derivative of the semi-adiabatic temperature curve is being used to determine setting. The maximum of the first derivative is correlated to final set, and the maximum of the second derivative is correlated to initial set. Although a good
the data. Additional work is being conducted to modify this procedure.
lation of setting io (16). Schindler
recently found a correlation of this type which is related to the ASTM C 403 initial and final set le prediction of set time in the field can only be
accomplished with the use of maturity methods that take into account the concrete temperature in
Various competing test methods are currently available for measuring set time in the laboratory.
.
Similarly, correlations to the degree of hydration and 28-day strength values have been developed for strength gain. Although these models do not provide a true prediction of strength, they provide a good prediction of strength gain under given environmental conditions with the use t strength benchmark value (e.g., strength at 28 days) is known. These relationships of degree of hydration to strength development are valid only for a giv s ion, sufficient curing must be provided to min i
relationship has been found, this test is sensitive to the environment and any extraneous peaks in
In a different approach, a study by Byfors has shown a very reasonable corretime with the degree of hydration and the water-to-cementitious materials rat
times (17). It is important to mention that a reliab
the field and adjust the set time prediction accordingly. The equivalent age concept can be used to predict time of set in the field based on time of set results in the laboratory under standard conditions of temperature via ASTM C 403 or as predicted via degree of hydration. This was demonstrated by Pinto and Hover (18).
Some of these include ASTM C 191 (AASHTO T 131) or ASTM C 266 (AASHTO T 153) for cement paste and the ASTM C 403 for mortar sieved of concrete mixtures. These methods can be similarly complemented with the equivalent age concept to predict set time in the field. However, variations may be expected on the time of set prediction for concrete with both fineand coarse aggregates, due to the structural and thermal properties of the aggregate materials
Predicting Strength Gain
of he maturity concept, provided that a
en et of mix proportions and materials. In additim ze moisture loss.
24
For e tion of strength gain can be currently obtained with the use of the gth predictions with the maturity method can also be complemented with match curing to get a more reliable prediction of concrete strength in
al Cracking
known that cement characteristics may vary from one cement plant to another and that there are even significant
f
me
h to support sawing equipment without raveling and ends when excessive stresses develop that
cking if saw cutting has not been completed by then. Experienced contractors typically rely on the scratch test to determine sawing windows.
s
hanges
ise pavement performance. The heat evolution test can flag cementitious changes
th competing methods, predicASTM C 1074 maturity test procedure. Stren
the field.
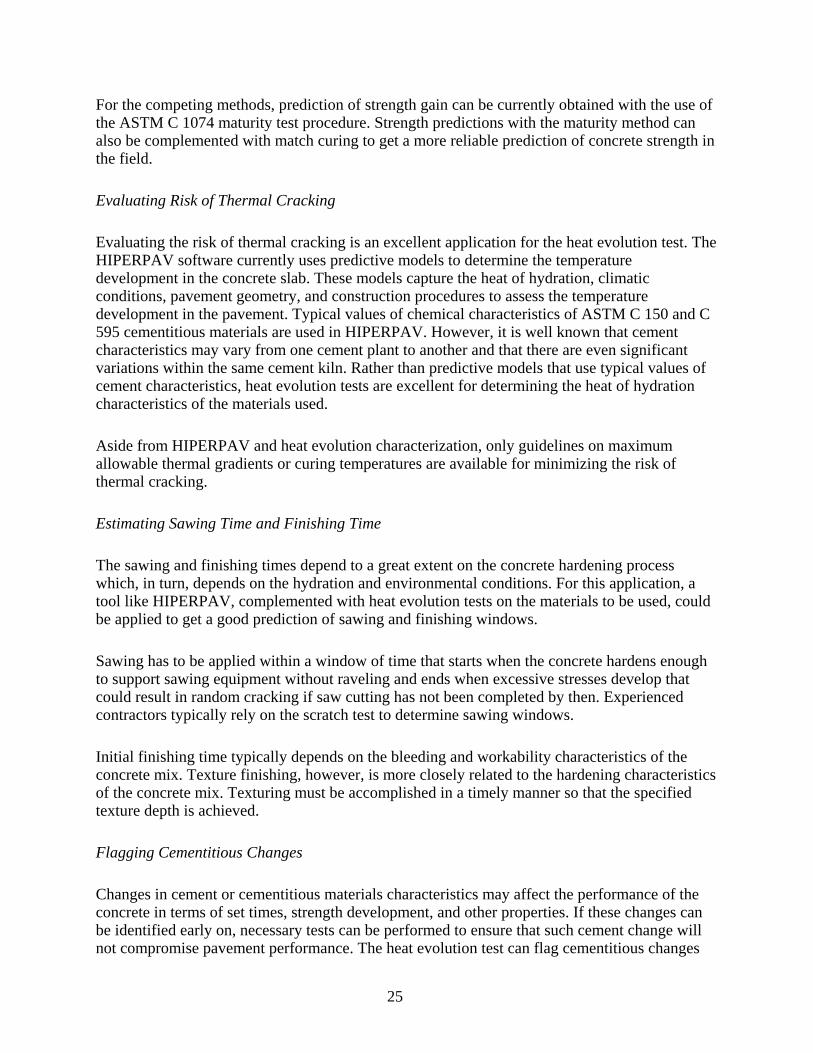
Evaluating Risk of Therm
Evaluating the risk of thermal cracking is an excellent application for the heat evolution test. The HIPERPAV software currently uses predictive models to determine the temperature development in the concrete slab. These models capture the heat of hydration, climatic conditions, pavement geometry, and construction procedures to assess the temperature development in the pavement. Typical values of chemical characteristics of ASTM C 150 and C 595 cementitious materials are used in HIPERPAV. However, it is well
variations within the same cement kiln. Rather than predictive models that use typical values ocement characteristics, heat evolution tests are excellent for determining the heat of hydration characteristics of the materials used.
Aside from HIPERPAV and heat evolution characterization, only guidelines on maximum allowable thermal gradients or curing temperatures are available for minimizing the risk of thermal cracking.
Estimating Sawing Time and Finishing Ti
The sawing and finishing times depend to a great extent on the concrete hardening process which, in turn, depends on the hydration and environmental conditions. For this application, a tool like HIPERPAV, complemented with heat evolution tests on the materials to be used, couldbe applied to get a good prediction of sawing and finishing windows.
Sawing has to be applied within a window of time that starts when the concrete hardens enoug
could result in random cra
Initial finishing time typically depends on the bleeding and workability characteristics of the concrete mix. Texture finishing, however, is more closely related to the hardening characteristicof the concrete mix. Texturing must be accomplished in a timely manner so that the specified texture depth is achieved.
Flagging Cementitious C
Changes in cement or cementitious materials characteristics may affect the performance of the concrete in terms of set times, strength development, and other properties. If these changes can be identified early on, necessary tests can be performed to ensure that such cement change will not comprom
25

by allowing comparison of the heat development with that of a reference set of materials. If the heat development curve is significantly different, more detailed testing would be warranted to
ing
e incompatibility problems are accentuated under the here
patibility is related to mended tests include set time, heat evolution,
mini-slump/concrete slump loss, rheology, stiffening (ASTM C 359), strength development, ring
h
roperties later on in a construction project.
rtions will result in a change in the unit weight.
terials
.
ensure that pavement performance is not compromised.
For the competing methods, calorimetry and time of set tests are currently used for flaggcement changes.
Identifying Materials Incompatibility
Similar to the above application, testing materials for incompatibility can be accomplished by performing a calorimetry test. By comparing the resulting heat curve with that of a typical mix, compatibility problems may be identified. Somspecific environmental conditions; therefore, for this application, it is necessary to performheat evolution test under a similar temperature regimen as that experienced on the project wthe materials will be used.
Different tests have been identified, depending on whether incomstiffening, air void system, or cracking. Recom
test, foam index, foam drainage, air void analyzer, hardened air, and clustering.
Verifying Mix Proportions
During normal concrete production, one is likely to encounter variations in concrete mix proportions due to the inherent variability of aggregate properties (e.g., moisture content and specific gravity). The calorimetry test may be able to capture significant variations in concreteproportions that can result from using varying amounts of cementitious materials in each batcof concrete. Such variations may result in undesirable changes in concrete p
In addition to the calorimetry test, a unit weight test is used for verifying mix proportions. This method assumes that, given the different specific gravities of concrete constituents, any significant change in propo
Prescreening Mix Designs and Ma
Although a given cement or cementitious material may be a good option under a given set of environmental conditions, it may not be ideal under different conditions. The calorimetry test may be helpful at the mix design level to characterize mixtures suitable for a specific applicationIn this way, materials can be prescreened for different seasons of the year or different environmental conditions. No alternate method to heat evolution testing was identified for prescreening of mix designs and materials.
26

27
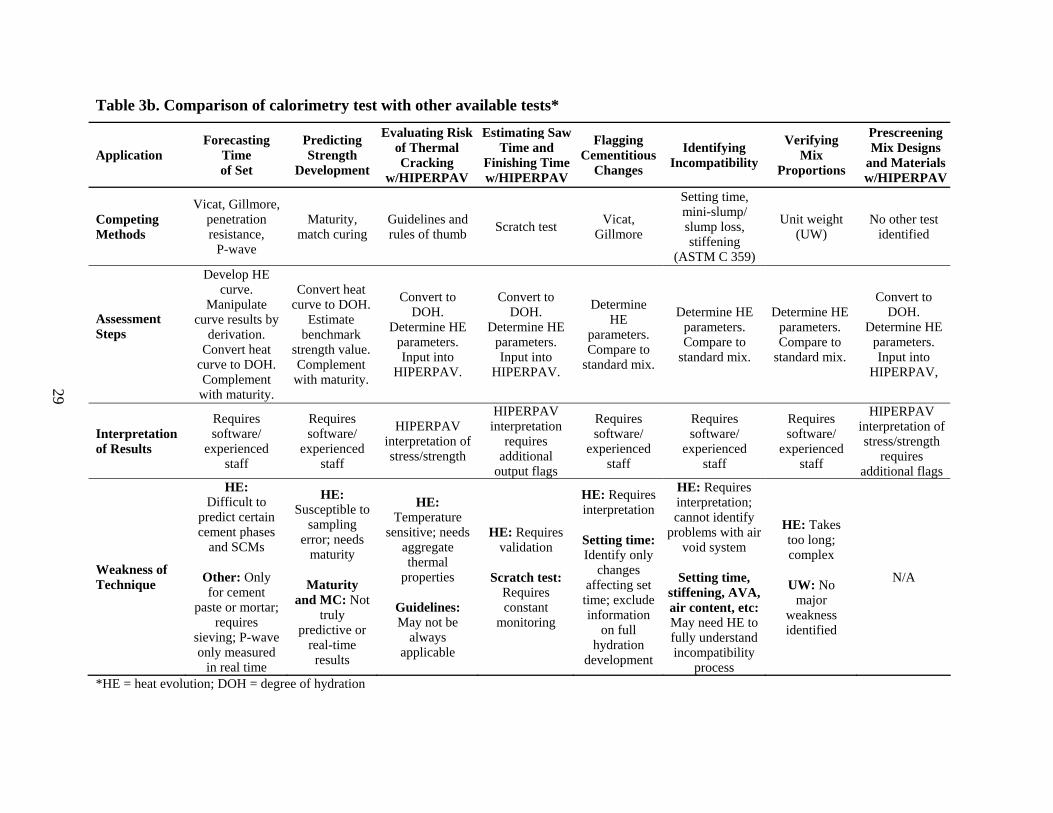
a were identified that need to be evaluated in order to determine how likely it is this test could be implemented into concrete paving practice (see Tables 3a and 3b). These
.e., steps that need to be followed for any given application that would help in comparing this test to other currently available techniques in terms of
During the last TWG meeting, the above applications of the heat evolution test were discussed, and several criteri
criteria included the following:
• Feasibility of predictions (i.e., how capable the heat evolution test is of being successfully used for a given application in the concrete paving industry)
• Importance (i.e., how valuable or useful it would prove to paving contractors) • Competing procedures (i.e., other tests or procedures that are currently being used or that
could be used for such applications) • Assessments steps (i
complexity, practicality, etc.) • Interpretation of results • Weaknesses of technique • Future steps
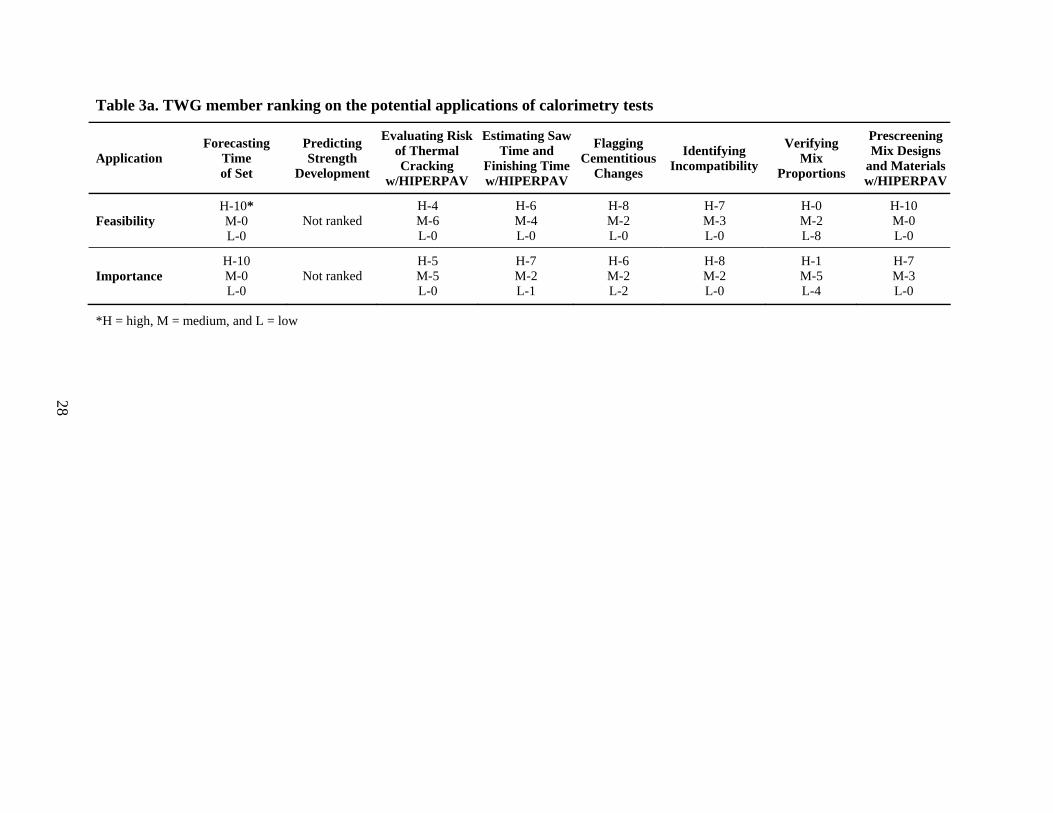
Table 3a. TWG member ranking on the potential applications of calorimetry tests
Application Forecasting
Time of Set
Predicting Strength
Development
Evaluating Riskof Thermal Cracking
w/HIPERPAV
Estimatin Prescreening DesiateER
g Saw Time and
Finishing Timew/HIPERPAV
Flagging Cementitious
Changes
IdentifyingIncompatibil
Verifying Mix and Mw/HIP
gns rialsPAV
ity M
opix
ortions Pr
Feasibility H-10* M-0 L-0
Not ranked H-4 M-6 L-0
H-6 M-4 L-0
H-8 M-2 L-0
H-7 M-3 L-0
HML
-10 -0 -0
HML
-0 -2 -8
HML
-7 -3 -0
HML
-1 -5 -4
Importance H-10 M-0 L-0
Not ranked H-5 M-5 L-0
H-7 M-2 L-1
H-6 M-2 L-2
H-8 M-2 L-0
*H = high, M = medium, and L = low
28
Applica
Table 3b. Comparison of calorimetry test with other available tests*
tion Forecasting
Time of Set
Predicting Strength
Development
Evaluating Riskof Thermal Cracking
w/HIPERPAV
Estimating Saw Time and
Finishing Timew/HIPERPAV
Flagging Cementitious
Changes
Identifying Incompatibility
Verifying Mix
Proportions
Prescreening Mix Designs
and Materialsw/HIPERPAV
Competing Vica ore,
p on Guid and rules umb Scr est G e
Setting time, min mp/ slu ss, sti ng
(AST 359)
No est id d Methods
t, Gillmenetrati
resistance, P-wave
Maturity, match curing
elines of th atch t Vicat,
i rllmo
i-slump loffeniM C
Unit weight (UW)
other tentifie
Assessment
De HE
Ma ate
Convert heat curve to DOH. Complement
with maturity.
curve to DOH. Estimate
benchmark strength value. Complement
with maturity.
Co to DOH.
Determine HE parameters. Input into
HIPERPAV.
Co to DOH.
Determine HE parameters. Input into
HIPERPAV.
ine HE
parameters. Compare to
standard mix.
Determine HE parameters. Compare to
standard mix.
Determine HE parameters. Compare to
standard mix.
Co to DOH.
Determine HE parameters. Input into
HIPERPAV,
Steps curve results by
derivation.
velop curve. nipul
Convert heat nvert nvert Determ nvert
Interpretation of Results
Requires software/
experienced staff
Requires software/
experienced staff
HIPERPAV interpretation of stress/strength
HIPERPAV interpretation
requires additional
output flags
Requires software/
experienced staff
Requires software/
experienced staff
Requires software/
experienced staff
HIPERPAV interpretation of stress/strength
requires additional flags
Weakness of Technique
HE: Difficult to
predict certain cement phases
and SCMs
Other: Only for cement
paste or mortar; requires
sieving; P-wave only measured
in real time
HE: Susceptible to
sampling error; needs
maturity
Maturity and MC: Not
truly predictive or
real-time results
HE: Temperature
sensitive; needs aggregate thermal
properties
Guidelines: May not be
always applicable
HE: Requires validation
Scratch test:
Requires constant
monitoring
HE: Requires interpretation
Setting time: Identify only
changes affecting set time; exclude information
on full hydration
development
HE: Requires interpretation; cannot identify
problems with air void system
Setting time,
stiffening, AVA, air content, etc:May need HE to fully understand incompatibility
process
HE: Takes too long; complex
UW: No
major weakness identified
N/A
*HE = heat evolution; DOH = degree of hydration
29

Calorimeter Test Result Interpretation: Heat Index Development
After a calorimet surem portant for engineers to interpret the meaning of the heat evolution curve correctly and effectively. In this project, heat indexes were established to help engineers interpret the calorimconcrete performance and can also be used for concrete quality control. The typical heat evolution curves have been presented above (see also Figure 26a). In order to describe the heat evolution curve, six parameters es) w ed. T ude four areas (A1–A4) underneath the heat evolution curve (see Figure 26a) and two points on the heat derivative curves, which correspond to initial and final set times of the tested materials (see Figure 26b).
er mea ent, it is very im
eter results. These heat indexes can also be used to predict
(heat index ere develop hese parameters incl
30
00
2
4
6
8
6 12 24
e (hour)
of H
eat G
ener
atio
n (m
W/g
)
18
Tim
Rat
e
A1 A2 A3 A4
(a)
-1.0
-0.8
-0.
0
6
-0.
0.4
0.6
6 18 2
4
-0.2
0.0
0.2
0.8
1.0
12
F
4
Time (hour)
d(q)
/d(t
)
irst Derivative
Initial Set
Fina Setl
(b) Figu 2 men heat
th evolu hea ed du d sents e ted hours 1 to 6. The data prior to 1 hour is not used, because the
rimeter system needs a certain tim ch equilibrium status after the sample is loaded. a e he erate 2 3 is 12 , 4rs
heat i xes of initial set and final set times are determine the firs ri ive o e t evolution e. Setting of c rete nsition period be the flui g e , 19). C g its th siel th ent ra dc often rize y (10 tcrete set time from a heat of cement hydration curve.
m a e when c hydration duct hich i surround idual cemen icles, start to fo etwork (19). This esp s to th ning of a temperature rise in concrete that follows the dorma
re 6. Develop
tion curve is the
t of the
t generat
indexes
ring the perioThethe caloArehou
Theheastagdevhydwhicon
Froprocorr
arheat
ea under g nera
e heat from
. A1 repre
e to read between 6 and 1 A2 is th
.
nde
at gen hours, A –18 hours
d from
and A is 18–2
t de vat
4
f thidity
re ems,
nt
curvoncret
at invoucts (20characte
onc is a trattin behavior is contr new phase growth, nuhese processes are gred b its heat evolution
tweenree-dimen
ercolation, an to the cemen
ore, it is ra
dity and rional microstructu networking of c
t hydration procesional to determine
s (1opmtion
h is
e selves). T
olled by cleation, patly related
). Theref
ent pro
d
microscopic point of view, concrete initial set is the tims, wond
emrm
ent a nnitially
e begin in ra
divpid
t part

period (1). Concrete final set is the time when a primary network of hydration products has developed (19). It may relate to the time the concrete heat evolution reaches its maximum rate
k
ortar
the fastest. After the initial set time, the first derivative value starts to decrease. The time when the first derivative becomes zero is defined as the final set. This point corresponds to the time when the highest rate of hydration is achieved in the original heat evolution curve.
When fly ash is added, both the calorimetry result and its first derivative curve could change. Figure 27 shows the determination of the set time of the sample with 40% fly ash replacement. As seen in the figure, the initial set is still defined as the time when the first derivative curve reaches its highest value. It is noted that the first derivative also decreases after the initial set time. Differently from Figure 26, however, the first derivative of the rate of heat generation of the sample with fly ash starts to increase again before descending to zero. In order to determine the final set under this situation, the line A in Figure 27 is extended to cross with the x-axis. This intersecting point is defined as the final set time.
during the acceleration period, which corresponds to the approximate midpoint of the major peahydration process (1).
Figure 26 demonstrates the proposed approach for determining the set time of the tested mfrom a calorimetry test. This method is similar to the derivatives method for the AdiaCal calorimeter. The first derivative of the calorimetry results, d(q)/dt, is derived from the original heat evolution data. In this study, the initial set time is defined as the time when the first derivative curve reaches its highest value. At this point, the increase in the rate of heat generation is
-0.60
2
0
Rat
e of
Hea
t G
4
6
8
6 12 18 24Time (hour)
ener
atio
n (m
W/g
)
A1 A2 A3 A4
-0.4
-0.2
d(q) 0.0
0.4
0.6
0 6 12 18 24Time (hour)
/d
0.2
(t)
AFirst Derivative
Initial Set
Final Set
index to achieve these potential applications.
Figure 27. Development of heat indexes for mortar containing fly ash
Application of the Heat Indexes and Calorimeter Results
The above sections state the potential applications of the calorimeter test and the heat index development. This section will explain how to use the heat
31

Prediction of Set Time
Prediction of set times was rated high in importance and feasibility by the TAC members at the meeting. The two parameters of the indexes (initial and final set times) are used to predict the set times. Since the set times are being tested by the ASTM standard, these results are used to
from
:
microstructure development. • The two test methods provide test samples with different environmental/temperature
conditions. During the ASTM C 403 tests, mortar samples in a 6 x 7 in. container were tested under a room-temperature condition. Due to the semi-adiabatic effect, the temperature of the tested samples increased with time. However, during the calorimetry tests, the samples were in a controlled-environment condition. The temperature of the samples was kept constant. Therefore, the final set from the calorimeter results could be longer than the ASTM results.
validate the set times predicted from the calorimeters. The set times obtained from ASTM C 403and calorimetry tests are plotted in Figure 28, demonstrating that the set times determinedthe calorimeter method have good relationship with the times determined by ASTM methods.
For the initial set times, the calorimetry tests results are slightly lower than the ASTM results, especially for the materials that have a long set time. However, there is a clear linear relationship, with an R2 value of 0.95. The set times determined at 20ºC, 30ºC, and 40ºC are closer to the ASTM times than are the results at 10ºC.
Conversely, Figure 28b shows that almost all points are above the equality line, indicating that the final setting determined by the calorimetry method is a little higher than that of the ASTM method. However, there is a good linear relationship (with an R2 value of 0.96) between thesetwo test results. The differences between the two test results may result from two primary facts
• The two methods have very different definitions for concrete set time. The ASTM C 403 method is based on the penetration force, and the calorimetry method is based on the
32
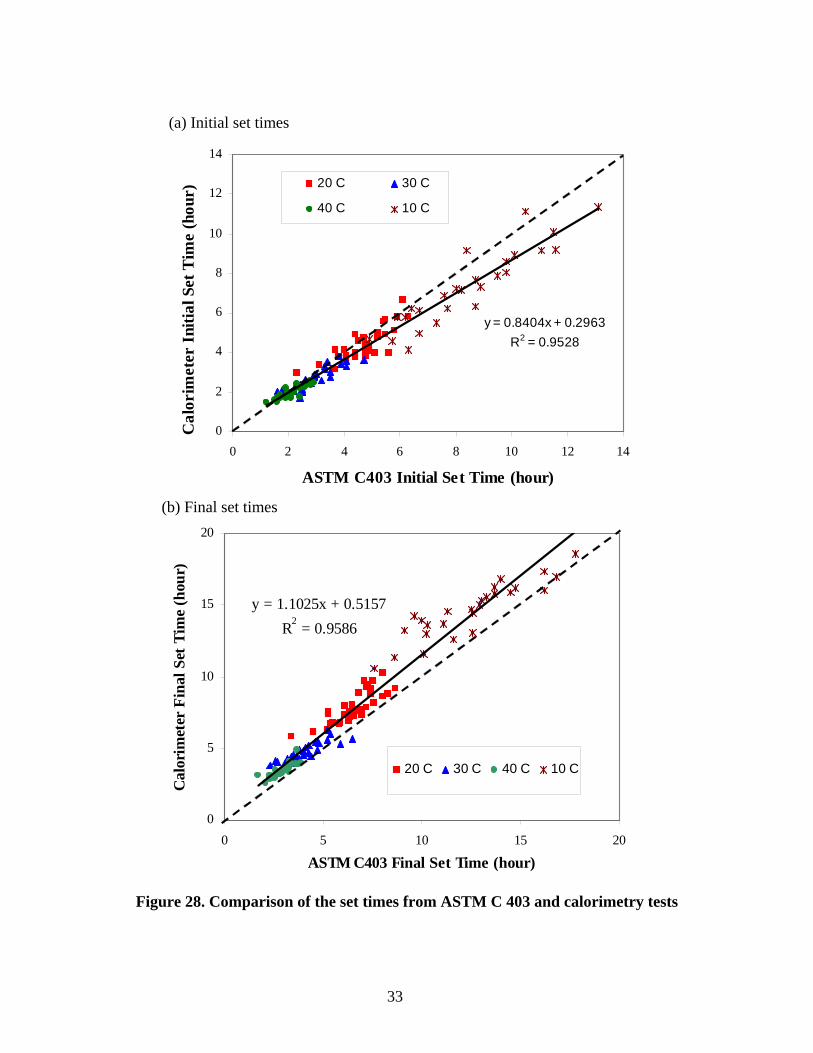
(a) Initial set times
Figure 28. Comparison of the set times from ASTM C 403 and calorimetry tests
(b) Final set times
y = 1.1025x + 0.5157R2 = 0.9586
15
20
Tim
e (h
our)
0
5
10
0 5 10 15 20
ASTM C403 Final Set Time (hour)
Cal
orim
eter
Fin
al S
et
20 C 30 C 40 C 10 C
y = 1.1025x + 0.5157R2 = 0.9586
15
20
Tim
e (h
our)
0
5
10
0 5 10 15 20
ASTM C403 Final Set Time (hour)
Cal
orim
eter
Fin
al S
et
20 C 30 C 40 C 10 C
10
12
14
me
(hou
r)
y = 0.8404x + 0.29636
8
Ini
tial S
et T
R2 = 0.95284
0 2 4 6 8 10 12 14
eri
0
2
Cal
orim
et
ASTM C403 Initial Set Time (hour)
20 C 30 C
40 C 10 C
10
12
14
me
(hou
r)
y = 0.8404x + 0.29636
8
Ini
tial S
et T
R2 = 0.95284
0 2 4 6 8 10 12 14
eri
20 C 30 C
40 C 10 C
0
2
Cal
orim
et
ASTM C403 Initial Set Time (hour)
33
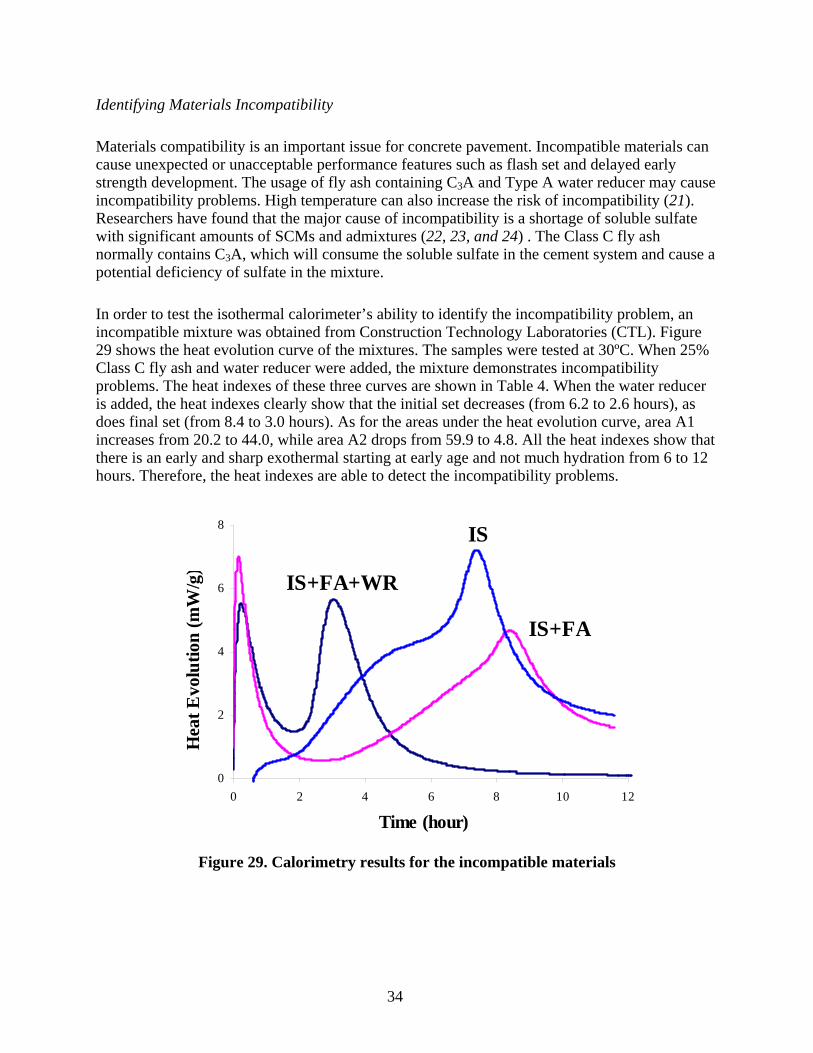
Identifying Materials Incompatibility
Materials compatibility is an important issue for concrete pavement. Incompatible materials can cause unexpected or unacceptable performance features such as flash set and delayed early strength development. The usage of fly ash containing C3A and Type A water reducer may cause incompatibility problems. High temperature can also increase the risk of incompatibility (21). Researchers have found that the major cause of incompatibility is a shortage of soluble sulfate with significant amounts of SCMs and admixtures (22, 23, and 24) . The Class C fly ash normally contains C3A, which will consume the soluble sulfate in the cement system and cause a potential deficiency of sulfate in the mixture.
In order to test the isothermal calorimeter’s ability to identify the incompatibility problem, an incompatible mixture was obtained from Construction Technology Laboratories (CTL). Figure 29 shows the heat evolution curve of the mixtures. The samples were tested at 30ºC. When 25% Class C fly ash and water reducer were added, the mixture demonstrates incompatibility problems. The heat indexes of these three curves are shown in Table 4. When the water reducer is added, the heat indexes clearly show that the initial set decreases (from 6.2 to 2.6 hours), as does final set (from 8.4 to 3.0 hours). As for the areas under the heat evolution curve, area A1 increases from 20.2 to 44.0, while area A2 drops from 59.9 to 4.8. All the heat indexes show that there is an early and sharp exothermal starting at early age and not much hydration from 6 to 12 hours. Therefore, the heat indexes are able to detect the incompatibility problems.
0
2
4
6
8
0 2 4 6 8 10
Time (hour)
Hea
t Evo
lutio
n (m
W/g
12
)
IS
IS+FA
IS+FA+WR
Figure 29. Calorimetry results for the incompatible materials
34
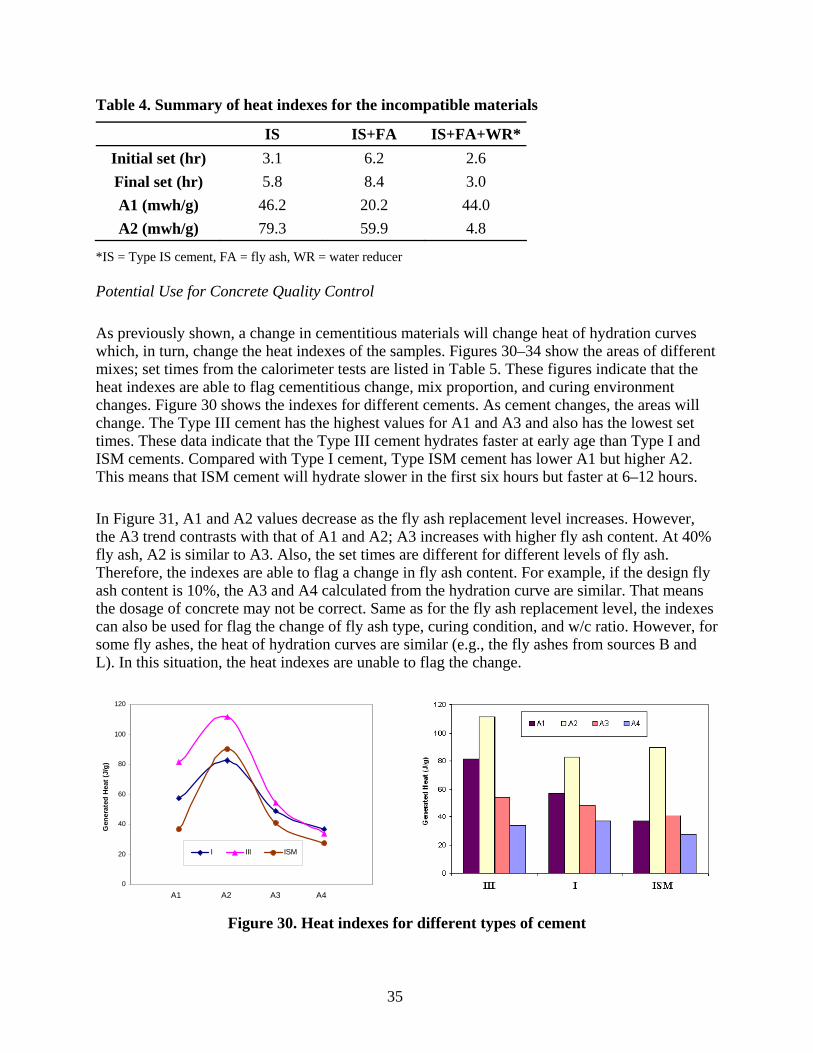
Table 4. Summary of heat indexes for the incompatible materials
IS IS+FA IS+FA+WR*Initial set (hr) 3.1 6.2 2.6 Final set (hr) 5.8 8.4 3.0 A1 (mwh/g) 46.2 20.2 44.0 A2 (mwh/g) 79.3 59.9 4.8
*IS = Type IS cement, FA = fly ash, WR = water reducer Potential Use for Concrete Quality Control
t the
–12 hours.
In Figure 31, A1 and A2 values decrease as the fly ash replacement level increases. However, the A3 trend contrasts with that of A1 and A2; A3 increases with higher fly ash content. At 40% fly ash, A2 is similar to A3. Also, the set times are different for different levels of fly ash. Therefore, the indexes are able to flag a change in fly ash content. For example, if the design fly ash content is 10%, the A3 and A4 calculated from the hydration curve are similar. That means the dosage of concrete may not be correct. Same as for the fly ash replacement level, the indexes can also be used for flag the change of fly ash type, curing condition, and w/c ratio. However, for some fly ashes, the heat of hydration curves are similar (e.g., the fly ashes from sources B and L). In this situation, the heat indexes are unable to flag the change.
Figure 30. Heat indexes for different types of cement
As previously shown, a change in cementitious materials will change heat of hydration curves which, in turn, change the heat indexes of the samples. Figures 30–34 show the areas of different mixes; set times from the calorimeter tests are listed in Table 5. These figures indicate thaheat indexes are able to flag cementitious change, mix proportion, and curing environment changes. Figure 30 shows the indexes for different cements. As cement changes, the areas will change. The Type III cement has the highest values for A1 and A3 and also has the lowest set times. These data indicate that the Type III cement hydrates faster at early age than Type I and ISM cements. Compared with Type I cement, Type ISM cement has lower A1 but higher A2. This means that ISM cement will hydrate slower in the first six hours but faster at 6
0
20
40
60
80
100
120
Gen
erat
ed H
eat (
J/g)
I III ISM
A1 A2 A3 A4
35

Figure 33. Heat indexes for samples w
100100
A1 A2 A3 A4
20
80
Gen
erat
ed H
eat (
J/g
)
80
0
20
40
60
I+10% FA-O I+20% FA-O I+30% FA-O I+40% FA-O
Gen
erat
ed H
eat (
J/g
)
40
60
I+10% FA-O I+20% FA-O
I+30% FA-O I+40% FA-O
0
A1 A2 A3 A4
Figure 31. Heat indexes for samples with different fly ash replacement levels
Figure 32. Heat indexes for samples with different fly ashes
40
60
80
100
erat
ed H
eat (
J/g
)
40
60
80
100
rate
d H
eat (
J/g
)
Gen
A1 A2 A3 A4
ene
0
20
G
I+30% FA-L I+30% FA-B
I+30% FA-O I+30% FA-K
A1 A2 A3 A4
0
20
I+30% FA-L I+30% FA-B I+30% FA-O I+30% FA-K
ith different w/c ratios
0
20
40
60
80
0.5 0.5 0.42 0.35
Gen
erat
ed H
eat (
J/g
)
100
A1 A2
100
A3 A4
0
20
40
60
80
Gen
erat
ed H
eat (
J/g
)
0.5 0.5
0.42 0.35
A1 A2 A3 A4
36

Figure 34. Heat indexes for samples under different curing conditions
Table 5. Summary of heat indexes (initial and final set) for different materials
Cement Type
0
50
100
150
200
10 C 20 C 30 C 40 C
Gen
erat
ed H
eat (
J/g
)
0
50
100
150
200G
ener
ated
Hea
t ( J
/g)
10 C 20 C A1 A2 A3 A4
Factor Being Evaluated I III ISM * Initial set (hr) 3.4 3.0 3.2 Final set (hr) 6.2 5.9 7.6
FA content 10% FA 20% FA 30% FA 40% FA Initial set (hr) 3.2 3.9 3.8 4.1 Final set (hr) 6.3 6.7 6.9 7.3
FA type L B O K Initial set (hr) 4.4 4.7 3.8 4.9 Final set (hr) 7.7 8.0 6.9 8.2
W/c 0.5 0.5 0.42 0.35 Initial set (hr) 5.2 5.2 4.8 4.6 Final set (hr) 11.6 11.6 9.3 8.5
Curing temp (ºC) 10 20 30 40 Initial set (hr) 4.6 3.4 2.1 1.7 Final set (hr) 9.8 6.2 4.0 2.6
*The gap in the table is due to the fact that only three types of cement were studied. Prediction of Early-Age Strength
Strength is related to the hydration of the cementitious materials. Correlations between the degree of hydration and 28-day strength have been developed. Since the degree of hydration could be estimat ength from the generated heat. Figure 35 shows the strength and generated heat for mortar samples up to two days. It indicates there is a linear relationship between the generated heat and strength. Together with other software, which is able to calculate the heat generation under the field condition, the heat of hydration curve can be used to predict the strength and saw cutting time.
ed from the heat of hydration curve, it is possible to predict the str
30 C 40 C
A1 A2 A3 A4
37
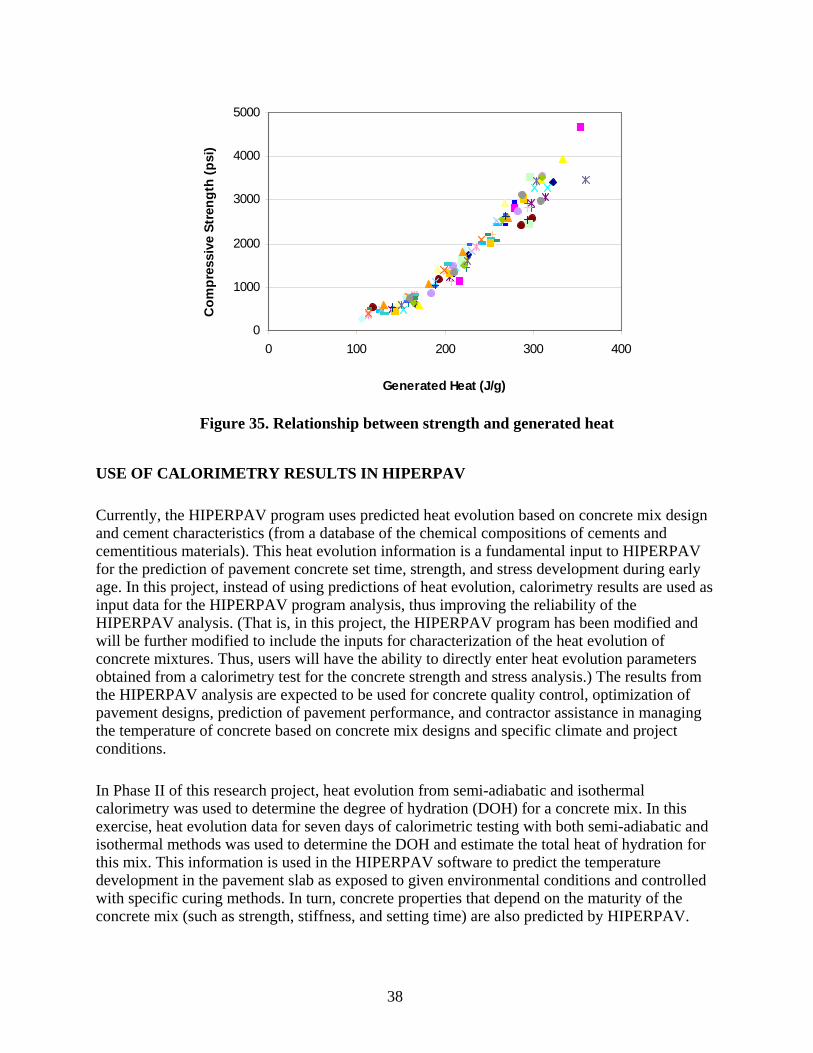
Figure 35. Relationship between strength and generated heat
U RIME RESULTS HIPERPAV
Currently, the HIPERPAV program uses predicted heat evolution based on concrete mix design a acterist rom a database of the chemical compositions of cements and
us materials). This heat evolution information is a fundamental input to HIPERPAV of pav nt concrete set time, strength, and stress development during early
age. In this project, instead of using predictions of heat evolution, calorim esults are used as input data for the HIPERPAV program analysis, thus improving the reliability of the
RPAV analysis. (T s, in this pr , the HIPERPAV program has been modified and will be further modified to include the inputs for characterization of the heat evolution of c es. Thu s will hav bility to dir enter heat e tion parameters o calorim est for the ete strength stress analys he results from
lysis expected to used for concrete quality control, optimization of p s, pred of paveme rformance, and contractor assistance in managing th of conc ased on co e mix design specific cli and project conditions.
, heat evolution from semi-adiabatic and isothermal the degree of hydration (DOH) for a concrete mix. In this
exercise, heat evolution data for seven days of calorimetric testing with both semi-adiabatic and for
0
C
1000
2000
3000
4000
5000
0 100 200 300 400
(J/g)
ompr
essi
ve S
tren
gth
(psi
)
Generated Heat
SE OF CALO TRY IN
nd cement char ics (fcementitiofor the prediction eme
etry r
HIPE hat i oject
oncrete mixturbtained from a
s, useretry t
e the a concr
ectly and
voluis.) T
the HIPERPAV ana are be avement design iction nt pee temperature rete b ncret s and mate
In Phase II of this research projectcalorimetry was used to determine
isothermal methods was used to determine the DOH and estimate the total heat of hydrationthis mix. This information is used in the HIPERPAV software to predict the temperature development in the pavement slab as exposed to given environmental conditions and controlled with specific curing methods. In turn, concrete properties that depend on the maturity of the concrete mix (such as strength, stiffness, and setting time) are also predicted by HIPERPAV.
38
The objectives of this work were to
• evaluate DOH with semi-adiabatic versus isothermal test results, • evaluate DOH with semi-adiabatic for seven-day testing versus 24-hour testing, • look at HIPERPAV performance predictions for DOH computed with seven-day versus
24-hour testing, and • provide recommendations for future testing.
Heat evolution data collected from a concrete mix used in a South Dakota paving project was evaluated for this purpose.
Evaluate DOH with Semi-Adiabatic versus Isothermal Test Results
Comparisons of the DOH with semi-adiabatic testing versus isothermal testing showed that there is a significant difference in the DOH predicted with these two methods. Potential reasons for this include the following:
• The estimation of the total heat of hydration may have been inaccurate. The total heat of hydration was predicted using available models as a function of the chemical composi ydration be determin
• Although the thermal properties of the aggregates, such as thermal conductivity and degree of hydration of the concrete
sample, it should be recognized that hydration of a concrete sample may be different
.
ing for
ision only 24 hours’ worth of data. For this purpose, the determined DOH parameters
with each data set were input into HIPERPAV to assess the difference in predicted performance.
tion of the cement. It is therefore recommended that total heat of hed with ASTM C 186.
specific heat, were accounted for in determining the
from the hydration of a cement paste/mortar sample. This should be investigated further. • The specific heat of the isothermal equipment was not accounted for in this exercise, and
this may have introduced errors in determining the degree of hydration with this method Evaluate DOH with Semi-Adiabatic for Seven-Day versus 24-Hour Testing
One of the objectives in this project has been to evaluate the feasibility of using up to 24 hours’worth of calorimetric testing (as opposed to the typical three to seven days of required testa precise estimation of PCC heat evolution) to make rapid decisions in the field regarding the characteristics and suitability of the concrete mix for the given environment.
In this task, determination of the DOH was performed with both 24 hours and seven days of semi-adiabatic data for the same mix. The objective of this exercise was to evaluate the preclost by using
The results of this comparison are presented in the following section.
39

Examine HIPERPAV Performance Predictions for DOH Computed with Seven-Day ver24-Hour Testing
sus
The DOH parameters obtained with the 24-hour and seven-day data sets for the same mix were input into HIPERPAV to predict time of set, strength gain, and critical stress-to-strength ratio for the first 72 hours after construction.
Considerable differences were observed in set, strength gain, and stress-to-strength ratio predictions for the DOH computed with 24-hour heat evolution data when compared to the seven-day DOH data set used as a reference. In this exercise, the analysis reliability was set at 50% for the run with the seven-day DOH data set, and the reliability of the run with the 24-hour data set was adjusted to match the stress-to-strength ratio predictions with the seven-day DOH data set. A reliability of 60% was found to match the stress-to-strength ratio predictions of the seven-day DOH data set. This appears to indicate that by using a higher reliability for the heat evolution computed with a reduced testing time of 24 hours, one may be able to approximate the performance results obtained with standard testing of seven days.
Recommendations for Future Testing
Based on the above findings on heat of hydration characterization for prediction of pavement performance, the following recommendations are provided for future implementation in this project:
• A similar approach to the one described above should be performed to conduct a sensitivity analysis on the heat of hydration characterization for multiple mixes. This approach should include mixes with different SCMs and mixture proportions. HIPERPAV should be used to evaluate the sensitivity of reduced calorimetric testing time on pavement performance indicators such as set time, strength, and stress-to-strength ratio.
• During the field testing stage of this project, it is recommended that HIPERPAV predictions of pavement performance be verified with field pavement performance measurements.
• The semi-adiabatic testing has been proven in the past for the characterization of the DOH of concrete pavement mixtures. Additional evaluation of the isothermal calorimetry method is required before this method is further considered in the characterization of the DOH.
• The isothermal method is a proven test for evaluating the thermal sensitivity of concrete mixtures (i.e. activation energy). For thorough verification of the HIPERPAV predictions, the isothermal method should be used to determine the thermal sensitivity of the evaluated mixtures.
• In addition to the degree of hydration and the thermal sensitivity, the total heat of hydration of the evaluated mixtures should be tested in the laboratory to compare with the predicted total heat of hydration currently used in HIPERPAV.
40
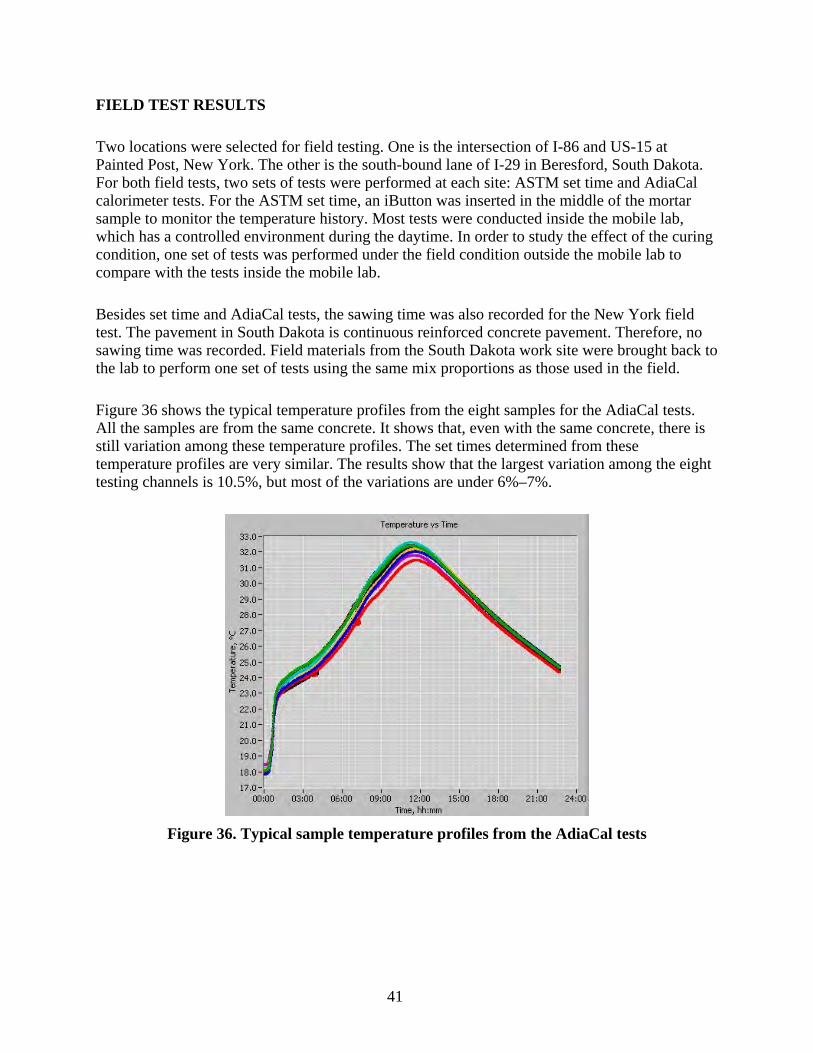
FIELD TEST RESULTS
Tw o 86 and US-15 at Pai d a ota. For tcalorimsam e s were conducted inside the mobile lab,
hi h e. In order to study the effect of the curing
r the New York field vement. Therefore, no
perature profiles from the eight samples for the AdiaCal tests. All the samples are from the same concrete. It shows that, even with the same concrete, there is still rtemper g the eight testing
o l cations were selected for field testing. One is the intersection of I-nte Post, New York. The other is the south-bound lane of I-29 in Beresford, South D k bo h field tests, two sets of tests were performed at each site: ASTM set time and AdiaCal
eter tests. For the ASTM set time, an iButton was inserted in the middle of the mortar pl to monitor the temperature history. Most testch as a controlled environment during the daytimw
condition, one set of tests was performed under the field condition outside the mobile lab to compare with the tests inside the mobile lab.
Besides set time and AdiaCal tests, the sawing time was also recorded fotest. The pavement in South Dakota is continuous reinforced concrete pasawing time was recorded. Field materials from the South Dakota work site were brought back to the lab to perform one set of tests using the same mix proportions as those used in the field.
Figure 36 shows the typical tem
va iation among these temperature profiles. The set times determined from these ature profiles are very similar. The results show that the largest variation amonchannels is 10.5%, but most of the variations are under 6%–7%.
Figure 36. Typical sample temperature profiles from the AdiaCal tests
41

Figure 37 shows set times determined by the ASTM C 403 and AdiaCal method for both field sites. All points are along the equality line. The set times determined from the fraction method are closer to the ASTM set times. The set times from the derivatives methods have larger variation, because this method is sensitive to any extraneous peaks in the data and to changes in the environment.
6:14
8:09
10:04
diaC
al S
et T
ime
(hou
r)12:00
A
Derivatives Fraction
4:19
2:242:24 4:19 6:14 8:09 10:04 12:00
ASTM Set Time (hour)
Sample Figure 38). Th re inside t e field conditions. The initial set times from ASTM test are 4.05 and 3.88 hours for the lab and field con i AdiaCa
Figure 37. Set times for the New York and South Dakota field tests
s tested under lab and field conditions have different temperature histories (seee sample under the lab condition has much lower temperature due to the low temperatuhe mobile lab; the peak value is also postponed compared with the sample under th
dit ons, respectively. The final set times are 5.63 and 5.03 hours, respectively. For thel test, initial set times vary by 1.16 hours and final set times by 1.27 hours.
42

50
00 5 10 15 20 25
10
Time (hour)
T
20
30
40
empe
ratu
re (C
)
Lab conditionField condition
The overall objective of this project is to identify, develop, and evaluate a standard test procedure for monitoring performance of pavement concrete materials using a relatively simple, economical, and reliable calorimetry device. The project contains three phases. Phase I, completed in December 2005, identified user needs for a calorimeter test and potential applications of calorimeter test results. Phase II, presented in this report, aimed to establish a standard test procedure as well as the methods for interpreting the calorimeter test results. Phase III will verify the major applications of the calorimeter test method and develop the specification for calorimeter testing of field concrete.
This report summarized the activities and major findings from the Phase II study. The following activities were conducted in Phase II:
• Performed a series of lab tests for approximately 120 mortar mixes using a Thermometric isothermal calorimeter
• Tested the set time and strength development for these mortar mixes • Developed the heat index method for interpretation of the calorimetry test results • Stu etry and
ASTM tests • Identified the potential applications of the calorimeter test results • Performed two field tests using AdiaCal semi-adiabatic calorimeter • Estimated pavement performance using HIPERPAV and field calorimetry data
Figure 38. Average temperature history of samples cured in different environments
SUMMARY
died the relationships between the mortar set time obtained from the calorim
43

The major findings from the Phase II study are summarized below:
• The test method developed for the selected isothermal calorimeter device is easy to applyand repeatable.
• The calorim
eter test can be used to differentiate the heat evolution of mortars made with different materials and subjected to different curing conditions.
• The calorimeter test can be used to identify material incompatibility and to flag cementitious changes.
• The heat indexes, related to the first derivative of the calorimeter curve and the area under the curve, are able to characterize the features of mortar. They can also be used to predict the mortar set time and early-age strength (up to two days).
• When incorporated with the HIPERPAV computer program, calorimeter test results are able to provide insight onto the risk of thermal cracking in field concrete.
• The selected semi-adiabatic calorimeter test device (AdiaCal) is also easy to use, and the test results provide a very good prediction of the set time of field concrete.
• The AdiaCal calorimeter or similar equipment can be modified to compute temperature losses and can inexpensively replicate the results of semi-adiabatic testing in the field.
• Used with HIPERPAV, semi-adiabatic testing of concrete in the field is the recommended procedure for prediction of pavement performance characteristics, including set times, strength gain, and thermal cracking risk.
Phase II has provided necessary preliminary results for potential applications of calorimetry. However, due to the limited time and funding, the previous research did not include sufficient field tests and HIPERPAV analyses that verify the validity of the Phase II results. The proposed Phase III is to focus on the field verification and implementation of the research results from
ield results. • Develop the performance-based specification for calorimeter equipment and test
procedures based on the field test results.
Phase II. The following tasks will be performed in Phase III:
• Evaluate the applicability of AdiaCal calorimeter tests and compare the test results with those from Thermometric isothermal calorimeter.
• Conduct field tests and verify the heat indexes developed in Phase II. • Modify the HIPERPAV computer program and compare the predicted and f
44
REFERENCES
1. Mindess, S., J. F. Young, and D. Darwin, Concrete, 2nd ed. Upper Saddle River, NJ: Prentice Hall, 2003.
2. Portland Cement Association, “Portland Cement, Concrete, and Heat of Hydration,”
Concrete Technology Today 18, no. 2, 1997, 1–4. 3. Knight, G, “Comparative Calorimetry Testing.” Technical working group meeting for
Heat Evolution Test Research, Des Moines, IA, Oct. 1, 2004. 4. Ruiz, J. M., R. O. Rasmussen, and T. R. Ferragut, “Characterization of Concrete Paving
Mixtures with HIPERPAV.” Special publication of the technical session Concrete Heat Development: Monitoring, Prediction, and Management, at the ACI Convention, Atlanta, GA, April 22–26, 2007.
5.
http://www.pcccenter.iastate.edu/publications/task15.cfm.
Integration, AdiaCal Manual, Version 1, 2006.
7. Kishi, T., and K. Maekawa, “Thermal and Mechanical Modeling of Young Concrete l
plied Science 10, 1959, 329–345. 10. 11.
12. and J. W. Meusel, “Evaluation for Durability and Strength Development of
Aggregates 3, no. 1,
13. Brooks, J. J., “Prediction of Setting Time of Fly Ash Concrete,” ACI Materials Journal
99, no. 6, 2002, 591–596.
FHWA and Iowa State University, “Road Map for PCC Pavement Research: Concrete Pavement Technology Long Term Research and Technology Plan,” March 7, 2005.
6. Solidus
Based on Hydration Process of Multi-Component Cement Minerals,” In ThermaCracking in Concrete at Early Ages, Proceeding of RILEM, ed. R. Springenschmid, 1994, 11–18.
8. Danielson, U., “Heat of Hydration of Cement as Affected by Water-Cement Ratio,”
Proceedings of the Fourth International Symposium on the Chemistry of Cement, Paper IV-S7, 519–526. Fourth International Symposium on the Chemistry of Cement, Washington, 1962.
9. Taplin, J. H., “A Method for Following the Hydration Reaction in Portland Cement Paste,” Australian Journal of Ap
Neville, A. M., Properties of Concrete, 4th ed. New York: John Wiley and Sons, 1996.
Escalante-Garcia, J. I., and J. H. Sharp, “Effect of Temperature on the Early Hydration of Portland Cement and Blended Cements,” Advances in Cement Research 12, no. 3, July 2000, 121–130.
Hogan, F. J., a Ground Granulated Blast Furnace Slag,” Cement, Concrete, and 1981, 40–52.
45
14. Brooks, J. J., M. A. Megat Johari, and M. Mazloom, “Effect of Admixture on the Setting
15.
ates 17,
16.
17.
IL, March 21–
18.
19. J:
22. Sandberg, P., and L. Roberts, “Cement-Admixture Interactions Related to Aluminate
23. sed in Concrete,”
24. crete Materials: Influential Factors, Effects,
and Prevention.” Proceedings of the 2006 Concrete Bridge Conference, Reno, NV, 2006.
Times of High-Strength Concrete,” Cement and Concrete Composites 22, 2000, 293–301.
Eren, O., J. J. Brooks, and T. Celik, “Setting Times of Fly Ash and Slag-Cement Concretes as Affected by Curing Temperatures,” Cement, Concrete, and Aggregno. 1, 1995, 11–17.
Byfors, J., Plain Concrete at Early Ages, Research 3:80. Stockholm, Sweden: Swedish Cement and Concrete Research Institute, 1980.
Schindler, A. K., “Prediction of Concrete Setting.” International RILEM Symposium on Concrete Science and Engineering: A Tribute to Arnon Bentur, Evanston, 24, 2004.
Pinto, R. C. A., and K. C. Hover, “Application of Maturity Approach to Setting Times,” ACI Materials Journal 96, no. 6, 1999, 686–691.
Mehta, P. K., Concrete: Structure, Properties, and Materials. Englewood Cliffs, NPrentice-Hall, 1986, 325–326.
20. Nonat, A., Preface, Proceedings of the Second International RILEM Workshop, vol. 1.Second International RILEM Workshop, Dijon, France, June 11–13, 1997.
21. FHWA, Protocol to Identify Incompatible Combinations of Concrete Materials, Report
FHWA-HRT-06-082, 2006.
Control,” Journal of ASTM International 2, no. 6, 2005.
Wang, H., C. Qi, H. Farzam, and J. Turici, “Interactions of Materials UConcrete International 28, no. 4, 2006, 47–52.
Cost, T., “Incompatibility of Common Con
46