Embed Size (px)
Citation preview
-1-
IMP2001
Developing a Standard Scale of Relationship Valuein Business Markets
Wolfgang Ulaga
EDHEC School of ManagementDepartment of Marketing58, Rue du Port, 59046 Lille Cedex, FrancePhone: ++33 3 20 15 45 38Fax: ++33 3 20 15 44 64E-mail: [email protected]
and
Andreas Eggert
University of KaiserslauternDepartment of MarketingP.O.Box 3049, 67653 Kaiserslautern, GermanyPhone: ++49 631 205-3116Fax: ++49 631 205-3394E-mail: [email protected]
Abstract:
Value creation is considered as key to collaborative customer-supplier relationships.
Despite the growing body of research, more knowledge is needed about the construct
of relationship value and its operationalization. The present paper provides a
definition of relationship value and develops a scale for measuring the concept in
business-to-business markets. Findings from a cross-sectional survey among
purchasing managers in industrial companies in France are presented. Four
relationship value components emerge from the present study: product-related
benefits, strategic benefits, personal benefits, and relationship sacrifices. Finally, a
method of aggregating the four components to the higher-order construct of
relationship value is proposed.
-2-
Developing a Standard Scale of Relationship Valuein Business Markets
1 Introduction
In recent years, there has been a resurgence of interest in the value construct among
marketing researchers and practitioners (Ulaga 2001). This holds especially true in
business markets where customers rely on the products and services they buy from
their suppliers to improve their own market offering and to increase the overall
profitability of their firm. The mission statement of Exxon Chemical illustrates how
business marketers place customer value at the core of their marketing strategies: ”Our
mission is to provide quality petrochemical products and services in the most efficient
and resposible manner to generate outstanding shareholder and customer value”
(Exxon Chemicals Annual Report, 1999).
Marketing academics have also placed customer value on top of their research
agendas. Over the past years, the Marketing Science Institute has consistently included
customer value in the list of its research priorities. In the area of business marketing,
both the Institute for the Study of Business Markets (ISBM) at the Pennsylvania State
University and the Center for Business and Industrial Marketing (CBIM) at Georgia
State University have integrated research on customer value as a key issue of their
research programs. Customer value is considered a fundamental constituent of
relationship marketing. In fact, delivering superior value to customers is key to
creating and sustaining long-term industrial relationships: “Value creation and value
sharing can be regarded as the raison d’être of collaborative customer-supplier
relationships” (Anderson, 1995, p. 349). This is particular important in a ”Markets-as-
Networks” perspective as it has been developed by researchers of the IMP group.
Though the body of literature in the area of relationship value is growing fast, most
research is of conceptual nature. As long as attempts to measure relationship value
remain scarce, however, the construct will be criticized for its operational ambiguity
-3-
(Parasuraman 1997, p. 155). To foster the development of an empirically grounded
value theory of relationship marketing, researchers have called for the development of
psychometrically sound measures of relationship value. The present paper aims at
making a contribution to the emerging relationship value literature by developing a
standard scale of relationship value. Two research questions are addressed:
1. How can relationship value be conceptualized in business-to-business
markets?
2. How can psychometrically sound measures of relationship value be
developed?
In order to answer these questions, this study is structured as follows: the construct of
perceived customer value is first assessed and its potential components are identified
in a literature review. This is followed by a description of the empirical study and a
discussion of its results. Limitations of the present study and suggestions for future
research conclude the paper.
2 Customer-Perceived Value in Business Relationships
Though it did not attract much explicit attention until it became a watchword in the
nineties, perceived value has always been ”the fundamental basis for all marketing
activity” (Holbrook 1994, p. 22). The value concept is closely linked to the exchange
theory of marketing. According to this view, voluntary market exchange is a key
constituent of the discipline (Alderson 1957, Kotler 1972, Houston 1987). As a
voluntary market exchange only takes places when all parties involved expect to be
better off after the exchange, perceived value is at the core of marketing.
While the literature contains a variety of definitions of customer-perceived value,
three common elements have been identified (Eggert and Ulaga, 2001): the multiple
components of value, the subjectivity of value perceptions, and the importance of
competition.
-4-
First, most definitions present customer-perceived value as a trade-off between
benefits and sacrifices perceived by the customer in a supplier’s offering (Zeithaml
1988, p.14; Monroe 1990, p. 46). According to Monroe, benefits are a combination of
physical attributes, service attributes and technical support available in relation to a
particular use situation. Perceived sacrifices are sometimes described in monetary
terms (Anderson et al., 1993). Other definitions describe sacrifices more broadly.
Second, value is a subjectively perceived construct (Kortge et al., 1993). Different
customer segments perceive different values within the same product. In addition, the
various members in the customer organization involved in the purchasing process can
have different perceptions of a supplier's value delivery (Perkins, 1993).
Finally, value is relative to competition. Delivering a better trade-off between benefits
and sacrifices in a product or service, i.e. offering better value than competition, will
help a company to create sustainable competitive advantage.
Against this background, Eggert and Ulaga (2001) define relationship value in
business markets as the trade-off between the multiple benefits and sacrifices of a
supplier’s offering, as perceived by key decision-makers in the customer’s
organization, and taking into consideration the available alternative suppliers’
offerings in a specific use situation.
3 Identifying the Components of Relationships Value
Value is as a multi-faceted construct. Most definitions present customer-perceived
value as a trade-off between multiple benefits and sacrifices perceived by the
customer in a supplier offering. This rational approach to customer value is especially
justified in business markets where companies rely on professional purchasing
managers to evaluate suppliers’ products and services to improve their own
operations. Consequently, the questions arise of (1) how to identify the multiple
benefits and sacrifices and (2) how to group them into meaningful value components.
-5-
Marketing academics have suggested several ways of breaking down the different
value components perceived by customers in products or services. For example,
Monroe (1991) distingueshes three benefit categories: physical, service, and technical
support attributes. Anderson et al. (1993) identify four categories of benefits:
economic, technical, service, and social benefits. These benefit components are
opposed to one sacrifice component of value, i.e. the price paid for the product
offering. Ravald and Grönroos (1996) recommend that the trade-off between benefits
and sacrifices should not be restricted to the single episode level. Instead,
measurement of customer-perceived value should take into account both episode and
relationship benefits and sacrifices.
Managers tend to refer to specific categories when assessing value perceived in
products and services instead of overall value descriptions. In a qualitative study with
customers in the food-processing industry, Ulaga and Chacour (2001) found that
managers group benefits received from a supplier’s offering into three categories:
product-related components, service-related components, and promotion-related
components. Customers assign weights to each of these components depending on
their specific use situation. These benefits are then compared to the price paid for the
supplier offering.
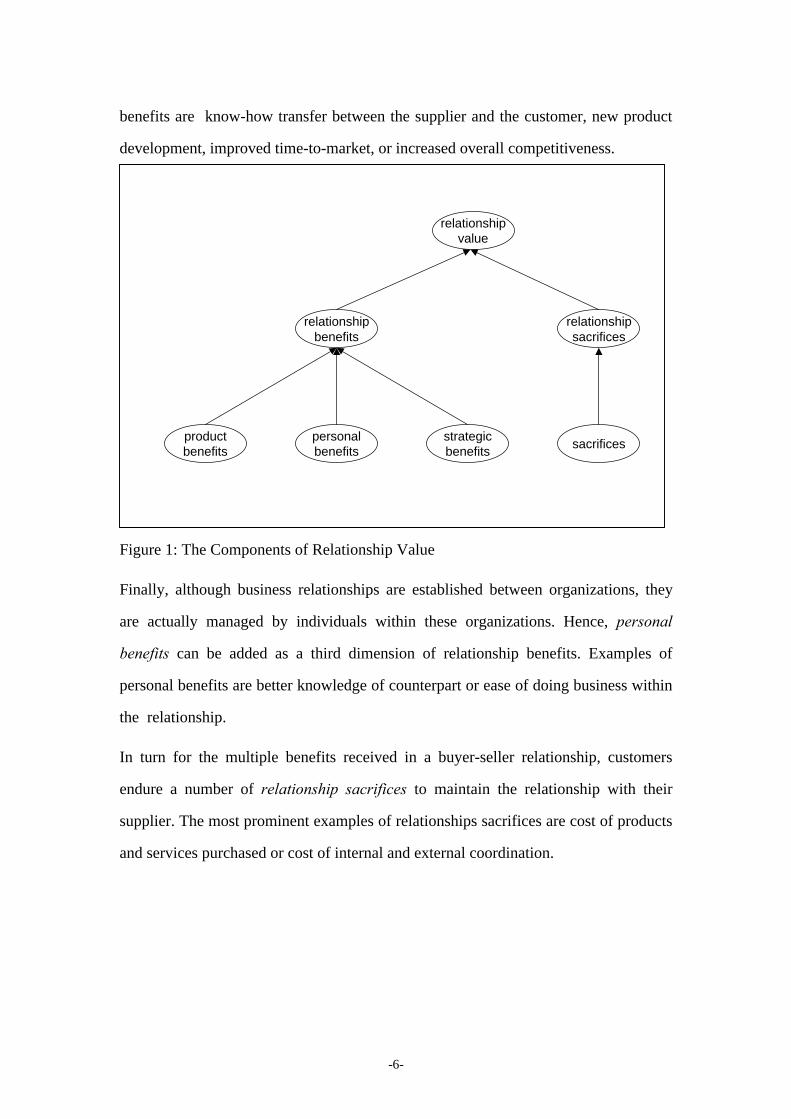
Grounded on both previous research and managerial practice, the present
conceptualizes relationship value as a higher-order construct composed of three
benefit components and one sacrifice component (see Figure 1).
Product-related benefits will always be part of the overall evaluation of value created
in a buyer-seller relationship. Examples of product-related benefits are superior
product quality, improved product performance, better maintenance and repair
services etc. of a given supplier in comparison to alternative suppliers.
Companies invest into relationships with their suppliers to gain access to benefits
beyond the exchange of products and services. These long-term oriented relationship
benefits are best described as strategic relationship benefits. Examples of strategic
-6-
benefits are know-how transfer between the supplier and the customer, new product
development, improved time-to-market, or increased overall competitiveness.
Figure 1: The Components of Relationship Value
Finally, although business relationships are established between organizations, they
are actually managed by individuals within these organizations. Hence, personal
benefits can be added as a third dimension of relationship benefits. Examples of
personal benefits are better knowledge of counterpart or ease of doing business within
the relationship.
In turn for the multiple benefits received in a buyer-seller relationship, customers
endure a number of relationship sacrifices to maintain the relationship with their
supplier. The most prominent examples of relationships sacrifices are cost of products
and services purchased or cost of internal and external coordination.
productbenefits
personalbenefits
strategicbenefits
sacrifices
relationshipbenefits
relationshipsacrifices
relationshipvalue
-7-
4 Empirical Study
4.1 Data Collection
Empirical data was gathered in a cross-sectional survey among purchasing managers
in industrial companies in France. The study was conducted in cooperation with the
French professional association of purchasing managers CDAF. Based on the
association’s directory of 3.000 adherents, a population of 1,269 purchasing
managers working in manufacturing industries were identified. All 1,269 purchasing
managers were contacted by telephone and invited to participate in the study.
According to their preference, respondents received a standardized questionnaire by
mail, by email or by telefax respectively.
Participants were asked to select a specific product or service they purchased from at
least two suppliers. They were then invited to rate a specific, freely chosen supplier
relationship on a number of 5-point rating-scales (anchor: ”strongly agree” vs.
”strongly disagree”). Subsequently, respondents were asked to compare the selected
supplier relationship to an alternative supplier of the same product or service category.
Finally, participants were invited to respond to a set of questions describing their own
company and the supplier relationship.
When completing the present paper, data collection was still in progress. All 1,269
respondents were contacted, questionnaires were send out and 97 questionnaires were
returned. 8 questionnaires contained missing data, leading to a temporary net-sample-
size of 89 business relationships. Currently, a follow-up stage by phone and fax is
under way and a total of 300 responses is expected by the end of the data collection
phases.
The present sample consists of manufacturers in multiple industries, such as
construction equipment (11.4 %), transportation (8,9 %), food processing (7.6 %),
packaging (5.1 %), office equipment (5.1%), pharmaceuticals (3.8 %), mechanical
equipment (3.8 %), electronic components (3.8 %) etc.
-8-
On average, the purchasing managers work with 5 suppliers in the selected product-
service categories ( x = 4.91). The majority of respondents (82.9 %) maintain
relationships with 2-5 suppliers.
4.2 Questionnaire Development
Based on a literature review, a set of possible items was generated. These items were
submitted to 14 marketing academics identified as experts in the areas of research
methodology, industrial marketing, and relationship marketing. Participants in this
item-sorting task were asked to assign the individual items to what they believed to be
the ”correct” value component.
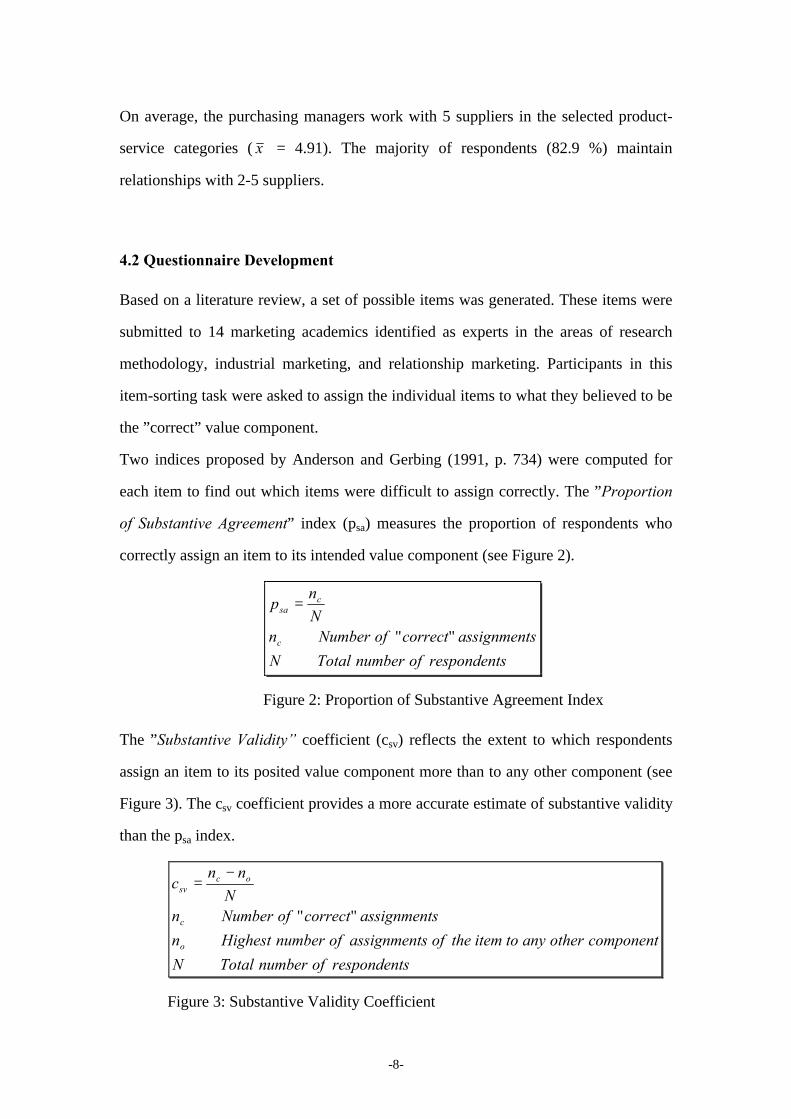
Two indices proposed by Anderson and Gerbing (1991, p. 734) were computed for
each item to find out which items were difficult to assign correctly. The ”Proportion
of Substantive Agreement” index (psa) measures the proportion of respondents who
correctly assign an item to its intended value component (see Figure 2).
srespondentofnumberTotalN
sassignment correctofNumbernN
np
c
csa
""
=
Figure 2: Proportion of Substantive Agreement Index
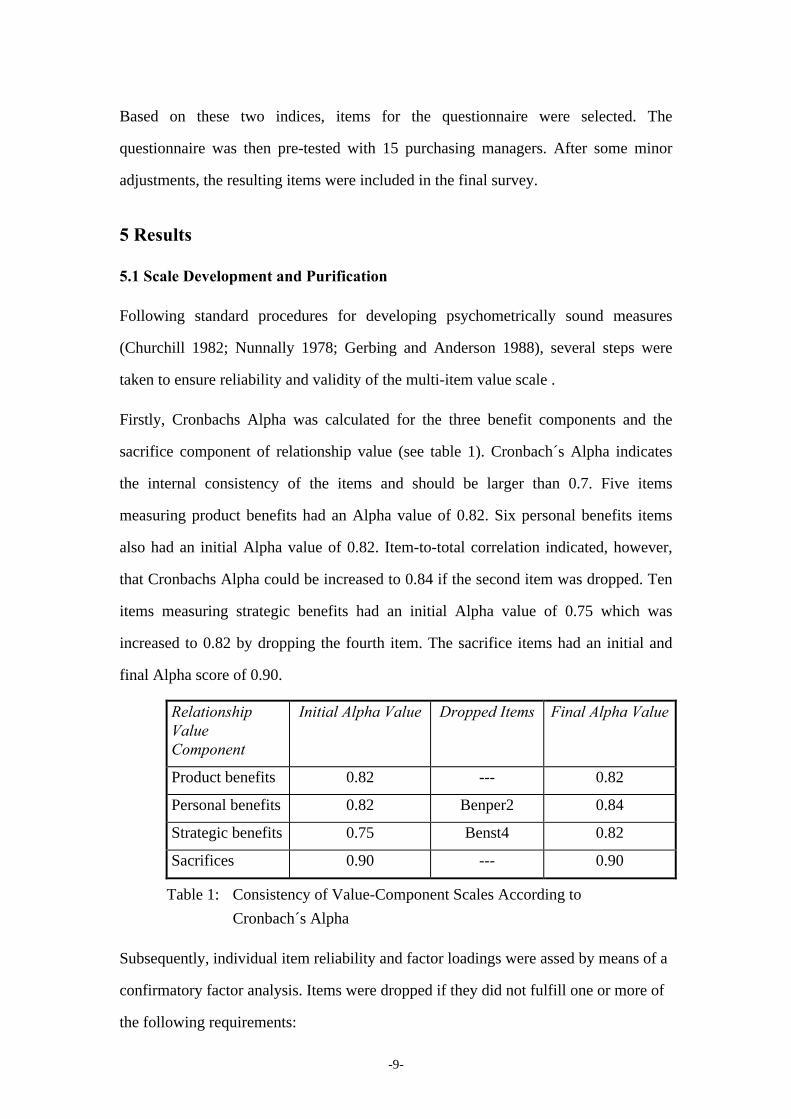
The ”Substantive Validity” coefficient (csv) reflects the extent to which respondents
assign an item to its posited value component more than to any other component (see
Figure 3). The csv coefficient provides a more accurate estimate of substantive validity
than the psa index.
srespondentofnumberTotalN
componentotheranytoitemtheofsassignmentofnumberHighestn
sassignmentcorrectofNumbernN
nnc
o
c
ocsv
""
−=
Figure 3: Substantive Validity Coefficient
-9-
Based on these two indices, items for the questionnaire were selected. The
questionnaire was then pre-tested with 15 purchasing managers. After some minor
adjustments, the resulting items were included in the final survey.
5 Results
5.1 Scale Development and Purification
Following standard procedures for developing psychometrically sound measures
(Churchill 1982; Nunnally 1978; Gerbing and Anderson 1988), several steps were
taken to ensure reliability and validity of the multi-item value scale .
Firstly, Cronbachs Alpha was calculated for the three benefit components and the
sacrifice component of relationship value (see table 1). Cronbach´s Alpha indicates
the internal consistency of the items and should be larger than 0.7. Five items
measuring product benefits had an Alpha value of 0.82. Six personal benefits items
also had an initial Alpha value of 0.82. Item-to-total correlation indicated, however,
that Cronbachs Alpha could be increased to 0.84 if the second item was dropped. Ten
items measuring strategic benefits had an initial Alpha value of 0.75 which was
increased to 0.82 by dropping the fourth item. The sacrifice items had an initial and
final Alpha score of 0.90.
RelationshipValueComponent
Initial Alpha Value Dropped Items Final Alpha Value
Product benefits 0.82 --- 0.82
Personal benefits 0.82 Benper2 0.84
Strategic benefits 0.75 Benst4 0.82
Sacrifices 0.90 --- 0.90
Table 1: Consistency of Value-Component Scales According to
Cronbach´s Alpha
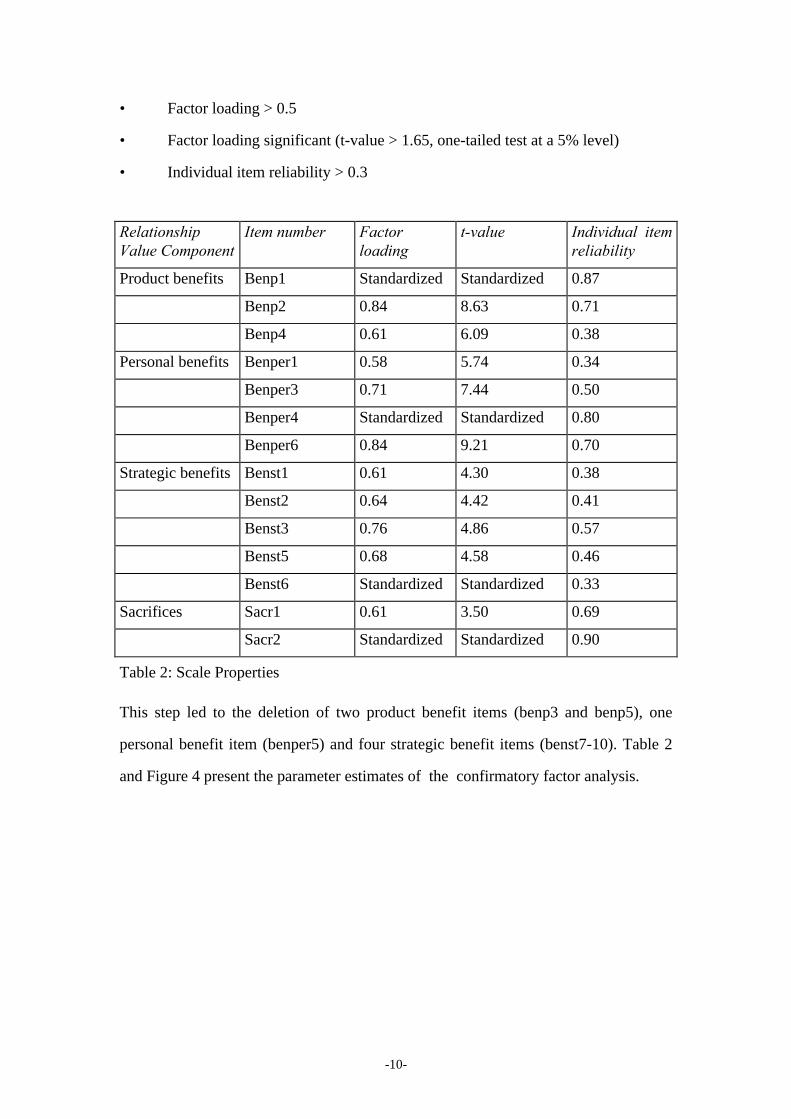
Subsequently, individual item reliability and factor loadings were assed by means of a
confirmatory factor analysis. Items were dropped if they did not fulfill one or more of
the following requirements:
-10-
• Factor loading > 0.5
• Factor loading significant (t-value > 1.65, one-tailed test at a 5% level)
• Individual item reliability > 0.3
RelationshipValue Component
Item number Factorloading
t-value Individual itemreliability
Product benefits Benp1 Standardized Standardized 0.87
Benp2 0.84 8.63 0.71
Benp4 0.61 6.09 0.38
Personal benefits Benper1 0.58 5.74 0.34
Benper3 0.71 7.44 0.50
Benper4 Standardized Standardized 0.80
Benper6 0.84 9.21 0.70
Strategic benefits Benst1 0.61 4.30 0.38
Benst2 0.64 4.42 0.41
Benst3 0.76 4.86 0.57
Benst5 0.68 4.58 0.46
Benst6 Standardized Standardized 0.33
Sacrifices Sacr1 0.61 3.50 0.69
Sacr2 Standardized Standardized 0.90
Table 2: Scale Properties
This step led to the deletion of two product benefit items (benp3 and benp5), one
personal benefit item (benper5) and four strategic benefit items (benst7-10). Table 2
and Figure 4 present the parameter estimates of the confirmatory factor analysis.
-11-
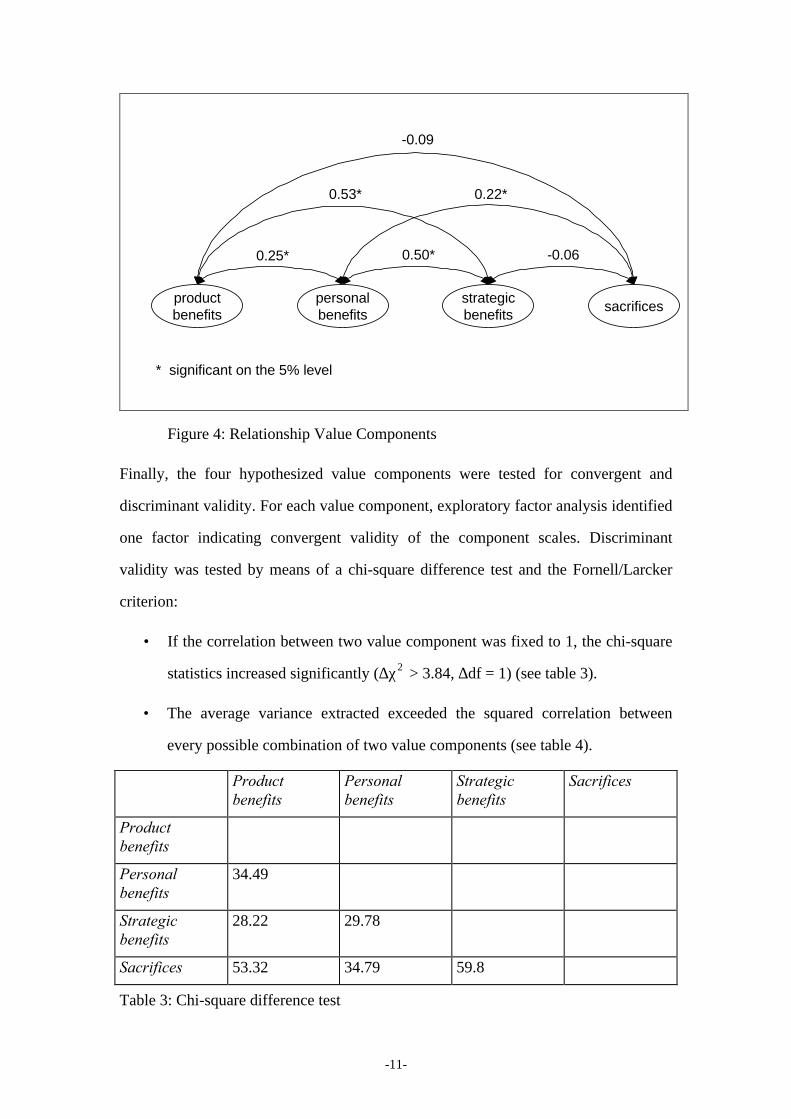
Figure 4: Relationship Value Components
Finally, the four hypothesized value components were tested for convergent and
discriminant validity. For each value component, exploratory factor analysis identified
one factor indicating convergent validity of the component scales. Discriminant
validity was tested by means of a chi-square difference test and the Fornell/Larcker
criterion:
• If the correlation between two value component was fixed to 1, the chi-square
statistics increased significantly (∆χ2 > 3.84, ∆df = 1) (see table 3).
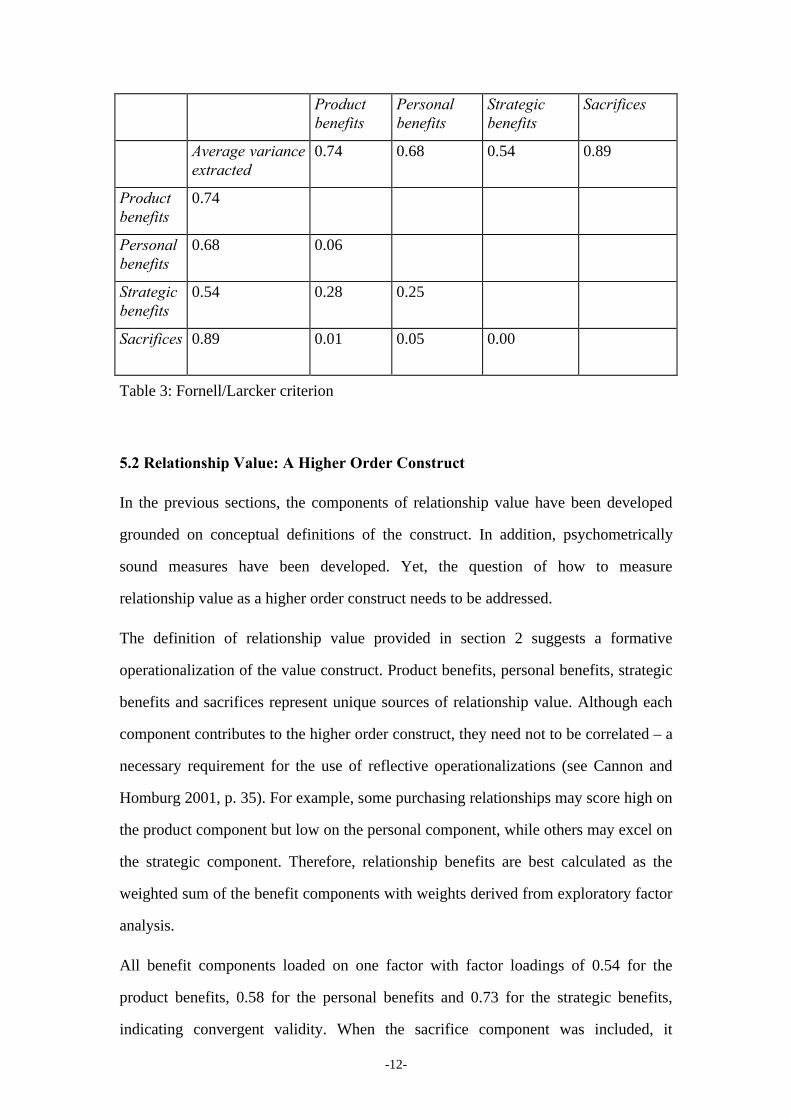
• The average variance extracted exceeded the squared correlation between
every possible combination of two value components (see table 4).
Productbenefits
Personalbenefits
Strategicbenefits
Sacrifices
Productbenefits
Personalbenefits
34.49
Strategicbenefits
28.22 29.78
Sacrifices 53.32 34.79 59.8
Table 3: Chi-square difference test
productbenefits
personalbenefits
strategicbenefits
sacrifices
0.25* 0.50* -0.06
0.53* 0.22*
-0.09
* significant on the 5% level
-12-
Productbenefits
Personalbenefits
Strategicbenefits
Sacrifices
Average varianceextracted
0.74 0.68 0.54 0.89
Productbenefits
0.74
Personalbenefits
0.68 0.06
Strategicbenefits
0.54 0.28 0.25
Sacrifices 0.89 0.01 0.05 0.00
Table 3: Fornell/Larcker criterion
5.2 Relationship Value: A Higher Order Construct
In the previous sections, the components of relationship value have been developed
grounded on conceptual definitions of the construct. In addition, psychometrically
sound measures have been developed. Yet, the question of how to measure
relationship value as a higher order construct needs to be addressed.
The definition of relationship value provided in section 2 suggests a formative
operationalization of the value construct. Product benefits, personal benefits, strategic
benefits and sacrifices represent unique sources of relationship value. Although each
component contributes to the higher order construct, they need not to be correlated – a
necessary requirement for the use of reflective operationalizations (see Cannon and
Homburg 2001, p. 35). For example, some purchasing relationships may score high on
the product component but low on the personal component, while others may excel on
the strategic component. Therefore, relationship benefits are best calculated as the
weighted sum of the benefit components with weights derived from exploratory factor
analysis.
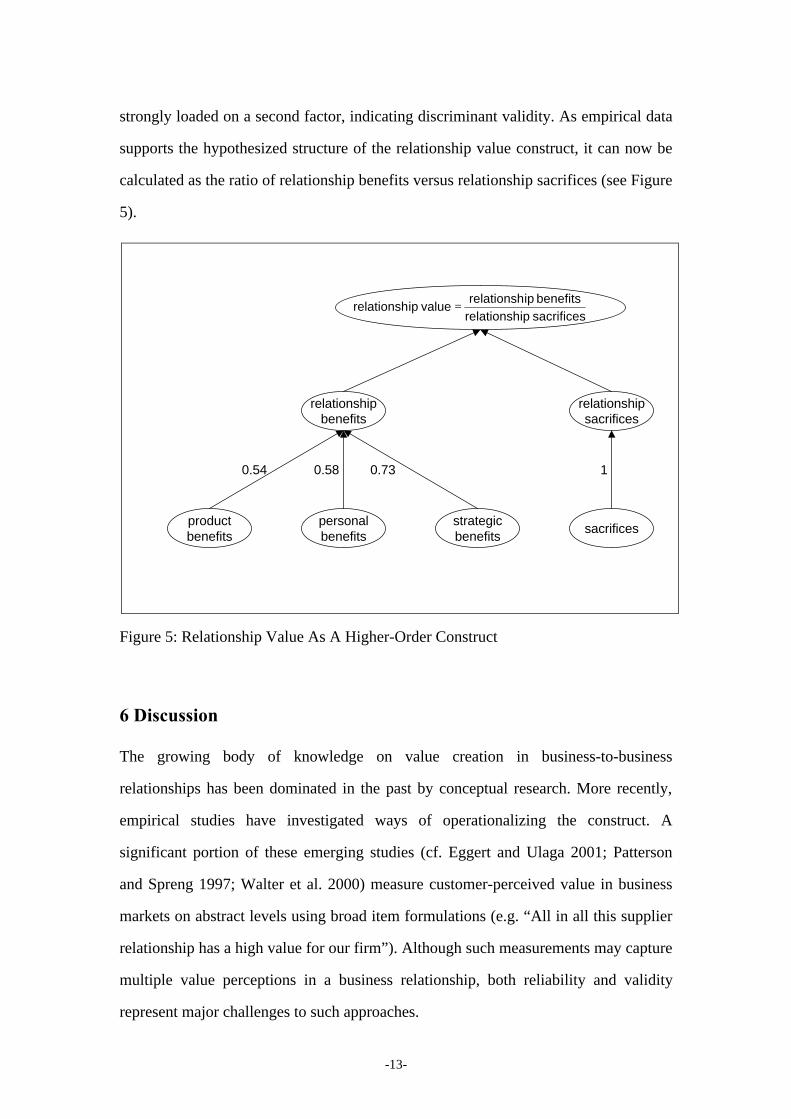
All benefit components loaded on one factor with factor loadings of 0.54 for the
product benefits, 0.58 for the personal benefits and 0.73 for the strategic benefits,
indicating convergent validity. When the sacrifice component was included, it
-13-
strongly loaded on a second factor, indicating discriminant validity. As empirical data
supports the hypothesized structure of the relationship value construct, it can now be
calculated as the ratio of relationship benefits versus relationship sacrifices (see Figure
5).
Figure 5: Relationship Value As A Higher-Order Construct
6 Discussion
The growing body of knowledge on value creation in business-to-business
relationships has been dominated in the past by conceptual research. More recently,
empirical studies have investigated ways of operationalizing the construct. A
significant portion of these emerging studies (cf. Eggert and Ulaga 2001; Patterson
and Spreng 1997; Walter et al. 2000) measure customer-perceived value in business
markets on abstract levels using broad item formulations (e.g. “All in all this supplier
relationship has a high value for our firm”). Although such measurements may capture
multiple value perceptions in a business relationship, both reliability and validity
represent major challenges to such approaches.
productbenefits
personalbenefits
strategicbenefits
sacrifices
0.54
relationshipbenefits
relationshipsacrifices
0.58 0.73 1
sacrifices iprelationsh
benefits iprelationsh value iprelationsh =
-14-
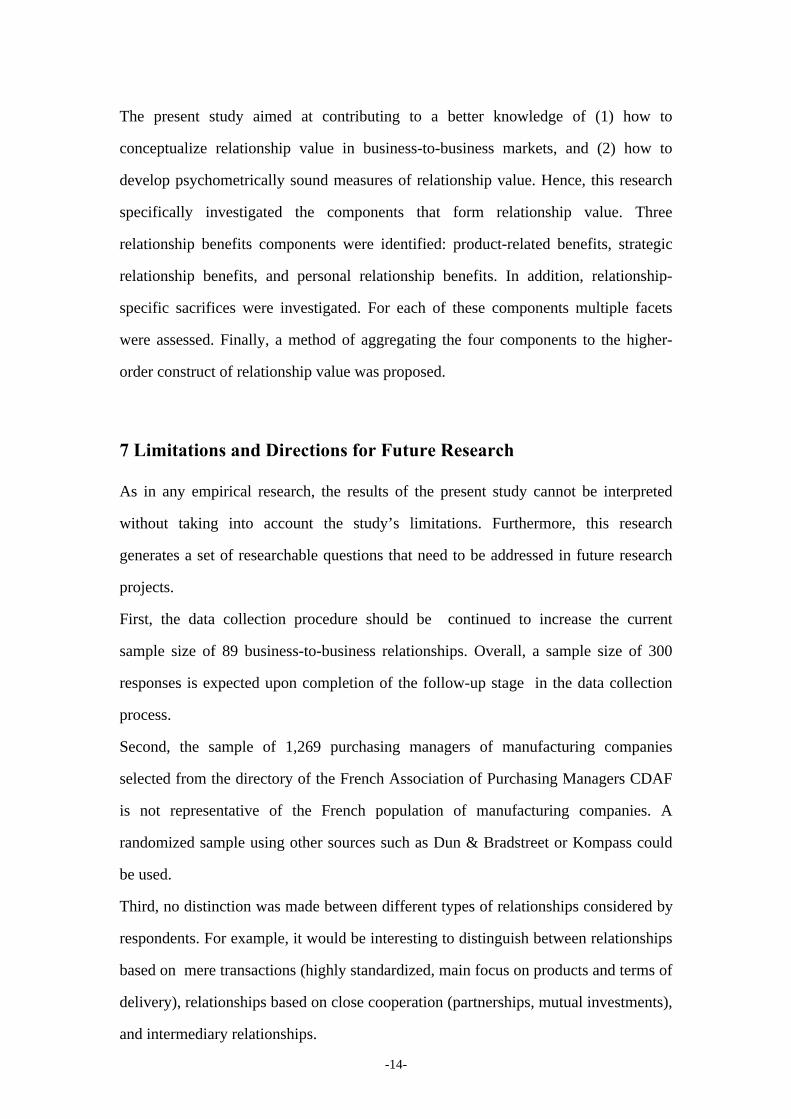
The present study aimed at contributing to a better knowledge of (1) how to
conceptualize relationship value in business-to-business markets, and (2) how to
develop psychometrically sound measures of relationship value. Hence, this research
specifically investigated the components that form relationship value. Three
relationship benefits components were identified: product-related benefits, strategic
relationship benefits, and personal relationship benefits. In addition, relationship-
specific sacrifices were investigated. For each of these components multiple facets
were assessed. Finally, a method of aggregating the four components to the higher-
order construct of relationship value was proposed.
7 Limitations and Directions for Future Research
As in any empirical research, the results of the present study cannot be interpreted
without taking into account the study’s limitations. Furthermore, this research
generates a set of researchable questions that need to be addressed in future research
projects.
First, the data collection procedure should be continued to increase the current
sample size of 89 business-to-business relationships. Overall, a sample size of 300
responses is expected upon completion of the follow-up stage in the data collection
process.
Second, the sample of 1,269 purchasing managers of manufacturing companies
selected from the directory of the French Association of Purchasing Managers CDAF
is not representative of the French population of manufacturing companies. A
randomized sample using other sources such as Dun & Bradstreet or Kompass could
be used.
Third, no distinction was made between different types of relationships considered by
respondents. For example, it would be interesting to distinguish between relationships
based on mere transactions (highly standardized, main focus on products and terms of
delivery), relationships based on close cooperation (partnerships, mutual investments),
and intermediary relationships.
-15-
Finally, the present study predominantly focused on the construct of relationship value
and its underlying dimensions. It would be interesting to investigate relationship
concepts closely related to the construct such as commitment, satisfaction, and trust.
In general, relationship value should be investigated in conjunction with major
antecedents, mediating variables, and consequences.
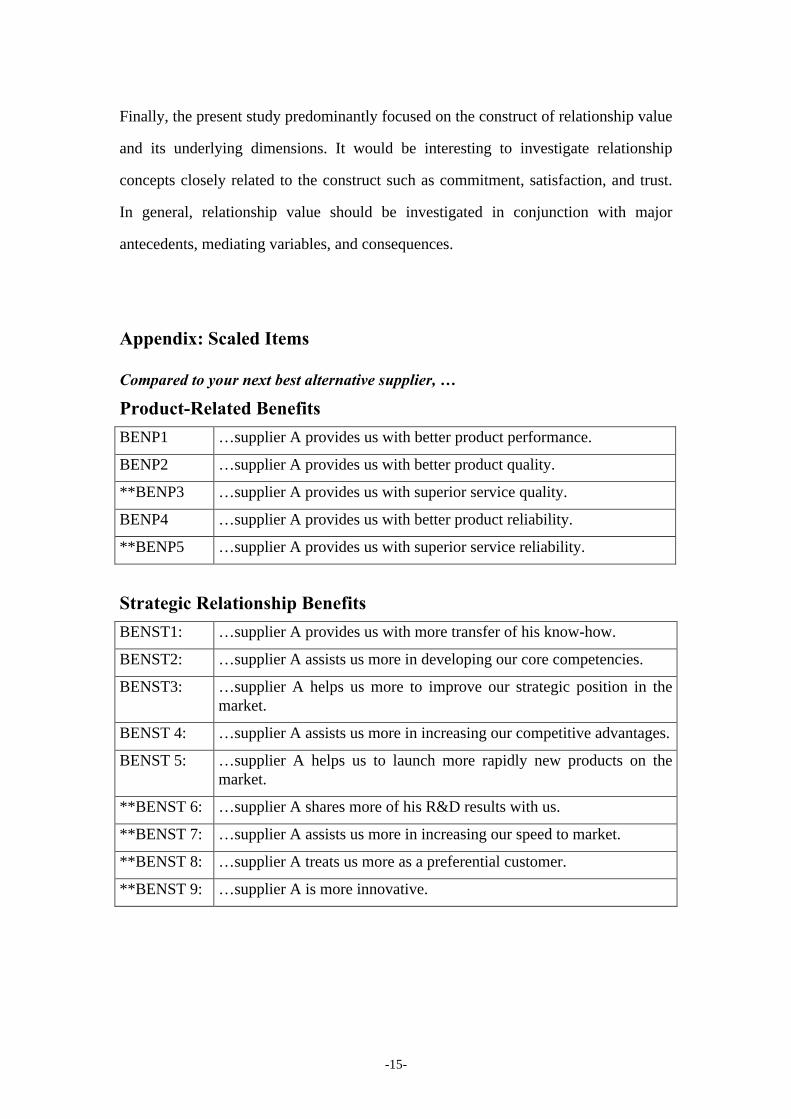
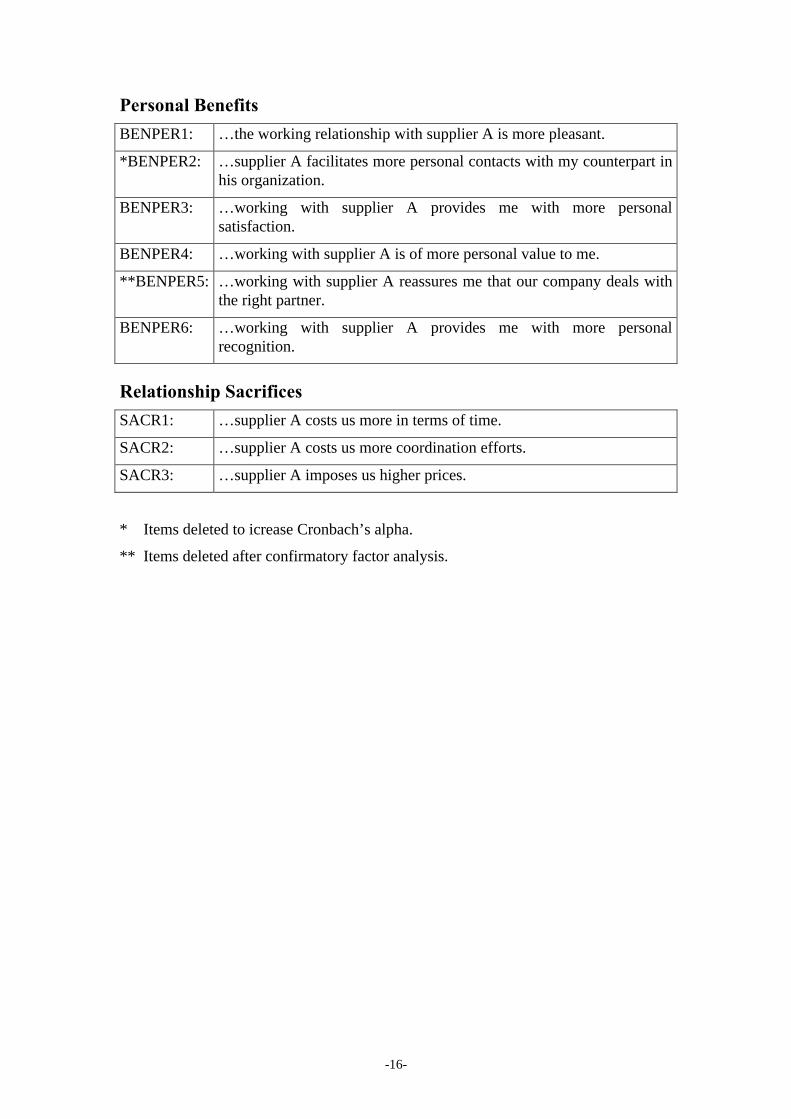
Appendix: Scaled Items
Compared to your next best alternative supplier, …
Product-Related Benefits
BENP1 …supplier A provides us with better product performance.
BENP2 …supplier A provides us with better product quality.
**BENP3 …supplier A provides us with superior service quality.
BENP4 …supplier A provides us with better product reliability.
**BENP5 …supplier A provides us with superior service reliability.
Strategic Relationship Benefits
BENST1: …supplier A provides us with more transfer of his know-how.
BENST2: …supplier A assists us more in developing our core competencies.
BENST3: …supplier A helps us more to improve our strategic position in themarket.
BENST 4: …supplier A assists us more in increasing our competitive advantages.
BENST 5: …supplier A helps us to launch more rapidly new products on themarket.
**BENST 6: …supplier A shares more of his R&D results with us.
**BENST 7: …supplier A assists us more in increasing our speed to market.
**BENST 8: …supplier A treats us more as a preferential customer.
**BENST 9: …supplier A is more innovative.
-16-
Personal Benefits
BENPER1: …the working relationship with supplier A is more pleasant.
*BENPER2: …supplier A facilitates more personal contacts with my counterpart inhis organization.
BENPER3: …working with supplier A provides me with more personalsatisfaction.
BENPER4: …working with supplier A is of more personal value to me.
**BENPER5: …working with supplier A reassures me that our company deals withthe right partner.
BENPER6: …working with supplier A provides me with more personalrecognition.
Relationship Sacrifices
SACR1: …supplier A costs us more in terms of time.
SACR2: …supplier A costs us more coordination efforts.
SACR3: …supplier A imposes us higher prices.
* Items deleted to icrease Cronbach’s alpha.
** Items deleted after confirmatory factor analysis.
-17-
References
Alderson, W. (1957), Marketing Behavior and Executive Action, Irwin, Homewood,
IL.
Anderson (1995), ”Relationships in Business Markets: Exchange Episodes, Value
Creation, and Their Empirical Assessment”, Journal of the Academy of
Marketing Science, 23 (4), 346-350.
Anderson, J.C. and Gerbing, D.W. (1991), ”Predicting the Performance of Measures
in a Confirmatory Factor Analysis With a Pretest Assessment of Their
Substantive Validities”, Journal of Applied Psychology, Vol. 76, pp. 732-740.
Anderson, J.C., Jain, C. and Chintagunta, P.K. (1993), ”Customer Value Assessment
in Business Markets”, Journal of Business-to-Business Marketing, Vol. 1, No. 1,
pp. 3-29.
Cannon, J. and Homburg, C. (2001), ”Buyer-Supplier Relationships and Customer
Firm Costs”, Journal of Marketing, Vol. 65, pp. 29-43.
Churchill, G.A. (1982), ”A Paradigm for Developing Better Measures of Marketing
Constructs”, Journal of Marketing Research, Vol. 16, pp. 64-73.
Eggert, A. and W. Ulaga (2001) ”Customer-Perceived Value: A Substitute for
Satisfaction in Business Markets?”, Journal of Business and Industrial
Marketing, forthcoming.
Gerbing, D. and Anderson, J. (1988), ”An Updated Paradigm for Scale Development
Incorporating Unidimensionality and its Assessment”, Journal of Marketing
Research, Vol. 25, pp. 186-192.
Holbrook, M.B. (1994), ”The Nature of Customer Value”, In: Rust, R.T. and Oliver,
R.L., Service Quality: New Directions in Theory and Practice, Thousand Oaks:
Sage Publications. Thousand Oaks, Ca.
Houston, F.S. (1987), ”Marketing and Exchange” Journal of Marketing, Vol. 51,
October, pp. 3-18.
Kortge, G.D. and Okonkwo, P.A. (1993), ”Perceived Value Approach to Pricing”,
Industrial Marketing Management, Vol. 22, pp. 133-140.
-18-
Kotler, P. (1972), ”A Generic Concept of Marketing”, Journal of Marketing, Vol. 36,
April, pp. 46-54.
Perkins, W.S. (1993), ”Measuring Customer Satisfaction”, Industrial Marketing
Management, Vol. 22, pp. 247-254.
Monroe, K.B. (1991), Pricing – Making Profitable Decisions, McGraw Hill, New
York.
Nunnally, J. (1978), Psychometric Theory, 2nd ed., New York.
Parasuraman, A. (1997) ”Reflections on Gaining Competitive Advantage Through
Customer Value”, Journal of the Academy of Marketing Science, Vol. 25, No.
2, pp.154-161.
Patterson, P. and Spreng, R. (1997), “Modelling the Relationship Between Perceived
Value, Satisfaction and Repurchase Intentions in a Business-to-Business Service
Context: An Empirical Examination”, International Journal of Service Industry
Management, Vol. 8, No. 5, pp. 414-434.
Ravald A. and C. Grönroos (1996), ”The Value Concept and Relationship Marketing”,
European Journal of Marketing, Vol. 30, 19-30.
Ulaga, W. (2001), ”Customer Value in Business Markets: An Agenda for Inquiry”,
Industrial Marketing Management, Vol. 30 (4), May, 1-7.
Ulaga, W. and S. Chacour (2001), ”Measuring Customer-Perceived Value in Business
Markets: A Prerequisite for Marketing Strategy Development and
Implementation”, Industrial Marketing Management, forthcoming.
Walter, A.; T. Mueller and G. Helfert (2000), „The Impact of Satisfaction, Trust, and
Relationship Value on Commitment: theoretical Considerations and Empirical
Results“, IMP Conference Proceedings, Bath.
Zeithaml, V.A. (1988), ”Consumer Perceptions of Price, Quality, and Value: A
Means-End Model and Synthesis of Evidence”, Journal of Marketing, Vol. 52,
July, pp. 2-22.