Embed Size (px)
Citation preview
International Research Journal of Engineering and Technology (IRJET) e-ISSN: 2395 -0056
Volume: 02 Issue: 09 | Dec-2015 www.irjet.net p-ISSN: 2395-0072
© 2015, IRJET ISO 9001:2008 Certified Journal Page 1110
Developing an Application Tracing Utility for Mule ESB Application on
EL (Elastic Search, Log stash) Stack Using AOP
Mohan Bandaru, Amarendra Kothalanka, Vikram Uppala
Student, Department of Computer Science and Engineering, DIET College, Anakapalli, A.P, INDIA Professor, Department of Computer Science and Engineering, DIET College, Anakapalli, A.P, INDIA
Developer, Certified associate Mulesoft developer
---------------------------------------------------------------------***---------------------------------------------------------------------Abstract – A framework for detecting and recording
the flaws that happen during the usage of integration
solution using MULE ESB is designed and a library
functionality to perform this is discussed in this paper.
The main of this approach of this solution is to identify
the flaws and performance for every activity designed
as part of service in mule esb platform. The recorded
information can be stored at different levels of detail,
commonly called the logging levels. For some modules
more than others, it may be required to store more
detailed information about any error that arises during
its usage according to its importance. An integration
solution also needs to print the stack trace containing
the error information on to the log files when an error
occurs for the user to understand the nature of the
error. When dealing with legacy integration
applications, it is difficult to insert code. The proposed
and designed framework is tested with a web
application. The need of an Enterprise Service Bus (ESB)
has been a relentless need of the market; the bigger the
systems get after collaboration the failures of the ESB's
was inevitable. Things moved to more gravity when the
bulkiest of the systems like SAAS applications came into
picture, with the advent of this not of the efficiency but
also the factors like stability, reliability, resource
utilization were also of pivotal importance.
Key Words: mule esb, logging, mule notification,
anypoint platform.
1. Introduction
Mule ESB is a lightweight enterprise service bus (ESB) and integration platform which provides comprehensive application helps in integration for small businesses and large enterprises resources and allows developers to connect applications together easily and quickly, enabling for data exchange . The key advantage of an ESB is that it
allows different applications to communicate with each other by acting as a transit system for carrying data between applications within your enterprise or across the Internet. Mule ESB includes powerful capabilities..
One thing that sets Mule ESB unique apart from other
competing ESB offerings is that Mule does everything an
ESB is expected to do like orchestration, mediation,
routing, management, messaging, processing, etc. Mule
isn't just an ESB and it is also an integration platform that
allows to quickly creating elegant, enabling lightweight
integration architectures tailored to your specific use
scenario.
The Mule project focused on creating a stable, standards-
based framework and tools that make great integration
architecture simple. This provides Mule to leverage the
extensibility, unparalleled interoperability and flexibility
of open-source integration.
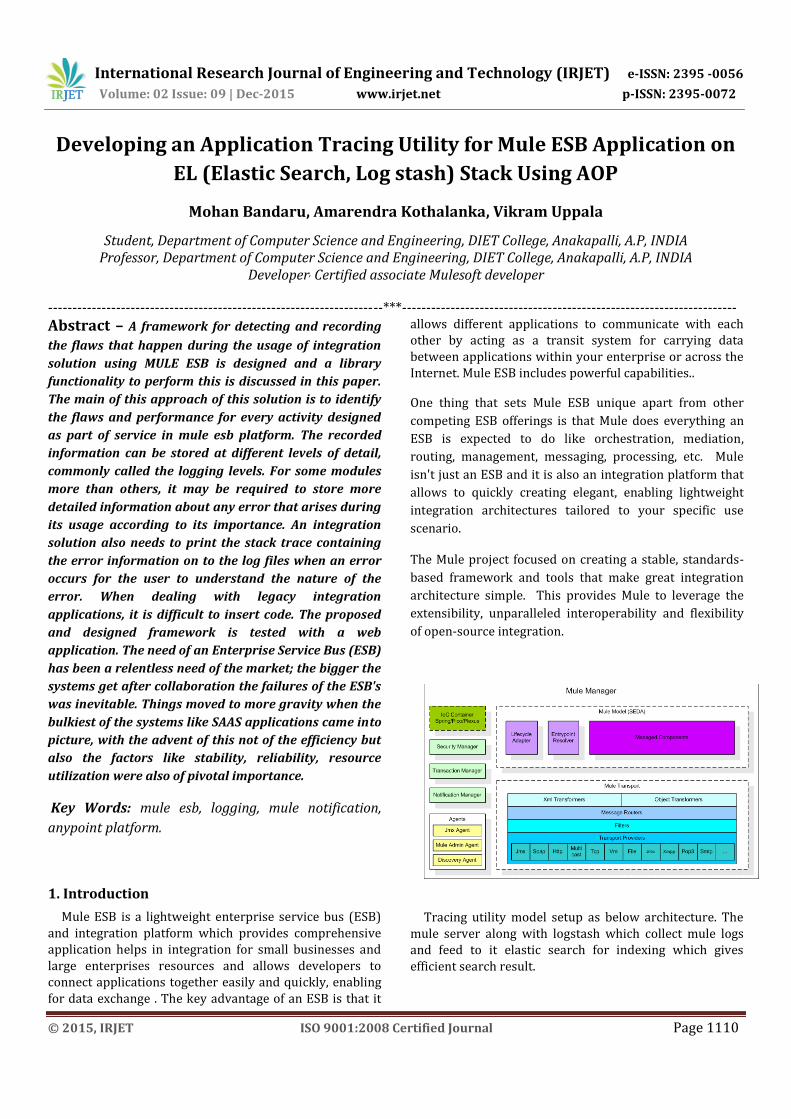
Tracing utility model setup as below architecture. The mule server along with logstash which collect mule logs and feed to it elastic search for indexing which gives efficient search result.
International Research Journal of Engineering and Technology (IRJET) e-ISSN: 2395 -0056
Volume: 02 Issue: 09 | Dec-2015 www.irjet.net p-ISSN: 2395-0072
© 2015, IRJET ISO 9001:2008 Certified Journal Page 1111
2. Mule tracing utility
The mule tracing utility jar built using the mule context
notification mechanism. The mule tracing utility JAR
contains the utility classes which handles the endpoint
notification Listeners, Message Processors listeners and
exception Notification Listeners. The custom written
reporter classes logs the information in specific format
like json or xml bases on the configuration parameter.
Each of mule flow components were traced with below
format for each individual component in the mule flow.
{
"flowName": "loggingsampleFlow",
"component": "endpoint.http.localhost.8082.log",
"messageID": "18f83f60-8966",
"timeStamp": "ThuNo12 23:22:10 IST 2015",
"payload": {.. },
"actionName": "response"
}
If there are any exceptions there was an exception tag
added as part of original message for respective
component.
This utility jar is used any mule project to generate log
tracing each component of flow. The additional
configuration required was adding the notification
listeners as part of spring beans where the listeners are
initialized during the server run time. A properties file
need to define in mule project which contains the
properties like enabling or disabling logging for respective
mule category of elements like endpoint, message
processors, enabling payload and the log format.
checkEndpointLogging=true
checkMessageProcessorLogging=true
checkPayloadLogging=true
loggingFormatType=json or xml
With configuring the log4j properties the logs are
generated in specific format using the
RollingFileAppender.
3. LOGSTASH usage in collecting mule logs
The mule log file collected by logstash collector and it
stored in Logstash storage or external storage system
which can be configured in Logstash config file. The
Logstash composed of three stages of event processing
and the pipeline include the stages from inputs → filters →
outputs. Inputs will generate events, filters modify them
on conditions, and outputs ship them elsewhere. Inputs
and outputs stages support codecs that enables to encode
or decode the data as it enters or exits the pipeline
without having to use a separate filter. We use inputs to
get data into Logstash. Some of the more commonly-used
inputs are file, syslog, redis, lumberjack processes events
sent in the lumberjack protocol which was termed as
logstash-forwarder. Grok is one best component in
Logstash to parse unstructured log data into something
structured and query-able.
Outputs are the one which stand as final phase in the
series of processing steps of the Logstash pipeline. An
event passes through multiple outputs, but once every
output is being processed, the event has finished as part of
its execution. The basic stream filters that can operate as
part of an input or output are Codecs. Codecs facilitate
easy separation of the transport of mule log information
from the serialization process. Edit Events of fault
tolerance are passed from stage to stage via internal
queues implemented with a Ruby Sized Queue. A Sized
Queue holds maximum number of items bases on the
capacity it hold. When the queue reaches its maximum
limit, all writes to the queue are blocked. These internal
queues are not intended for storing messages long-term.
The small queue sizes specifies that the Logstash simply
holds by blocking and stalls for a heavy load or temporary
pipeline issues. The approach is to have either to have an
unlimited queue, as it has the capability to grow
unbounded and eventually exceed memory. In most of the
International Research Journal of Engineering and Technology (IRJET) e-ISSN: 2395 -0056
Volume: 02 Issue: 09 | Dec-2015 www.irjet.net p-ISSN: 2395-0072
© 2015, IRJET ISO 9001:2008 Certified Journal Page 1112
cases, rejecting the messages outright is equally not
acceptable. An output has a chance to fail or can have
problems due to downstream issues, include possible
cases such as a permissions problems, full disk, service
outages or temporary network failures. Most outputs tries
for redelivery to ship events affected by the failure.
INPUT:
input { file{ path => "\testing-tracing-utility\logs\loggingsample.log" type => "xmlapptestlogs" } }
FILTERS:
filter {
if [message] =~ /^.*messageID.*$/ {
grok {
match => ["message",
"<messageID>%{DATA:messageID}</messageID>"]
match => ["message", "\"messageID\":
\"%{DATA:messageID}\","]
}
}
if [message] =~ /^.*ExecptionCause.*$/ {
grok {
match => ["message",
"<ExecptionCause>%{DATA:execptionCause}</Execption
Cause>"]
match=>["message","\"ExecptionCause\":
\"%{DATA:execptionCause}\""]
}
}
ruby {
code=>"event['@timestamp'] =
event['@timestamp'].localtime() "
}
multiline {
type => "xmlapptestlogs"
pattern => "^%{TIMESTAMP_ISO8601}"
negate => true
what => "previous"
}
}
Logstash specially used for managing events and mule esb
logs. It provides an integrated framework for log
collection, centralization, parsing, storage and search. It
helps in shipping generated mule esb logs from many
types of sources, parse them, get the right timestamp,
index them, and store them. Logstash is free and open
source. It has large collection of filters that allows
modifying, manipulating and transforming those log
events and extracting the information need from these log
events to give them context.
Below output configuration depicts the elastic search
configuration.
OUTPUT:
output {
elasticsearch {
host => 'localhost'
protocol => "http"
port => "9200"
index => 'mohanlogs'
}
}
4. ELASTIC Search Engine
Elastic Search is based on lucene and it is an open source,
Restful search engine and distributed. It is easy to
configure and start working with it. Some of the special
functionality of elastic search including distributed the
aggregated results of search performed on different
shards and indices, the Schema less a document oriented.
Supports JSON format, mapping automatic types is
supported. REST interface include faceted Search,
replication, fail over and distributed nature provides
inbuilt fail over.
Elastic search is a querying tool. It is capable of perform
some other ingenious tasks, but at its core implementation
International Research Journal of Engineering and Technology (IRJET) e-ISSN: 2395 -0056
Volume: 02 Issue: 09 | Dec-2015 www.irjet.net p-ISSN: 2395-0072
© 2015, IRJET ISO 9001:2008 Certified Journal Page 1113
it is composed of paddle through text information,
returning text or statistical analyses of a entirety of text.
cluster.name: elasticsearch_test
node.name: "Mohan"
node.master: true
Elastic search provides the indexing, storage and
searching functionality of the ELK stack. Elasticsearch
allows to query on the log data at a speed and at a scale
search capability never before possible. It is used for full
text search, search structured and performing analytic s.
Elasticsearch is aware of this structure and the JSON
format is hierarchical in data. Beyond searching, simple
Elasticsearch can also apply ranking algorithms on result
and calculate aggregate statistics across search results.
5. Experimentation and Results
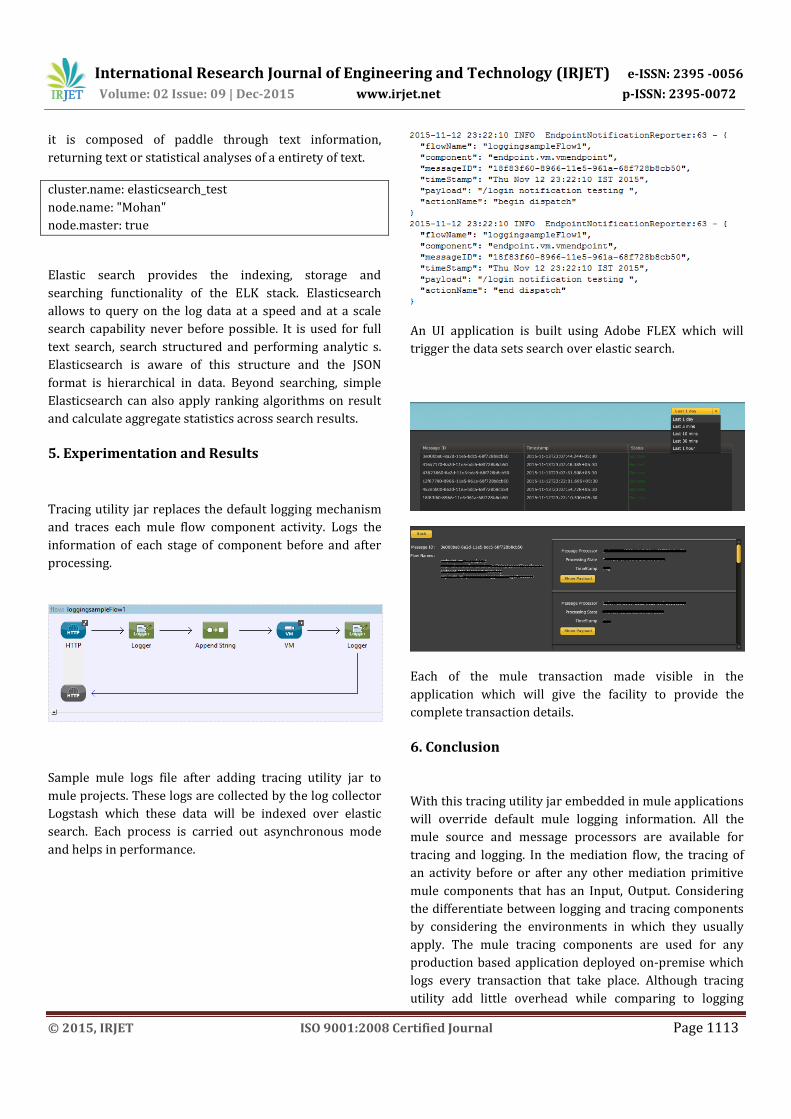
Tracing utility jar replaces the default logging mechanism
and traces each mule flow component activity. Logs the
information of each stage of component before and after
processing.
Sample mule logs file after adding tracing utility jar to
mule projects. These logs are collected by the log collector
Logstash which these data will be indexed over elastic
search. Each process is carried out asynchronous mode
and helps in performance.
An UI application is built using Adobe FLEX which will
trigger the data sets search over elastic search.
Each of the mule transaction made visible in the
application which will give the facility to provide the
complete transaction details.
6. Conclusion
With this tracing utility jar embedded in mule applications
will override default mule logging information. All the
mule source and message processors are available for
tracing and logging. In the mediation flow, the tracing of
an activity before or after any other mediation primitive
mule components that has an Input, Output. Considering
the differentiate between logging and tracing components
by considering the environments in which they usually
apply. The mule tracing components are used for any
production based application deployed on-premise which
logs every transaction that take place. Although tracing
utility add little overhead while comparing to logging

International Research Journal of Engineering and Technology (IRJET) e-ISSN: 2395 -0056
Volume: 02 Issue: 09 | Dec-2015 www.irjet.net p-ISSN: 2395-0072
© 2015, IRJET ISO 9001:2008 Certified Journal Page 1114
components for data collection and storage. Their design
is more performance-oriented for production use.
One benefit for all mule component tracing and logging
mechanisms are that the process can completely enable it
completely enables or disable it at runtime without the
involvement of the development environment. This makes
it applicable for test server or production server
environments.
The logstash log collector collects the mule integration
process logs. It is responsible for ingesting data, every
time new information of log will be collected at regular
interval of time instantly. Logstash act as a log collector,
shipper and processor. The logs are indexed over elastic
search component. The log analysis will be show over a
web application built using Flex.
7. References
[1] https://www.mulesoft.com/resources/esb/what-mule-esb#sthash.bbhGdGZZ.dpuf [2]http://www.mulesoft.org/documentation-3.2/display/MULEUSER/Architecture+Guide. [3] www.mulesoft.com. [4] http://www.javaworld.com/article/2072359/ java-web-development/capture-the-benefits-of-asynchronous-logging.html. [5] https://www.elastic.co/guide/en/logstash/ current / pipeline.html. [6]http://www.adobe.com/devnet/flex/quickstarts/ coding_mxml_as.htmls
BIOGRAPHIES
Mohan Bandaru M.Tech student, Dadi Institute of Engineering & Technology, CSE Department. Certified Associate Mulesoft Developer
Amarendra Kothalanka Vice Principal & Professor, Department of CSE, Dadi Institute of Engineering & Technology, NH-5, Anakapalle, Visakhapatnam-531002
Vikram Uppala Certified Associate Mulesoft Developer