Embed Size (px)
Citation preview

DEVELOPING AN EQUITY SCORECARD FOR YOUR
COLLEGE
Terri Manning and Leon Hill
Strategic Data and Technology Coaches
Achieving the Dream

IN THIS SESSION…….
We will explore:
I. The differences between equity and equality.
II. The difference between a scorecard and a dashboard and the implications of each.
III. A process to determine key metrics and equity groups for your college.
IV. Options for managing a scorecard and those implications.

WHAT IS EQUITY?Based in Fairness and Justice
DeAnza College
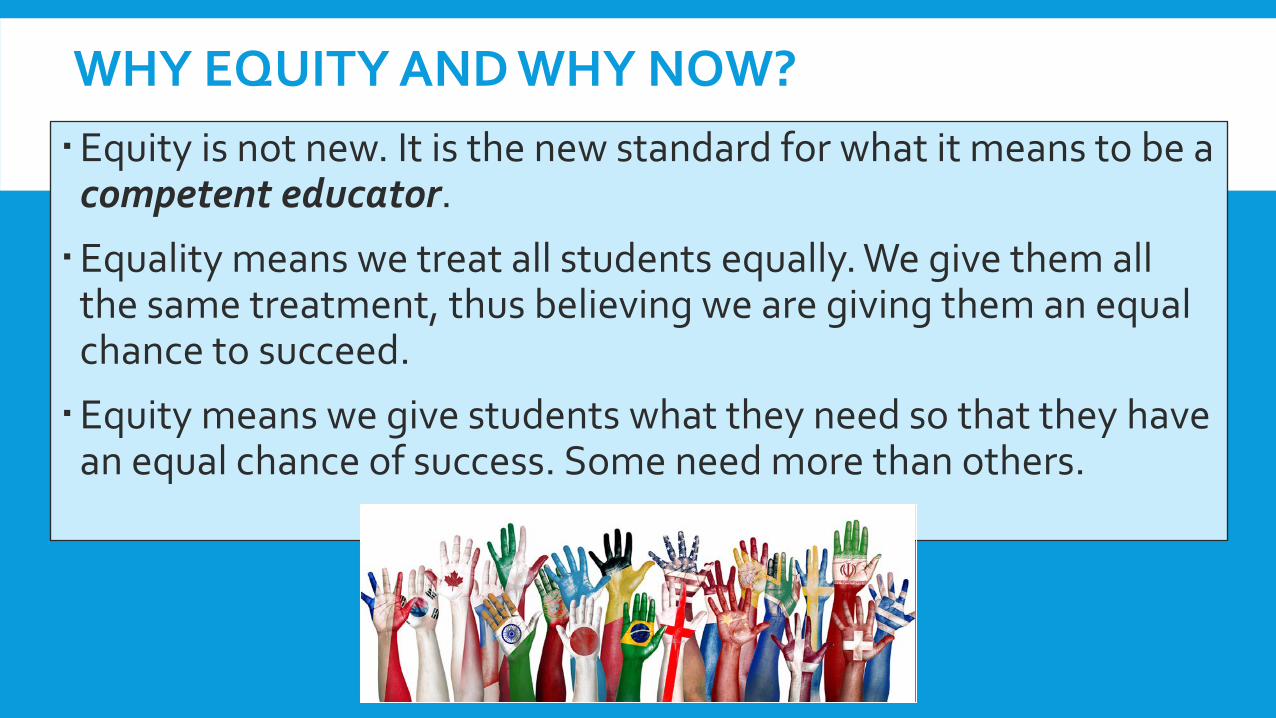
WHY EQUITY AND WHY NOW?Equity is not new. It is the new standard for what it means to be a
competent educator.
Equality means we treat all students equally. We give them all the same treatment, thus believing we are giving them an equal chance to succeed.
Equity means we give students what they need so that they have an equal chance of success. Some need more than others.

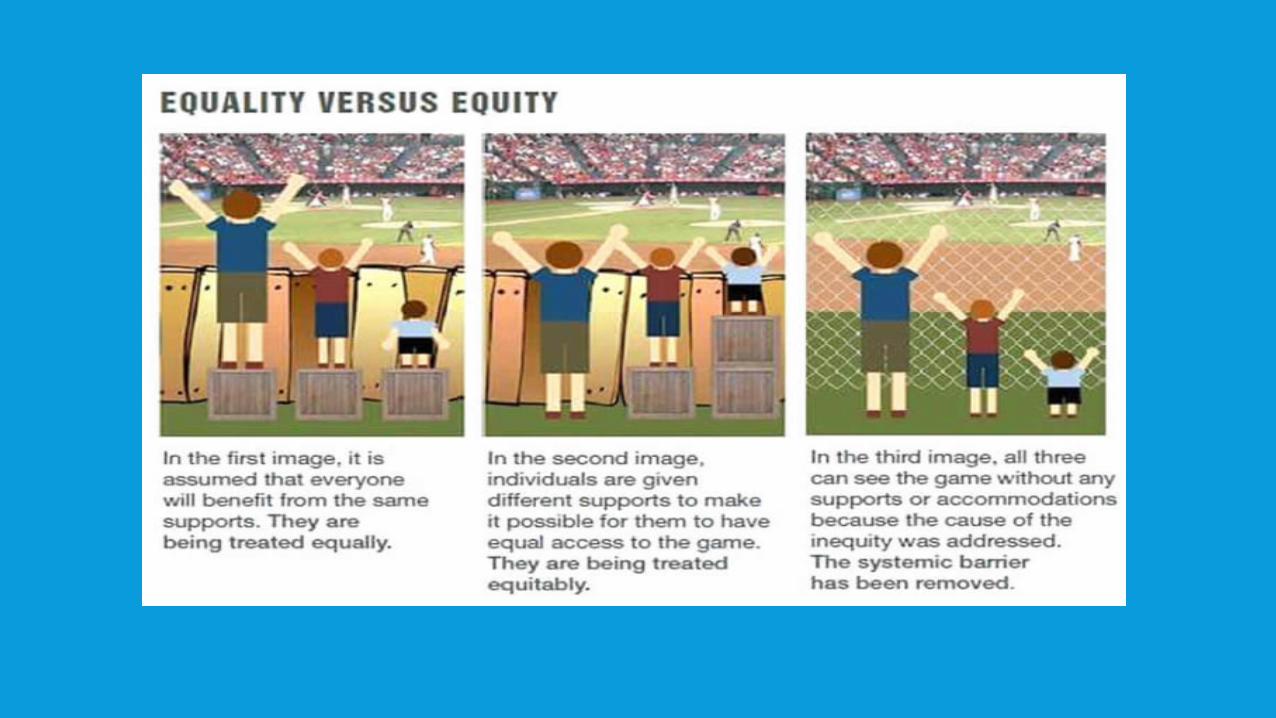
THE DIFFERENCE IN EQUITY AND EQUALITYEquality = everyone is treated the same …as in all (men) are created
equal….. Equality sets up the powerful expectation that
everyone deserves the same opportunity to influence the course of their lives, and to
benefit from the fruits of a good society.
Equity = everyone has different needs and requirements and should be treated
accordingly. It takes into account the idea of quality or ideal treatment – of being
just, impartial, and fair. In order for students to have an equal opportunity
and the potential to obtain equal benefits in life, they need additional help or
assistance at the beginning or at some point along the way.

PROBLEM WITH EQUITY IN HIGHER EDUCATION
It upsets people that we select out certain groups and give them “preferential treatment.” Is that what we are really doing?
We already do this with developmental education and disabilities services. Those faculty /staff are trained to work with students who have developmental delays and learning difficulties.
We understand that these students need extra help to have as “equal” a chance of success as other students. Without help, they will not succeed. But who else needs focused services?

EQUITY VS. EQUALITY
I am a parent of three children. During elementary school, two of those children do very well in school. The third has great difficulty with math and reading.
To treat them with “equality,” I would spend the same amount of time and energy on homework with each child.
To treat them “equitably,” I would give the two children doing well in school the time and energy it takes for them to continue doing well. I would get a tutor for the third child, spend extra time with his teacher discussing ways to help him and spend many more hours helping him learn and complete his homework. I am trying to improve his skills so he has an equal chance of success as do my other two children.

Equity is difficult because we don’t
always know what certain
groups of students need. It
is based in fairness and
inclusion.


DISCUSSIONWhy is equity important at your college?
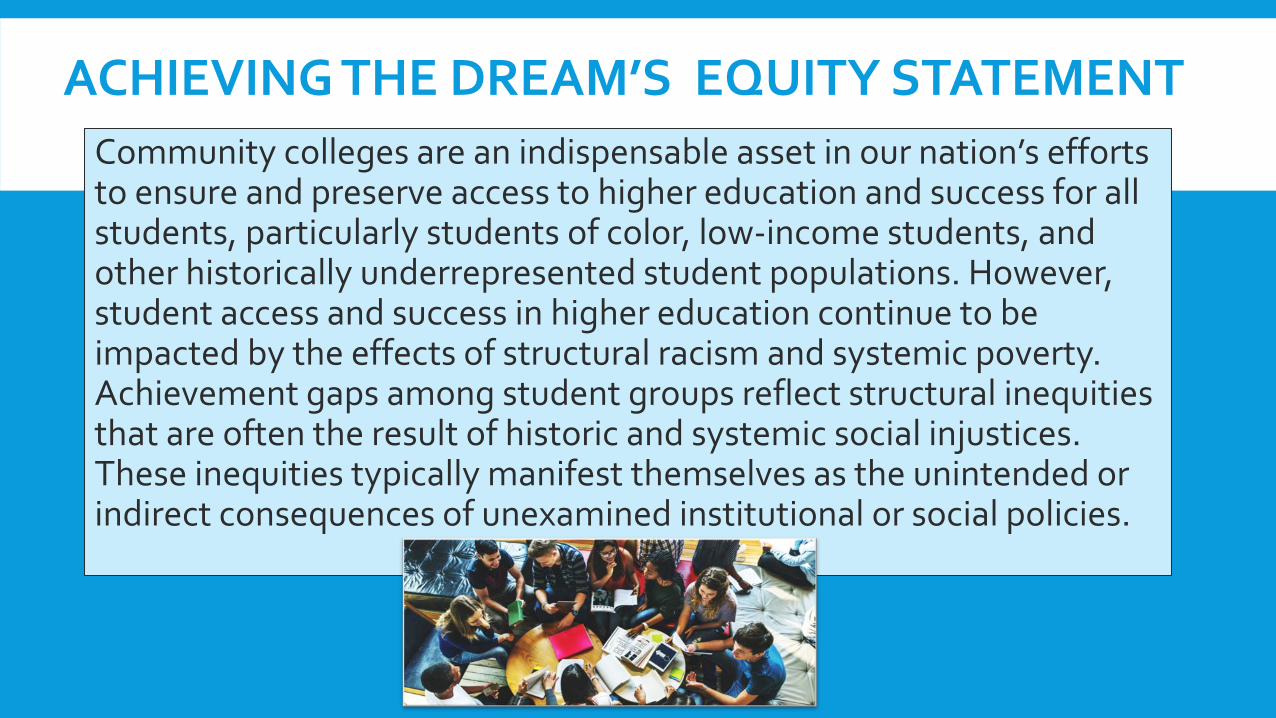
ACHIEVING THE DREAM’S EQUITY STATEMENTCommunity colleges are an indispensable asset in our nation’s efforts to ensure and preserve access to higher education and success for all students, particularly students of color, low-income students, and other historically underrepresented student populations. However, student access and success in higher education continue to be impacted by the effects of structural racism and systemic poverty. Achievement gaps among student groups reflect structural inequities that are often the result of historic and systemic social injustices. These inequities typically manifest themselves as the unintended or indirect consequences of unexamined institutional or social policies.

HOW DO WE MONITOR OUR EQUITY OUTCOMES/METRICS?

KEY PERFORMANCE INDICATORS
KPIs evaluate the success of an organization or of a particular activity (such as projects, programs, products and other initiatives) in which it engages.
They help managers gauge the effectiveness of various functions and processes important to achieving their goals.
Typically linked to the strategic goals of the college.
They use both leading and lagging indicators. Lagging tell you how you have done. Leading forecasts what might happen.
Can be part of a scorecard or dashboard.
Some Colleges Place Their KPIs on a
Dashboard


Some Colleges Place Their KPIs on a Scorecard


Dashboard Scorecard
Is used for… performance measurement / monitoring
performance management
As a measurement tool is… metric KPI (Metric + Target).
Measure is linked tocollege objectives… doesn’t link links
It measures… performanceprogress (the current
value versus the target value)
DIFFERENCE BETWEEN A DASHBOARD AND A SCORECARD

DIFFERENCE BETWEEN A DASHBOARD AND A SCORECARD
Dashboard Scorecard
It is updated… in real-time periodically (each semester or annually)
It focuses on… operational (short-term) goals strategic (long-term) goals
Its purpose is to… give a high-level idea of what is happening in the institution
plan and execute a strategy, identify why something is
happening and what can be do about that
Its helps… visualize the performance to understand the current state
align KPIs, objectives, and actions to see the connection between
themIn an automobile it
is…automobile dashboard (shows how
your car is operating)GPS (shows when and how you
will arrive?)

WITH BOTH YOU WANT TO USE LEADING AND LAGGING INDICATORS
We want to increase the success rates in college-level math (a lagging indicator). What would be leading indicators that pass rates might increase this term?Attendance in class is up over last term (fewer
absences)Participation in the math lab, supplemental instruction
and tutoring is up over last term.At mid-term, withdrawal rates are 20% lower than last
term.

LEADING AND LAGGING INDICATORS
Graduate
Retained term to term
Complete gen ed
Complete major courses
Retained year to year
Accumulate credit
• The fundamental thing students must do is pass courses with successful grades (A-C).
• They must pass English and math to move on.
• They must complete the gen ed core.• They must accumulate credits in their
major with passing grades.• They must return or persist.• Finally they graduate.

KPIS, DASHBOARDS AND SCORE CARDS
Can be a teaching tool for the college.Will stimulate discussion and action.Will let a college know where they have issues that need
attention.Should point them toward solutions.
Seriously consider what you include as metrics. Include an equity lens with your scorecard.

LET’S SPEND A FEW MINUTES ON STUDENTS WITH INEQUITIES
This is a hard and courageous conversation to have.
What are some characteristics or conditions students enter with that create barriers to learning and academic success?
Faculty say in the first few weeks ”this student is going to have trouble in my class.”
If you had a magic wand, what would you have available to students that you don’t currently have or have enough of?

One College Selected These Groups• Minority students, in particular, African American and Latino students• Males, especially minority males• Low income students (those on Pell)• Low income students with no financial support from their families
(zero EFC)• Underprepared students who have either low high school GPAs, place
into developmental coursework or arrive at the college with GEDs• Students with disabilities• Students from high poverty neighborhoods• Veterans and Dependents of Veterans

If you want to develop an equity score card that was supported and adopted by your college, how would you get started?
Part one in the process is selecting groups with inequities.
SOME SUGGESTIONS
1. Become knowledgeable about equity and the conversations about it in higher education.
2. Select a few concerned and appropriate people to work with you in the beginning.
3. Disaggregate a little data (maybe race, age, gender and Pell status) and create a very brief report.
4. Ask to present it to the senior leadership and educate them about why equity matters.

CONTINUED
5. Ask to form an equity committee and begin collecting feedback from faculty, staff and students.
6. Ask about students that need additional help, students that appear to be struggling in class, students that are in and out in the first three weeks. Who has inequities?
7. Create a list of groups to evaluate and consider what data you actually have available to you (1st gen?, family income?).

DISCUSSION
What are some key metrics and equity groups at your college that you should be assessing?

PART TWO IS HOW TO SELECT METRICS
What would give you the most useful data at your college?

This student just progressed through your college and graduated in four years. If you examined what she did each term and year, what would you find?

HERE IS WHAT YOU WOULD FIND
She had a goal, was motivated.
She withdrew from very few courses.
She consistently took 6-9 credits a term and passed all of them.
She saw a counselor/advisor regularly.
She didn’t change majors very many times if at all.
She made mostly A-C grades.
She returned each term – persistent.
She didn’t take very many if any developmental courses.
She made connections at the college with new/old friends, faculty, staff and program content.

GETTING IT RIGHT MATTERS
Select the right progression metrics for your college.
Select the groups who enter with inequities.
Here is an example.

Here are Some Progression Metrics
First Term Measures
1. Students with a cumulative GPA of 2.0 or greater at the end of their first term;2. Students who have earned zero credits at the end of the first term (dropped out or failed all
courses);3. Students who complete 80% of the courses they attempt with A-C, P grades;4. Students who complete 6, 9 and 12 credits in their first term.
First Year Measures
1. Students who return in the spring after their first fall term (fall-to-spring retention);2. Students who accumulates 12, 18, and 24 credits in their first year;3. Students who complete College-level math in their first year;4. Students who complete College-level English in their first year;
Second Year Measures
1. Students who return the next year after their first fall term (fall-to-fall retention);2. Students who complete 24, 36 and 48 credits by the end of their second year
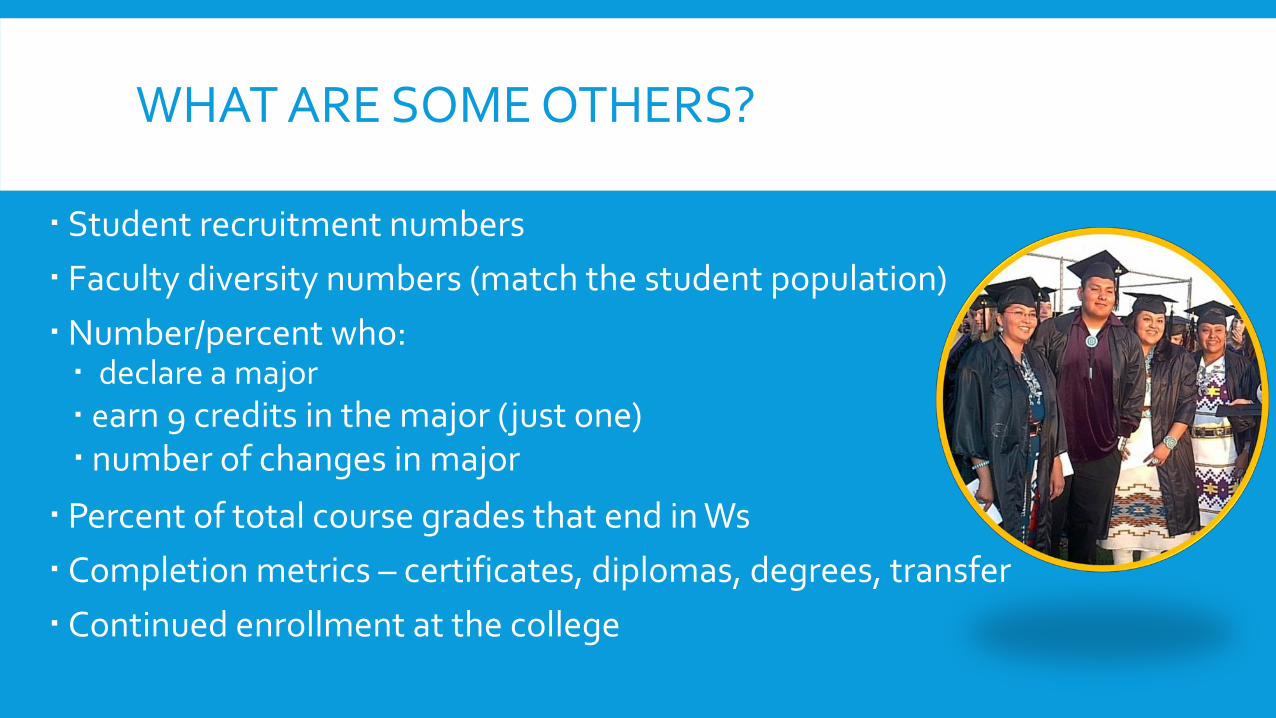
WHAT ARE SOME OTHERS?
Student recruitment numbers Faculty diversity numbers (match the student population)Number/percent who: declare a major earn 9 credits in the major (just one) number of changes in major
Percent of total course grades that end in Ws Completion metrics – certificates, diplomas, degrees, transfer Continued enrollment at the college
Selecting Metrics - Another Process….
1. Back to the drawing board with suggestions and examples. What would tell us the most at this college?
2. Start with a potential list of progression metrics.3. Pull data and begin compiling your report.4. Hold an informational event such as a data summit or a
gallery walk to present the preliminary data. Get feedback, take suggestions.
5. Remember this is an iterative process.

THE BENEFITS OF DISAGGREGATING DATA AND LOOKING AT SPECIFIC MEASURES
72%
28%
fall to spring all students
retained not retained
All students 72%Full-time students 86%Students with 24+ credits 74%Part-time students 62%New students 72%New college-ready students 72%Multiple measures students 76%Students taking all courses online 56%Developmental students 71%

Associates Degree Completers (4 Years) 91%Academically and Economically Prepared 82%
White Females 77%Veterans 77%
White Students 74%White Males 71%
Females 68%All New Students 65%
Latina Females 64%Males 62%
Students with Disabilities 62%Latino Students 61%
Latino Males 58%High Poverty Zip Codes 56%
Students on Pell 55%African American Females 54%
Students on Pell with Zero EFC 52%African American Students 51%
African American Males 48%Developmental Students 46%
Students with GEDs 46%Dependents of Veterans 45%
HS Grads GPA <2.0 32%
The percentage of new students from fall 2015 who had a grade point average of 2.0 or greater at the end of the first term.
GPA 3.0>, not on Pell
Highest to lowest 45% difference.

Associates Degree Completers (4 Years) 1%Academically and Economically Prepared 6%
Veterans 7%White Females 9%White Students 10%
White Males 10%All New Students 11%
Females 11%Latina Females 11%
Males 12%Latino Students 12%
Dependents of Veterans 12%African American Females 13%
Latino Males 13%Students on Pell 13%
Students on Pell with Zero EFC 14%High Poverty Zip Codes 14%
Developmental Students 14%African American Students 15%Students with Disabilities 15%African American Males 16%
Students with GEDs 18%HS Grads GPA <2.0 19%
The percentage of new students from fall 2015 who had accumulated zero credits at the end of their first term (all Fs or Ws).
Highest to lowest 12% difference.

Associates Degree Completers (4 Years) 56% 71%Academically and Economically Prepared 50% 68%
Latina Females 36% 60%Students with Disabilities 36% 48%
Latino Students 35% 58%Latino Males 33% 55%
White Students 33% 54%White Males 33% 53%
Dependents of Veterans 33% 58%White Females 32% 54%
All New Students 29% 61%Females 29% 52%
Males 29% 50%Students on Pell 29% 54%
Veterans 27% 59%Students on Pell with Zero EFC 25% 51%
High Poverty Zip Codes 23% 44%African American Students 19% 43%African American Females 19% 44%
African American Males 19% 41%Developmental Students 13% 47%
Students with GEDs 11% 34%HS Grads GPA <2.0 8% 34%
The percentage of new students from fall 2015 who completed math and English in their first year.
Highest to lowest 28% and 26% difference.

Associates Degree Completers (4 Years) 96% 93%Academically and Economically Prepared 76% 53%
Latina Females 78% 56%Latino Students 78% 55%
Students with Disabilities 83% 54%Latino Males 77% 53%
White Students 72% 48%White Males 73% 48%
Males 73% 47%All New Students 73% 46%
Females 73% 46%Veterans 78% 46%
High Poverty Zip Codes 69% 45%Developmental Students 72% 45%
White Females 71% 44%Students on Pell 78% 44%
Students on Pell with Zero EFC 77% 43%African American Males 70% 39%Dependents of Veterans 73% 39%
African American Students 70% 38%African American Females 70% 38%
HS Grads GPA <2.0 67% 37%Students with GEDs 62% 29%
The percentage of new students from fall 2015 who returned from fall to spring and from fall to fall.
Highest to lowest 16% and 27% difference.

ONCE YOU HAVE DATA
Everything will not be fine!Will you post the scorecard and do nothing?What’s next (the hardest part)?
DISCUSSION
Discuss something difficult your college did that required everyone’s attention and focus.What were the characteristics of the process that moved it forward?

WHAT WILL YOU SUGGEST TO BEGIN THE DIFFICULT EQUITY WORK AT YOUR COLLEGE?
Look at best practices.
Consider a council of advocate.
Set benchmarks and collect data on your metrics as often as you can (each term or each year).
Use your data team for more than your ATD work. Institutionalize it with the scorecard being one of its tasks.
Don’t forget professional development.

DISCUSSION
How will creating a scorecard and/or dashboard at your college help with equality among all students? Who needs to be involved?
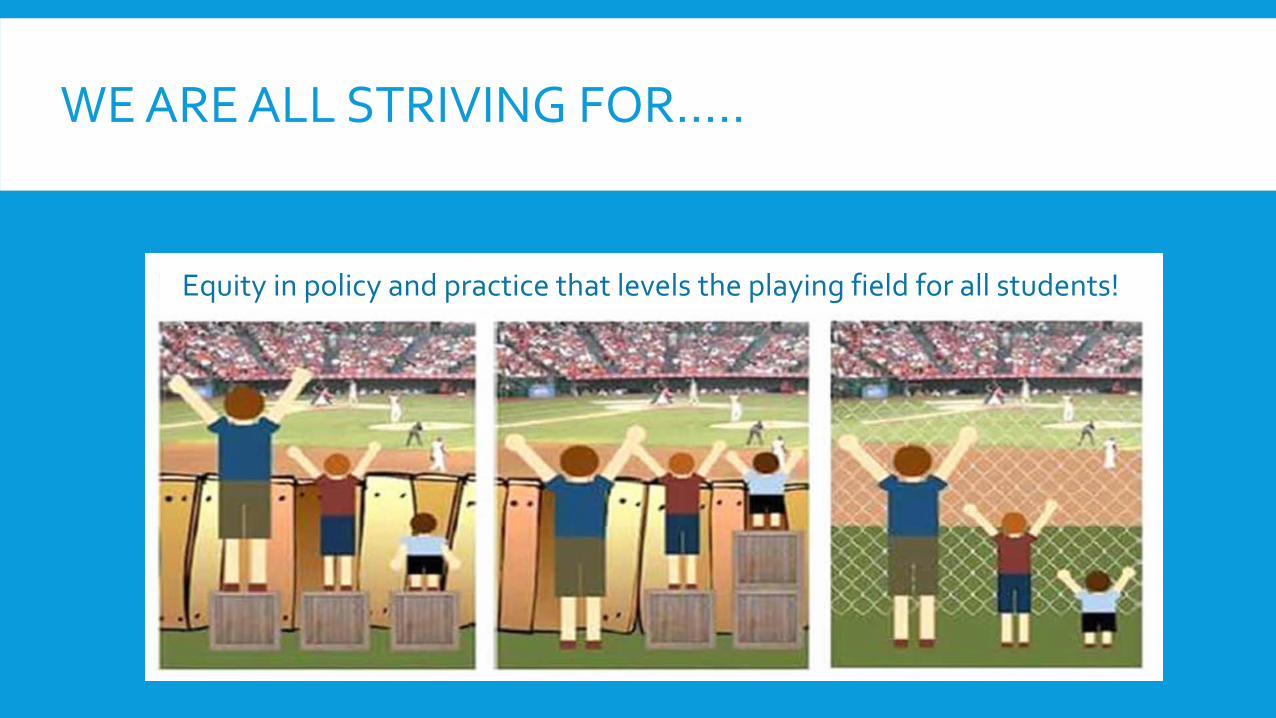
WE ARE ALL STRIVING FOR…..
Equity in policy and practice that levels the playing field for all students!.

RESOURCE

QUESTIONS?
Questions


![Developing A Balanced Scorecard Approachcolinmayfield.com/public/PDF_files/elearning_presentation[1].pdf · Developing a Balanced Scorecard Approach to Measure the Performance of](https://img.pdfslide.net/doc/110x75/5fc7332bbf89972a5425c3c5/developing-a-balanced-scorecard-a-1pdf-developing-a-balanced-scorecard-approach.jpg)