Embed Size (px)
Citation preview
6363636363
Research Objectives
The ultimate goal of this research is to improve highway system perfor-mance in earthquakes by evaluating the effectiveness of retrofitting bridgeswith column jacketing. The objective of the study is to determine if steeljacketing increases the ductility capacity of bridge columns and henceimproves the fragility characteristics of the bridge. Analytical fragility curvesare used to adjust the empirical fragility curves obtained for theunretrofitted bridges using seismic damage data collected following pastearthquakes. The adjustment was carried out by increasing the medianvalues of the empirical curves through comparison with the median val-ues of the corresponding fragility curves obtained analytically, both beforeand after being retrofit.
Developing Fragility Curves for Concrete BridgesRetrofitted with Steel Jacketing
by Masanobu Shinozuka and Sang-Hoon Kim
Several recent destructive earthquakes, particularly the 1989 LomaPrieta and 1994 Northridge earthquakes in California, and the 1995
Kobe earthquake in Japan, have caused significant damage to highway struc-tures. The investigation of this damage gave rise to a serious review ofexisting seismic design philosophies and led to extensive research activi-ties on the retrofit of existing bridges as well as the development of seis-mic design methods for new bridges. This study presents an approach tothe fragility assessment of bridges retrofitted by steel jacketing of columnswith substandard seismic characteristics.
This study presents the results of an in depth fragility analysis of typicalbridges in California that have been strengthened using steel jacketing ofbridge columns. A computer code was developed and used to calculatethe bilinear hysteretic parameters of the bridge columns before and aftersteel jacketing. Nonlinear dynamic time history analysis was used to evalu-ate the responses of the bridges before and after column retrofit undersixty ground acceleration time histories developed for the Los Angelesarea by the Federal Emergency Management Agency (FEMA) SAC (SEAOC-ATC-CUREe) steel project (Somerville et al., 1997). Monte Carlo simula-tion was used to study fragility curves represented by lognormaldistribution functions with two parameters (fragility parameters consist-ing of median and log-standard deviation) and developed as a function of
Federal HighwayAdministration andCaltrans
Masanobu Shinozuka,Distinguished Professorand Chair, Sang-HoonKim, Research Associate,Jin Hak Yi, VisitingResearch Associate (fromthe Korea AdvancedInstitute of Science andTechnology) and ShigeruKushiyama, VisitingResearch Scholar (fromHokka-Gakuen University,Japan), Department ofCivil and EnvironmentalEngineering, University ofCalifornia, Irvine
6464646464
AnalAnalAnalAnalAnalytical frytical frytical frytical frytical fraaaaagggggility curility curility curility curility curvvvvves computed fes computed fes computed fes computed fes computed for vor vor vor vor varararararious damaious damaious damaious damaious damaggggge statese statese statese statese statesin this studin this studin this studin this studin this study maky maky maky maky make intuitive intuitive intuitive intuitive intuitive sense re sense re sense re sense re sense relativelativelativelativelative to the bre to the bre to the bre to the bre to the bridgidgidgidgidge’s de-e’s de-e’s de-e’s de-e’s de-sign,sign,sign,sign,sign, r r r r retretretretretrofofofofofit and perfit and perfit and perfit and perfit and perfororororormance in past earmance in past earmance in past earmance in past earmance in past earthquakthquakthquakthquakthquakes.es.es.es.es. This rThis rThis rThis rThis re-e-e-e-e-searsearsearsearsearccccch prh prh prh prh prooooovides infvides infvides infvides infvides infororororormation necessarmation necessarmation necessarmation necessarmation necessary to the design pry to the design pry to the design pry to the design pry to the design profofofofofessionessionessionessionessionfrfrfrfrfrom the perfom the perfom the perfom the perfom the perfororororormance design permance design permance design permance design permance design perspectivspectivspectivspectivspective,e,e,e,e, and pa and pa and pa and pa and pavvvvves the wes the wes the wes the wes the waaaaayyyyyfffffor ensuing analor ensuing analor ensuing analor ensuing analor ensuing analysis to deterysis to deterysis to deterysis to deterysis to determine the lemine the lemine the lemine the lemine the levvvvvel of enhancement ofel of enhancement ofel of enhancement ofel of enhancement ofel of enhancement oftrtrtrtrtransporansporansporansporansportation netwtation netwtation netwtation netwtation networorororork perfk perfk perfk perfk perfororororormance due to the rmance due to the rmance due to the rmance due to the rmance due to the retretretretretrofofofofofit.it.it.it.it. ThisThisThisThisThisrrrrresearesearesearesearesearccccch is thus benefh is thus benefh is thus benefh is thus benefh is thus beneficial to bricial to bricial to bricial to bricial to bridgidgidgidgidge enge enge enge enge engineerineerineerineerineering,ing,ing,ing,ing, tr tr tr tr transporansporansporansporansporta-ta-ta-ta-ta-tion engtion engtion engtion engtion engineerineerineerineerineering and manaing and manaing and manaing and manaing and managggggement prement prement prement prement profofofofofessionals.essionals.essionals.essionals.essionals.
peak ground acceleration (PGA).Fragility curves of the bridges be-fore and after column retrofit werecompared and the results show thatsteel jacketing significantly im-proved the seismic performance ofbridges.
Retrofit of theConcrete Columns
Concrete columns commonlylack flexural strength, flexural duc-tility and shear strength, especiallyin the bridges designed under oldercodes. The main causes of thesestructural inadequacies are lapsplices in critical regions and/orpremature termination of longitu-dinal reinforcement.
A number of column retrofit tech-niques, such as steel jacketing, wirepre-stressing and composite mate-rial jacketing, have been developedand tested. Although advancedcomposite materials and othermethods have been recently stud-ied, steel jacketing is the most com-mon retrofit technique.
Steel Jacketing
An experiment was performed byChai et al., 1991 to investigate theretrofit of circular columns with
steel jacketing. In this experiment,for circular columns, two half shellsof steel plate rolled to a radiusslightly larger than the column arepositioned over the area to be ret-rofitted and are site-welded up thevertical seams to provide a continu-ous tube with a small annular gaparound the column. This gap isgrouted with pure cement. Typi-cally, the jacket is cut to provide aspace of about 50 mm (2 inches)between the jacket and any sup-porting member. This is to preventthe possibility of the jacket actinglike a compressing reinforcementby bearing against the supportingmember at large drift angles. Thejacket is effective only in passiveconfinement and the level of con-finement depends on the hoopstrength and stiffness of the steeljacket.
Moment-CurvatureRelationship
Confining Effect of TransverseReinforcement
Chai et al., 1991 also observedthat confinement of the concretecolumns can be improved if trans-verse reinforcement layers are
Li-Hong Shen, Caltrans
W. Phillip Yen, FederalHighway Administration
6565656565Developing Fragility Curves for Concrete Bridges Retrofitted with Steel Jacketing
placed relatively close togetheralong the longitudinal axis by re-straining the lateral expansion ofthe concrete. This makes it possiblefor the compression zone to sustainhigher compression stresses andmuch higher compression strainsbefore failure occurs. Unfortu-nately, however, it cannot be ap-plied to existing bridges to enhancethe performance of columns byadding transverse reinforcementlayers.
Compression Stress-StrainRelationship for ConfinedConcrete
Confinement increases the com-pression strength and ultimatestrain capacity of concrete. Manydifferent stress-strain relationshipshave been developed for confinedconcrete. Most of these are appli-
cable under certain conditions. Arecent model applicable to all cross-sectional shapes and all levels ofconfinement (Shinozuka et al.,2003b) is used here for the analy-sis together with key equationsfrom Priestley et al., 1996.
Bridge Analysis
Description of Bridges
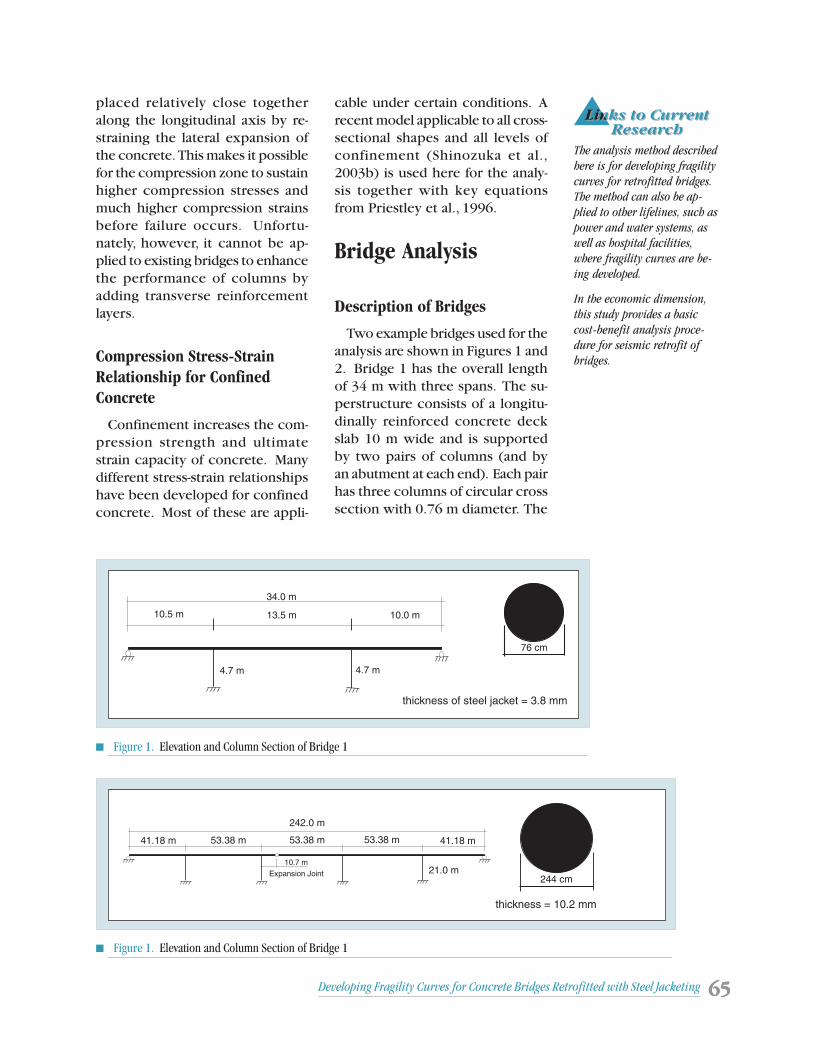
Two example bridges used for theanalysis are shown in Figures 1 and2. Bridge 1 has the overall lengthof 34 m with three spans. The su-perstructure consists of a longitu-dinally reinforced concrete deckslab 10 m wide and is supportedby two pairs of columns (and byan abutment at each end). Each pairhas three columns of circular crosssection with 0.76 m diameter. The
The analysis method describedhere is for developing fragilitycurves for retrofitted bridges.The method can also be ap-plied to other lifelines, such aspower and water systems, aswell as hospital facilities,where fragility curves are be-ing developed.
In the economic dimension,this study provides a basiccost-benefit analysis proce-dure for seismic retrofit ofbridges.
34.0 m
10.5 m 13.5 m 10.0 m
4.7 m 4.7 m
76 cm
thickness of steel jacket = 3.8 mm
■ Figure 1. Elevation and Column Section of Bridge 1
■ Figure 1. Elevation and Column Section of Bridge 1
53.38 m41.18 m 41.18 m53.38 m 53.38 m
21.0 m
242.0 m
Expansion Joint
10.7 m
244 cm
thickness = 10.2 mm
6666666666
overall length of Bridge 2 is 242 mwith five spans, with an expansionjoint in the center span. This bridgeis supported by four columns ofequal height of 21 m between theabutments at the ends. Each col-umn has a circular cross section of2.44 m diameter. The deck has athree-cell concrete box type girdersection 13 m wide and 2 m deep.
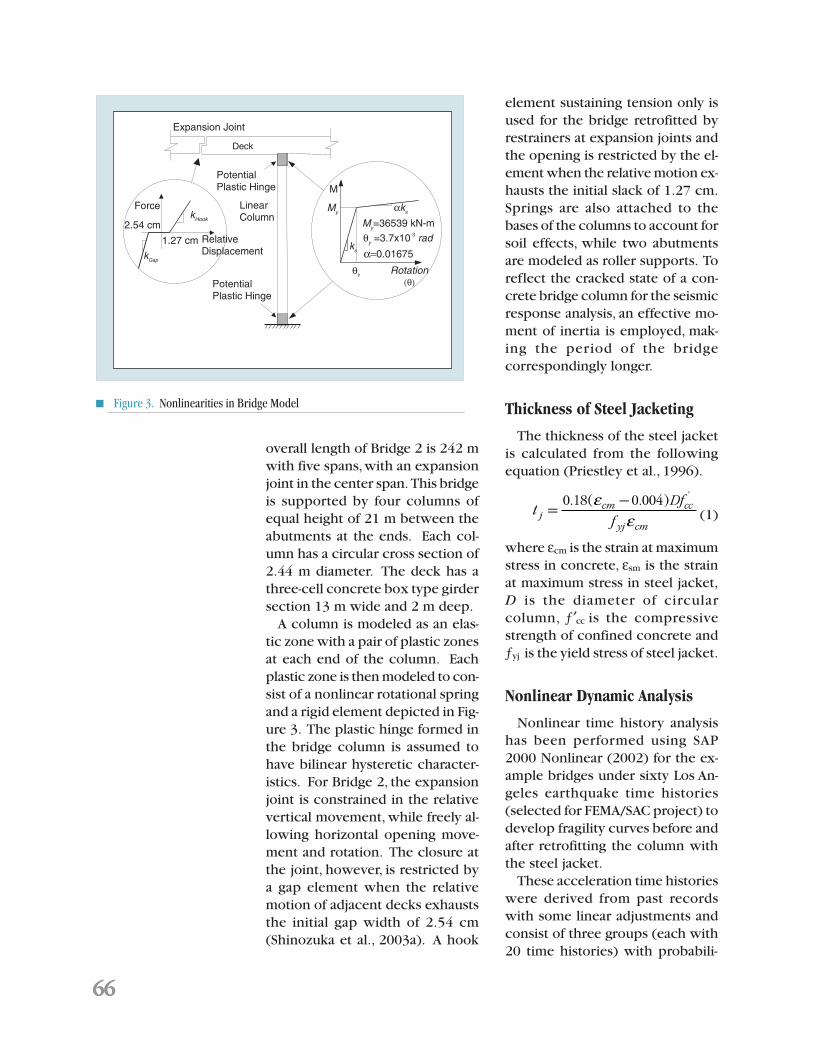
A column is modeled as an elas-tic zone with a pair of plastic zonesat each end of the column. Eachplastic zone is then modeled to con-sist of a nonlinear rotational springand a rigid element depicted in Fig-ure 3. The plastic hinge formed inthe bridge column is assumed tohave bilinear hysteretic character-istics. For Bridge 2, the expansionjoint is constrained in the relativevertical movement, while freely al-lowing horizontal opening move-ment and rotation. The closure atthe joint, however, is restricted bya gap element when the relativemotion of adjacent decks exhauststhe initial gap width of 2.54 cm(Shinozuka et al., 2003a). A hook
element sustaining tension only isused for the bridge retrofitted byrestrainers at expansion joints andthe opening is restricted by the el-ement when the relative motion ex-hausts the initial slack of 1.27 cm.Springs are also attached to thebases of the columns to account forsoil effects, while two abutmentsare modeled as roller supports. Toreflect the cracked state of a con-crete bridge column for the seismicresponse analysis, an effective mo-ment of inertia is employed, mak-ing the period of the bridgecorrespondingly longer.
Thickness of Steel Jacketing
The thickness of the steel jacketis calculated from the followingequation (Priestley et al., 1996).
tDf
fjcm cc
yj cm
=-0 18 0 004. ( . ) ’ee (1)
where ecm is the strain at maximumstress in concrete, esm is the strainat maximum stress in steel jacket,D is the diameter of circularcolumn, ¶¢cc is the compressivestrength of confined concrete and¶yj is the yield stress of steel jacket.
Nonlinear Dynamic Analysis
Nonlinear time history analysishas been performed using SAP2000 Nonlinear (2002) for the ex-ample bridges under sixty Los An-geles earthquake time histories(selected for FEMA/SAC project) todevelop fragility curves before andafter retrofitting the column withthe steel jacket.
These acceleration time historieswere derived from past recordswith some linear adjustments andconsist of three groups (each with20 time histories) with probabili-
kHook
LinearColumn
PotentialPlastic Hinge
RelativeDisplacement
Force
ks
αks
θy Rotation(θ)
My
M
My=36539 kN-m
α=0.01675
θy =3.7x10⁻³ rad
PotentialPlastic Hinge
1.27 cm
Expansion Joint
Deck
2.54 cm
kGap
■ Figure 3. Nonlinearities in Bridge Model
6767676767Developing Fragility Curves for Concrete Bridges Retrofitted with Steel Jacketing
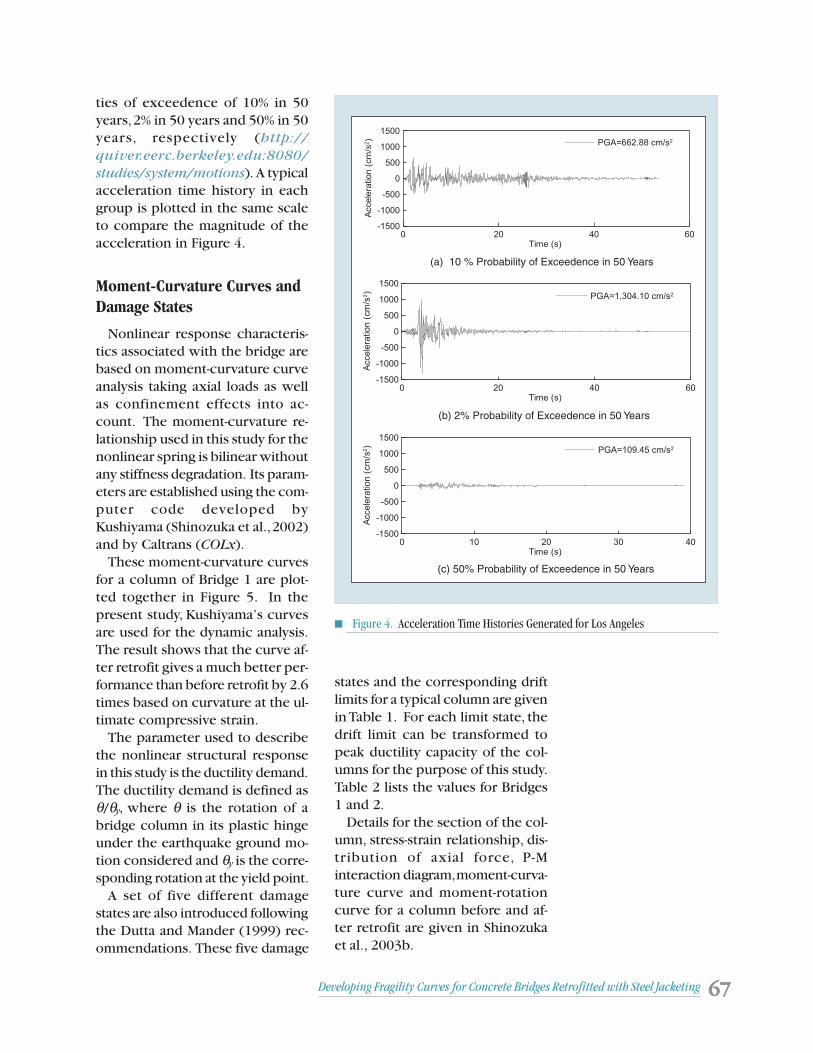
ties of exceedence of 10% in 50years, 2% in 50 years and 50% in 50years, respectively (http://quiver.eerc.berkeley.edu:8080/studies/system/motions). A typicalacceleration time history in eachgroup is plotted in the same scaleto compare the magnitude of theacceleration in Figure 4.
Moment-Curvature Curves andDamage States
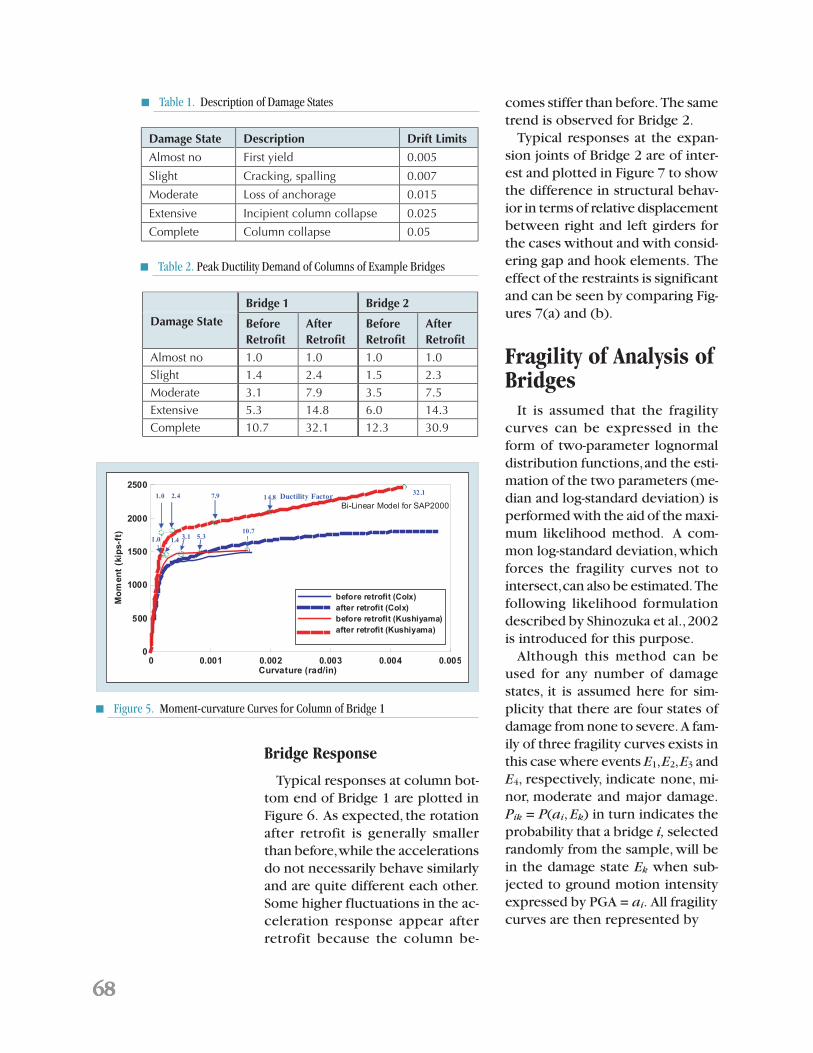
Nonlinear response characteris-tics associated with the bridge arebased on moment-curvature curveanalysis taking axial loads as wellas confinement effects into ac-count. The moment-curvature re-lationship used in this study for thenonlinear spring is bilinear withoutany stiffness degradation. Its param-eters are established using the com-puter code developed byKushiyama (Shinozuka et al., 2002)and by Caltrans (COLx).
These moment-curvature curvesfor a column of Bridge 1 are plot-ted together in Figure 5. In thepresent study, Kushiyama’s curvesare used for the dynamic analysis.The result shows that the curve af-ter retrofit gives a much better per-formance than before retrofit by 2.6times based on curvature at the ul-timate compressive strain.
The parameter used to describethe nonlinear structural responsein this study is the ductility demand.The ductility demand is defined asq/qy, where q is the rotation of abridge column in its plastic hingeunder the earthquake ground mo-tion considered and qy is the corre-sponding rotation at the yield point.
A set of five different damagestates are also introduced followingthe Dutta and Mander (1999) rec-ommendations. These five damage
states and the corresponding driftlimits for a typical column are givenin Table 1. For each limit state, thedrift limit can be transformed topeak ductility capacity of the col-umns for the purpose of this study.Table 2 lists the values for Bridges1 and 2.
Details for the section of the col-umn, stress-strain relationship, dis-tribution of axial force, P-Minteraction diagram, moment-curva-ture curve and moment-rotationcurve for a column before and af-ter retrofit are given in Shinozukaet al., 2003b.
0 20 40 60Time (s)
-1500
-1000
-500
0
500
1000
1500
Accele
ration
(cm
/s2) PGA=662.88 cm/s2
0 20 40 60Time (s)
-1500
-1000
-500
0
500
1000
1500
Accele
ration
(cm
/s2)
PGA=1,304.10 cm/s2
0 10 20 30 40Time (s)
-1500
-1000
-500
0
500
1000
1500
Accele
ration
(cm
/s2)
PGA=109.45 cm/s2
(a) 10 % Probability of Exceedence in 50 Years
(b) 2% Probability of Exceedence in 50 Years
(c) 50% Probability of Exceedence in 50 Years
■ Figure 4. Acceleration Time Histories Generated for Los Angeles
6868686868
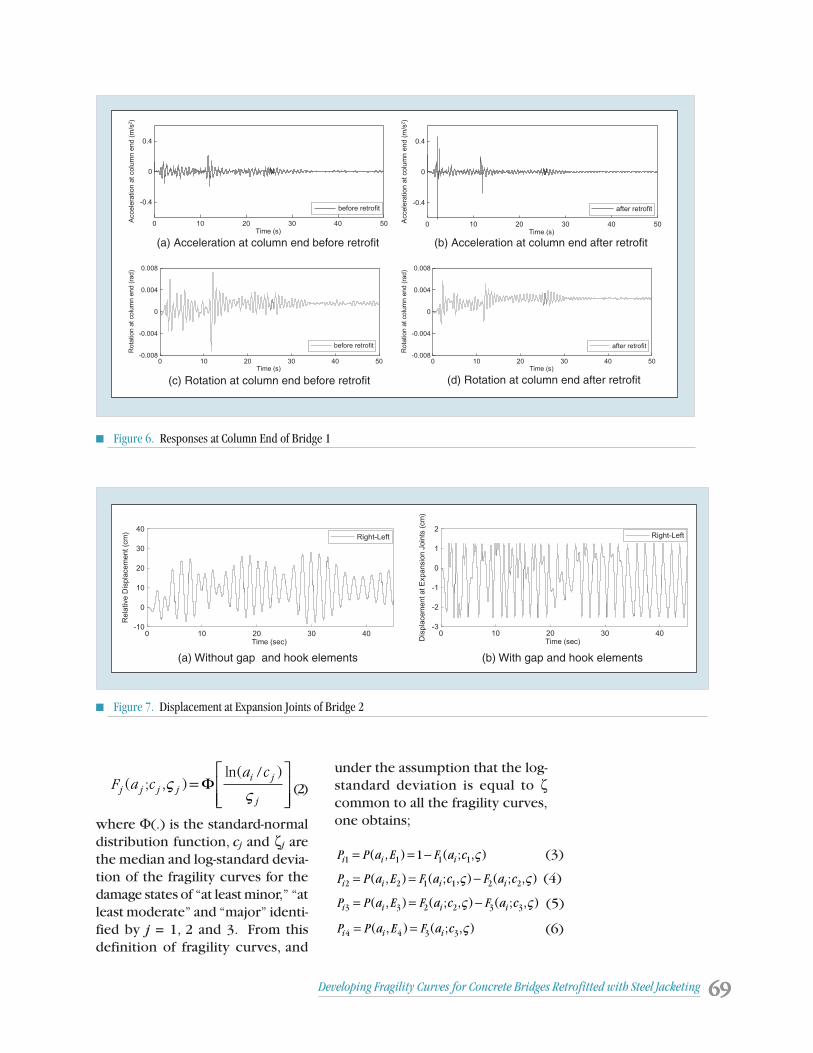
Bridge Response
Typical responses at column bot-tom end of Bridge 1 are plotted inFigure 6. As expected, the rotationafter retrofit is generally smallerthan before, while the accelerationsdo not necessarily behave similarlyand are quite different each other.Some higher fluctuations in the ac-celeration response appear afterretrofit because the column be-
comes stiffer than before. The sametrend is observed for Bridge 2.
Typical responses at the expan-sion joints of Bridge 2 are of inter-est and plotted in Figure 7 to showthe difference in structural behav-ior in terms of relative displacementbetween right and left girders forthe cases without and with consid-ering gap and hook elements. Theeffect of the restraints is significantand can be seen by comparing Fig-ures 7(a) and (b).
Fragility of Analysis ofBridges
It is assumed that the fragilitycurves can be expressed in theform of two-parameter lognormaldistribution functions, and the esti-mation of the two parameters (me-dian and log-standard deviation) isperformed with the aid of the maxi-mum likelihood method. A com-mon log-standard deviation, whichforces the fragility curves not tointersect, can also be estimated. Thefollowing likelihood formulationdescribed by Shinozuka et al., 2002is introduced for this purpose.
Although this method can beused for any number of damagestates, it is assumed here for sim-plicity that there are four states ofdamage from none to severe. A fam-ily of three fragility curves exists inthis case where events E1, E2, E3 andE4, respectively, indicate none, mi-nor, moderate and major damage.Pik = P(ai, Ek) in turn indicates theprobability that a bridge i, selectedrandomly from the sample, will bein the damage state Ek when sub-jected to ground motion intensityexpressed by PGA = ai. All fragilitycurves are then represented by
0 0.001 0.002 0.003 0.004 0.005Curvature (rad/in)
0
500
1000
1500
2000
2500
Mom
ent (
kips
-ft)
before retrofit (Colx) after retrofit (Colx) before retrofit (Kushiyama) after retrofit (Kushiyama)
Bi-Linear Model for SAP20001.0 2.4 7.9 14.8
32.1Ductility Factor
1.0 1.4 3.1 5.310.7
0 0.001 0.002 0.003 0.004 0.005Curvature (rad/in)
0
500
1000
1500
2000
2500
Mom
ent (
kips
-ft)
before retrofit (Colx) after retrofit (Colx) before retrofit (Kushiyama) after retrofit (Kushiyama)
Bi-Linear Model for SAP20001.0 2.4 7.9 14.8
32.1Ductility Factor
1.0 1.4 3.1 5.310.7
Damage State Description Drift Limits
Almost no First yield 0.005
Slight Cracking, spalling 0.007
Moderate Loss of anchorage 0.015
Extensive Incipient column collapse 0.025
Complete Column collapse 0.05
Bridge 1 Bridge 2
Damage State BeforeRetrofit
AfterRetrofit
BeforeRetrofit
AfterRetrofit
Almost no 1.0 1.0 1.0 1.0Slight 1.4 2.4 1.5 2.3Moderate 3.1 7.9 3.5 7.5Extensive 5.3 14.8 6.0 14.3Complete 10.7 32.1 12.3 30.9
■ Table 1. Description of Damage States
■ Table 2. Peak Ductility Demand of Columns of Example Bridges
■ Figure 5. Moment-curvature Curves for Column of Bridge 1
6969696969Developing Fragility Curves for Concrete Bridges Retrofitted with Steel Jacketing
P P a E F a ci i i1 1 1 11= = -( , ) ( ; , )V (3)
P P a E F a c F a ci i i i2 2 1 1 2 2= = -( , ) ( ; , ) ( ; , )V V (4)
P P a E F a c F a ci i i i3 3 2 2 3 3= = -( , ) ( ; , ) ( ; , )V V (5)
P P a E F a ci i i4 4 3 3= =( , ) ( ; , )V (6)
under the assumption that the log-standard deviation is equal to zcommon to all the fragility curves,one obtains;
F a ca c
j j j ji j
j
( ; , )ln( / )
VV
=È
ÎÍÍ
˘
˚˙˙
F (2)
where F(.) is the standard-normaldistribution function, cj and zj arethe median and log-standard devia-tion of the fragility curves for thedamage states of “at least minor,” “atleast moderate” and “major” identi-fied by j = 1, 2 and 3. From thisdefinition of fragility curves, and
0 10 20 30 40 50Time (s)
-0.4
0
0.4
Accele
ration
atcolu
mn
end
(m/s
2)
before retrofit
0 10 20 30 40 50Time (s)
-0.4
0
0.4
Accele
ration
atcolu
mn
end
(m/s
2)
after retrofit
0 10 20 30 40 50Time (s)
-0.008
-0.004
0
0.004
0.008
Rota
tion
atcolu
mn
end
(rad)
before retrofit
0 10 20 30 40 50Time (s)
-0.008
-0.004
0
0.004
0.008
Rota
tion
atcolu
mn
end
(rad)
after retrofit
(a) Acceleration at column end before retrofit (b) Acceleration at column end after retrofit
(c) Rotation at column end before retrofit (d) Rotation at column end after retrofit
0 10 20 30 40Time (sec)
-10
0
10
20
30
40
Rela
tive
Dis
pla
cem
ent(c
m)
Right-Left
0 10 20 30 40Time (sec)
-3
-2
-1
0
1
2
Dis
pla
cem
entatE
xpansio
nJoin
ts(c
m)
Right-Left
(a) Without gap and hook elements (b) With gap and hook elements
■ Figure 7. Displacement at Expansion Joints of Bridge 2
■ Figure 6. Responses at Column End of Bridge 1
7070707070
The likelihood function can thenbe introduced as
L c c c P a Ek i kx
ki
nik( , , , ) ( ; )1 2 3
1
4
1
V ===
’’(7)
where
xik = 1 (8)
if the damage state Ek occurs in thei-th bridge subjected to a = ai, and
xik = 0 (9)
otherwise. Then the maximum like-lihood estimates c0j for cj and z0 forz are obtained by solving the fol-lowing equations,
∂∂
=∂
∂=
=
ln ( , , , ) ln ( , , , )
( , , )
L c c c
c
L c c c
j
j
1 2 3 1 2 3 0
1 2 3
V VV
(10)
by implementing a straightforwardoptimization algorithm.
Fragility Curves
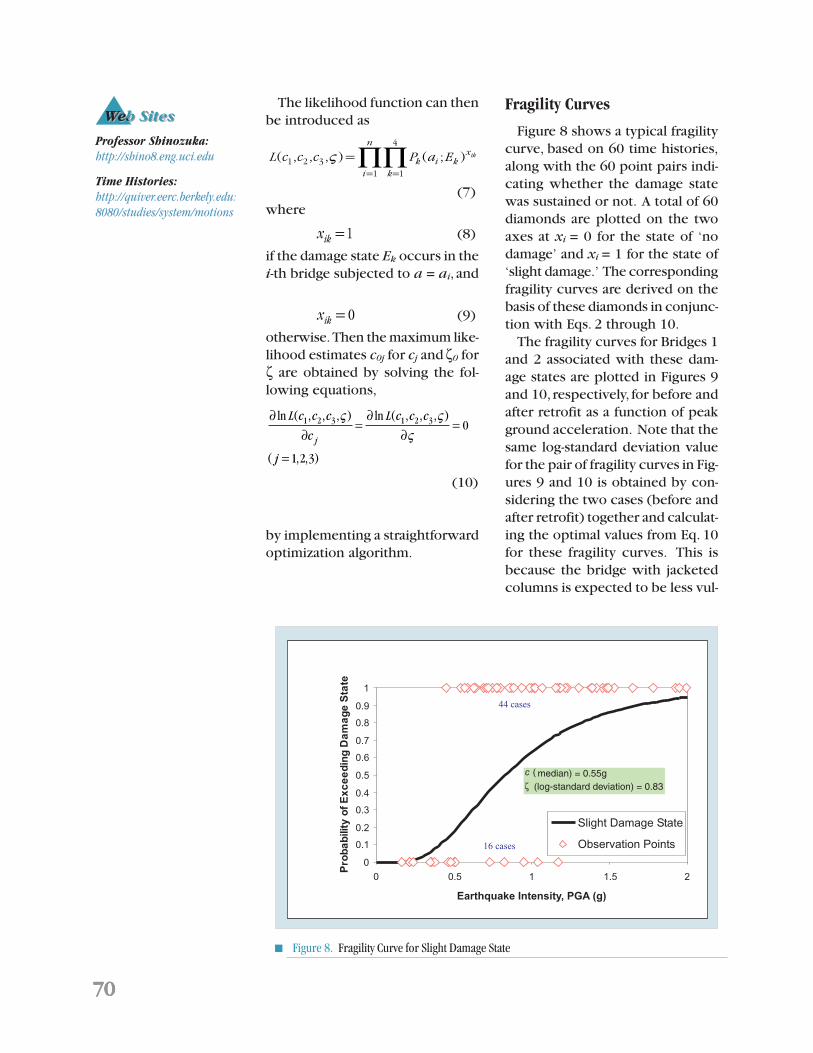
Figure 8 shows a typical fragilitycurve, based on 60 time histories,along with the 60 point pairs indi-cating whether the damage statewas sustained or not. A total of 60diamonds are plotted on the twoaxes at xi = 0 for the state of ‘nodamage’ and xi = 1 for the state of‘slight damage.’ The correspondingfragility curves are derived on thebasis of these diamonds in conjunc-tion with Eqs. 2 through 10.
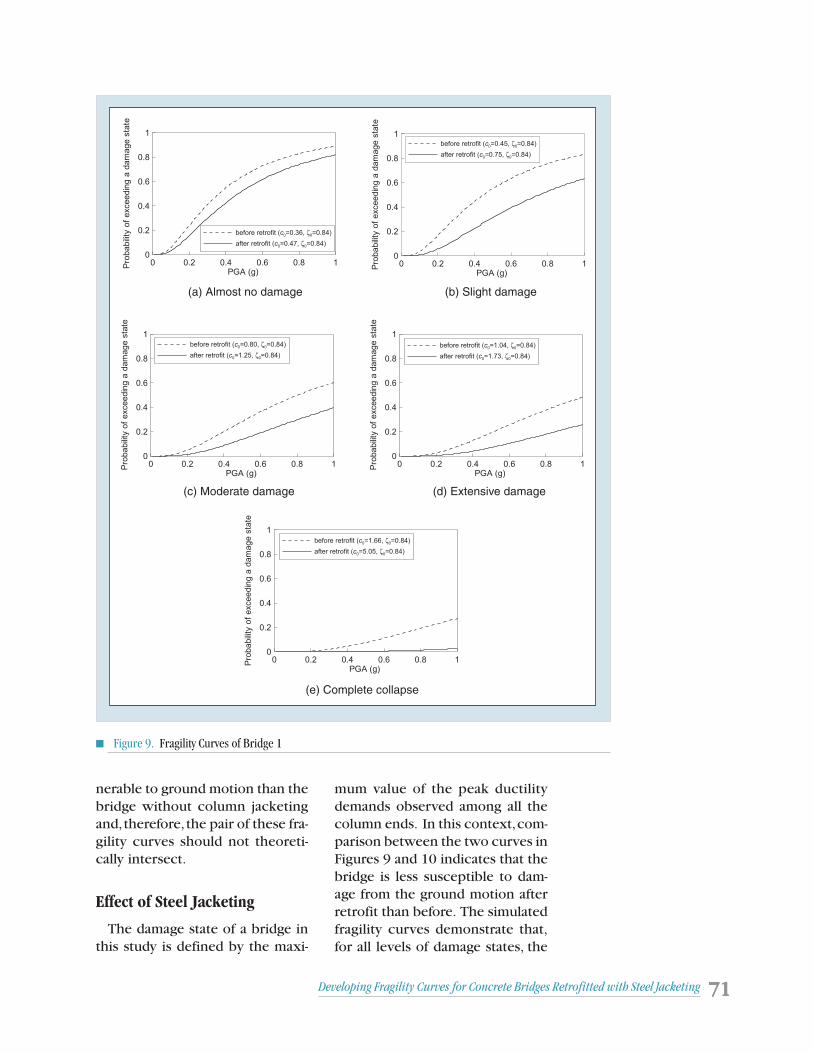
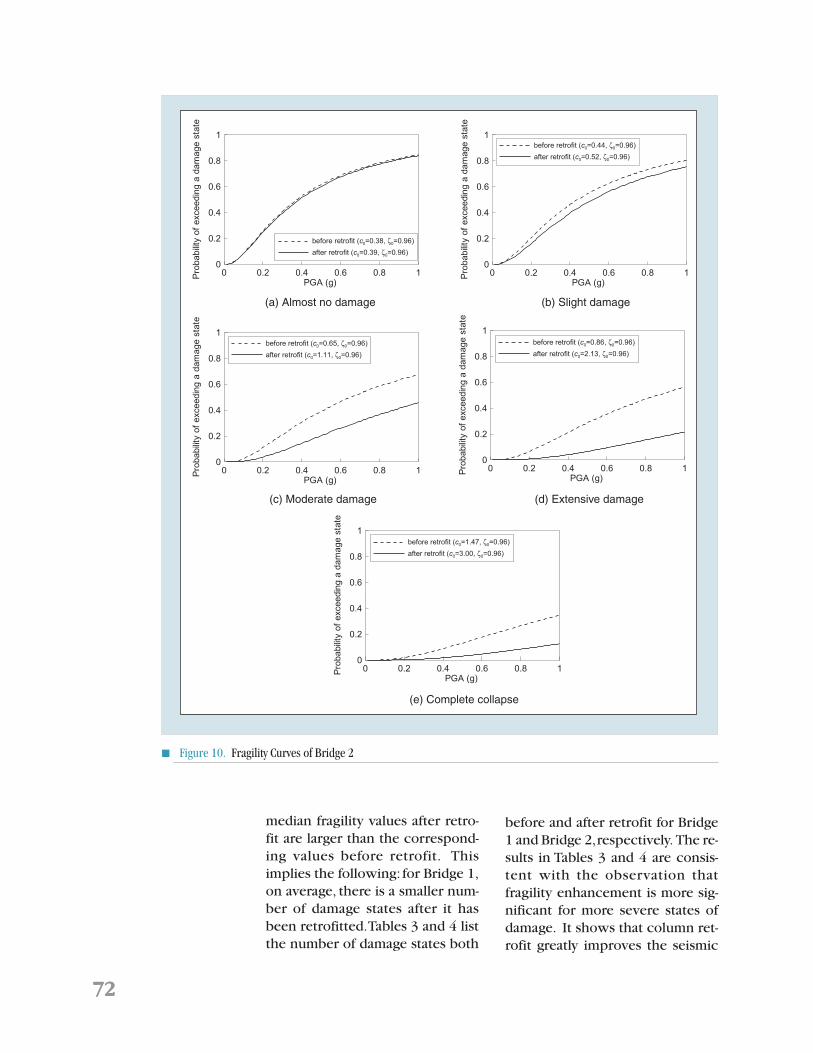
The fragility curves for Bridges 1and 2 associated with these dam-age states are plotted in Figures 9and 10, respectively, for before andafter retrofit as a function of peakground acceleration. Note that thesame log-standard deviation valuefor the pair of fragility curves in Fig-ures 9 and 10 is obtained by con-sidering the two cases (before andafter retrofit) together and calculat-ing the optimal values from Eq. 10for these fragility curves. This isbecause the bridge with jacketedcolumns is expected to be less vul-
Professor Shinozuka:http://shino8.eng.uci.edu
Time Histories:http://quiver.eerc.berkely.edu:8080/studies/system/motions
0
0.1
0.2
0.3
0.4
0.5
0.6
0.7
0.8
0.9
1
0 0.5 1 1.5 2
Earthquake Intensity, PGA (g)
Pro
ba
bilit
yo
fE
xc
ee
din
gD
am
ag
eS
tate
Slight Damage State
Observation Points
44 cases
ζ(c
16 cases
median) = 0.55g(log-standard deviation) = 0.83
■ Figure 8. Fragility Curve for Slight Damage State
7171717171Developing Fragility Curves for Concrete Bridges Retrofitted with Steel Jacketing
nerable to ground motion than thebridge without column jacketingand, therefore, the pair of these fra-gility curves should not theoreti-cally intersect.
Effect of Steel Jacketing
The damage state of a bridge inthis study is defined by the maxi-
mum value of the peak ductilitydemands observed among all thecolumn ends. In this context, com-parison between the two curves inFigures 9 and 10 indicates that thebridge is less susceptible to dam-age from the ground motion afterretrofit than before. The simulatedfragility curves demonstrate that,for all levels of damage states, the
0 0.2 0.4 0.6 0.8 1PGA (g)
0
0.2
0.4
0.6
0.8
1P
robabili
tyof
exceedin
ga
dam
age
sta
te
before retrofit (c0=0.36, ζ0=0.84)
after retrofit (c0=0.47, ζ0=0.84)
0 0.2 0.4 0.6 0.8 1PGA (g)
0
0.2
0.4
0.6
0.8
1
Pro
babili
tyof
exceedin
ga
dam
age
sta
te
before retrofit (c0=0.45, ζ0=0.84)
after retrofit (c0=0.75, ζ0=0.84)
0 0.2 0.4 0.6 0.8 1PGA (g)
0
0.2
0.4
0.6
0.8
1
Pro
babili
tyof
exceedin
ga
dam
age
sta
te
before retrofit (c0=0.80, ζ0=0.84)
after retrofit (c0=1.25, ζ0=0.84)
0 0.2 0.4 0.6 0.8 1PGA (g)
0
0.2
0.4
0.6
0.8
1
Pro
babili
tyof
exceedin
ga
dam
age
sta
te
before retrofit (c0=1.04, ζ0=0.84)
after retrofit (c0=1.73, ζ0=0.84)
0 0.2 0.4 0.6 0.8 1PGA (g)
0
0.2
0.4
0.6
0.8
1
Pro
babili
tyof
exceedin
ga
dam
age
sta
te
before retrofit (c0=1.66, ζ0=0.84)
after retrofit (c0=5.05, ζ0=0.84)
(a) Almost no damage (b) Slight damage
(c) Moderate damage (d) Extensive damage
(e) Complete collapse
■ Figure 9. Fragility Curves of Bridge 1
7272727272
median fragility values after retro-fit are larger than the correspond-ing values before retrofit. Thisimplies the following: for Bridge 1,on average, there is a smaller num-ber of damage states after it hasbeen retrofitted. Tables 3 and 4 listthe number of damage states both
before and after retrofit for Bridge1 and Bridge 2, respectively. The re-sults in Tables 3 and 4 are consis-tent with the observation thatfragility enhancement is more sig-nificant for more severe states ofdamage. It shows that column ret-rofit greatly improves the seismic
■ Figure 10. Fragility Curves of Bridge 2
0 0.2 0.4 0.6 0.8 1PGA (g)
0
0.2
0.4
0.6
0.8
1
Pro
babili
tyof
exceedin
ga
dam
age
sta
te
before retrofit (c0=0.38, ζ0=0.96)
after retrofit (c0=0.39, ζ0=0.96)
0 0.2 0.4 0.6 0.8 1PGA (g)
0
0.2
0.4
0.6
0.8
1
Pro
babili
tyof
exceedin
ga
dam
age
sta
te
before retrofit (c0=0.44, ζ0=0.96)
after retrofit (c0=0.52, ζ0=0.96)
0 0.2 0.4 0.6 0.8 1PGA (g)
0
0.2
0.4
0.6
0.8
1
Pro
babili
tyof
exceedin
ga
dam
age
sta
te
before retrofit (c0=0.65, ζ0=0.96)
after retrofit (c0=1.11, ζ0=0.96)
0 0.2 0.4 0.6 0.8 1PGA (g)
0
0.2
0.4
0.6
0.8
1
Pro
babili
tyof
exceedin
ga
dam
age
sta
te
before retrofit (c0=0.86, ζ0=0.96)
after retrofit (c0=2.13, ζ0=0.96)
0 0.2 0.4 0.6 0.8 1PGA (g)
0
0.2
0.4
0.6
0.8
1
Pro
babili
tyof
exceedin
ga
dam
age
sta
te
before retrofit (c0=1.47, ζ0=0.96)
after retrofit (c0=3.00, ζ0=0.96)
(a) Almost no damage (b) Slight damage
(c) Moderate damage (d) Extensive damage
(e) Complete collapse
7373737373Developing Fragility Curves for Concrete Bridges Retrofitted with Steel Jacketing
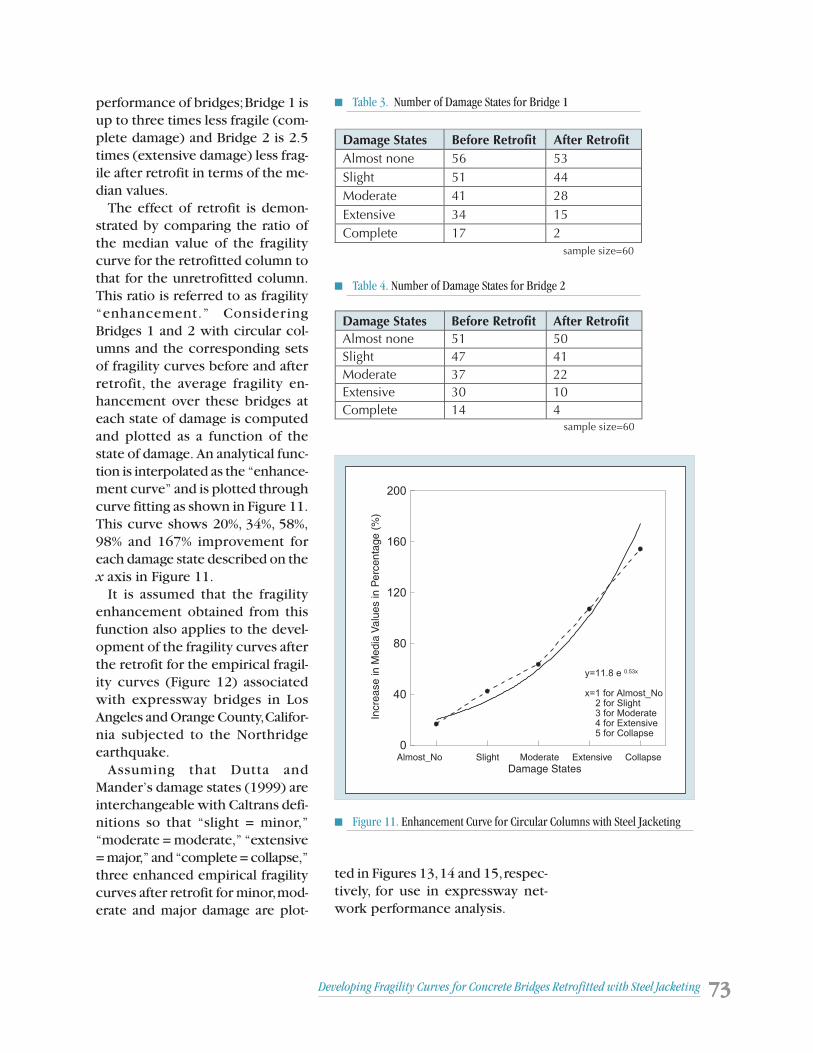
performance of bridges; Bridge 1 isup to three times less fragile (com-plete damage) and Bridge 2 is 2.5times (extensive damage) less frag-ile after retrofit in terms of the me-dian values.
The effect of retrofit is demon-strated by comparing the ratio ofthe median value of the fragilitycurve for the retrofitted column tothat for the unretrofitted column.This ratio is referred to as fragility“enhancement.” ConsideringBridges 1 and 2 with circular col-umns and the corresponding setsof fragility curves before and afterretrofit, the average fragility en-hancement over these bridges ateach state of damage is computedand plotted as a function of thestate of damage. An analytical func-tion is interpolated as the “enhance-ment curve” and is plotted throughcurve fitting as shown in Figure 11.This curve shows 20%, 34%, 58%,98% and 167% improvement foreach damage state described on thex axis in Figure 11.
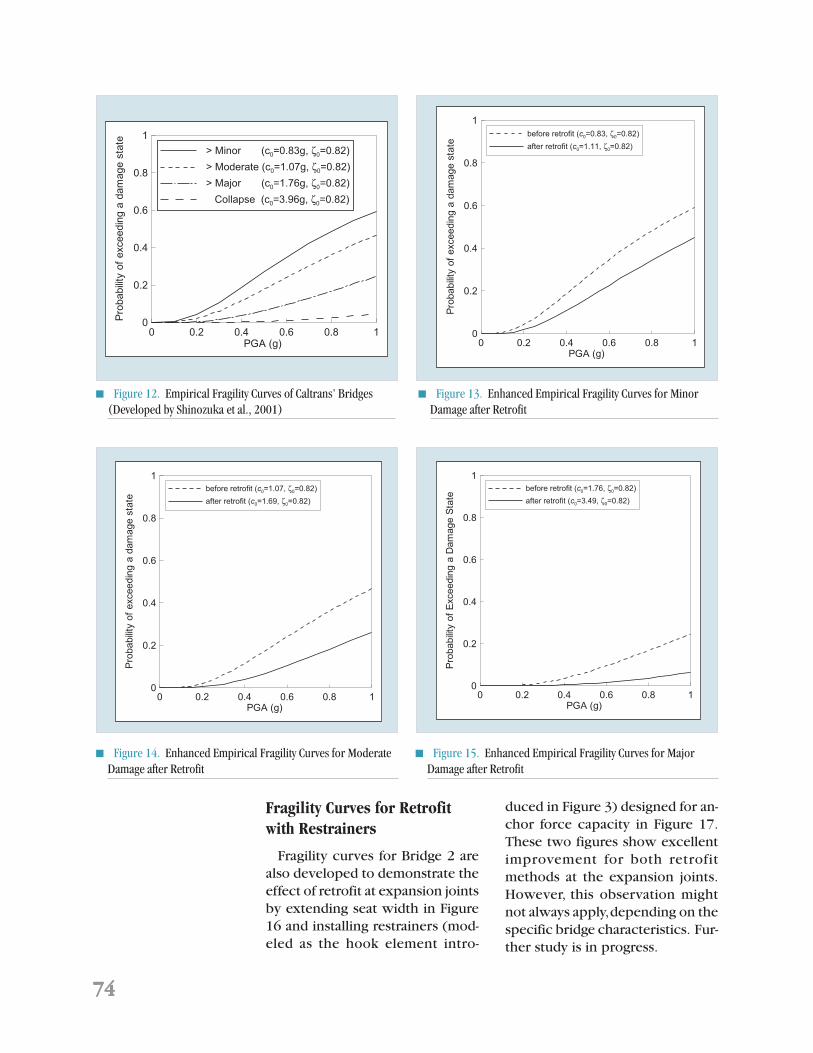
It is assumed that the fragilityenhancement obtained from thisfunction also applies to the devel-opment of the fragility curves afterthe retrofit for the empirical fragil-ity curves (Figure 12) associatedwith expressway bridges in LosAngeles and Orange County, Califor-nia subjected to the Northridgeearthquake.
Assuming that Dutta andMander’s damage states (1999) areinterchangeable with Caltrans defi-nitions so that “slight = minor,”“moderate = moderate,” “extensive= major,” and “complete = collapse,”three enhanced empirical fragilitycurves after retrofit for minor, mod-erate and major damage are plot-
■ Table 3. Number of Damage States for Bridge 1
■ Figure 11. Enhancement Curve for Circular Columns with Steel Jacketing
■ Table 4. Number of Damage States for Bridge 2
ted in Figures 13, 14 and 15, respec-tively, for use in expressway net-work performance analysis.
Damage States Before Retrofit After RetrofitAlmost none 56 53Slight 51 44Moderate 41 28Extensive 34 15Complete 17 2
sample size=60
Damage States Before Retrofit After RetrofitAlmost none 51 50Slight 47 41Moderate 37 22Extensive 30 10Complete 14 4
sample size=60
Almost_No Slight ModerateExtensive CollapseDamage states
0
40
80
120
160
200
Incre
ase
inm
edia
nvalu
es
inperc
enta
ge
(%)
y=11.8 e 0.53x
x=1 for Almost_No2 for Slight3 for Moderate4 for Extensive5 for Collapse
Almost_No Slight Moderate Extensive CollapseDamage States
Incr
ease
in M
edia
Val
ues
in P
erce
ntag
e (%
)
7474747474
0 0.2 0.4 0.6 0.8 1PGA (g)
0
0.2
0.4
0.6
0.8
1
Pro
babili
tyof
exceedin
ga
dam
age
sta
te
> Minor (c0=0.83g, ζ0=0.82)
> Moderate (c0=1.07g, ζ0=0.82)
> Major (c0=1.76g, ζ0=0.82)
Collapse (c0=3.96g, ζ0=0.82)
0 0.2 0.4 0.6 0.8 1PGA (g)
0
0.2
0.4
0.6
0.8
1
Pro
babili
tyof
exceedin
ga
dam
age
sta
te
before retrofit (c0=0.83, ζ0=0.82)
after retrofit (c0=1.11, ζ0=0.82)
0 0.2 0.4 0.6 0.8 1PGA (g)
0
0.2
0.4
0.6
0.8
1
Pro
babili
tyof
exceedin
ga
dam
age
sta
te
before retrofit (c0=1.07, ζ0=0.82)
after retrofit (c0=1.69, ζ0=0.82)
Fragility Curves for Retrofitwith Restrainers
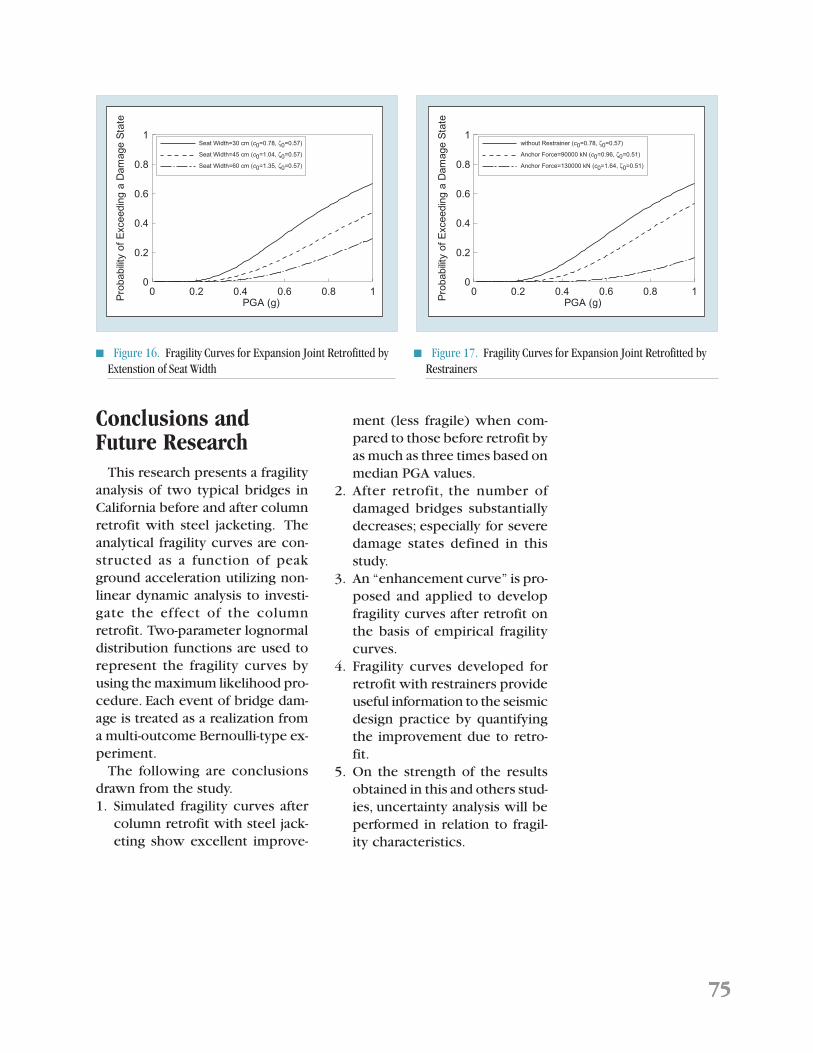
Fragility curves for Bridge 2 arealso developed to demonstrate theeffect of retrofit at expansion jointsby extending seat width in Figure16 and installing restrainers (mod-eled as the hook element intro-
duced in Figure 3) designed for an-chor force capacity in Figure 17.These two figures show excellentimprovement for both retrofitmethods at the expansion joints.However, this observation mightnot always apply, depending on thespecific bridge characteristics. Fur-ther study is in progress.
■ Figure 12. Empirical Fragility Curves of Caltrans’ Bridges(Developed by Shinozuka et al., 2001)
■ Figure 13. Enhanced Empirical Fragility Curves for MinorDamage after Retrofit
■ Figure 14. Enhanced Empirical Fragility Curves for ModerateDamage after Retrofit
■ Figure 15. Enhanced Empirical Fragility Curves for MajorDamage after Retrofit
0 0.2 0.4 0.6 0.8 1PGA (g)
0
0.2
0.4
0.6
0.8
1
Pro
babili
tyof
Exceedin
ga
Dam
age
Sta
te
before retrofit (c0=1.76, ζ0=0.82)
after retrofit (c0=3.49, ζ0=0.82)
7575757575
Conclusions andFuture Research
This research presents a fragilityanalysis of two typical bridges inCalifornia before and after columnretrofit with steel jacketing. Theanalytical fragility curves are con-structed as a function of peakground acceleration utilizing non-linear dynamic analysis to investi-gate the effect of the columnretrofit. Two-parameter lognormaldistribution functions are used torepresent the fragility curves byusing the maximum likelihood pro-cedure. Each event of bridge dam-age is treated as a realization froma multi-outcome Bernoulli-type ex-periment.
The following are conclusionsdrawn from the study.1. Simulated fragility curves after
column retrofit with steel jack-eting show excellent improve-
ment (less fragile) when com-pared to those before retrofit byas much as three times based onmedian PGA values.
2. After retrofit, the number ofdamaged bridges substantiallydecreases; especially for severedamage states defined in thisstudy.
3. An “enhancement curve” is pro-posed and applied to developfragility curves after retrofit onthe basis of empirical fragilitycurves.
4. Fragility curves developed forretrofit with restrainers provideuseful information to the seismicdesign practice by quantifyingthe improvement due to retro-fit.
5. On the strength of the resultsobtained in this and others stud-ies, uncertainty analysis will beperformed in relation to fragil-ity characteristics.
0 0.2 0.4 0.6 0.8 1PGA (g)
0
0.2
0.4
0.6
0.8
1
Pro
babili
tyof
Exceedin
ga
Dam
age
Sta
te
Seat Width=30 cm (c0=0.78, ζ0=0.57)
Seat Width=45 cm (c0=1.04, ζ0=0.57)
Seat Width=60 cm (c0=1.35, ζ0=0.57)
0 0.2 0.4 0.6 0.8 1PGA (g)
0
0.2
0.4
0.6
0.8
1
Pro
babili
tyof
Exceedin
ga
Dam
age
Sta
te
without Restrainer (c0=0.78, ζ0=0.57)
Anchor Force=90000 kN (c0=0.96, ζ0=0.51)
Anchor Force=130000 kN (c0=1.64, ζ0=0.51)
■ Figure 16. Fragility Curves for Expansion Joint Retrofitted byExtenstion of Seat Width
■ Figure 17. Fragility Curves for Expansion Joint Retrofitted byRestrainers

7676767676
RefRefRefRefReferererererencesencesencesencesences
Chai, Y.H., Priestley, M.J.N. and Seible F, (1991), “Seismic Retrofit of CircularBridge Columns for Enhanced Flexural Performance,” ACI StructuralJournal, Vol. 88, No. 5, pp. 572-584.
Dutta, A. and Mander, J.B., (1999), “Seismic fragility analysis of highwaybridges,” Proceedings of the Center-to-Center Project Workshop onEarthquake Engineering in Transportation Systems, Tokyo, Japan.
Priestley, M.J.N., Seible, F. and Calvi, G.M., (1996), Seismic Design andRetrofit of Bridges, John Wiley & Sons, Inc., pp. 270-273.
SAP2000, (2002), User Manual, Computers and Structure, Vol. 7.44, CA.
Shinozuka, M., Feng. M.Q., Kim, H.-K., Uzawa, T. and Ueda, T., (2001),Statistical Analysis of Fragility Curves, unpublished MCEER TechnicalReport, Multidisciplinary Center for Earthquake Engineering, http://shino8.eng.uci.edu/techniclpapers.htm.
Shinozuka, M., Kim, S.-H., Yi, J.-H. and Kushiyama, S., (2002), “FragilityCurves of Concrete Bridges Retrofitted by Column Jacketing,”Earthquake Engineering and Engineering Vibration, http://shino8.eng.uci.edu/journalpapers.htm, Vol. 01, No. 2.
Shinozuka, M. and Kim, H.-K., (2003a), “Effects of Seismically InducedPounding at Expansion Joints of Concrete Bridges,” Accepted forPublication, Journal of Engineering Mechanics, ASCE, http://shino8.eng.uci.edu/journalpapers.htm.
Shinozuka, M., Kim, S.-H., Kushiyama, S, (2003b), “Fragility Curves ofSeismically Retrofitted Bridges with Column Jacketing,” to be submittedfor publication, Journal of Engineering Mechanics, ASCE, http://shino8.eng.uci.edu/journalpapers.htm.
Somerville, P., Smith, N., Punyamurthula, S. and Sun, J., (1997),Development of Ground Motion Time Histories for Phase 2 of theFEMA/SAC Steel Project.


![[SP01] CTO が語る! 今注目すべきテクノロジー](https://img.pdfslide.net/doc/110x75/5a658bdd7f8b9af13a8b4e0b/sp01-cto-.jpg)