Embed Size (px)
Citation preview
San Jose State University San Jose State University
SJSU ScholarWorks SJSU ScholarWorks
Mineta Transportation Institute Publications
1-2021
Developing Guidelines for Assessing the Effectiveness of Developing Guidelines for Assessing the Effectiveness of
Intelligent Compaction Technology Intelligent Compaction Technology
Mehran Mazari California State University, Los Angeles
Siavash F. Aval California State University, Los Angeles
Siddharth M. Satani California State University, Los Angeles
David Corona California State University, Los Angeles
Joshua Garrido California State University, Los Angeles
Follow this and additional works at: https://scholarworks.sjsu.edu/mti_publications
Part of the Transportation Commons, and the Transportation Engineering Commons
Recommended Citation Recommended Citation Mehran Mazari, Siavash F. Aval, Siddharth M. Satani, David Corona, and Joshua Garrido. "Developing Guidelines for Assessing the Effectiveness of Intelligent Compaction Technology" Mineta Transportation Institute Publications (2021). https://doi.org/10.31979/mti.2021.1923
This Report is brought to you for free and open access by SJSU ScholarWorks. It has been accepted for inclusion in Mineta Transportation Institute Publications by an authorized administrator of SJSU ScholarWorks. For more information, please contact [email protected].
Developing Guidelines for Assessing the Effectiveness of Intelligent Compaction TechnologyMehran Mazari, PhDSiavash Fakhretaha Aval Siddharth M. SataniDavid CoronaJoshua Garrido
C S U T R A N S P O R T A T I O N C O N S O R T I U M
Project 1923 January 2021
transweb.sjsu.edu/csutc

Mineta Transportation Institute Founded in 1991, the Mineta Transportation Institute (MTI), an organized research and training unit in partnership with the Lucas College and Graduate School of Business at San José State University (SJSU), increases mobility for all by improving the safety, efficiency, accessibility, and convenience of our nation’s transportation system. Through research, education, workforce development, and technology transfer, we help create a connected world. MTI leads the Mineta Consortium for Transportation Mobility (MCTM) funded by the U.S. Department of Transportation and the California State University Transportation Consortium (CSUTC) funded by the State of California through Senate Bill 1. MTI focuses on three primary responsibilities:
Research
MTI conducts multi-disciplinary research focused on surface transportation that contributes to effective decision making. Research areas include: active transportation; planning and policy; security and counterterrorism; sustainable transportation and land use; transit and passenger rail; transportation engineering; transportation finance; transportation technology; and workforce and labor. MTI research publications undergo expert peer review to ensure the quality of the research.
Education and Workforce
To ensure the efficient movement of people and products, we must prepare a new cohort of transportation professionals who are ready to lead a more diverse, inclusive, and equitable transportation industry. To help achieve this, MTI sponsors a suite of workforce development and education opportunities. The Institute supports educational programs offered by the Lucas Graduate School of Business: a Master of
Science in Transportation Management, plus graduate certificates that include High-Speed and Intercity Rail Management and Transportation Security Management. These flexible programs offer live online classes so that working transportation professionals can pursue an advanced degree regardless of their location.
Information and Technology Transfer
MTI utilizes a diverse array of dissemination methods and media to ensure research results reach those responsible for managing change. These methods include publication, seminars, workshops, websites, social media, webinars, and other technology transfer mechanisms. Additionally, MTI promotes the availability of completed research to professional organizations and works to integrate the research findings into the graduate education program. MTI’s extensive collection of transportation-related publications is integrated into San José State University’s world-class Martin Luther King, Jr. Library.
_____________________________________________________________________________________________
Disclaimer
The contents of this report reflect the views of the authors, who are responsible for the facts and accuracy of the information presented herein. This document is disseminated in the interest of information exchange. MTI’s research is funded, partially or entirely, by grants from the California Department of Transportation, the California State University Office of the Chancellor, the U.S. Department of Homeland Security, and the U.S. Department of Transportation, who assume no liability for the contents or use thereof. This report does not constitute a standard specification, design standard, or regulation.
Report 20-56
Developing Guidelines for Assessing the Effectiveness of Intelligent
Compaction Technology
Mehran Mazari, PhD Siavash Fakhretaha Aval
Siddharth M. Satani David Corona Joshua Garrido
January 2021
A publication of the Mineta Transportation Institute Created by Congress in 1991
College of Business San José State University San José, CA 95192-0219
TECHNICAL REPORT DOCUMENTATION PAGE
1. Report No. 20-56
2. Government Accession No. 3. Recipient’s Catalog No.
4. Title and SubtitleDeveloping Guidelines for Assessing the Effectiveness ofIntelligent Compaction Technology
5. Report DateJanuary 2021
6. Performing Organization Code
7. Authors Mehran Mazari (0000-0003-4988-951X), Siavash F. Aval (0000-0002-8686-9035),Siddharth M. Satani, David Corona, Joshua Garrido
8. Performing Organization Report
CA-MTI-1923
9. Performing Organization Name and Address Mineta Transportation InstituteCollege of Business San José State University San José, CA 95192-0219
10. Work Unit No.
11. Contract or Grant No. ZSB12017-SJAUX
12. Sponsoring Agency Name and Address State of California SB1 2017/2018Trustees of the California State UniversitySponsored Programs Administration401 Golden Shore, 5th FloorLong Beach, CA 90802
13. Type of Report and Period Covered
Final Report 14. Sponsoring Agency Code
15. Supplemental NotesDOI: 10.31979/mti.2021.1923
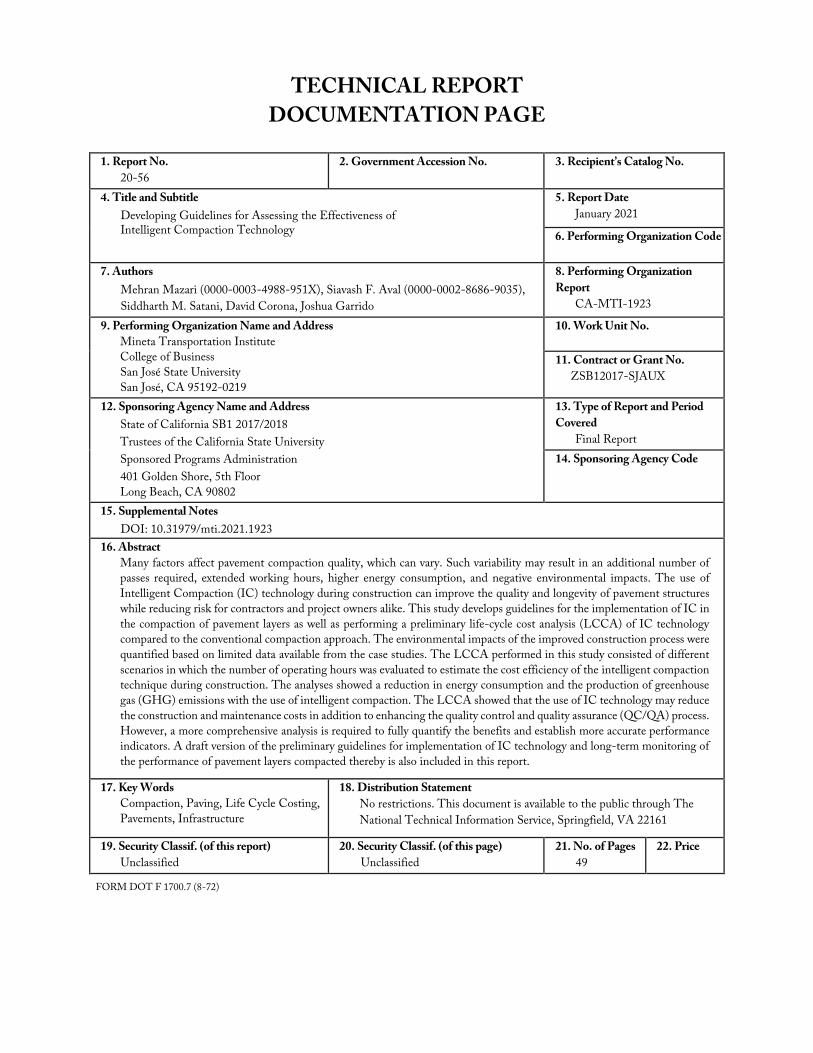
16. AbstractMany factors affect pavement compaction quality, which can vary. Such variability may result in an additional number ofpasses required, extended working hours, higher energy consumption, and negative environmental impacts. The use ofIntelligent Compaction (IC) technology during construction can improve the quality and longevity of pavement structureswhile reducing risk for contractors and project owners alike. This study develops guidelines for the implementation of IC inthe compaction of pavement layers as well as performing a preliminary life-cycle cost analysis (LCCA) of IC technologycompared to the conventional compaction approach. The environmental impacts of the improved construction process were quantified based on limited data available from the case studies. The LCCA performed in this study consisted of differentscenarios in which the number of operating hours was evaluated to estimate the cost efficiency of the intelligent compactiontechnique during construction. The analyses showed a reduction in energy consumption and the production of greenhousegas (GHG) emissions with the use of intelligent compaction. The LCCA showed that the use of IC technology may reducethe construction and maintenance costs in addition to enhancing the quality control and quality assurance (QC/QA) process. However, a more comprehensive analysis is required to fully quantify the benefits and establish more accurate performanceindicators. A draft version of the preliminary guidelines for implementation of IC technology and long-term monitoring ofthe performance of pavement layers compacted thereby is also included in this report.
17. Key WordsCompaction, Paving, Life Cycle Costing,Pavements, Infrastructure
18. Distribution StatementNo restrictions. This document is available to the public through TheNational Technical Information Service, Springfield, VA 22161
19. Security Classif. (of this report) Unclassified
20. Security Classif. (of this page) Unclassified
21. No. of Pages 49
22. Price
FORM DOT F 1700.7 (8-72)
M I N E T A T R A N S P O R T A T I O N I N S T I T U T E iii
Copyright © 2021
by Mineta Transportation Institute
All rights reserved.
DOI: 10.31979/mti.2021.1923
Mineta Transportation Institute College of Business
San José State University San José, CA 95192-0219
Tel: (408) 924-7560 Email: [email protected]
transweb.sjsu.edu/research/1923

M I N E T A T R A N S P O R T A T I O N I N S T I T U T E iv
ACKNOWLEDGMENTS
The authors would like to thank the Caltrans Division of Construction Standards, especially Ragu Thangavelautham and Blair Anderson, for their support and help with the field data collection and other parts of this study.
The authors also thank Editing Press for editorial services, as well as MTI staff.
M I N E T A T R A N S P O R T A T I O N I N S T I T U T E v
CONTENTS
List of Figures ................................................................................................................................. vi List of Tables ................................................................................................................................ vii Executive Summary ........................................................................................................................ 1 I. Introduction ................................................................................................................................. 3 II. Technical Background ............................................................................................................... 6
2.1 Intelligent Compaction (IC) Systems ........................................................................... 6 III. State of Practice: Implementation of Intelligent Compaction Technology .......................... 10 IV. Field Data Collection ............................................................................................................. 13
4.1 Project Details ............................................................................................................. 13 4.2 Data Collection ........................................................................................................... 13 4.3 Data Analysis .............................................................................................................. 15
V. Benefit-Cost Analysis .............................................................................................................. 17 5.1 Construction Cost Approach ...................................................................................... 17 5.2 Roadway Life-Cycle Cost Approach .......................................................................... 19
VI. Life-Cycle Cost Analysis (LCCA) ........................................................................................ 21 6.1 LCCA Methodology .................................................................................................. 21 6.2 LCCA Terminology ................................................................................................... 22 6.3 LCCA Approaches ..................................................................................................... 23 6.4 LCCA Case Study for Intelligent Compaction.......................................................... 23
VII. Case Study............................................................................................................................. 33 7.1 Project Details ............................................................................................................. 33 7.2 Data Collection Approach .......................................................................................... 33 7.3 Data Analysis .............................................................................................................. 34
VIII. Draft Guidelines for Assessing the Effectiveness of IC Technology ................................. 41 8.1 Phase I: Construction Monitoring .............................................................................. 41 8.2 Phase II: Long-Term Pavement Monitoring ............................................................. 42
IX. Conclusions ............................................................................................................................ 44 Bibliography .................................................................................................................................. 45 About the Authors ........................................................................................................................ 49
M I N E T A T R A N S P O R T A T I O N I N S T I T U T E vi
LIST OF FIGURES
Figure 1. Current State of Practice for Random Selection of In-Situ Compaction Quality Control Spots .........................................................................................................................4
Figure 2. Example of Complete IC Coverage versus Randomly Selected Quality Control Spots ............................................................................................................5
Figure 3. Components of an IC Roller ............................................................................................6 Figure 4. Global Positioning System Antenna ................................................................................7 Figure 5. Infrared Sensor .................................................................................................................7 Figure 6. Accelerometer Mounted on Roller Drum ........................................................................8 Figure 7. Onboard Display ..............................................................................................................8 Figure 8. Vibration Response from Soil Layers ...............................................................................9 Figure 9. Process of Collecting IC Data and Generating the Compaction Quality Map ..............9 Figure 10. State DOTs with IC Specifications for Soils and Asphalt ..........................................10 Figure 11. Advancement of IC-Related Studies from 1999 to 2018 ............................................11 Figure 12. Number of Passes and Coverage Percentage for the IC Operation .............................14 Figure 13. Cost of the Asphalt Pavement Construction using CC versus IC ..............................19 Figure 14. Work Zone Traffic Diversion Cycle ............................................................................25 Figure 15. Lifespan of Pavement Constructed using CC .............................................................28 Figure 16. Lifespan of Pavement Constructed using IC ...............................................................28 Figure 17. Comparison of Analysis Period for CC versus IC .......................................................29 Figure 18. A Sample Segment at the Field Data Collection Site .................................................33 Figure 19. Field Data Collection Approach ..................................................................................34 Figure 20. Average Compaction Duration per Lane-Mile for Intermediate Roller .....................35 Figure 21. Average Compaction Duration per Lane-Mile for Breakdown Roller .......................35 Figure 22. Cumulative Maintenance Cost Savings for 1,700 Lane-Miles after using IC Figure 23. Fuel Savings after One Year and Ten Years ................................................................36 Figure 24. Water Usage Savings for One Year and Ten Years .....................................................37 Figure 25. CO Emission Reductions for One Year and Ten Years ..............................................38 Figure 26. NOx Emission Reductions for One Year and Ten Years ............................................38 Figure 27. Location of Segments Compacted with Conventional and
Intelligent Compaction ........................................................................................................39 Figure 28. Comparison of Density Values for the Cores Extracted from the Segments
Compacted with CC and IC ................................................................................................40 Figure 29. Draft Guidelines for Implementation and Performance Monitoring of IC ................43
M I N E T A T R A N S P O R T A T I O N I N S T I T U T E vii
LIST OF TABLES
Table 1. Summary of Recorded Data for Conventional Compaction (Northbound) ...................14 Table 2. Summary of the Results from IC Data Calculations ......................................................15 Table 3. Summary of Construction Performance ..........................................................................15 Table 4. Density Results from the Cores ......................................................................................16 Table 5. Single Factor ANOVA for Density Results ....................................................................16 Table 6. Cost Breakdown of Conventional Compaction versus IC per One Mile of
Asphalt Pavement (after Savan et al. 2016) .........................................................................17 Table 7. Cost Items for Benefit-Cost Analysis (after Savan et al. 2017) ......................................18 Table 8. Construction Cost Items with the Assumption that IC has No Improvement
on the Compaction Speed ....................................................................................................19 Table 9. Roadway Life-Cycle Cost per Mile for One Year and Twenty-Six Years
(after Savan et al. 2016) ........................................................................................................20 Table 10. Roadway Life-Cycle Cost per Mile for One Year and Fifteen Years
(after Savan et al. 2016) ........................................................................................................20 Table 11. Agency Cost Calculation per Lane-Mile ......................................................................24 Table 12. Value of User Time .......................................................................................................25 Table 13. Inputs for Total User Cost Delay Formula ...................................................................26 Table 14. Total User Cost Calculation ..........................................................................................26 Table 15. Maintenance Treatment Cost Calculation per Lane-Mile ...........................................27 Table 16. Average Application Time for Pavement Treatments for Different Scenarios ............27 Table 17. Net Present Value Calculation for Scenario 1 with Conventional Compaction ..........30 Table 18. Net Present Value Calculation for Scenario 2 using Intelligent Compaction,
Life-Cycle Improvement Factor = 1.5 .................................................................................31 Table 19. Total Cost Comparison of Two Scenarios ....................................................................31 Table 20. Agency Cost Comparison of Two Scenarios ................................................................32 Table 21. User Cost Comparison of Two Scenarios .....................................................................32 Table 22. Summary of the Recorded Field Data ...........................................................................35 Table 23. Estimated Cost of Construction for One Lane-Mile ...................................................36 Table 24. Roadway Life-Cycle Cost for IC and CC Scenarios ....................................................36 Table 25. Roller Energy and Emission Estimations for One Hour ..............................................37 Table 26. Energy Usage and Emissions for One Lane-Mile of Compaction ...............................37 Table 27. Proposed Tasks during the Construction Phase for Implementation of IC .................41 Table 28. Proposed Schedule for Pavement Monitoring ..............................................................42
M I N E T A T R A N S P O R T A T I O N I N S T I T U T E 1
Executive Summary
The performance of transportation infrastructure foundations and pavement structures is dependent on the compaction quality and uniformity during the construction process. The current state of practice for compaction quality control of pavement layers is to estimate in-situ density on randomly selected spots across the construction area. However, the inherent material variability and other sources of uncertainties during the production and construction phases introduce spatial variability that cannot be captured with random spot testing. A more comprehensive test method that can cover the entire compacted area is necessary to ensure the uniformity and durability of the compacted pavement layer. With the recent advancements of construction techniques such as Intelligent Compaction (IC), a comprehensive data set describing the construction process can be collected. IC systems usually include a vibration sensor (accelerometer) mounted inside the roller drum, a Global Positioning System (GPS) receiver mounted on the roller cabin, and a data acquisition system attached to a display that presents real-time construction data to the operator. IC systems provide a comprehensive set of information during and after the construction process that could be used to improve and enhance construction uniformity and quality.
One of the main objectives of this study was to provide the means to ensure that the foundation layers of transportation infrastructure are properly constructed and rehabilitated using IC, which can extend the life and enhance the resilience of the infrastructure. The outcomes of this research can help to improve current practices in the construction of infrastructure foundation layers using an intelligent construction technique that optimizes performance and ensures uniformity and quality.
This report summarizes the authors’ efforts toward developing guidelines for the use of intelligent compaction in the construction quality management process pertaining to pavement layers. The report includes the following chapters.
Chapter I introduces Intelligent Compaction technology, describes its basic concepts, and discusses how it can improve compaction quality and uniformity.
Chapters II and III summarize background information related to IC implementation and the state of practice in the application of IC to the construction of pavement layers.
Chapter IV includes the details of field data collection during the construction of pavement layers in the case study.
Chapter V summarizes the process of conducting a cost-benefit analysis based on the limited data available from the field evaluations and a case study.
Chapter VI includes basic information about the life-cycle cost analysis (LCCA) for the implementation of IC.

M I N E T A T R A N S P O R T A T I O N I N S T I T U T E 2
Chapter VII focuses on a case study that was performed as a part of this project to apply the methods and processes developed here.
Chapter VIII summarizes the preliminary version of the authors’ draft guidelines for the implementation and long-term monitoring of pavement sections compacted with IC rollers and compares the IC sections with those constructed with conventional compaction methods.
Chapter IX summarizes the conclusions and outcomes of this project.
M I N E T A T R A N S P O R T A T I O N I N S T I T U T E 3
I. Introduction
Improving construction quality and extending the life of transportation infrastructures and the state highway network in California is one of the major goals of Senate Bill 1 (SB1) and the funding it allocates. According to Caltrans, 17,000 miles of pavement will be repaired or replaced by 2027 through SB1 funds. California’s state-maintained transportation infrastructure will receive half of the revenue, which is about $26 billion. About $1.5 billion will be spent on road replacements and repairs.
The performance of transportation infrastructure foundations and pavement structures depends, among other things, on the compaction quality and uniformity during the construction process. Compactions of earthwork and pavement layers are evaluated based on the in-situ dry density of the compacted layer (in comparison to the laboratory values) using a nuclear gauge. Even though the density criterion has been the main method of evaluating the compaction quality in the field, there is not a direct correlation between the density and stiffness of the compacted layer (Nazarian et al. 2015; Schwartz et al. 2017; Mazari et al. 2017, and Fathi et al. 2019). Moreover, the Mechanistic-Empirical Pavement Design Guide (MEPDG), also known as AASHTOW or PaveME, considers stiffness and modulus as the main criteria for the design of subgrade and unbound granular layers. There is a missing link between a density-based field compaction quality control and a modulus-based design approach. Moving toward a modulus-based field quality control and quality acceptance (QC/QA) process, even though it seems straightforward, will be associated with some difficulties at the agency level between contractors and owners (Nazarian et al. 2020).
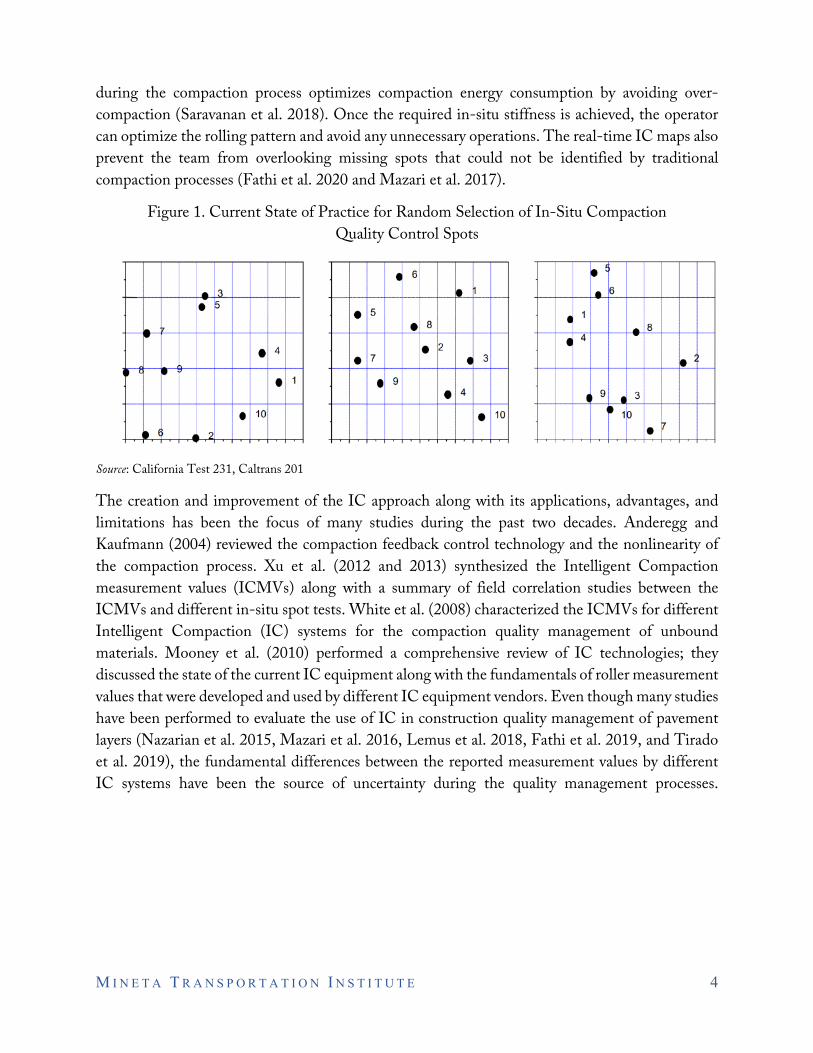
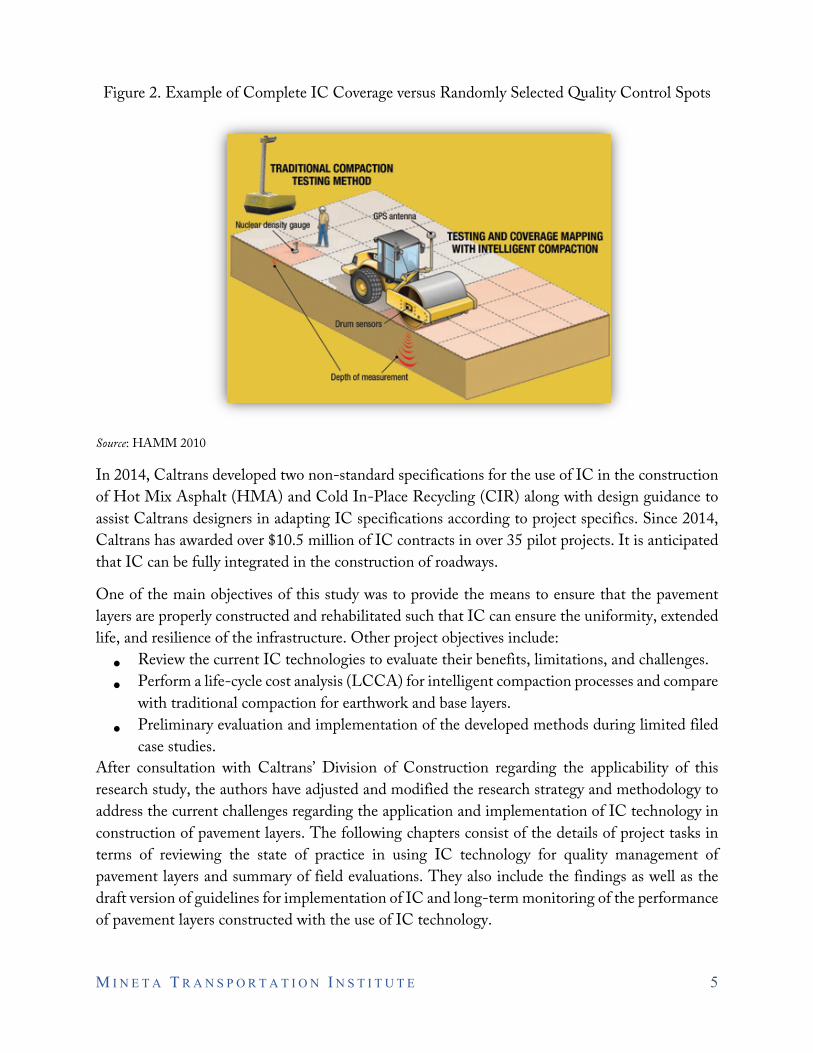
The current state of practice for compaction quality control of pavement layers uses a density gauge to perform in-situ density tests on randomly selected locations across the construction area. Figure 1 shows a sample of suggested random test locations per California Test 231 (Caltrans 2013). Even though the random selection process reduces the chance of a defective compaction process, most areas across the construction section will not be tested. The under-compacted areas will eventually affect the performance of the top pavement layers under traffic loads and will cause localized deterioration problems. A uniform compaction quality control process that covers 100 percent of the compacted area (Figure 2) can ensure the uniformity of compaction and extend the service life of the pavement structure. The intelligent compaction (IC) technology can facilitate this process. It collects a comprehensive set of data, including vibration frequency and amplitude as well as number of passes and roller speed, during the compaction process that covers the entire construction section. The vibration sensor on the IC roller captures the vibration response of the compacted layer that can be translated to stiffness, which is a better indication of the compaction quality. The under-compacted areas are then identified on the color-coded maps by the IC system, which can be mounted on any regular vibratory roller compactor. Those less stiff locations can be selected by the quality engineer for additional in-situ spot tests (Fathi et al. 2018). A uniformly compacted layer can be ensured with the use of IC technology. Moreover, the application of IC
M I N E T A T R A N S P O R T A T I O N I N S T I T U T E 4
during the compaction process optimizes compaction energy consumption by avoiding over-compaction (Saravanan et al. 2018). Once the required in-situ stiffness is achieved, the operator can optimize the rolling pattern and avoid any unnecessary operations. The real-time IC maps also prevent the team from overlooking missing spots that could not be identified by traditional compaction processes (Fathi et al. 2020 and Mazari et al. 2017).
Figure 1. Current State of Practice for Random Selection of In-Situ Compaction Quality Control Spots
Source: California Test 231, Caltrans 201
The creation and improvement of the IC approach along with its applications, advantages, and limitations has been the focus of many studies during the past two decades. Anderegg and Kaufmann (2004) reviewed the compaction feedback control technology and the nonlinearity of the compaction process. Xu et al. (2012 and 2013) synthesized the Intelligent Compaction measurement values (ICMVs) along with a summary of field correlation studies between the ICMVs and different in-situ spot tests. White et al. (2008) characterized the ICMVs for different Intelligent Compaction (IC) systems for the compaction quality management of unbound materials. Mooney et al. (2010) performed a comprehensive review of IC technologies; they discussed the state of the current IC equipment along with the fundamentals of roller measurement values that were developed and used by different IC equipment vendors. Even though many studies have been performed to evaluate the use of IC in construction quality management of pavement layers (Nazarian et al. 2015, Mazari et al. 2016, Lemus et al. 2018, Fathi et al. 2019, and Tirado et al. 2019), the fundamental differences between the reported measurement values by different IC systems have been the source of uncertainty during the quality management processes.
M I N E T A T R A N S P O R T A T I O N I N S T I T U T E 5
Figure 2. Example of Complete IC Coverage versus Randomly Selected Quality Control Spots
Source: HAMM 2010
In 2014, Caltrans developed two non-standard specifications for the use of IC in the construction of Hot Mix Asphalt (HMA) and Cold In-Place Recycling (CIR) along with design guidance to assist Caltrans designers in adapting IC specifications according to project specifics. Since 2014, Caltrans has awarded over $10.5 million of IC contracts in over 35 pilot projects. It is anticipated that IC can be fully integrated in the construction of roadways.
One of the main objectives of this study was to provide the means to ensure that the pavement layers are properly constructed and rehabilitated such that IC can ensure the uniformity, extended life, and resilience of the infrastructure. Other project objectives include:
• Review the current IC technologies to evaluate their benefits, limitations, and challenges.• Perform a life-cycle cost analysis (LCCA) for intelligent compaction processes and compare
with traditional compaction for earthwork and base layers.• Preliminary evaluation and implementation of the developed methods during limited filed
case studies.After consultation with Caltrans’ Division of Construction regarding the applicability of this research study, the authors have adjusted and modified the research strategy and methodology to address the current challenges regarding the application and implementation of IC technology in construction of pavement layers. The following chapters consist of the details of project tasks in terms of reviewing the state of practice in using IC technology for quality management of pavement layers and summary of field evaluations. They also include the findings as well as the draft version of guidelines for implementation of IC and long-term monitoring of the performance of pavement layers constructed with the use of IC technology.
M I N E T A T R A N S P O R T A T I O N I N S T I T U T E 6
II. Technical Background The conventional quality management approach includes spot testing methods that are used to evaluate the quality of the compacted layer. The typical spot tests are nuclear density gauge (NDG), falling weight deflectometer (FWD), sand cone test, pavement quality indicator (PQI), and laboratory evaluation of drilled cores. Conducting spot tests is a time-consuming process, and in some cases (such as coring), test results may delay the quality control and assurance process. Moreover, performing spot tests may cause delays in the construction process. To overcome these challenges, the early stages of intelligent compaction systems were developed as Continuous Compaction Control (CCC) where the vibration parameters of the roller were correlated with the stiffness of the compacted pavement layer. IC systems have been evolving during the past two decades and have been successfully implemented in many construction projects.
2.1 Intelligent Compaction (IC) Systems
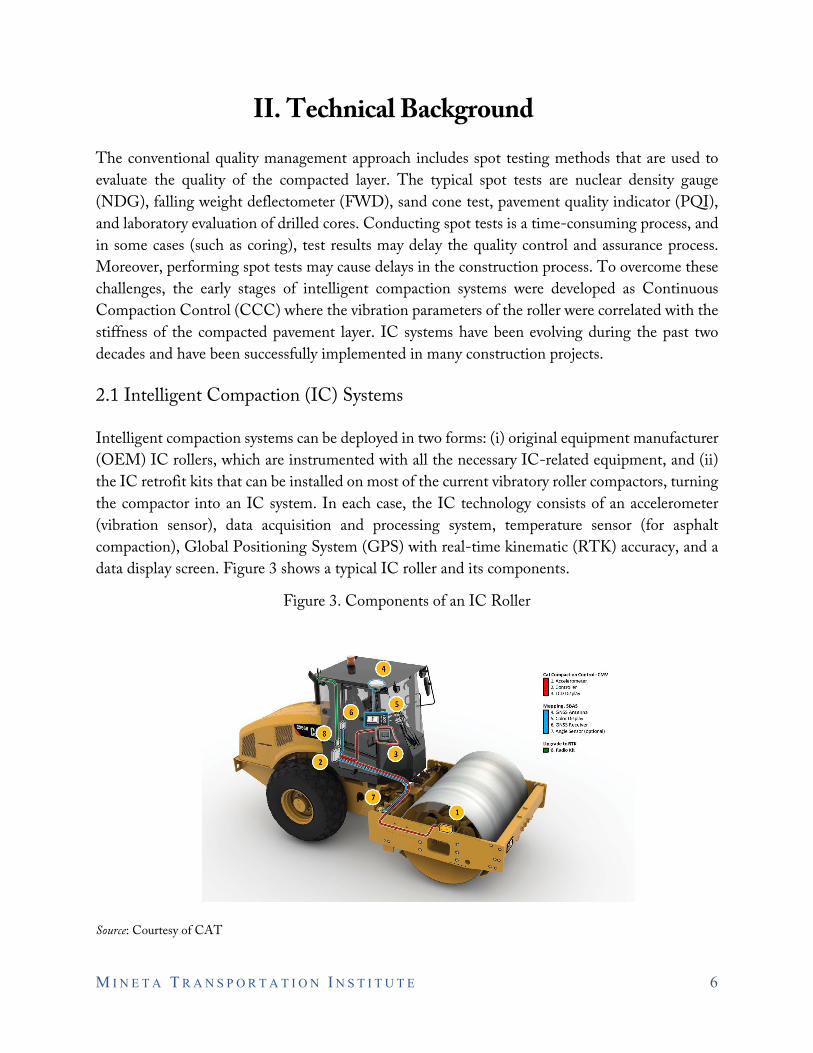
Intelligent compaction systems can be deployed in two forms: (i) original equipment manufacturer (OEM) IC rollers, which are instrumented with all the necessary IC-related equipment, and (ii) the IC retrofit kits that can be installed on most of the current vibratory roller compactors, turning the compactor into an IC system. In each case, the IC technology consists of an accelerometer (vibration sensor), data acquisition and processing system, temperature sensor (for asphalt compaction), Global Positioning System (GPS) with real-time kinematic (RTK) accuracy, and a data display screen. Figure 3 shows a typical IC roller and its components.
Figure 3. Components of an IC Roller
Source: Courtesy of CAT
M I N E T A T R A N S P O R T A T I O N I N S T I T U T E 7
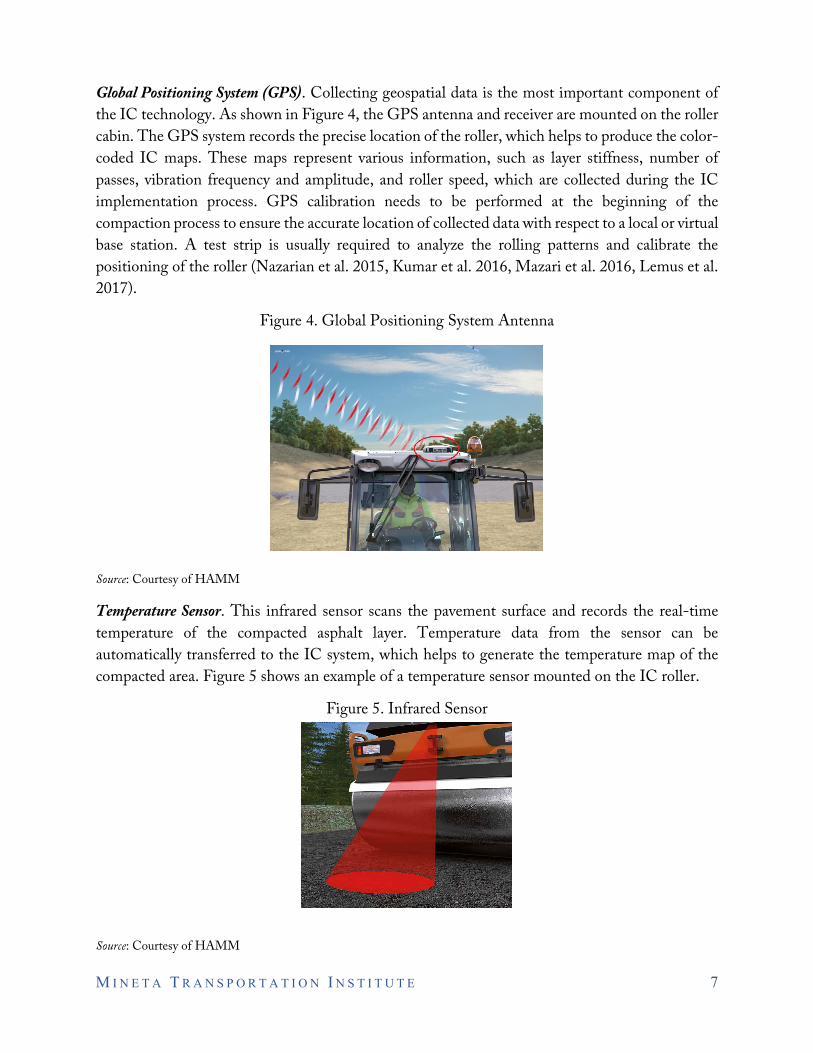
Global Positioning System (GPS). Collecting geospatial data is the most important component of the IC technology. As shown in Figure 4, the GPS antenna and receiver are mounted on the roller cabin. The GPS system records the precise location of the roller, which helps to produce the color-coded IC maps. These maps represent various information, such as layer stiffness, number of passes, vibration frequency and amplitude, and roller speed, which are collected during the IC implementation process. GPS calibration needs to be performed at the beginning of the compaction process to ensure the accurate location of collected data with respect to a local or virtual base station. A test strip is usually required to analyze the rolling patterns and calibrate the positioning of the roller (Nazarian et al. 2015, Kumar et al. 2016, Mazari et al. 2016, Lemus et al. 2017).
Figure 4. Global Positioning System Antenna
Source: Courtesy of HAMM
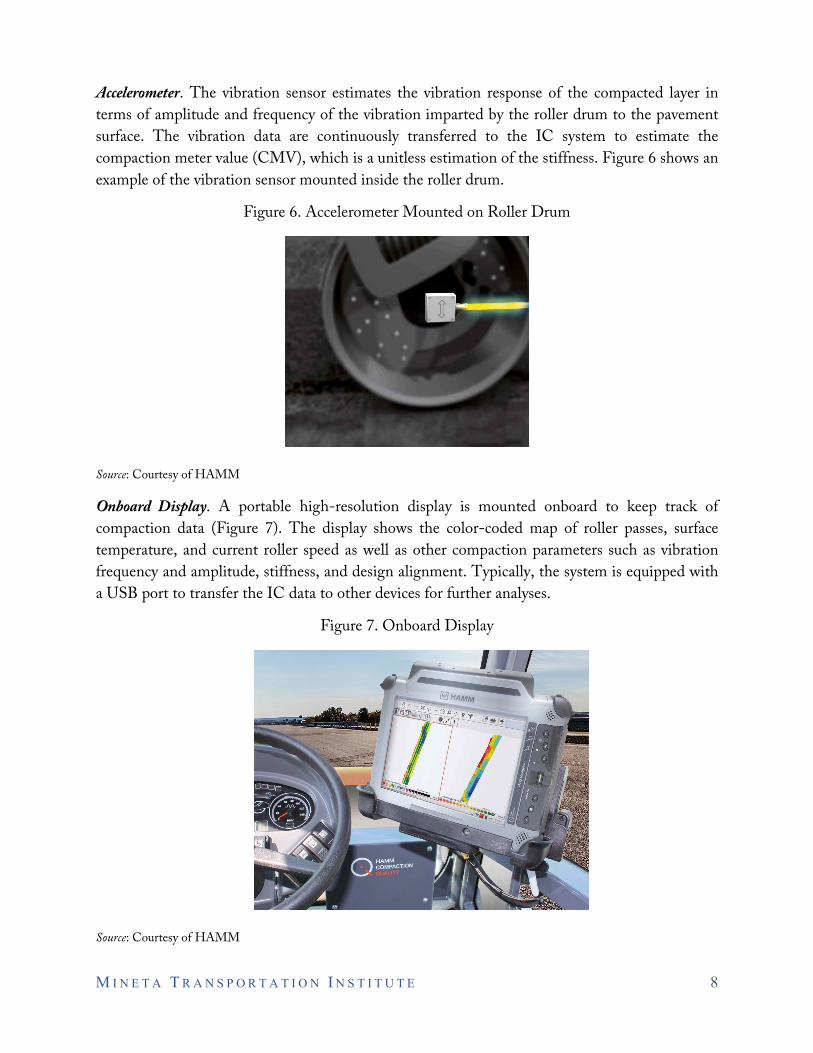
Temperature Sensor. This infrared sensor scans the pavement surface and records the real-time temperature of the compacted asphalt layer. Temperature data from the sensor can be automatically transferred to the IC system, which helps to generate the temperature map of the compacted area. Figure 5 shows an example of a temperature sensor mounted on the IC roller.
Figure 5. Infrared Sensor
Source: Courtesy of HAMM
M I N E T A T R A N S P O R T A T I O N I N S T I T U T E 8
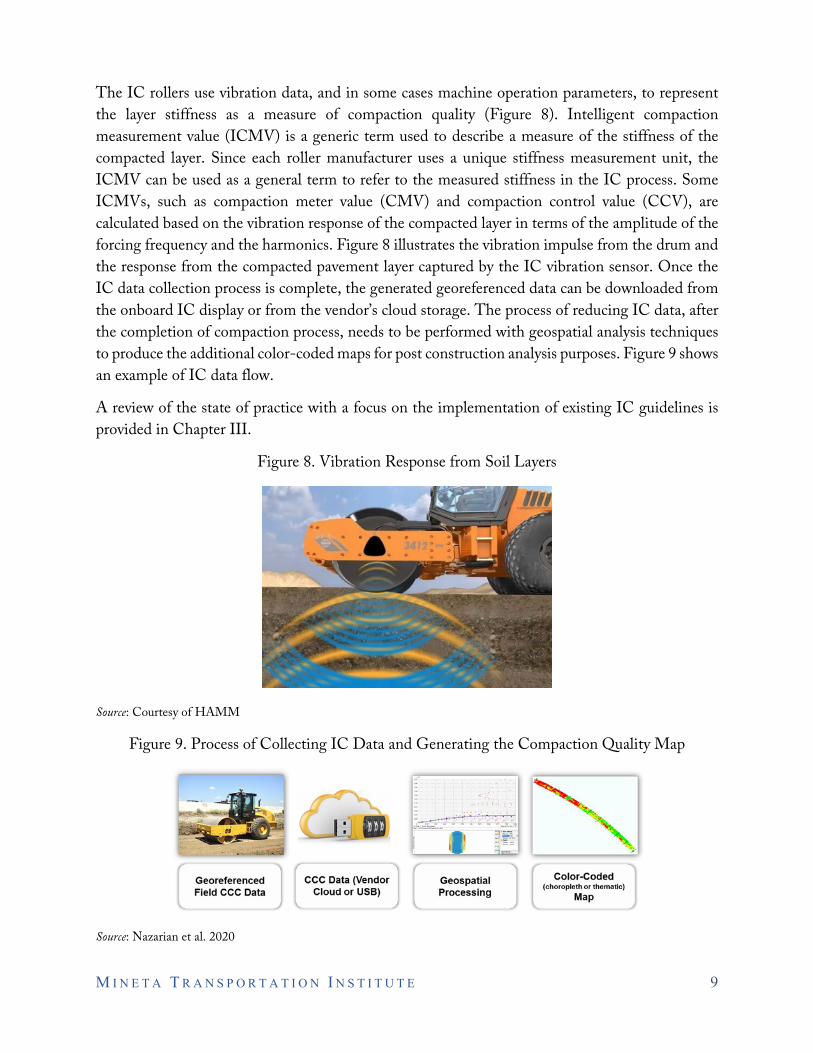
Accelerometer. The vibration sensor estimates the vibration response of the compacted layer in terms of amplitude and frequency of the vibration imparted by the roller drum to the pavement surface. The vibration data are continuously transferred to the IC system to estimate the compaction meter value (CMV), which is a unitless estimation of the stiffness. Figure 6 shows an example of the vibration sensor mounted inside the roller drum.
Figure 6. Accelerometer Mounted on Roller Drum
Source: Courtesy of HAMM
Onboard Display. A portable high-resolution display is mounted onboard to keep track of compaction data (Figure 7). The display shows the color-coded map of roller passes, surface temperature, and current roller speed as well as other compaction parameters such as vibration frequency and amplitude, stiffness, and design alignment. Typically, the system is equipped with a USB port to transfer the IC data to other devices for further analyses.
Figure 7. Onboard Display
Source: Courtesy of HAMM
M I N E T A T R A N S P O R T A T I O N I N S T I T U T E 9
The IC rollers use vibration data, and in some cases machine operation parameters, to represent the layer stiffness as a measure of compaction quality (Figure 8). Intelligent compaction measurement value (ICMV) is a generic term used to describe a measure of the stiffness of the compacted layer. Since each roller manufacturer uses a unique stiffness measurement unit, the ICMV can be used as a general term to refer to the measured stiffness in the IC process. Some ICMVs, such as compaction meter value (CMV) and compaction control value (CCV), are calculated based on the vibration response of the compacted layer in terms of the amplitude of the forcing frequency and the harmonics. Figure 8 illustrates the vibration impulse from the drum and the response from the compacted pavement layer captured by the IC vibration sensor. Once the IC data collection process is complete, the generated georeferenced data can be downloaded from the onboard IC display or from the vendor’s cloud storage. The process of reducing IC data, after the completion of compaction process, needs to be performed with geospatial analysis techniques to produce the additional color-coded maps for post construction analysis purposes. Figure 9 shows an example of IC data flow.
A review of the state of practice with a focus on the implementation of existing IC guidelines is provided in Chapter III.
Figure 8. Vibration Response from Soil Layers
Source: Courtesy of HAMM
Figure 9. Process of Collecting IC Data and Generating the Compaction Quality Map
Source: Nazarian et al. 2020
M I N E T A T R A N S P O R T A T I O N I N S T I T U T E 10
III. State of Practice: Implementation of Intelligent Compaction Technology
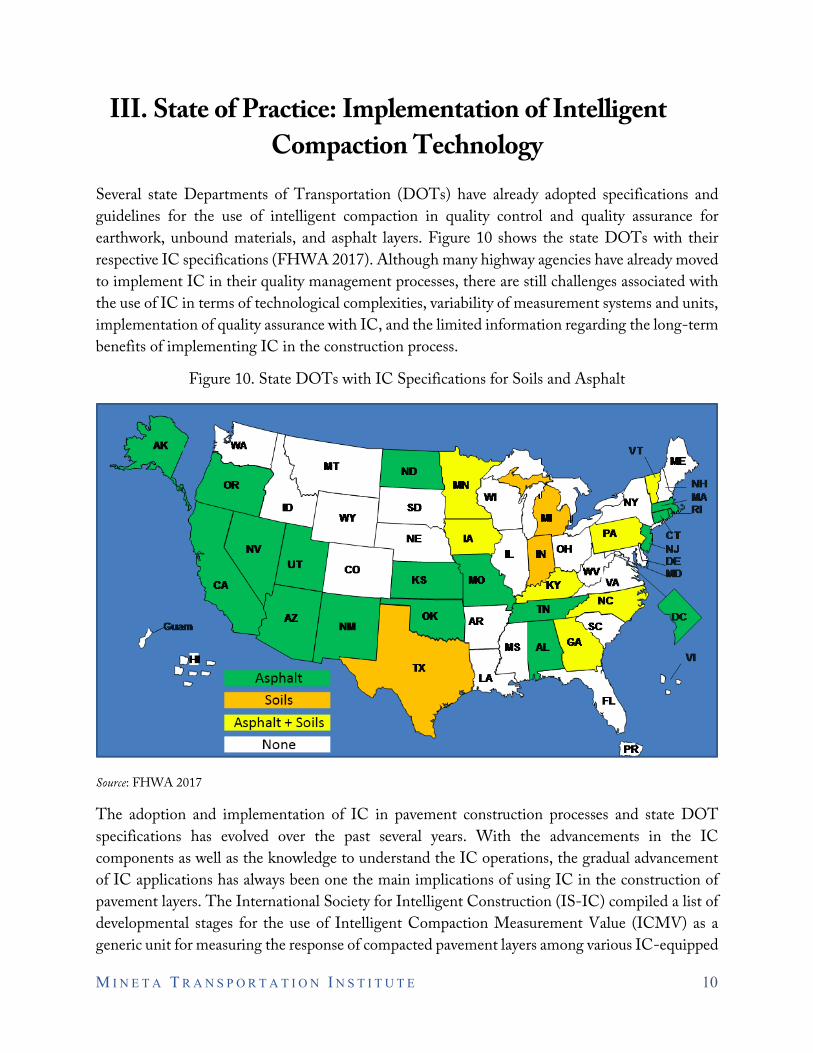
Several state Departments of Transportation (DOTs) have already adopted specifications and guidelines for the use of intelligent compaction in quality control and quality assurance for earthwork, unbound materials, and asphalt layers. Figure 10 shows the state DOTs with their respective IC specifications (FHWA 2017). Although many highway agencies have already moved to implement IC in their quality management processes, there are still challenges associated with the use of IC in terms of technological complexities, variability of measurement systems and units, implementation of quality assurance with IC, and the limited information regarding the long-term benefits of implementing IC in the construction process.
Figure 10. State DOTs with IC Specifications for Soils and Asphalt
Source: FHWA 2017
The adoption and implementation of IC in pavement construction processes and state DOT specifications has evolved over the past several years. With the advancements in the IC components as well as the knowledge to understand the IC operations, the gradual advancement of IC applications has always been one the main implications of using IC in the construction of pavement layers. The International Society for Intelligent Construction (IS-IC) compiled a list of developmental stages for the use of Intelligent Compaction Measurement Value (ICMV) as a generic unit for measuring the response of compacted pavement layers among various IC-equipped
M I N E T A T R A N S P O R T A T I O N I N S T I T U T E 11
roller compactors (Chang and Nazarian 2020). They have envisioned five levels of ICMV development as the following:
• Level I: Vibration frequency-based measurement based on empirical solutions
• Level II: Solutions based on machine drive power and rolling resistance
• Level III: Mechanistic solutions based on simplified static response
• Level IV: Hybrid approach with integrations of dynamic models
• Level V: Predictive models based on dynamic solutions combined with artificialintelligence techniques.
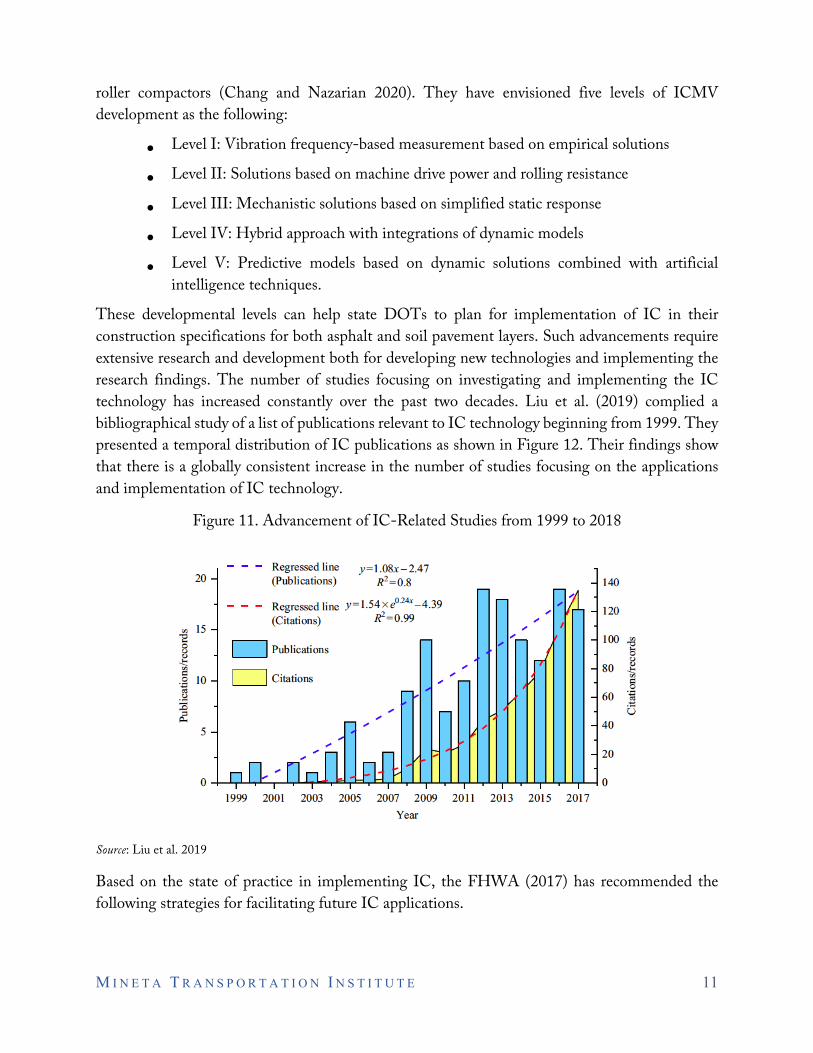
These developmental levels can help state DOTs to plan for implementation of IC in their construction specifications for both asphalt and soil pavement layers. Such advancements require extensive research and development both for developing new technologies and implementing the research findings. The number of studies focusing on investigating and implementing the IC technology has increased constantly over the past two decades. Liu et al. (2019) complied a bibliographical study of a list of publications relevant to IC technology beginning from 1999. They presented a temporal distribution of IC publications as shown in Figure 12. Their findings show that there is a globally consistent increase in the number of studies focusing on the applications and implementation of IC technology.
Figure 11. Advancement of IC-Related Studies from 1999 to 2018
Source: Liu et al. 2019
Based on the state of practice in implementing IC, the FHWA (2017) has recommended the following strategies for facilitating future IC applications.
M I N E T A T R A N S P O R T A T I O N I N S T I T U T E 12
• Development of national guidelines and a certificate program for personnel training
• Harmonization of IC specifications among state DOTs and highway agencies
• Standardizing the GPS calibration process to ensure consistent IC data collection
• Using a systematic approach to download the IC data from different vendor software platforms
• Incorporating the mechanistic approach for interpretation of IC data.
The following chapters of this report describe the process of field data collection as well as conducting a parallel assessment of IC and conventional compaction processes. A life-cycle cost analysis is also performed to partially evaluate the benefits of using an IC system. Finally, the last chapter provides the guidelines for implementation of intelligent compaction and long-term monitoring of the pavement section compacted with IC technology. The proposed guidelines in this study provides additional information to the existing state of practice with regards to the implementation of IC for compaction of pavement layers.
M I N E T A T R A N S P O R T A T I O N I N S T I T U T E 13
IV. Field Data Collection
4.1 Project Details
The field data were collected as a part of the construction of a Rubberized Hot Mix Asphalt (RHMA) overlay in California. The thickness of the RHMA overlay was 0.2 in. and the width of the paved section was 12 ft. A double-drum vibratory roller was utilized to collect the IC data during the compaction process.
4.2 Data Collection
Three rollers were used to compact the pavement layer following the placement of materials by the paver machine. Two rollers were responsible for the breakdown and intermediate compaction, with no pause between the operations. Thereafter, the finisher roller was used to ensure a smooth surface.
The goal of this field data collection was to record the operating time, the number of passes, average speed, frequency, vibration status, GPS locations, and nuclear gauge density data to compare the performance of IC with the conventional compaction process. However, the field measurements encountered some challenges. As an example, although the first two rollers were meant to work as a twin, their performance was not identical in practice. At some segments, the machines were operating behind each other, which indicates two passes, and then they switched to parallel performance, which would be counted as one pass. Due to the lack of a consistent compaction pattern, it was difficult to record the machine path. Another challenge arose because segments were not pre-identified, and there were several overlapping segments in both longitudinal and transverse directions. One reason for such variability could be the variable speed of the paver machine ahead of the rollers. To meet the DOT specification requirements for the limited temperature range of the compacted asphalt layer, the overlapping was inevitable in some areas, which contributes to the change in number of passes in some sections. Regarding all these challenges, the research team managed to record the data for 13 segments of the conventional compaction (CC) process. Table 1 summarizes the recorded field data.
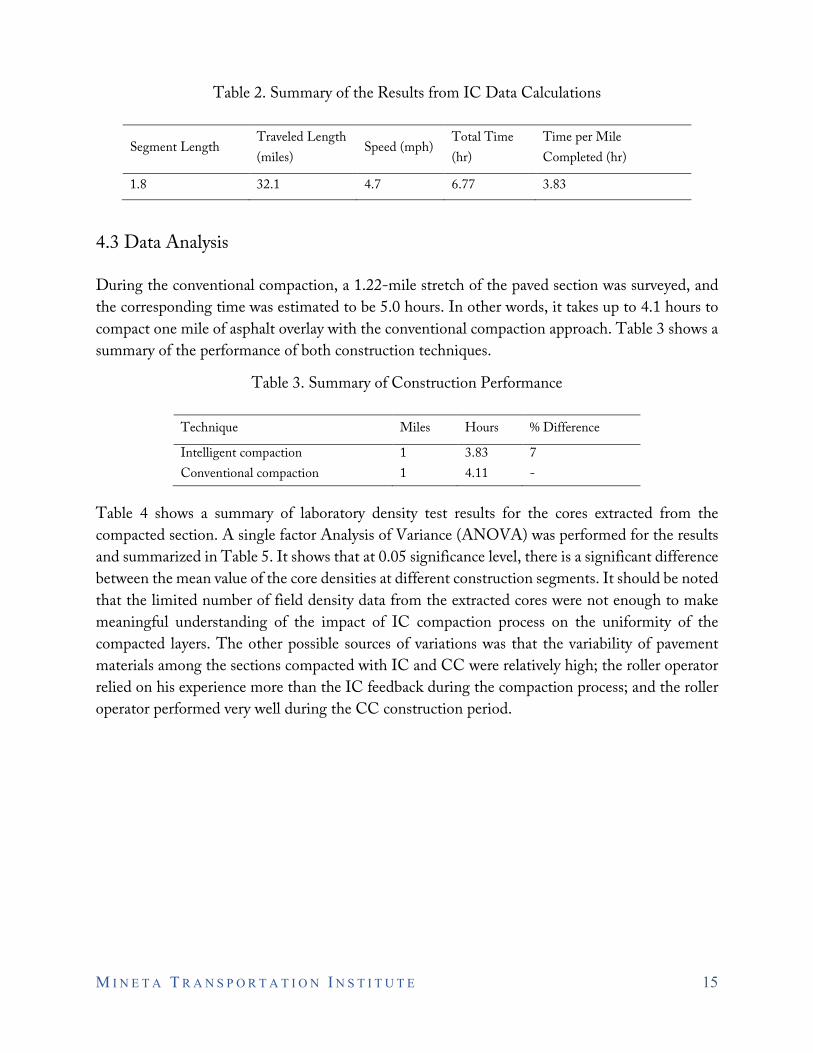
The IC data collection was performed during three night paving shifts. The construction lengths for these three shifts were 0.54, 1.77, and 0.34 miles, respectively. The second night paving shift was selected for comparison with the conventional compaction data in this study due to the matching length and consistency of the collected data. Using the VETA® software, which is the common tool used to reduce IC data, the number of passes and the coverage percentage for each pass were determined (Figure 12). The total area of the section constructed during this shift was calculated as 131,104 ft2. Multiplying the number of passes by the corresponding area and dividing by the width of the roller, the total traveled length can be estimated.
M I N E T A T R A N S P O R T A T I O N I N S T I T U T E 14
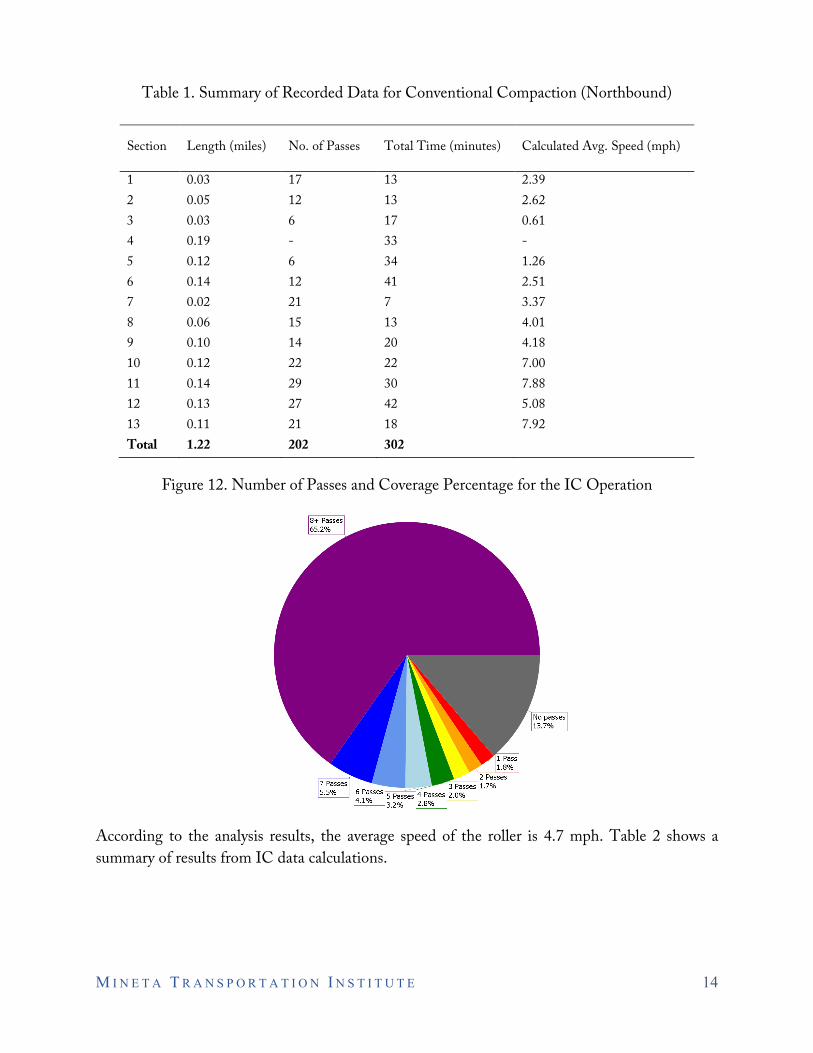
Table 1. Summary of Recorded Data for Conventional Compaction (Northbound)
Section Length (miles) No. of Passes Total Time (minutes) Calculated Avg. Speed (mph)
1 0.03 17 13 2.39 2 0.05 12 13 2.62 3 0.03 6 17 0.61 4 0.19 - 33 - 5 0.12 6 34 1.26 6 0.14 12 41 2.51 7 0.02 21 7 3.37 8 0.06 15 13 4.01 9 0.10 14 20 4.18 10 0.12 22 22 7.00 11 0.14 29 30 7.88 12 0.13 27 42 5.08 13 0.11 21 18 7.92 Total 1.22 202 302
Figure 12. Number of Passes and Coverage Percentage for the IC Operation
According to the analysis results, the average speed of the roller is 4.7 mph. Table 2 shows a summary of results from IC data calculations.
M I N E T A T R A N S P O R T A T I O N I N S T I T U T E 15
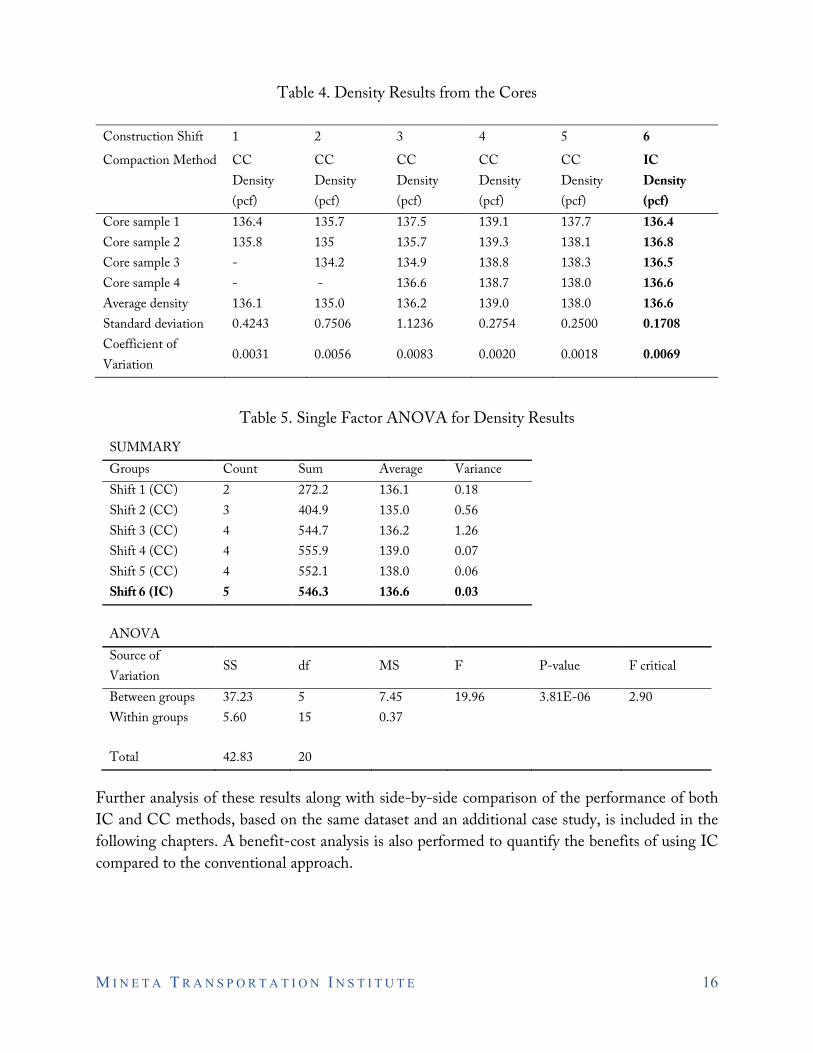
Table 2. Summary of the Results from IC Data Calculations
Segment Length Traveled Length (miles)
Speed (mph) Total Time(hr)
Time per Mile Completed (hr)
1.8 32.1 4.7 6.77 3.83
4.3 Data Analysis
During the conventional compaction, a 1.22-mile stretch of the paved section was surveyed, and the corresponding time was estimated to be 5.0 hours. In other words, it takes up to 4.1 hours to compact one mile of asphalt overlay with the conventional compaction approach. Table 3 shows a summary of the performance of both construction techniques.
Table 3. Summary of Construction Performance
Technique Miles Hours % Difference
Intelligent compaction 1 3.83 7 Conventional compaction 1 4.11 -
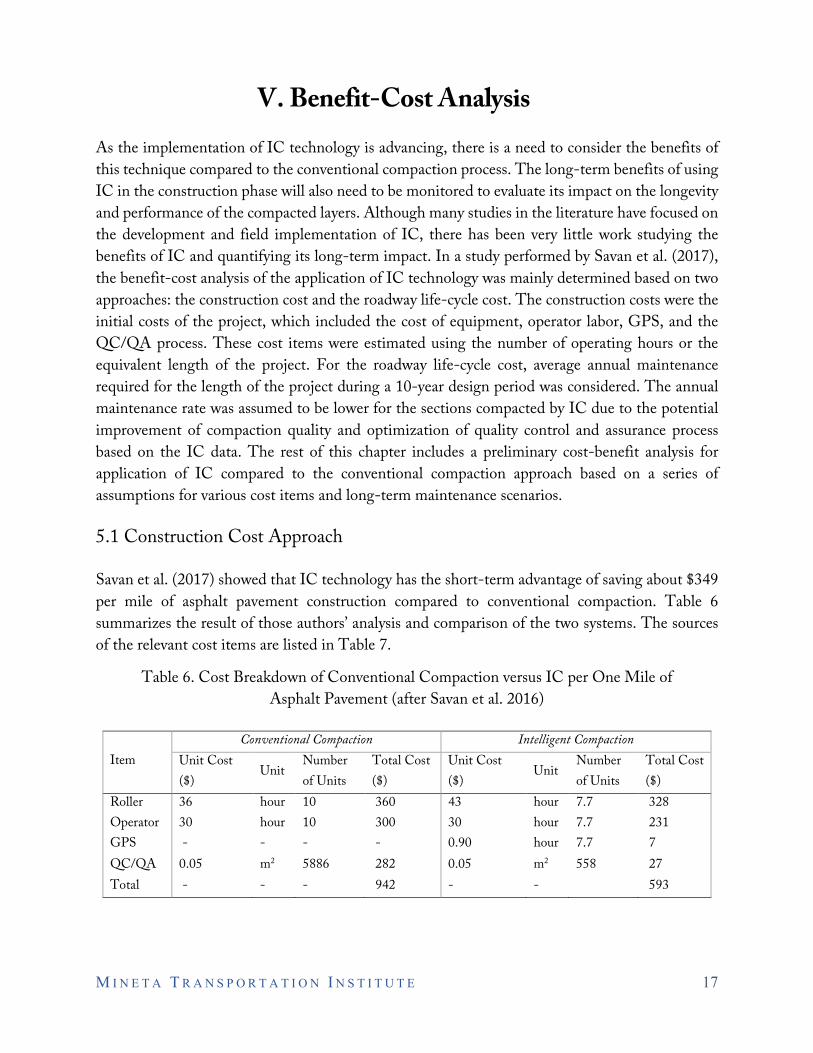
Table 4 shows a summary of laboratory density test results for the cores extracted from the compacted section. A single factor Analysis of Variance (ANOVA) was performed for the results and summarized in Table 5. It shows that at 0.05 significance level, there is a significant difference between the mean value of the core densities at different construction segments. It should be noted that the limited number of field density data from the extracted cores were not enough to make meaningful understanding of the impact of IC compaction process on the uniformity of the compacted layers. The other possible sources of variations was that the variability of pavement materials among the sections compacted with IC and CC were relatively high; the roller operator relied on his experience more than the IC feedback during the compaction process; and the roller operator performed very well during the CC construction period.
M I N E T A T R A N S P O R T A T I O N I N S T I T U T E 16
Table 4. Density Results from the Cores
Construction Shift 1 2 3 4 5 6
Compaction Method CC CC CC CC CC IC Density (pcf)
Density (pcf)
Density (pcf)
Density (pcf)
Density (pcf)
Density (pcf)
Core sample 1 136.4 135.7 137.5 139.1 137.7 136.4 Core sample 2 135.8 135 135.7 139.3 138.1 136.8 Core sample 3 - 134.2 134.9 138.8 138.3 136.5 Core sample 4 - - 136.6 138.7 138.0 136.6 Average density 136.1 135.0 136.2 139.0 138.0 136.6 Standard deviation 0.4243 0.7506 1.1236 0.2754 0.2500 0.1708 Coefficient of Variation
0.0031 0.0056 0.0083 0.0020 0.0018 0.0069
Table 5. Single Factor ANOVA for Density Results
SUMMARY Groups Count Sum Average Variance Shift 1 (CC) 2 272.2 136.1 0.18 Shift 2 (CC) 3 404.9 135.0 0.56 Shift 3 (CC) 4 544.7 136.2 1.26 Shift 4 (CC) 4 555.9 139.0 0.07 Shift 5 (CC) 4 552.1 138.0 0.06 Shift 6 (IC) 5 546.3 136.6 0.03
ANOVA Source of Variation
SS df MS F P-value F critical
Between groups 37.23 5 7.45 19.96 3.81E-06 2.90 Within groups 5.60 15 0.37
Total 42.83 20
Further analysis of these results along with side-by-side comparison of the performance of both IC and CC methods, based on the same dataset and an additional case study, is included in the following chapters. A benefit-cost analysis is also performed to quantify the benefits of using IC compared to the conventional approach.
M I N E T A T R A N S P O R T A T I O N I N S T I T U T E 17
V. Benefit-Cost Analysis
As the implementation of IC technology is advancing, there is a need to consider the benefits of this technique compared to the conventional compaction process. The long-term benefits of using IC in the construction phase will also need to be monitored to evaluate its impact on the longevity and performance of the compacted layers. Although many studies in the literature have focused on the development and field implementation of IC, there has been very little work studying the benefits of IC and quantifying its long-term impact. In a study performed by Savan et al. (2017), the benefit-cost analysis of the application of IC technology was mainly determined based on two approaches: the construction cost and the roadway life-cycle cost. The construction costs were the initial costs of the project, which included the cost of equipment, operator labor, GPS, and the QC/QA process. These cost items were estimated using the number of operating hours or the equivalent length of the project. For the roadway life-cycle cost, average annual maintenance required for the length of the project during a 10-year design period was considered. The annual maintenance rate was assumed to be lower for the sections compacted by IC due to the potential improvement of compaction quality and optimization of quality control and assurance process based on the IC data. The rest of this chapter includes a preliminary cost-benefit analysis for application of IC compared to the conventional compaction approach based on a series of assumptions for various cost items and long-term maintenance scenarios.
5.1 Construction Cost Approach
Savan et al. (2017) showed that IC technology has the short-term advantage of saving about $349 per mile of asphalt pavement construction compared to conventional compaction. Table 6 summarizes the result of those authors’ analysis and comparison of the two systems. The sources of the relevant cost items are listed in Table 7.
Table 6. Cost Breakdown of Conventional Compaction versus IC per One Mile of Asphalt Pavement (after Savan et al. 2016)
Item Conventional Compaction Intelligent Compaction
Unit Cost ($)
Unit Number of Units
Total Cost ($)
Unit Cost ($)
Unit Number of Units
Total Cost ($)
Roller 36 hour 10 360 43 hour 7.7 328 Operator 30 hour 10 300 30 hour 7.7 231 GPS - - - - 0.90 hour 7.7 7 QC/QA 0.05 m2 5886 282 0.05 m2 558 27 Total - - - 942 - - 593
M I N E T A T R A N S P O R T A T I O N I N S T I T U T E 18
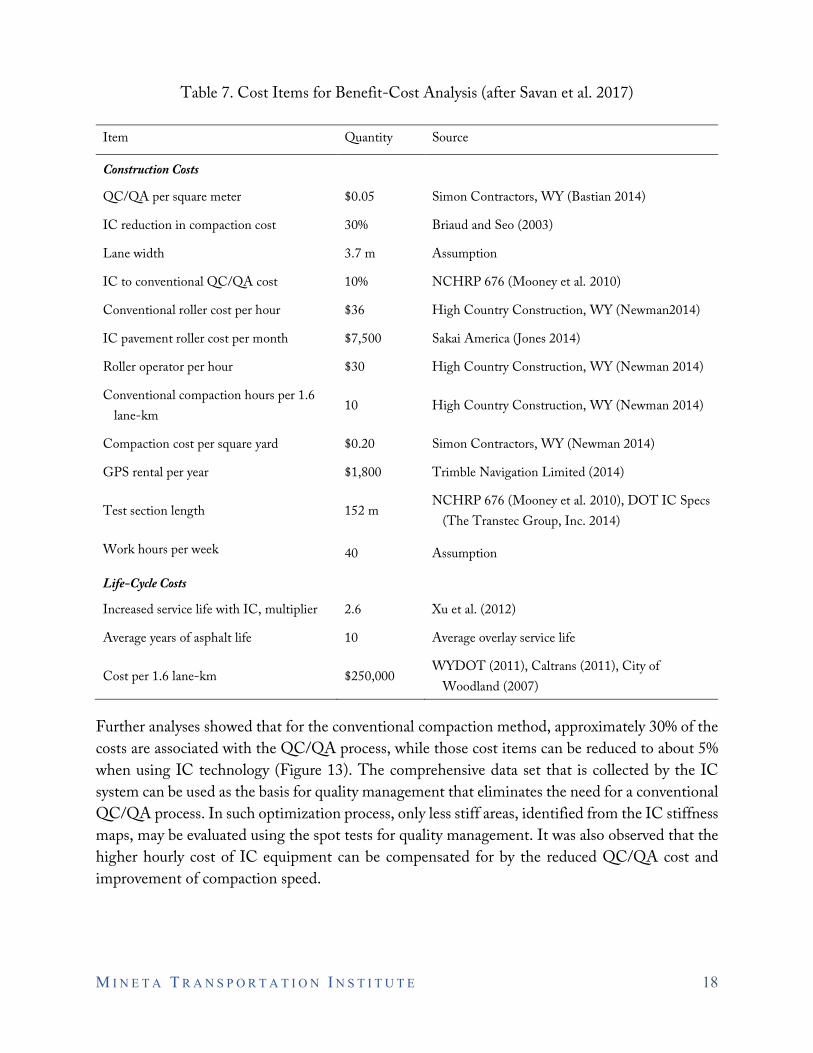
Table 7. Cost Items for Benefit-Cost Analysis (after Savan et al. 2017)
Item Quantity Source
Construction Costs
QC/QA per square meter $0.05 Simon Contractors, WY (Bastian 2014)
IC reduction in compaction cost 30% Briaud and Seo (2003)
Lane width 3.7 m Assumption
IC to conventional QC/QA cost 10% NCHRP 676 (Mooney et al. 2010)
Conventional roller cost per hour $36 High Country Construction, WY (Newman2014)
IC pavement roller cost per month $7,500 Sakai America (Jones 2014)
Roller operator per hour $30 High Country Construction, WY (Newman 2014)
Conventional compaction hours per 1.6 lane-km
10 High Country Construction, WY (Newman 2014)
Compaction cost per square yard $0.20 Simon Contractors, WY (Newman 2014)
GPS rental per year $1,800 Trimble Navigation Limited (2014)
Test section length 152 m NCHRP 676 (Mooney et al. 2010), DOT IC Specs
(The Transtec Group, Inc. 2014)
Work hours per week 40 Assumption
Life-Cycle Costs
Increased service life with IC, multiplier 2.6 Xu et al. (2012)
Average years of asphalt life 10 Average overlay service life
Cost per 1.6 lane-km $250,000 WYDOT (2011), Caltrans (2011), City of
Woodland (2007)
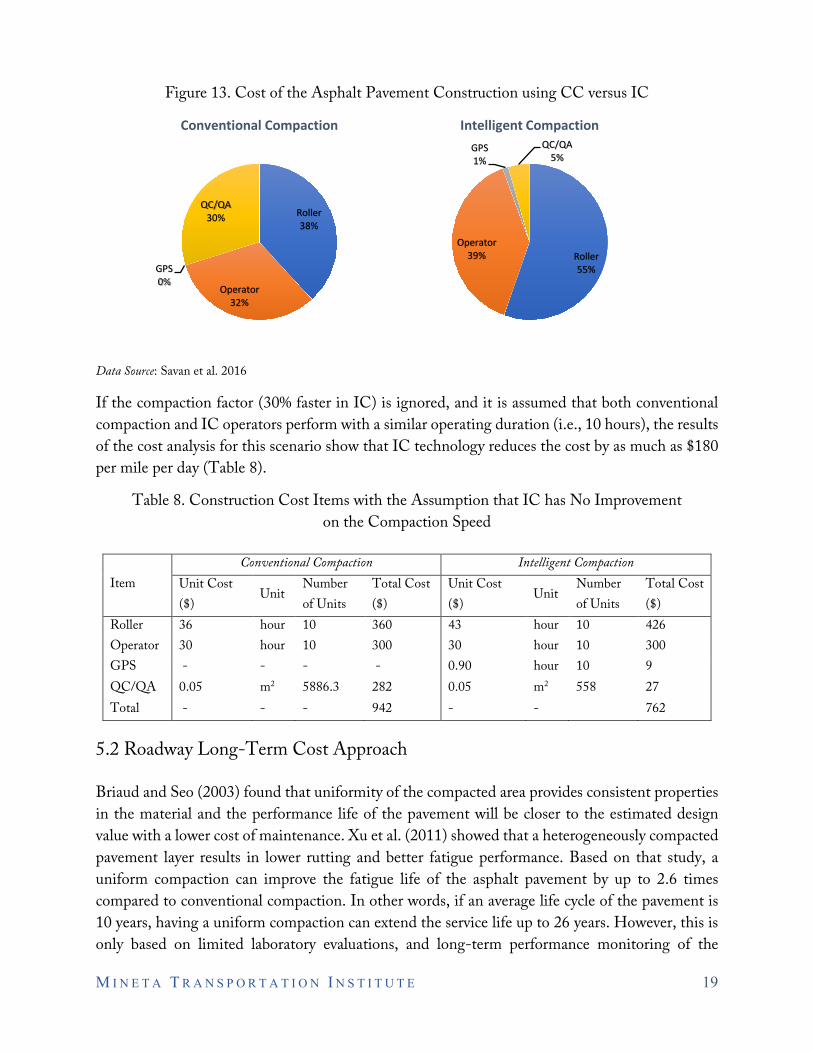
Further analyses showed that for the conventional compaction method, approximately 30% of the costs are associated with the QC/QA process, while those cost items can be reduced to about 5% when using IC technology (Figure 13). The comprehensive data set that is collected by the IC system can be used as the basis for quality management that eliminates the need for a conventional QC/QA process. In such optimization process, only less stiff areas, identified from the IC stiffness maps, may be evaluated using the spot tests for quality management. It was also observed that the higher hourly cost of IC equipment can be compensated for by the reduced QC/QA cost and improvement of compaction speed.
M I N E T A T R A N S P O R T A T I O N I N S T I T U T E 19
Figure 13. Cost of the Asphalt Pavement Construction using CC versus IC
Data Source: Savan et al. 2016
If the compaction factor (30% faster in IC) is ignored, and it is assumed that both conventional compaction and IC operators perform with a similar operating duration (i.e., 10 hours), the results of the cost analysis for this scenario show that IC technology reduces the cost by as much as $180 per mile per day (Table 8).
Table 8. Construction Cost Items with the Assumption that IC has No Improvement on the Compaction Speed
Item Conventional Compaction Intelligent Compaction
Unit Cost ($)
Unit Number of Units
Total Cost ($)
Unit Cost ($)
Unit Numberof Units
Total Cost ($)
Roller 36 hour 10 360 43 hour 10 426 Operator 30 hour 10 300 30 hour 10 300 GPS - - - - 0.90 hour 10 9 QC/QA 0.05 m2 5886.3 282 0.05 m2 558 27 Total - - - 942 - - 762
5.2 Roadway Long-Term Cost Approach
Briaud and Seo (2003) found that uniformity of the compacted area provides consistent properties in the material and the performance life of the pavement will be closer to the estimated design value with a lower cost of maintenance. Xu et al. (2011) showed that a heterogeneously compacted pavement layer results in lower rutting and better fatigue performance. Based on that study, a uniform compaction can improve the fatigue life of the asphalt pavement by up to 2.6 times compared to conventional compaction. In other words, if an average life cycle of the pavement is 10 years, having a uniform compaction can extend the service life up to 26 years. However, this is only based on limited laboratory evaluations, and long-term performance monitoring of the
Roller38%
Operator32%
GPS0%
QC/QA30%
Conventional Compaction
Roller55%
Operator39%
GPS1%
QC/QA5%
Intelligent Compaction
M I N E T A T R A N S P O R T A T I O N I N S T I T U T E 20
compacted pavement layers with different compaction methods is needed to estimate the actual longevity factor.
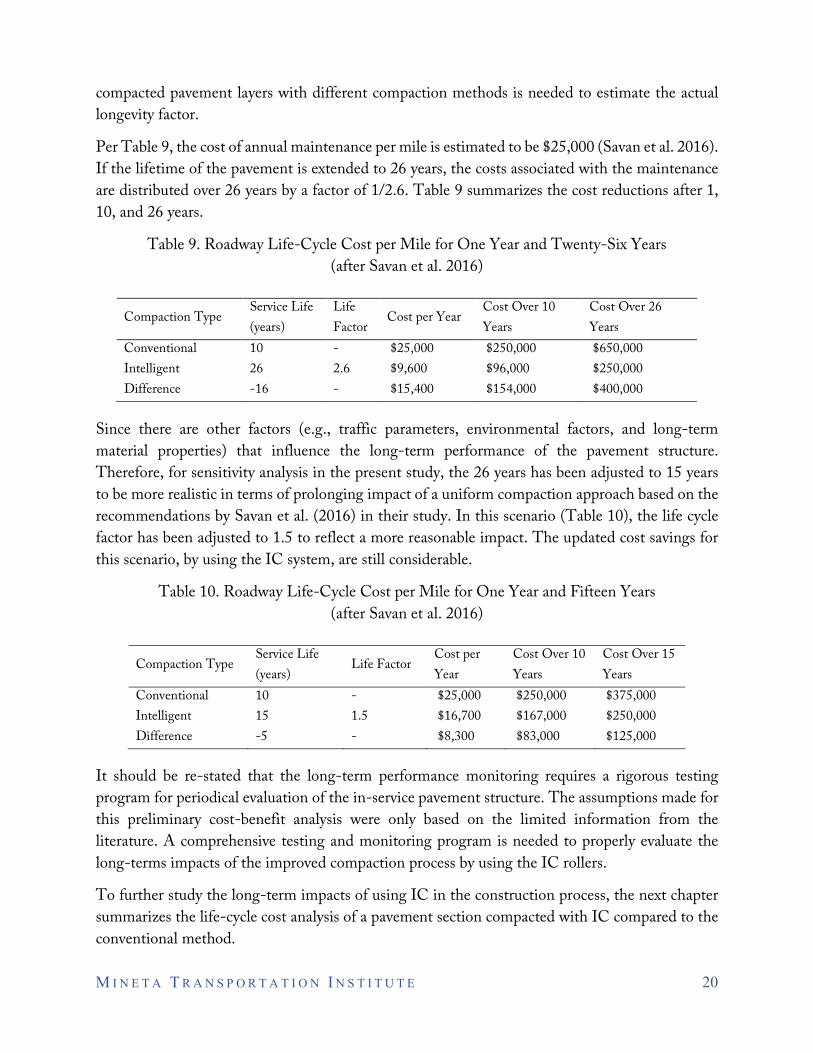
Per Table 9, the cost of annual maintenance per mile is estimated to be $25,000 (Savan et al. 2016). If the lifetime of the pavement is extended to 26 years, the costs associated with the maintenance are distributed over 26 years by a factor of 1/2.6. Table 9 summarizes the cost reductions after 1, 10, and 26 years.
Table 9. Roadway Life-Cycle Cost per Mile for One Year and Twenty-Six Years (after Savan et al. 2016)
Compaction Type Service Life (years)
Life Factor
Cost per Year Cost Over 10 Years
Cost Over 26 Years
Conventional 10 - $25,000 $250,000 $650,000 Intelligent 26 2.6 $9,600 $96,000 $250,000 Difference -16 - $15,400 $154,000 $400,000
Since there are other factors (e.g., traffic parameters, environmental factors, and long-term material properties) that influence the long-term performance of the pavement structure. Therefore, for sensitivity analysis in the present study, the 26 years has been adjusted to 15 years to be more realistic in terms of prolonging impact of a uniform compaction approach based on the recommendations by Savan et al. (2016) in their study. In this scenario (Table 10), the life cycle factor has been adjusted to 1.5 to reflect a more reasonable impact. The updated cost savings for this scenario, by using the IC system, are still considerable.
Table 10. Roadway Life-Cycle Cost per Mile for One Year and Fifteen Years (after Savan et al. 2016)
Compaction Type Service Life (years)
Life Factor Cost per Year
Cost Over 10 Years
Cost Over 15 Years
Conventional 10 - $25,000 $250,000 $375,000 Intelligent 15 1.5 $16,700 $167,000 $250,000 Difference -5 - $8,300 $83,000 $125,000
It should be re-stated that the long-term performance monitoring requires a rigorous testing program for periodical evaluation of the in-service pavement structure. The assumptions made for this preliminary cost-benefit analysis were only based on the limited information from the literature. A comprehensive testing and monitoring program is needed to properly evaluate the long-terms impacts of the improved compaction process by using the IC rollers.
To further study the long-term impacts of using IC in the construction process, the next chapter summarizes the life-cycle cost analysis of a pavement section compacted with IC compared to the conventional method.
M I N E T A T R A N S P O R T A T I O N I N S T I T U T E 21
VI. Life-Cycle Cost Analysis (LCCA)
This chapter summarizes the process for evaluating the feasibility of implementing a life cycle cost analysis for the pavement layers compacted with IC technology. The analysis was based on the limited field data collected in this project and additional information retrieved from the studies in the literature. As judged by the title of such analysis, the long-term performance monitoring of the compacted pavement layers are required to successfully perform the cost analysis over the life-cycle of the pavement structure.
Several studies in the literature have focused on the life cycle assessment and cost analysis of pavement structures (Tighe 2001, Ozbay et al. 2004, Huang et al. 2009, Santos et al. 2015, Babashamsi et al. 2016, Harvey et al. 2016, Xu et al. 2019 and Satani et al. 2020). Per the Federal Highway Administration (FHWA), the life-cycle cost analysis (LCCA) is defined as the analysis based on the principles of economics to evaluate the long-term efficiency for alternative investment options. The analysis incorporates initial and discounted future agency, user, and other relevant costs and attempts to identify the best value—the lowest long-term cost that satisfies the performance objective criteria—for the investment (Walls and Smith, 1998).
For roadway agencies, it is challenging to minimize the cost of expenses such as new construction costs, replacement of existing components, vehicle operation costs, work zone and user delay costs, maintenance and rehabilitation costs, and environmental costs. LCCA can keep track of all these activities related to the project over the life cycle.
6.1 LCCA Methodology
The following steps are required to perform a life-cycle cost analysis.
• Establishing an alternative design: In this first step, all possible alternatives areconsidered. Each strategy must include all design criteria and performance parameters,as well as an effective period. At least two significant alternative activities should becompared in this step to determine the more economical one. Each alternative shouldhave a sufficient time frame for comparison: defining an analysis period is mostimportant in this stage. Other parameters such as maintenance and rehabilitation costsmust be defined in an initial stage.
• Determining the required timing for activities: The most important step after definingall major alternatives is to consider a schedule for short-term and long-termperformance expenses for a project. For example, pavement construction needsperiodic maintenance and rehabilitation after a few years. In LCCA, all costs within alife cycle should be forecasted.

M I N E T A T R A N S P O R T A T I O N I N S T I T U T E 22
• Calculating the costs: LCCA does not require an account of all costs occurring with an activity. Only agency costs and user costs are considered for the analysis. The costs that make a major impact on overall life cycle for each alternative should be taken as count variables only.
• Estimating the life-cycle costs: After determining all costs, the goal is to calculate the total life-cycle costs of each alternative that may be compared directly. The best method to assess life-cycle costs is the expenditure diagram. An expenditure diagram visualizes initial costs, maintenance and rehabilitation costs, and salvage value over the analysis period of a project. Typically, a constant dollar scale is used for best results. All cost items should be considered constant throughout the analysis period of a project.
• Evaluation of the result: After calculating life-cycle costs, alternatives are ready to be analyzed. Typically, a deterministic or probabilistic approach is used in LCCA to decide between alternatives. However, the result of LCCA is based on economic analysis and there are many other parameters that are related to a project; LCCA may not include political, scientific, or environmental factors.
6.2 LCCA Terminology
The following paragraphs provide brief explanations of general terminologies used in the LCCA.
Agency Costs. All costs that affect the agency over the life of the project are considered to be agency costs. They include costs for initial primary engineering, construction supervision, contract administration, future routine and preventive maintenance—and, in such cases, roller operation (Walls and Smith 1998).
User Costs. User costs are the differential costs incurred by users when considering alternatives maintenance and rehabilitation strategies over the life cycle of the structure. For instance, in roadway construction, cost items such as vehicle operating costs, delay costs, and crash costs are considered as user costs.
Net Present Value (NPV). NPV is a discounted value of the total benefit which is calculated by subtracting present value costs from present value benefits using the appropriate discount rate. In the cash flow diagram, NPV represents each year’s present worth. NPV can be positive or negative. Generally, a project with negative NPV should be ignored. As stated by Walls and Smith (1998), NPV can be calculated as follows:
𝑁𝑁𝑁𝑁𝑁𝑁 = 𝐼𝐼𝐼𝐼𝐼𝐼𝐼𝐼𝐼𝐼𝐼𝐼𝐼𝐼 𝐶𝐶𝐶𝐶𝐶𝐶𝐼𝐼 + ∑ 𝑅𝑅𝑅𝑅ℎ𝐼𝐼𝑎𝑎 𝐶𝐶𝐶𝐶𝐶𝐶𝐼𝐼𝐾𝐾 �1
(1+𝑖𝑖)𝑛𝑛𝐾𝐾�𝑁𝑁
𝐾𝐾=1 (1)
where i = discount rate and n = years of expenditure. � 1(1+𝑖𝑖)𝑛𝑛𝐾𝐾
� is known as the present value factor for a given year.
M I N E T A T R A N S P O R T A T I O N I N S T I T U T E 23
Salvage Value. A project is always associated with depreciation, which means that a value of a newly constructed highway would not be the same as its value at the end of the service life. The value of an asset after considering depreciation is referred to as salvage value. In economic analyses, salvage value is typically considered as 25–30% of the initial investment value.
Discount Rate. Discount rate is the rate of return on investment stated as percentage. It is used to calculate how many percentages of discount should be applied to get such a return on investment at a specific period.
6.3 LCCA Approaches
The following is a summary of common approaches and analysis techniques used for LCCA. In this study, we have employed a preliminary deterministic approach.
Deterministic Approach. This approach is based on professional judgments or historical experiences. The analysis is based on fixed and discrete values for all the LCCA input variables. However, there are uncertainties that are not considered in this approach. By using a sensitivity analysis, the uncertainties associated with this approach can be eliminated (FHWA 2002).
Sensitivity Analysis. This method is used to define the variables that can have a major impact on the results for a deterministic approach (FHWA 2002). In the case of compaction, variables such as compaction efficiency, roller costs, and service life improvement can impact the results. In this approach, the uncertainty in dependent variables can be measured. It is also useful to choose the lowest present values for a project.
Probabilistic Approach. This approach analyzes the individual inputs by using a probability distribution. For each uncertain parameter, the sampling distribution of possible value is developed. To compute a forecasted present value for each input variable, a simulation is used to randomly draw values. The probabilistic approach allows uncertainty in the analysis. However, some levels of risk are involved in this approach (FHWA 2002).
Risk Analysis. When interpreting the probabilistic analysis results, one might estimate the risk involved with the results (FHWA 2002). The risk analysis is carried out to evaluate the variability associated with certain alternatives and the selected analysis method.
6.4 LCCA Case Study for Intelligent Compaction
This section describes the application of LCCA to compare the two compaction alternatives. The analysis is based on a limited field data collection for a 2.5” Hot Mix Asphalt (HMA) overlay on the existing pavement layer that was previously described in this report. All other pavement layers such as base course, subbase course, and compacted subgrade were considered constant to minimize the variables in the calculations. The roadway section selected was one mile long. The

M I N E T A T R A N S P O R T A T I O N I N S T I T U T E 24
Average Annual Daily Traffic (AADT) was 2,900 vehicles on the eastbound lane and 2,300 westbound with 1.49% average traffic growth.
The goal of this study was to compare intelligent compaction to conventional approach for the analysis periods of 10, 15, and 26 years. Construction costs, maintenance costs, and user costs were selected as the main parameters of the LCCA. A typical method of determining cost is to find out the number of quantities required and then multiply quantities by the unit cost; unit costs are easily accessible from previous records and bids. In this study, an analysis was performed using constant dollars, if the value of the dollar would not change throughout the life cycle of the project. For instance, if the operating cost of the roller is $100 as of the date of writing, it will also be $100 after 15 years. The LCCA was performed with the assumption of constant dollar value to maintain consistency of costs and minimize the errors in cost calculations.
The following discussion summarizes the agency costs related to the compaction project. To narrow down the list of activities related to pavement construction, the placement and compaction cost of a one-lane mile of HMA was assumed to be $250,000.
Compaction Cycle Cost. The compaction cycle cost for conventional and intelligent compaction was assumed to be $940 and $590, respectively (Savan et al. 2017). Total cost was converted to 2019 USD using the inflation rate. The cumulative rate of inflation from 2016 to 2019 was 7%; thus, the compaction cycle cost for conventional and intelligent compaction would be $1,006 and $631, respectively, in 2019 USD. Table 11 presents total agency cost associated with the construction of one lane-mile of pavement. Total agency costs were used in this study to perform the LCCA.
Table 11. Agency Cost Calculation per Lane-Mile
Conventional Compaction Intelligent Compaction Initial construction cost $250,000 $250,000 Compaction cycle cost $1,007 $634 Total agency cost $251,007 $250,634
User Delay Cost. The following discussion describes the process of estimating the incurred delay costs to the road users due to the traffic congestion caused by the construction process.
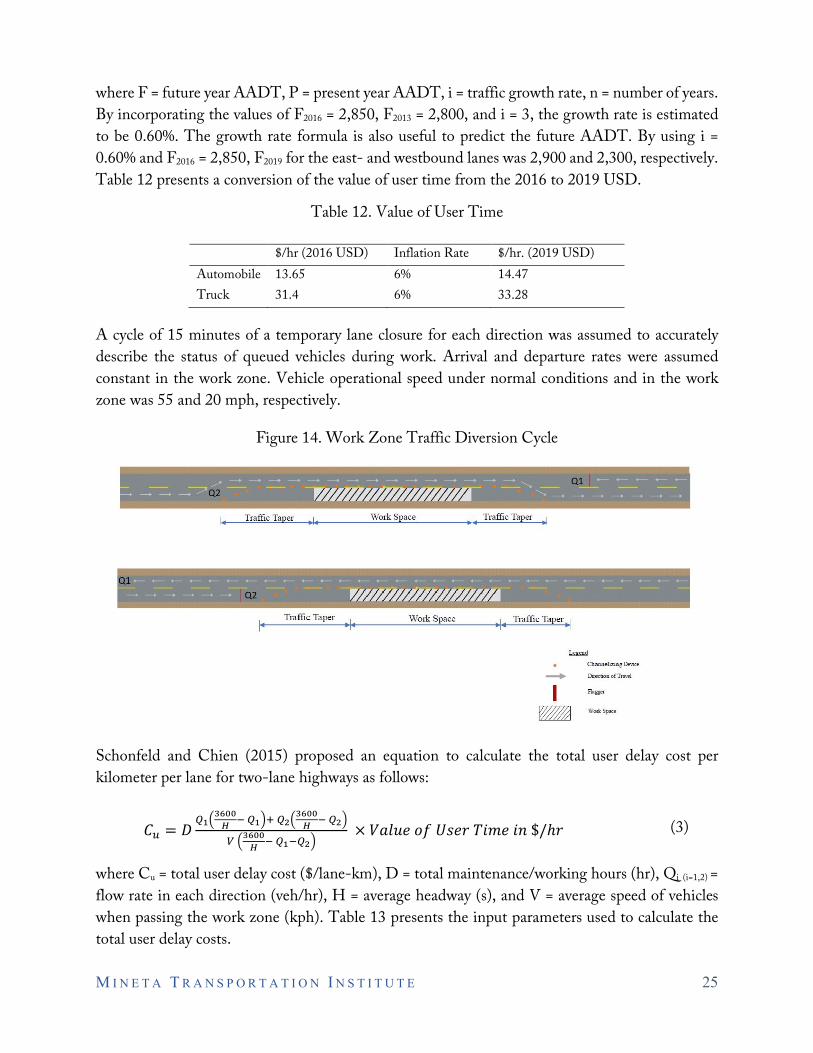
In this study, traffic congestion was assumed to be associated with user costs during the construction activities. The two-lane highway section had one lane in each direction. Figure 14 represents traffic routing near the work zone, which was always protected with channelizing devices during construction. The Annual Average Daily Traffic (AADT) on the eastbound lane was estimated to be 2,900 in 2019. The current traffic counts can be estimated by using a traffic growth rate factor as follows:
𝐼𝐼 = �𝐹𝐹𝑃𝑃�1𝑛𝑛 − 1 (2)
M I N E T A T R A N S P O R T A T I O N I N S T I T U T E 25
where F = future year AADT, P = present year AADT, i = traffic growth rate, n = number of years. By incorporating the values of F2016 = 2,850, F2013 = 2,800, and i = 3, the growth rate is estimated to be 0.60%. The growth rate formula is also useful to predict the future AADT. By using i = 0.60% and F2016 = 2,850, F2019 for the east- and westbound lanes was 2,900 and 2,300, respectively. Table 12 presents a conversion of the value of user time from the 2016 to 2019 USD.
Table 12. Value of User Time
$/hr (2016 USD) Inflation Rate $/hr. (2019 USD) Automobile 13.65 6% 14.47 Truck 31.4 6% 33.28
A cycle of 15 minutes of a temporary lane closure for each direction was assumed to accurately describe the status of queued vehicles during work. Arrival and departure rates were assumed constant in the work zone. Vehicle operational speed under normal conditions and in the work zone was 55 and 20 mph, respectively.
Figure 14. Work Zone Traffic Diversion Cycle
Schonfeld and Chien (2015) proposed an equation to calculate the total user delay cost per kilometer per lane for two-lane highways as follows:
𝐶𝐶𝑢𝑢 = 𝐷𝐷𝑄𝑄1�
3600𝐻𝐻 − 𝑄𝑄1�+ 𝑄𝑄2�
3600𝐻𝐻 − 𝑄𝑄2�
𝑉𝑉 �3600𝐻𝐻 − 𝑄𝑄1−𝑄𝑄2� × 𝑁𝑁𝐼𝐼𝐼𝐼𝑉𝑉𝑅𝑅 𝐶𝐶𝑜𝑜 𝑈𝑈𝐶𝐶𝑅𝑅𝑈𝑈 𝑇𝑇𝐼𝐼𝑇𝑇𝑅𝑅 𝐼𝐼𝐼𝐼 $/ℎ𝑈𝑈 (3)
where Cu = total user delay cost ($/lane-km), D = total maintenance/working hours (hr), Qi (i=1,2) = flow rate in each direction (veh/hr), H = average headway (s), and V = average speed of vehicles when passing the work zone (kph). Table 13 presents the input parameters used to calculate the total user delay costs.
M I N E T A T R A N S P O R T A T I O N I N S T I T U T E 26
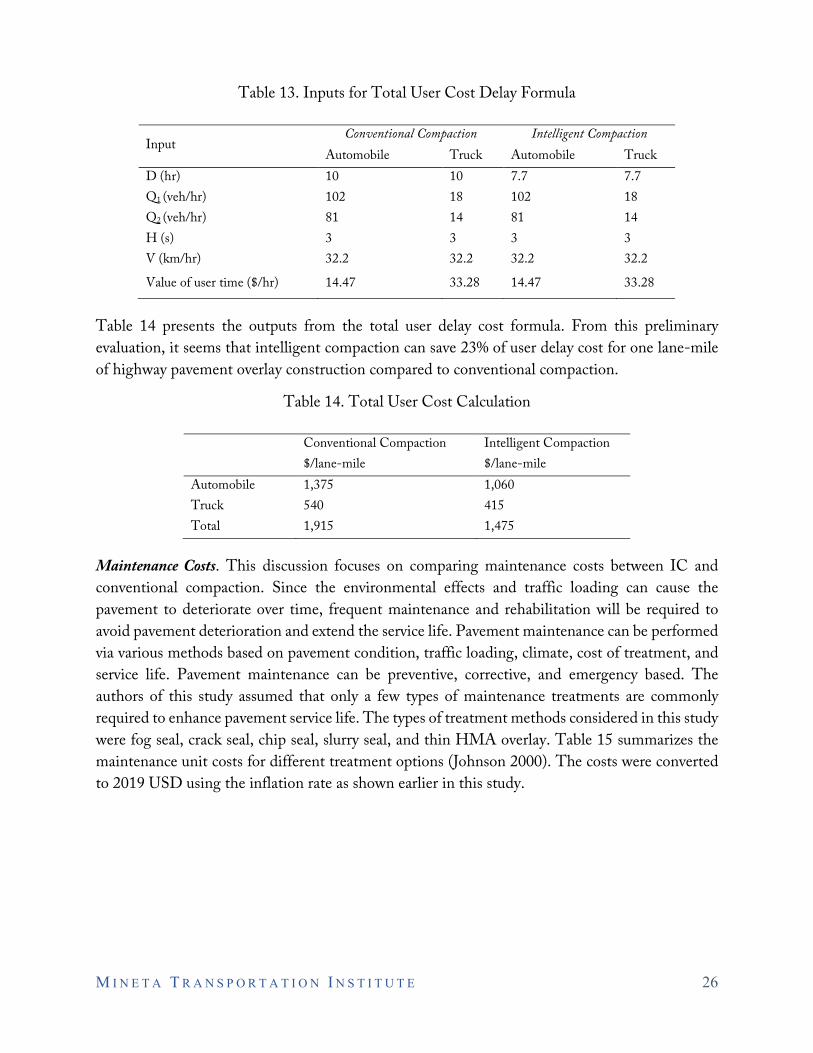
Table 13. Inputs for Total User Cost Delay Formula
Input Conventional Compaction Intelligent Compaction
Automobile Truck Automobile Truck D (hr) 10 10 7.7 7.7 Q1 (veh/hr) 102 18 102 18 Q2 (veh/hr) 81 14 81 14 H (s) 3 3 3 3 V (km/hr) 32.2 32.2 32.2 32.2
Value of user time ($/hr) 14.47 33.28 14.47 33.28
Table 14 presents the outputs from the total user delay cost formula. From this preliminary evaluation, it seems that intelligent compaction can save 23% of user delay cost for one lane-mile of highway pavement overlay construction compared to conventional compaction.
Table 14. Total User Cost Calculation
Conventional Compaction Intelligent Compaction
$/lane-mile $/lane-mile
Automobile 1,375 1,060 Truck 540 415 Total 1,915 1,475
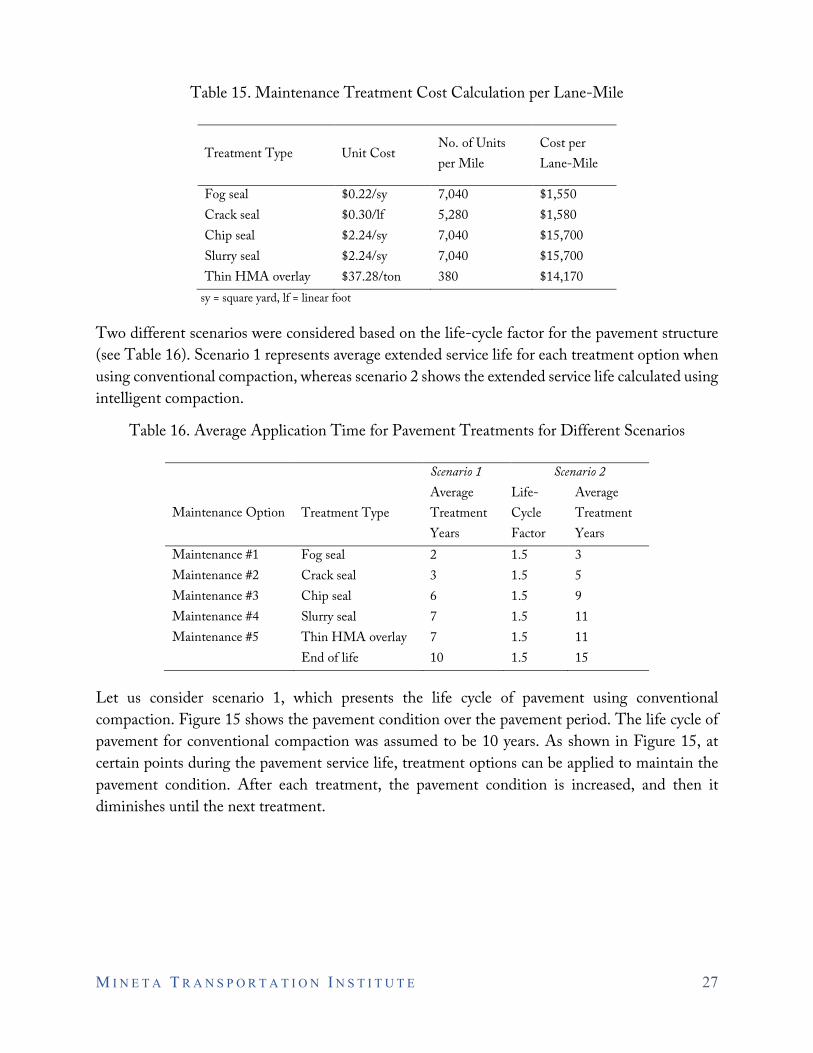
Maintenance Costs. This discussion focuses on comparing maintenance costs between IC and conventional compaction. Since the environmental effects and traffic loading can cause the pavement to deteriorate over time, frequent maintenance and rehabilitation will be required to avoid pavement deterioration and extend the service life. Pavement maintenance can be performed via various methods based on pavement condition, traffic loading, climate, cost of treatment, and service life. Pavement maintenance can be preventive, corrective, and emergency based. The authors of this study assumed that only a few types of maintenance treatments are commonly required to enhance pavement service life. The types of treatment methods considered in this study were fog seal, crack seal, chip seal, slurry seal, and thin HMA overlay. Table 15 summarizes the maintenance unit costs for different treatment options (Johnson 2000). The costs were converted to 2019 USD using the inflation rate as shown earlier in this study.
M I N E T A T R A N S P O R T A T I O N I N S T I T U T E 27
Table 15. Maintenance Treatment Cost Calculation per Lane-Mile
Treatment Type Unit Cost No. of Units per Mile
Cost per Lane-Mile
Fog seal $0.22/sy 7,040 $1,550 Crack seal $0.30/lf 5,280 $1,580 Chip seal $2.24/sy 7,040 $15,700 Slurry seal $2.24/sy 7,040 $15,700 Thin HMA overlay $37.28/ton 380 $14,170
sy = square yard, lf = linear foot
Two different scenarios were considered based on the life-cycle factor for the pavement structure (see Table 16). Scenario 1 represents average extended service life for each treatment option when using conventional compaction, whereas scenario 2 shows the extended service life calculated using intelligent compaction.
Table 16. Average Application Time for Pavement Treatments for Different Scenarios
Scenario 1 Scenario 2
Maintenance Option Treatment Type Average Treatment Years
Life-Cycle Factor
Average Treatment Years
Maintenance #1 Fog seal 2 1.5 3 Maintenance #2 Crack seal 3 1.5 5 Maintenance #3 Chip seal 6 1.5 9 Maintenance #4 Slurry seal 7 1.5 11 Maintenance #5 Thin HMA overlay 7 1.5 11
End of life 10 1.5 15
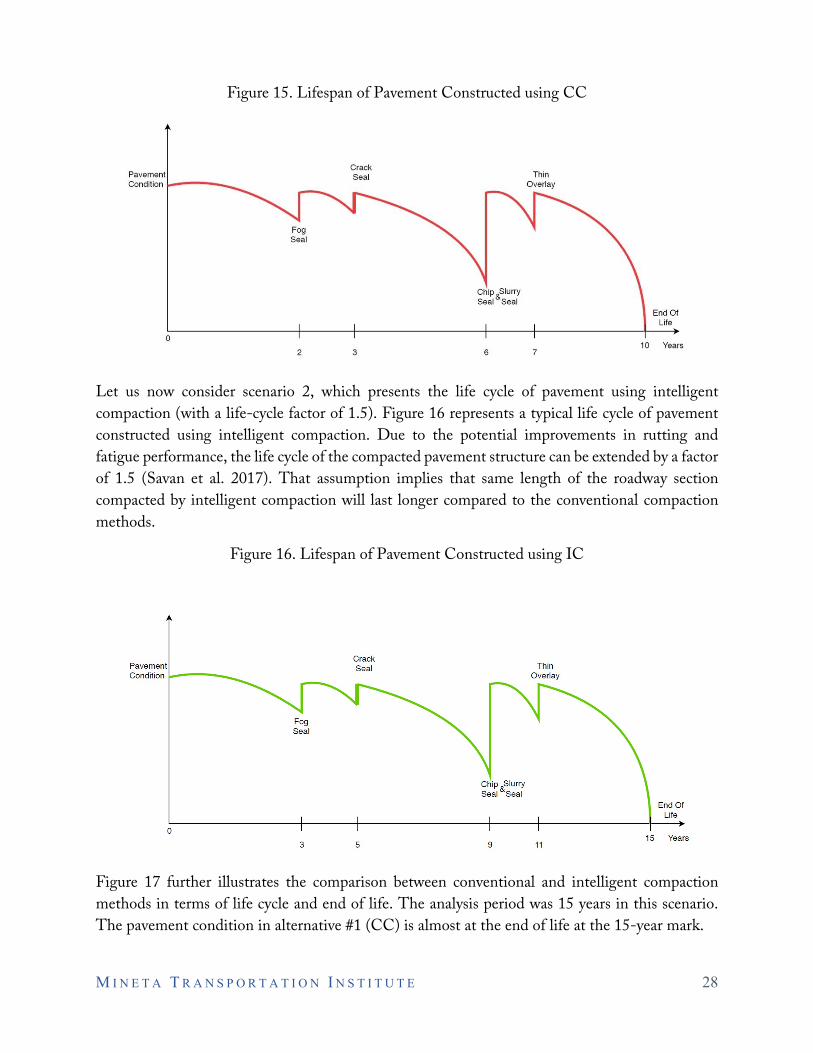
Let us consider scenario 1, which presents the life cycle of pavement using conventional compaction. Figure 15 shows the pavement condition over the pavement period. The life cycle of pavement for conventional compaction was assumed to be 10 years. As shown in Figure 15, at certain points during the pavement service life, treatment options can be applied to maintain the pavement condition. After each treatment, the pavement condition is increased, and then it diminishes until the next treatment.
M I N E T A T R A N S P O R T A T I O N I N S T I T U T E 28
Figure 15. Lifespan of Pavement Constructed using CC
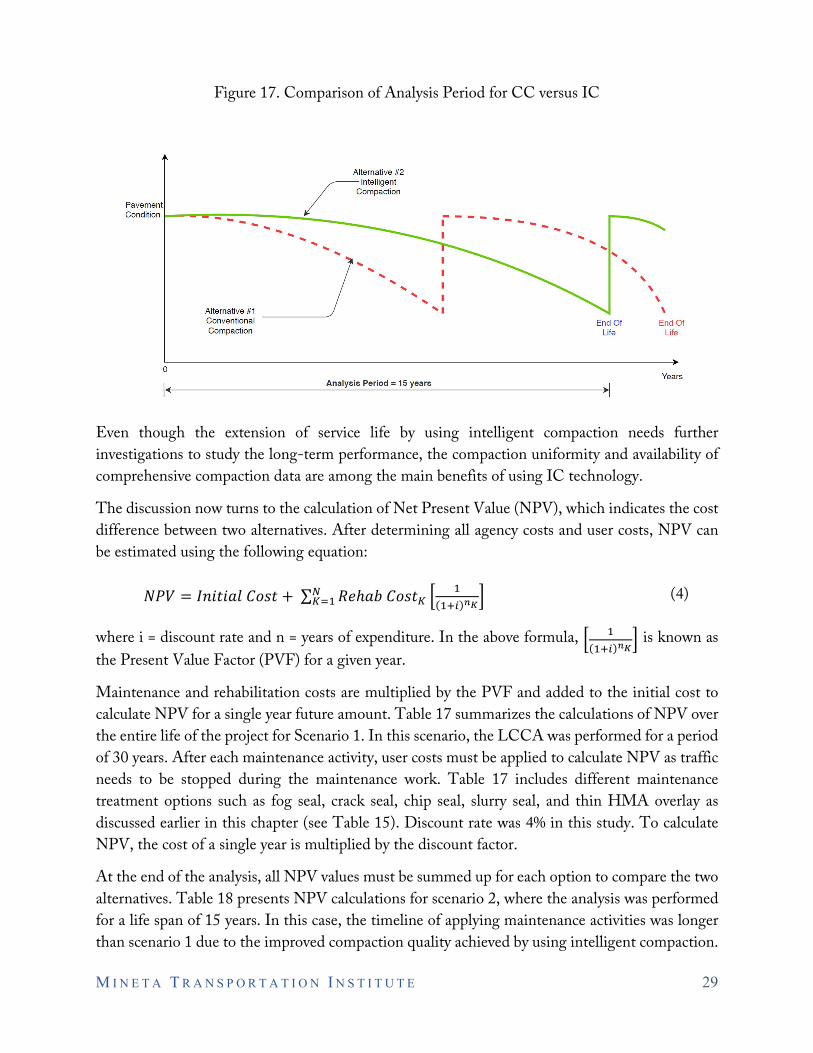
Let us now consider scenario 2, which presents the life cycle of pavement using intelligent compaction (with a life-cycle factor of 1.5). Figure 16 represents a typical life cycle of pavement constructed using intelligent compaction. Due to the potential improvements in rutting and fatigue performance, the life cycle of the compacted pavement structure can be extended by a factor of 1.5 (Savan et al. 2017). That assumption implies that same length of the roadway section compacted by intelligent compaction will last longer compared to the conventional compaction methods.
Figure 16. Lifespan of Pavement Constructed using IC
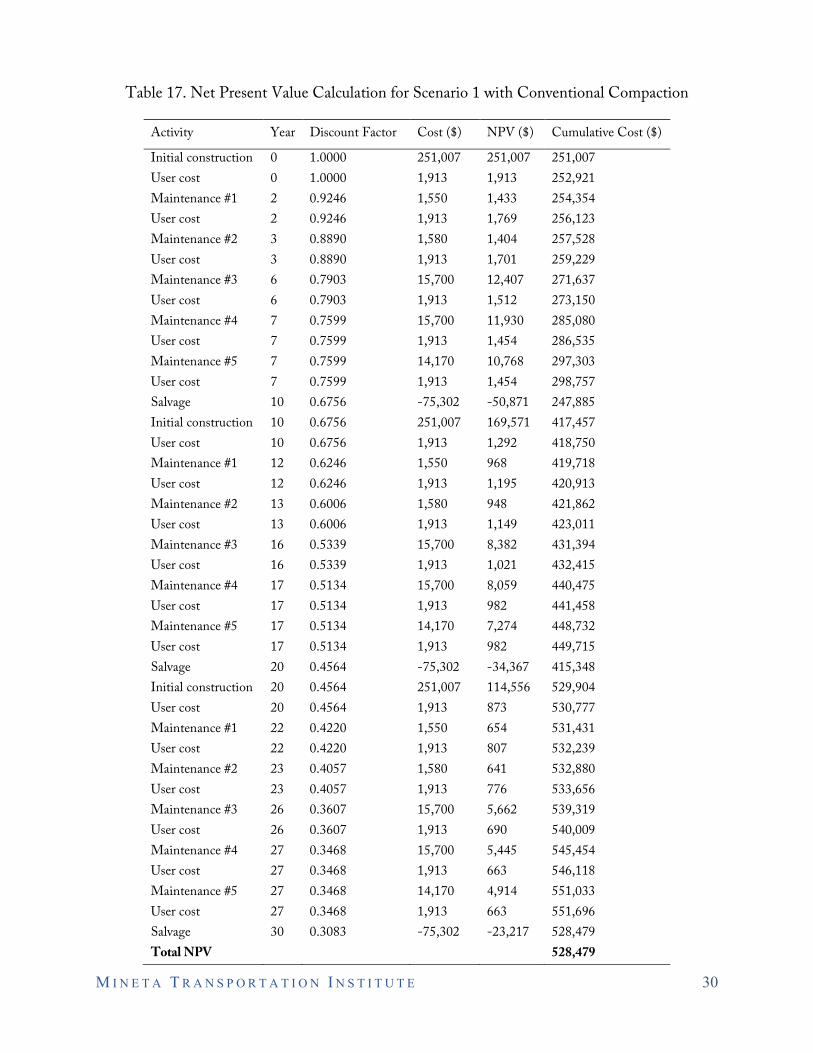
Figure 17 further illustrates the comparison between conventional and intelligent compaction methods in terms of life cycle and end of life. The analysis period was 15 years in this scenario. The pavement condition in alternative #1 (CC) is almost at the end of life at the 15-year mark.
M I N E T A T R A N S P O R T A T I O N I N S T I T U T E 29
Figure 17. Comparison of Analysis Period for CC versus IC
Even though the extension of service life by using intelligent compaction needs further investigations to study the long-term performance, the compaction uniformity and availability of comprehensive compaction data are among the main benefits of using IC technology.
The discussion now turns to the calculation of Net Present Value (NPV), which indicates the cost difference between two alternatives. After determining all agency costs and user costs, NPV can be estimated using the following equation:
𝑁𝑁𝑁𝑁𝑁𝑁 = 𝐼𝐼𝐼𝐼𝐼𝐼𝐼𝐼𝐼𝐼𝐼𝐼𝐼𝐼 𝐶𝐶𝐶𝐶𝐶𝐶𝐼𝐼 + ∑ 𝑅𝑅𝑅𝑅ℎ𝐼𝐼𝑎𝑎 𝐶𝐶𝐶𝐶𝐶𝐶𝐼𝐼𝐾𝐾 �1
(1+𝑖𝑖)𝑛𝑛𝐾𝐾�𝑁𝑁
𝐾𝐾=1 (4)
where i = discount rate and n = years of expenditure. In the above formula, � 1(1+𝑖𝑖)𝑛𝑛𝐾𝐾
� is known as the Present Value Factor (PVF) for a given year.
Maintenance and rehabilitation costs are multiplied by the PVF and added to the initial cost to calculate NPV for a single year future amount. Table 17 summarizes the calculations of NPV over the entire life of the project for Scenario 1. In this scenario, the LCCA was performed for a period of 30 years. After each maintenance activity, user costs must be applied to calculate NPV as traffic needs to be stopped during the maintenance work. Table 17 includes different maintenance treatment options such as fog seal, crack seal, chip seal, slurry seal, and thin HMA overlay as discussed earlier in this chapter (see Table 15). Discount rate was 4% in this study. To calculate NPV, the cost of a single year is multiplied by the discount factor.
At the end of the analysis, all NPV values must be summed up for each option to compare the two alternatives. Table 18 presents NPV calculations for scenario 2, where the analysis was performed for a life span of 15 years. In this case, the timeline of applying maintenance activities was longer than scenario 1 due to the improved compaction quality achieved by using intelligent compaction.
M I N E T A T R A N S P O R T A T I O N I N S T I T U T E 30
Table 17. Net Present Value Calculation for Scenario 1 with Conventional Compaction
Activity Year Discount Factor Cost ($) NPV ($) Cumulative Cost ($)
Initial construction 0 1.0000 251,007 251,007 251,007 User cost 0 1.0000 1,913 1,913 252,921 Maintenance #1 2 0.9246 1,550 1,433 254,354 User cost 2 0.9246 1,913 1,769 256,123 Maintenance #2 3 0.8890 1,580 1,404 257,528 User cost 3 0.8890 1,913 1,701 259,229 Maintenance #3 6 0.7903 15,700 12,407 271,637 User cost 6 0.7903 1,913 1,512 273,150 Maintenance #4 7 0.7599 15,700 11,930 285,080 User cost 7 0.7599 1,913 1,454 286,535 Maintenance #5 7 0.7599 14,170 10,768 297,303 User cost 7 0.7599 1,913 1,454 298,757 Salvage 10 0.6756 -75,302 -50,871 247,885Initial construction 10 0.6756 251,007 169,571 417,457 User cost 10 0.6756 1,913 1,292 418,750 Maintenance #1 12 0.6246 1,550 968 419,718 User cost 12 0.6246 1,913 1,195 420,913 Maintenance #2 13 0.6006 1,580 948 421,862 User cost 13 0.6006 1,913 1,149 423,011 Maintenance #3 16 0.5339 15,700 8,382 431,394 User cost 16 0.5339 1,913 1,021 432,415 Maintenance #4 17 0.5134 15,700 8,059 440,475 User cost 17 0.5134 1,913 982 441,458 Maintenance #5 17 0.5134 14,170 7,274 448,732 User cost 17 0.5134 1,913 982 449,715 Salvage 20 0.4564 -75,302 -34,367 415,348Initial construction 20 0.4564 251,007 114,556 529,904 User cost 20 0.4564 1,913 873 530,777 Maintenance #1 22 0.4220 1,550 654 531,431 User cost 22 0.4220 1,913 807 532,239 Maintenance #2 23 0.4057 1,580 641 532,880 User cost 23 0.4057 1,913 776 533,656 Maintenance #3 26 0.3607 15,700 5,662 539,319 User cost 26 0.3607 1,913 690 540,009 Maintenance #4 27 0.3468 15,700 5,445 545,454 User cost 27 0.3468 1,913 663 546,118 Maintenance #5 27 0.3468 14,170 4,914 551,033 User cost 27 0.3468 1,913 663 551,696 Salvage 30 0.3083 -75,302 -23,217 528,479Total NPV 528,479
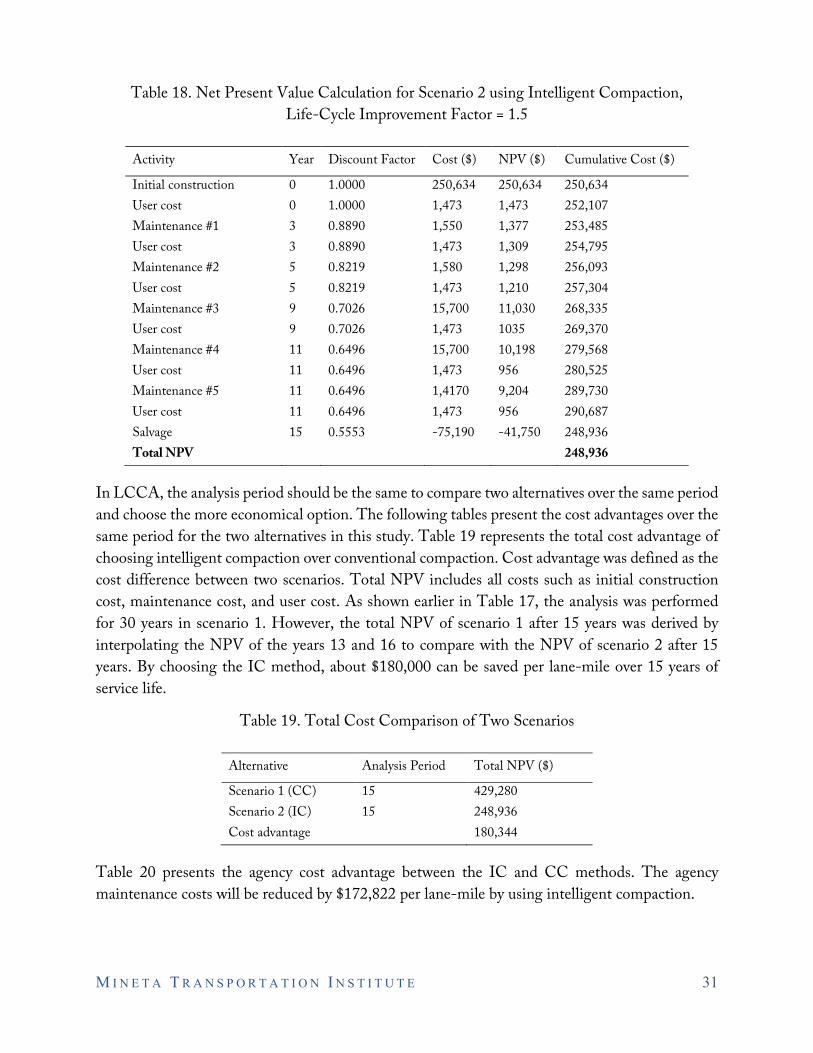
M I N E T A T R A N S P O R T A T I O N I N S T I T U T E 31
Table 18. Net Present Value Calculation for Scenario 2 using Intelligent Compaction, Life-Cycle Improvement Factor = 1.5
Activity Year Discount Factor Cost ($) NPV ($) Cumulative Cost ($)
Initial construction 0 1.0000 250,634 250,634 250,634 User cost 0 1.0000 1,473 1,473 252,107 Maintenance #1 3 0.8890 1,550 1,377 253,485 User cost 3 0.8890 1,473 1,309 254,795 Maintenance #2 5 0.8219 1,580 1,298 256,093 User cost 5 0.8219 1,473 1,210 257,304 Maintenance #3 9 0.7026 15,700 11,030 268,335 User cost 9 0.7026 1,473 1035 269,370 Maintenance #4 11 0.6496 15,700 10,198 279,568 User cost 11 0.6496 1,473 956 280,525 Maintenance #5 11 0.6496 1,4170 9,204 289,730 User cost 11 0.6496 1,473 956 290,687 Salvage 15 0.5553 -75,190 -41,750 248,936Total NPV 248,936
In LCCA, the analysis period should be the same to compare two alternatives over the same period and choose the more economical option. The following tables present the cost advantages over the same period for the two alternatives in this study. Table 19 represents the total cost advantage of choosing intelligent compaction over conventional compaction. Cost advantage was defined as the cost difference between two scenarios. Total NPV includes all costs such as initial construction cost, maintenance cost, and user cost. As shown earlier in Table 17, the analysis was performed for 30 years in scenario 1. However, the total NPV of scenario 1 after 15 years was derived by interpolating the NPV of the years 13 and 16 to compare with the NPV of scenario 2 after 15 years. By choosing the IC method, about $180,000 can be saved per lane-mile over 15 years of service life.
Table 19. Total Cost Comparison of Two Scenarios
Alternative Analysis Period Total NPV ($)
Scenario 1 (CC) 15 429,280 Scenario 2 (IC) 15 248,936 Cost advantage 180,344
Table 20 presents the agency cost advantage between the IC and CC methods. The agency maintenance costs will be reduced by $172,822 per lane-mile by using intelligent compaction.
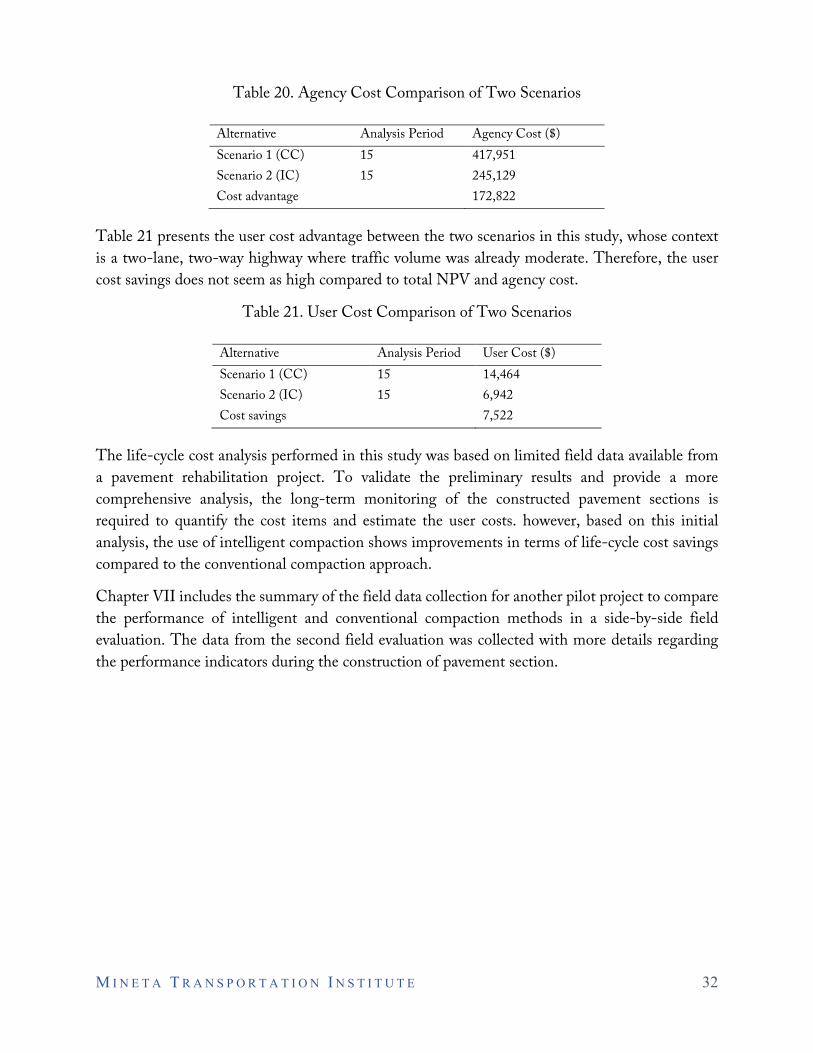
M I N E T A T R A N S P O R T A T I O N I N S T I T U T E 32
Table 20. Agency Cost Comparison of Two Scenarios
Alternative Analysis Period Agency Cost ($) Scenario 1 (CC) 15 417,951 Scenario 2 (IC) 15 245,129 Cost advantage 172,822
Table 21 presents the user cost advantage between the two scenarios in this study, whose context is a two-lane, two-way highway where traffic volume was already moderate. Therefore, the user cost savings does not seem as high compared to total NPV and agency cost.
Table 21. User Cost Comparison of Two Scenarios
Alternative Analysis Period User Cost ($) Scenario 1 (CC) 15 14,464 Scenario 2 (IC) 15 6,942 Cost savings 7,522
The life-cycle cost analysis performed in this study was based on limited field data available from a pavement rehabilitation project. To validate the preliminary results and provide a more comprehensive analysis, the long-term monitoring of the constructed pavement sections is required to quantify the cost items and estimate the user costs. however, based on this initial analysis, the use of intelligent compaction shows improvements in terms of life-cycle cost savings compared to the conventional compaction approach.
Chapter VII includes the summary of the field data collection for another pilot project to compare the performance of intelligent and conventional compaction methods in a side-by-side field evaluation. The data from the second field evaluation was collected with more details regarding the performance indicators during the construction of pavement section.
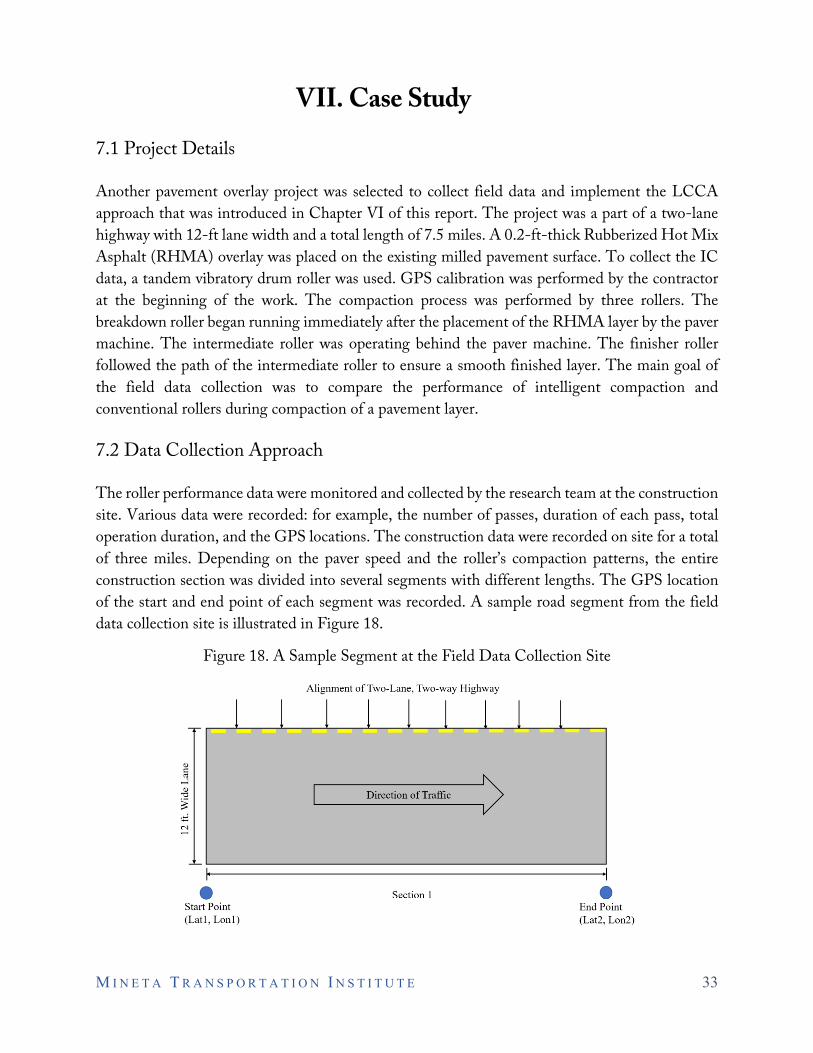
M I N E T A T R A N S P O R T A T I O N I N S T I T U T E 33
VII. Case Study
7.1 Project Details
Another pavement overlay project was selected to collect field data and implement the LCCA approach that was introduced in Chapter VI of this report. The project was a part of a two-lane highway with 12-ft lane width and a total length of 7.5 miles. A 0.2-ft-thick Rubberized Hot Mix Asphalt (RHMA) overlay was placed on the existing milled pavement surface. To collect the IC data, a tandem vibratory drum roller was used. GPS calibration was performed by the contractor at the beginning of the work. The compaction process was performed by three rollers. The breakdown roller began running immediately after the placement of the RHMA layer by the paver machine. The intermediate roller was operating behind the paver machine. The finisher roller followed the path of the intermediate roller to ensure a smooth finished layer. The main goal of the field data collection was to compare the performance of intelligent compaction and conventional rollers during compaction of a pavement layer.
7.2 Data Collection Approach
The roller performance data were monitored and collected by the research team at the construction site. Various data were recorded: for example, the number of passes, duration of each pass, total operation duration, and the GPS locations. The construction data were recorded on site for a total of three miles. Depending on the paver speed and the roller’s compaction patterns, the entire construction section was divided into several segments with different lengths. The GPS location of the start and end point of each segment was recorded. A sample road segment from the field data collection site is illustrated in Figure 18.
Figure 18. A Sample Segment at the Field Data Collection Site
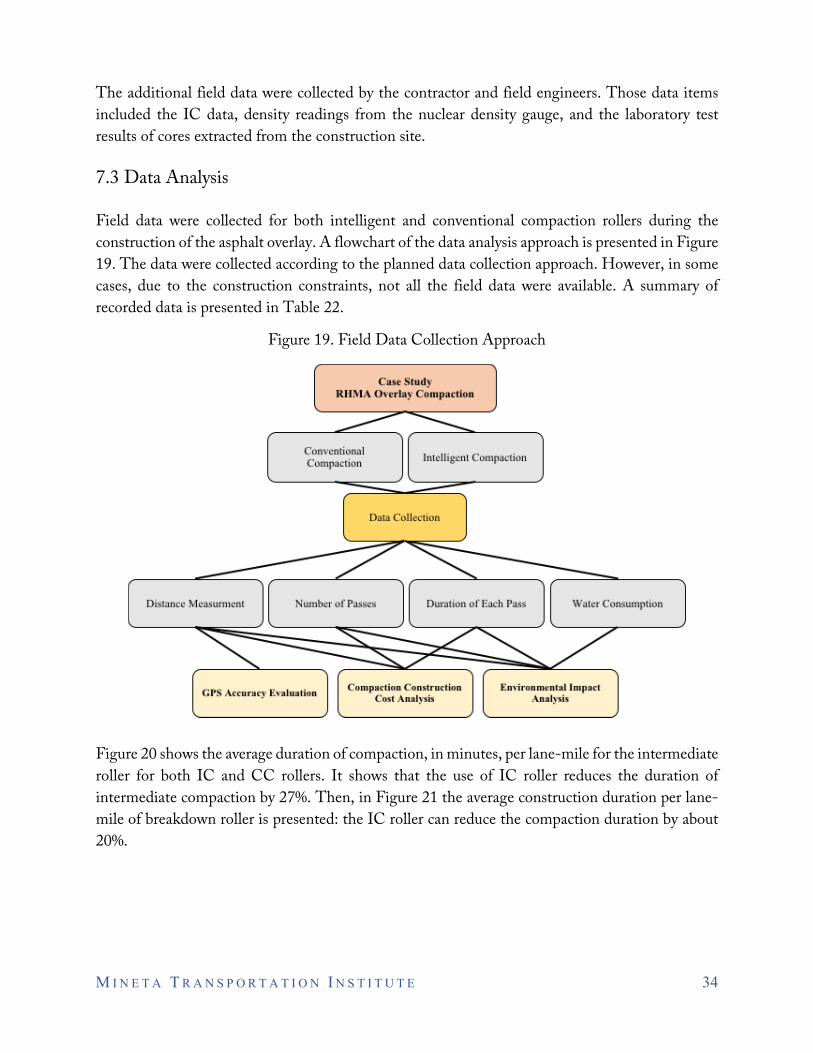
M I N E T A T R A N S P O R T A T I O N I N S T I T U T E 34
The additional field data were collected by the contractor and field engineers. Those data items included the IC data, density readings from the nuclear density gauge, and the laboratory test results of cores extracted from the construction site.
7.3 Data Analysis
Field data were collected for both intelligent and conventional compaction rollers during the construction of the asphalt overlay. A flowchart of the data analysis approach is presented in Figure 19. The data were collected according to the planned data collection approach. However, in some cases, due to the construction constraints, not all the field data were available. A summary of recorded data is presented in Table 22.
Figure 19. Field Data Collection Approach
Figure 20 shows the average duration of compaction, in minutes, per lane-mile for the intermediate roller for both IC and CC rollers. It shows that the use of IC roller reduces the duration of intermediate compaction by 27%. Then, in Figure 21 the average construction duration per lane-mile of breakdown roller is presented: the IC roller can reduce the compaction duration by about 20%.
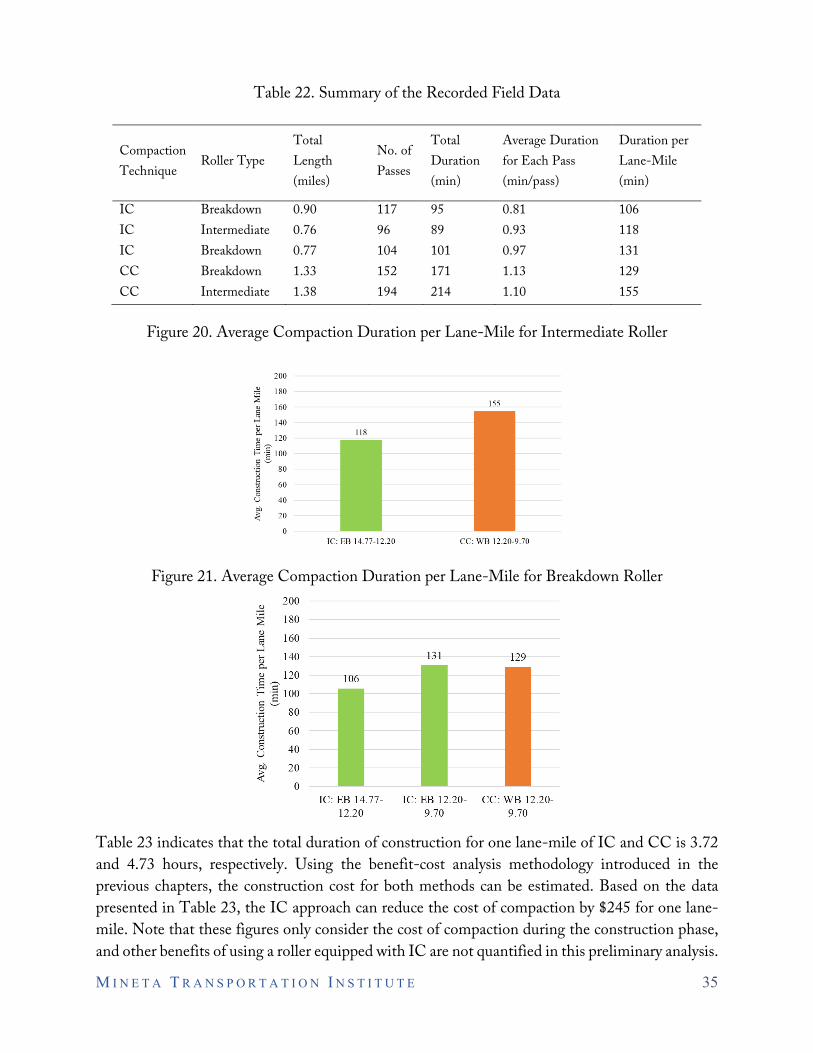
M I N E T A T R A N S P O R T A T I O N I N S T I T U T E 35
Table 22. Summary of the Recorded Field Data
Compaction Technique
Roller Type Total Length (miles)
No. of Passes
Total Duration (min)
Average Duration for Each Pass (min/pass)
Duration per Lane-Mile (min)
IC Breakdown 0.90 117 95 0.81 106 IC Intermediate 0.76 96 89 0.93 118 IC Breakdown 0.77 104 101 0.97 131 CC Breakdown 1.33 152 171 1.13 129 CC Intermediate 1.38 194 214 1.10 155
Figure 20. Average Compaction Duration per Lane-Mile for Intermediate Roller
Figure 21. Average Compaction Duration per Lane-Mile for Breakdown Roller
Table 23 indicates that the total duration of construction for one lane-mile of IC and CC is 3.72 and 4.73 hours, respectively. Using the benefit-cost analysis methodology introduced in the previous chapters, the construction cost for both methods can be estimated. Based on the data presented in Table 23, the IC approach can reduce the cost of compaction by $245 for one lane-mile. Note that these figures only consider the cost of compaction during the construction phase, and other benefits of using a roller equipped with IC are not quantified in this preliminary analysis.
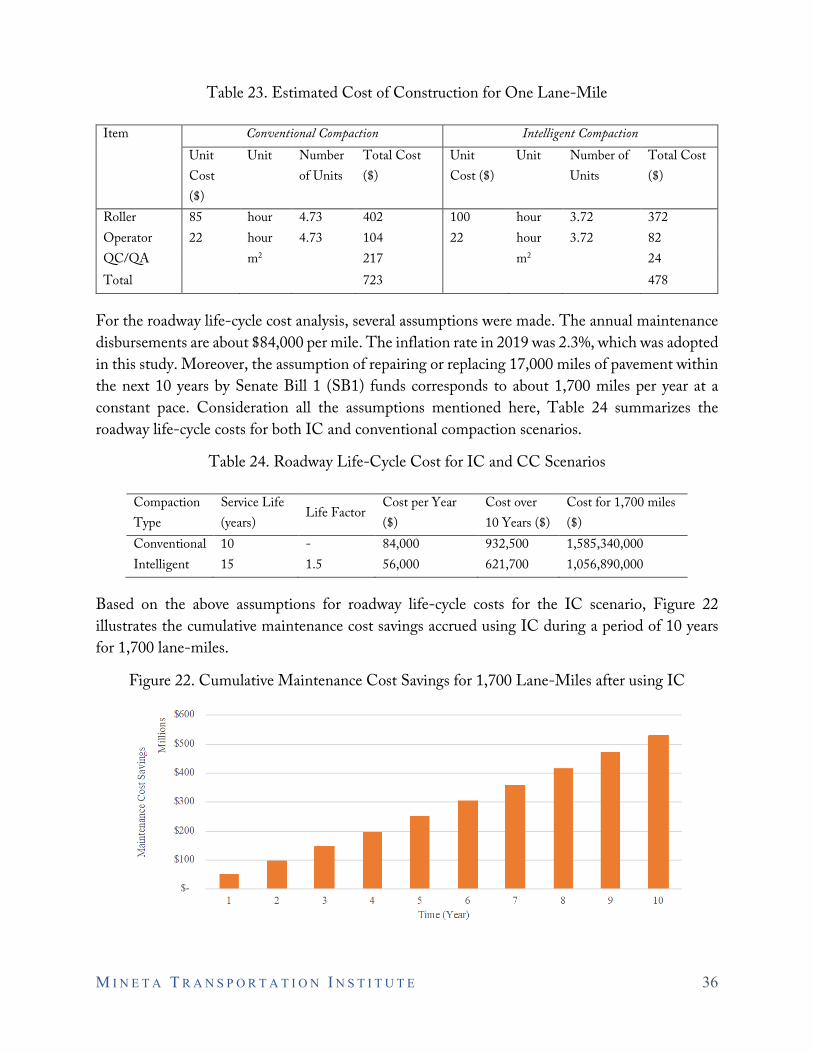
M I N E T A T R A N S P O R T A T I O N I N S T I T U T E 36
Table 23. Estimated Cost of Construction for One Lane-Mile
Item Conventional Compaction Intelligent Compaction Unit Cost ($)
Unit Number of Units
Total Cost ($)
Unit Cost ($)
Unit Number of Units
Total Cost ($)
Roller 85 hour 4.73 402 100 hour 3.72 372 Operator 22 hour 4.73 104 22 hour 3.72 82 QC/QA m2 217 m2 24 Total 723 478
For the roadway life-cycle cost analysis, several assumptions were made. The annual maintenance disbursements are about $84,000 per mile. The inflation rate in 2019 was 2.3%, which was adopted in this study. Moreover, the assumption of repairing or replacing 17,000 miles of pavement within the next 10 years by Senate Bill 1 (SB1) funds corresponds to about 1,700 miles per year at a constant pace. Consideration all the assumptions mentioned here, Table 24 summarizes the roadway life-cycle costs for both IC and conventional compaction scenarios.
Table 24. Roadway Life-Cycle Cost for IC and CC Scenarios
Compaction Type
Service Life (years)
Life Factor Cost per Year($)
Cost over 10 Years ($)
Cost for 1,700 miles ($)
Conventional 10 - 84,000 932,500 1,585,340,000 Intelligent 15 1.5 56,000 621,700 1,056,890,000
Based on the above assumptions for roadway life-cycle costs for the IC scenario, Figure 22 illustrates the cumulative maintenance cost savings accrued using IC during a period of 10 years for 1,700 lane-miles.
Figure 22. Cumulative Maintenance Cost Savings for 1,700 Lane-Miles after using IC
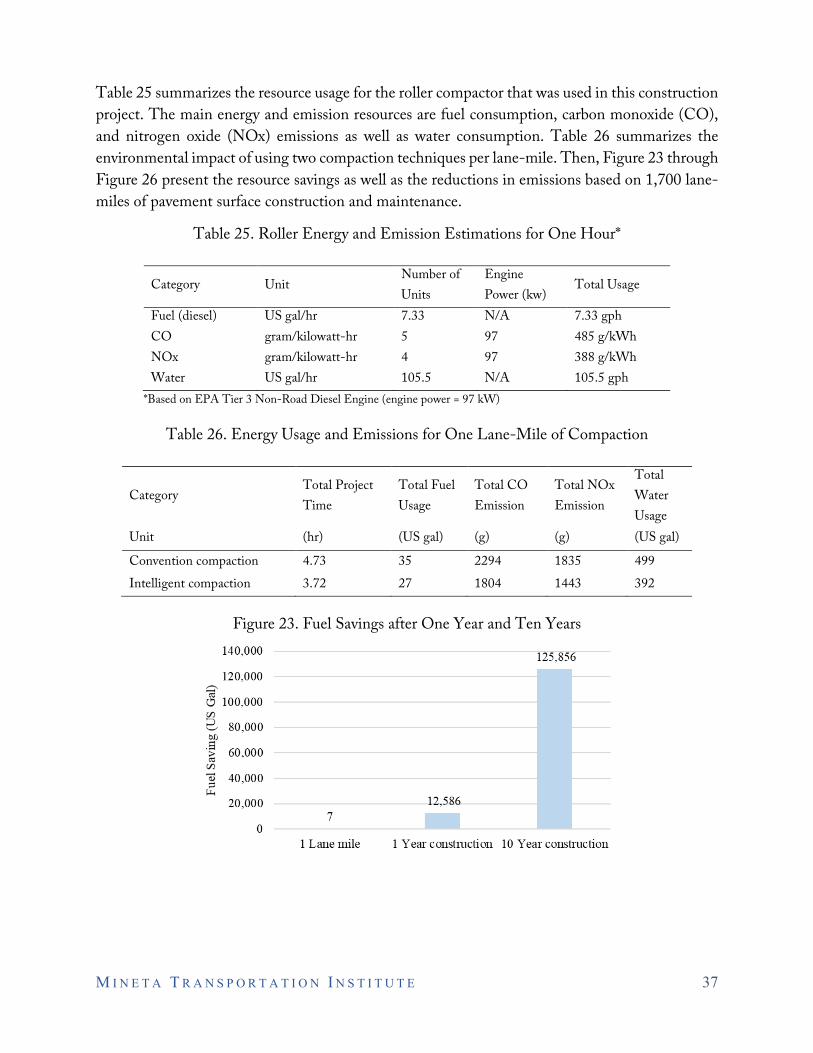
M I N E T A T R A N S P O R T A T I O N I N S T I T U T E 37
Table 25 summarizes the resource usage for the roller compactor that was used in this construction project. The main energy and emission resources are fuel consumption, carbon monoxide (CO), and nitrogen oxide (NOx) emissions as well as water consumption. Table 26 summarizes the environmental impact of using two compaction techniques per lane-mile. Then, Figure 23 through Figure 26 present the resource savings as well as the reductions in emissions based on 1,700 lane-miles of pavement surface construction and maintenance.
Table 25. Roller Energy and Emission Estimations for One Hour*
Category Unit Number of Units
Engine Power (kw)
Total Usage
Fuel (diesel) US gal/hr 7.33 N/A 7.33 gph CO gram/kilowatt-hr 5 97 485 g/kWh NOx gram/kilowatt-hr 4 97 388 g/kWh Water US gal/hr 105.5 N/A 105.5 gph
*Based on EPA Tier 3 Non-Road Diesel Engine (engine power = 97 kW)
Table 26. Energy Usage and Emissions for One Lane-Mile of Compaction
Category Total Project Time
Total Fuel Usage
Total CO Emission
Total NOx Emission
Total Water Usage
Unit (hr) (US gal) (g) (g) (US gal)
Convention compaction 4.73 35 2294 1835 499 Intelligent compaction 3.72 27 1804 1443 392
Figure 23. Fuel Savings after One Year and Ten Years
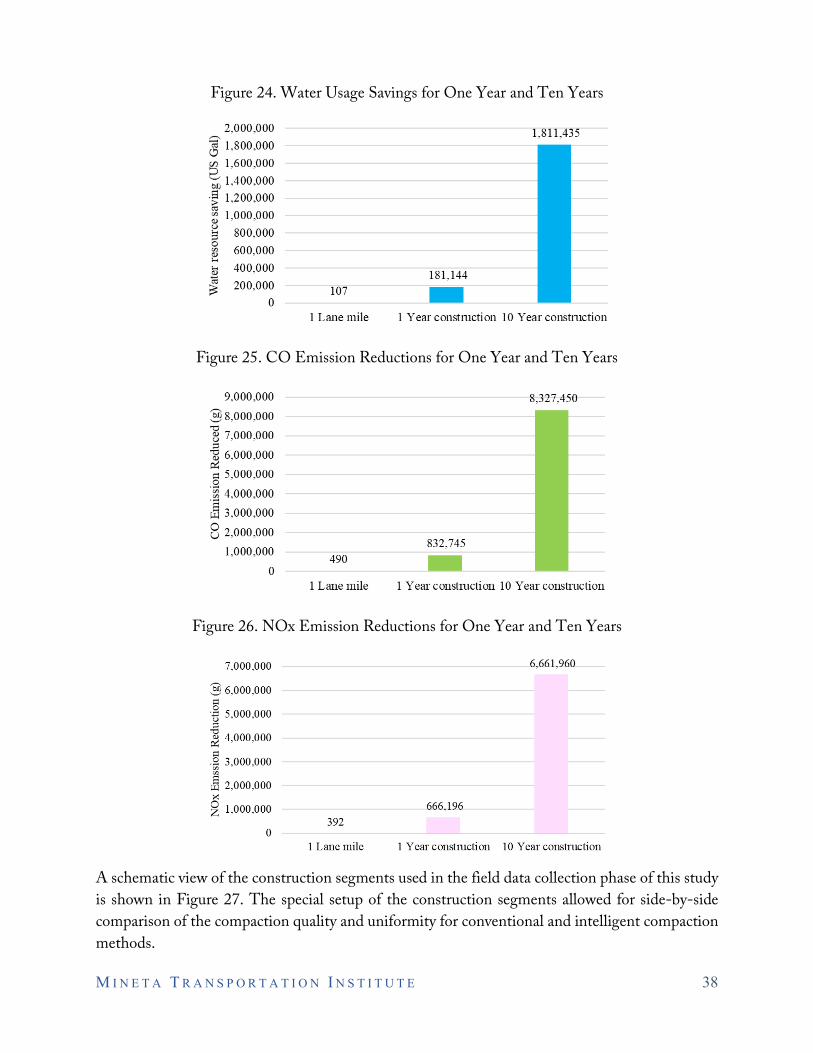
M I N E T A T R A N S P O R T A T I O N I N S T I T U T E 38
Figure 24. Water Usage Savings for One Year and Ten Years
Figure 25. CO Emission Reductions for One Year and Ten Years
Figure 26. NOx Emission Reductions for One Year and Ten Years
A schematic view of the construction segments used in the field data collection phase of this study is shown in Figure 27. The special setup of the construction segments allowed for side-by-side comparison of the compaction quality and uniformity for conventional and intelligent compaction methods.
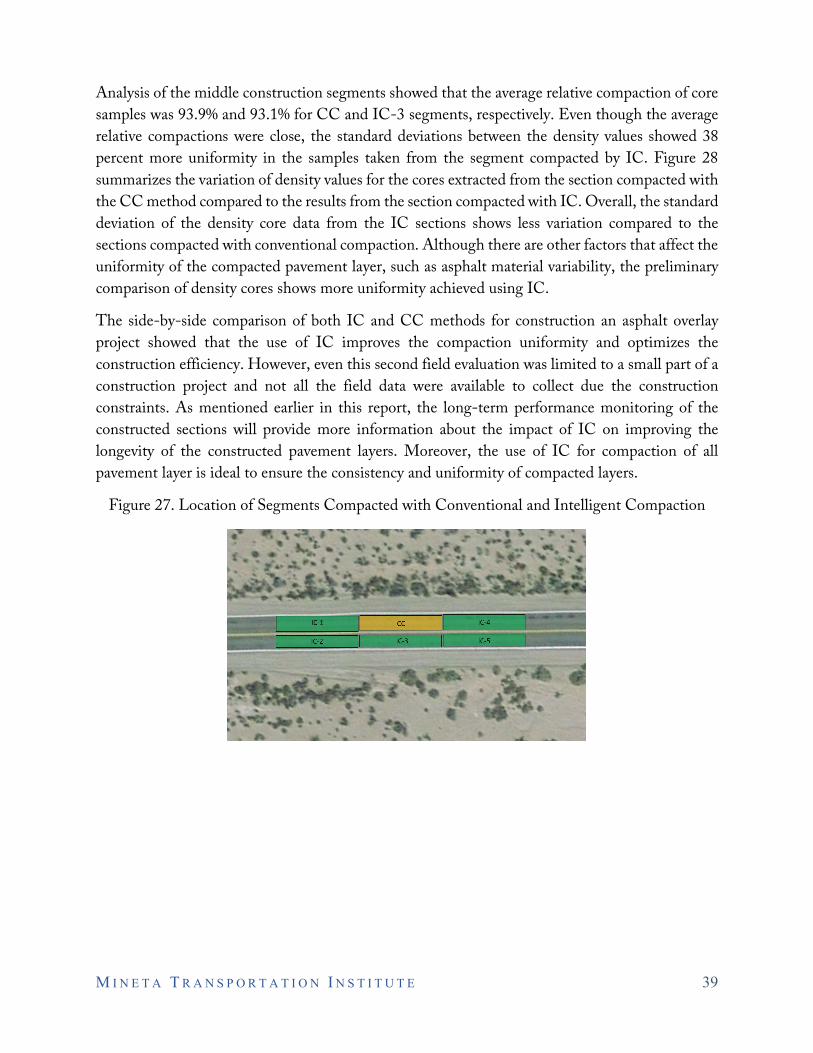
M I N E T A T R A N S P O R T A T I O N I N S T I T U T E 39
Analysis of the middle construction segments showed that the average relative compaction of core samples was 93.9% and 93.1% for CC and IC-3 segments, respectively. Even though the average relative compactions were close, the standard deviations between the density values showed 38 percent more uniformity in the samples taken from the segment compacted by IC. Figure 28 summarizes the variation of density values for the cores extracted from the section compacted with the CC method compared to the results from the section compacted with IC. Overall, the standard deviation of the density core data from the IC sections shows less variation compared to the sections compacted with conventional compaction. Although there are other factors that affect the uniformity of the compacted pavement layer, such as asphalt material variability, the preliminary comparison of density cores shows more uniformity achieved using IC.
The side-by-side comparison of both IC and CC methods for construction an asphalt overlay project showed that the use of IC improves the compaction uniformity and optimizes the construction efficiency. However, even this second field evaluation was limited to a small part of a construction project and not all the field data were available to collect due the construction constraints. As mentioned earlier in this report, the long-term performance monitoring of the constructed sections will provide more information about the impact of IC on improving the longevity of the constructed pavement layers. Moreover, the use of IC for compaction of all pavement layer is ideal to ensure the consistency and uniformity of compacted layers.
Figure 27. Location of Segments Compacted with Conventional and Intelligent Compaction
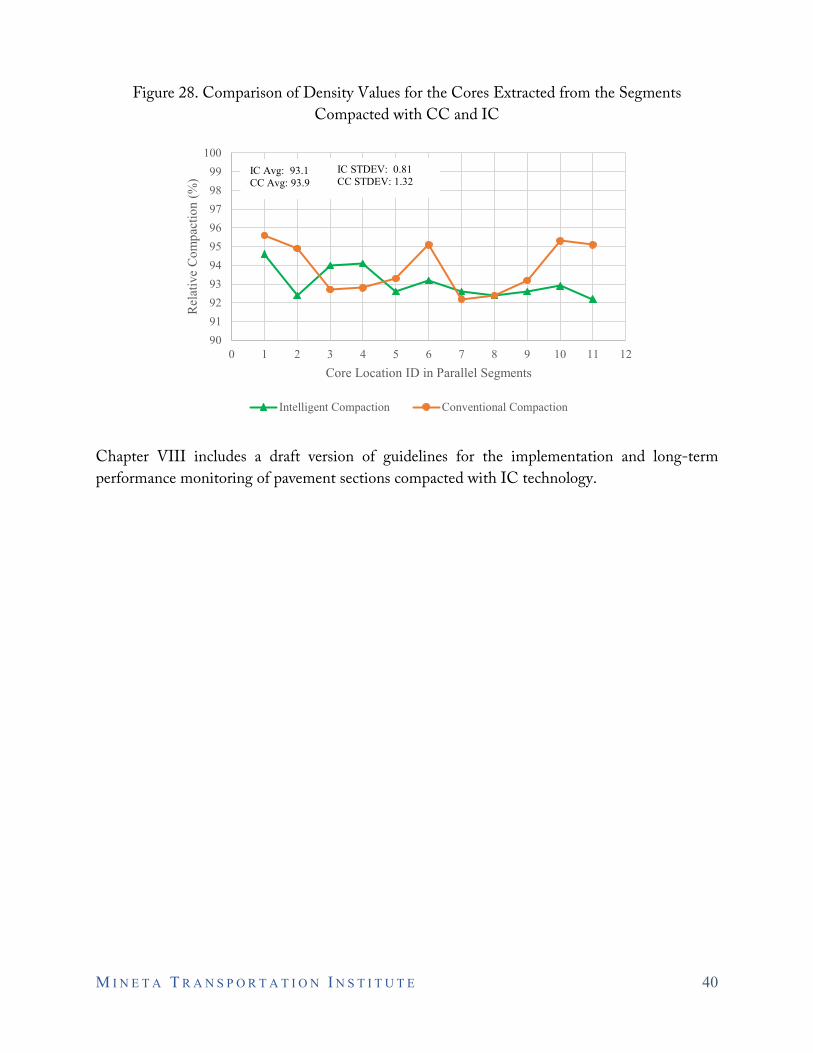
M I N E T A T R A N S P O R T A T I O N I N S T I T U T E 40
Figure 28. Comparison of Density Values for the Cores Extracted from the Segments Compacted with CC and IC
Chapter VIII includes a draft version of guidelines for the implementation and long-term performance monitoring of pavement sections compacted with IC technology.
90919293949596979899
100
0 1 2 3 4 5 6 7 8 9 10 11 12
Rel
ativ
e C
ompa
ctio
n (%
)
Core Location ID in Parallel Segments
Intelligent Compaction Conventional Compaction
IC STDEV: 0.81CC STDEV: 1.32
IC Avg: 93.1CC Avg: 93.9
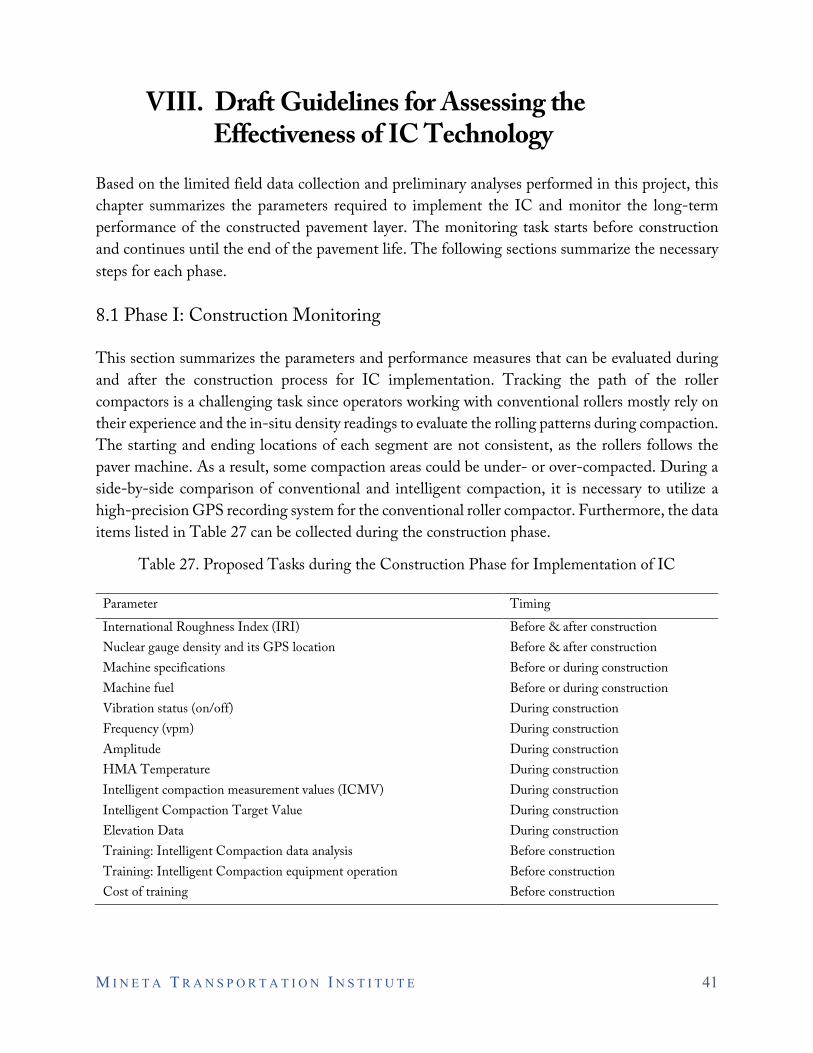
M I N E T A T R A N S P O R T A T I O N I N S T I T U T E 41
VIII. Draft Guidelines for Assessing theEffectiveness of IC Technology
Based on the limited field data collection and preliminary analyses performed in this project, this chapter summarizes the parameters required to implement the IC and monitor the long-term performance of the constructed pavement layer. The monitoring task starts before construction and continues until the end of the pavement life. The following sections summarize the necessary steps for each phase.
8.1 Phase I: Construction Monitoring
This section summarizes the parameters and performance measures that can be evaluated during and after the construction process for IC implementation. Tracking the path of the roller compactors is a challenging task since operators working with conventional rollers mostly rely on their experience and the in-situ density readings to evaluate the rolling patterns during compaction. The starting and ending locations of each segment are not consistent, as the rollers follows the paver machine. As a result, some compaction areas could be under- or over-compacted. During a side-by-side comparison of conventional and intelligent compaction, it is necessary to utilize a high-precision GPS recording system for the conventional roller compactor. Furthermore, the data items listed in Table 27 can be collected during the construction phase.
Table 27. Proposed Tasks during the Construction Phase for Implementation of IC
Parameter Timing
International Roughness Index (IRI) Before & after construction Nuclear gauge density and its GPS location Before & after construction Machine specifications Before or during construction Machine fuel Before or during construction Vibration status (on/off) During construction Frequency (vpm) During construction Amplitude During construction HMA Temperature During construction Intelligent compaction measurement values (ICMV) During construction Intelligent Compaction Target Value During construction Elevation Data During construction Training: Intelligent Compaction data analysis Before construction Training: Intelligent Compaction equipment operation Before construction Cost of training Before construction
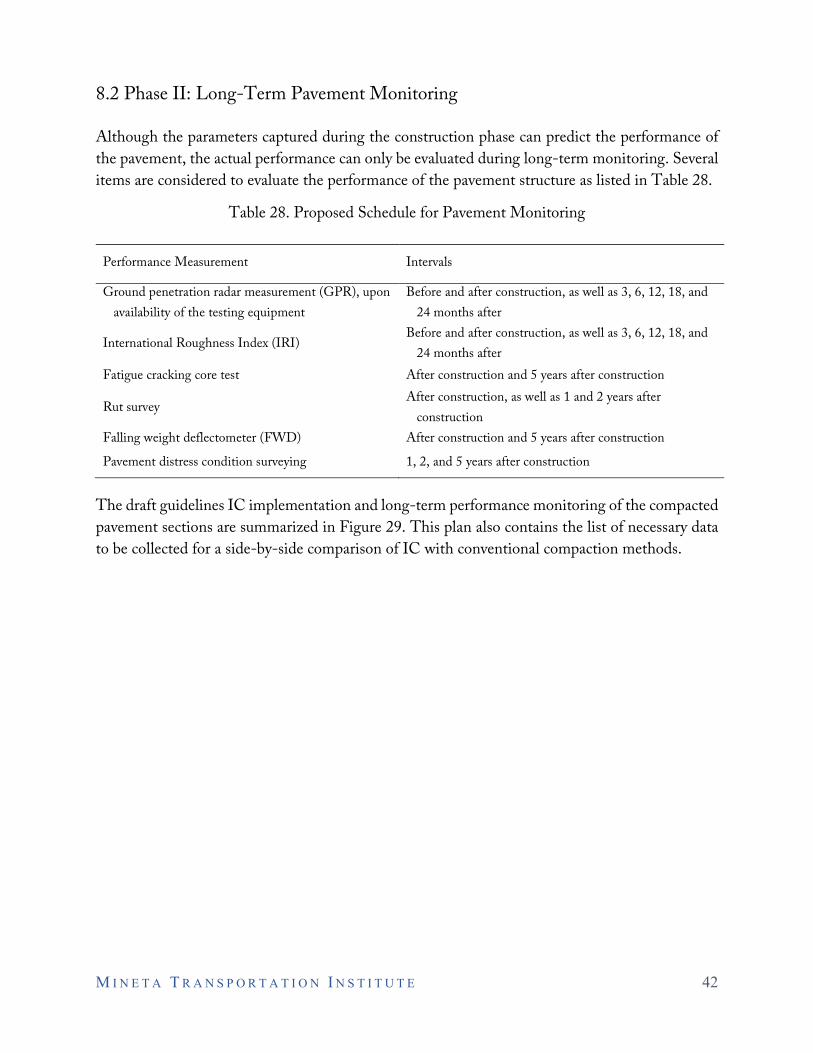
M I N E T A T R A N S P O R T A T I O N I N S T I T U T E 42
8.2 Phase II: Long-Term Pavement Monitoring
Although the parameters captured during the construction phase can predict the performance of the pavement, the actual performance can only be evaluated during long-term monitoring. Several items are considered to evaluate the performance of the pavement structure as listed in Table 28.
Table 28. Proposed Schedule for Pavement Monitoring
Performance Measurement Intervals
Ground penetration radar measurement (GPR), upon availability of the testing equipment
Before and after construction, as well as 3, 6, 12, 18, and 24 months after
International Roughness Index (IRI) Before and after construction, as well as 3, 6, 12, 18, and
24 months after Fatigue cracking core test After construction and 5 years after construction
Rut survey After construction, as well as 1 and 2 years after
construction Falling weight deflectometer (FWD) After construction and 5 years after construction
Pavement distress condition surveying 1, 2, and 5 years after construction
The draft guidelines IC implementation and long-term performance monitoring of the compacted pavement sections are summarized in Figure 29. This plan also contains the list of necessary data to be collected for a side-by-side comparison of IC with conventional compaction methods.
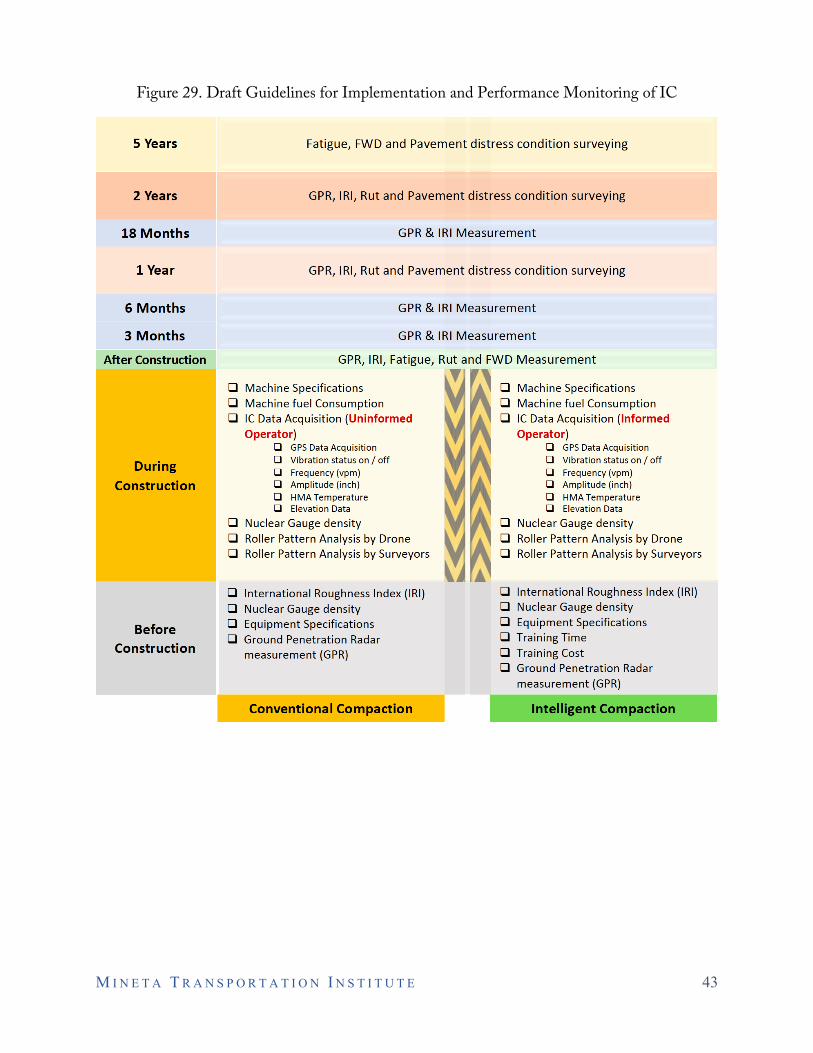
M I N E T A T R A N S P O R T A T I O N I N S T I T U T E 43
Figure 29. Draft Guidelines for Implementation and Performance Monitoring of IC
M I N E T A T R A N S P O R T A T I O N I N S T I T U T E 44
IX. Conclusions
In this study, a dynamic vibratory roller, equipped with all instruments necessary for intelligent compaction (IC) data collection, was utilized for compaction of a Hot Mix Asphalt overlay along a section of a construction site. In collaboration with field engineers and the contractor, the research team recorded in-situ data such as the number of passes, duration of machine operations, and direction of machine movements, as well as in-situ density and other construction performance measures. The data set from the IC roller was also extracted to compare with the density readings taken during the conventional compaction process. A preliminary life-cycle cost analysis (LCCA) was performed to evaluate the impact of IC on cost savings during the life of the compacted pavement section. Data from field evaluations were collected to perform the cost-benefit analysis and compute the LCCA for both IC and conventional compaction processes. The following can be concluded from the outcomes of this study.
• IC can potentially reduce the time needed for construction. This reduction results inlower construction costs and lower environmental impacts.
• The improved compaction quality of the pavement layers by using IC, has the potentialto minimize maintenance costs during the service life of the pavement.
• A draft guideline was developed to collect the necessary data during and after theconstruction of pavement layers using intelligent compaction.
• Long-term monitoring of the performance of pavement sections compacted using ICtechnology can help estimate the effectiveness and efficiency of this technologycompared to the conventional compaction practice.
• The extended service life of the pavement layers compacted using the IC rollers needsto be further evaluated with in extensive laboratory and field settings.
• The successful implementation of IC requires attention to many aspects of theconstruction process and collection of the appropriate geo-referenced field data. Thecollection and interpretation of IC data requires trained project personnel to be able toextract meaningful information both during and after the construction process.
Within the various constraints experienced during the collection of field data in this study and the limited scope of this project, the draft version of guidelines for the implementation and monitoring of compacted pavement section is proposed to enable a comparison of the performance of the IC system in different project settings. However, to develop a comprehensive set of guidelines and draft specifications, more field data collected during different pavement construction projects will be required in future studies.

M I N E T A T R A N S P O R T A T I O N I N S T I T U T E 45
Bibliography
Anderegg, R., and K. Kaufmann. “Intelligent Compaction with Vibratory Rollers: Feedback Control Systems in Automatic Compaction and Compaction Control.” Transportation Research Record 1868, no. 1 (2004): 124–134.
Babashamsi, P., N. I. M. Yusoff, H. Ceylan, N. G. M. Nor, and H. S. Jenatabadi. “Evaluation of Pavement Life Cycle Cost Analysis: Review and Analysis.” International Journal of Pavement Research and Technology 9, no. 4 (2016): 241–254.
California Department of Transportation (Caltrans). Method of Test for Relative Compaction of Untreated and Treated Soils and Aggregates Using Nuclear Gages. California Test 231, Division of Engineering Services, Sacramento, CA, 2013.
Chang, G. and S. Nazarian. Intelligent Compaction Measurement Values (ICMV) Levels, International Society for Intelligent Construction, https://www.is-ic.org/library/intelligent-compaction/, 2020.
Fathi, A., C. Tirado, A. Gholamy, L. Lemus, M. Mazari, and S. Nazarian. Consideration of depth of influence in implementation of intelligent compaction in earthwork quality management. Transportation Research Board, No. 18-02100. 2018.
Fathi, A., C. Tirado, M. Mazari, S. Rocha, and S. Nazarian. Correlating Continuous Compaction Control Measurements to In Situ Modulus-Based Testing for Quality Assessment of Compacted Geomaterials. Springer Series in Geomechanics and Geoengineering. Springer, Cham, 2019 (pp. 585–595).
Fathi, A., A. Tirado, M. Mazari, and S. Nazarian. Developing Transfer Functions between Intelligent Compaction Roller and Lightweight Deflectometer Data. In Airfield and Highway Pavements 2019: Innovation and Sustainability in Highway and Airfield Pavement Technology, pp. 112-120. Reston, VA: American Society of Civil Engineers, 2019.
Fathi, A., C. Tirado, S. Rocha, M. Mazari, and S. Nazarian. Incorporating Calibrated Numerical Models in Estimating Moduli of Compacted Geomaterials from Integrated Intelligent Compaction Measurements and Laboratory Testing. Transportation Research Record (2020): 0361198120912743.
Federal Highway Administration (FHWA), Life-Cycle Cost Analysis Primer, Office of Asset Management, US Department of Transportation, 2002.
Federal Highway Administration (FHWA), Techbrief: Specification for Intelligent Compaction A review on National and State Specifications. Report FHWA-HIF-17-037, US Department of Transportation, 2017.
M I N E T A T R A N S P O R T A T I O N I N S T I T U T E 46
Harvey, J., J. Meijer, H. Ozer, I. L. Al-Qadi, A. Saboori, and A. Kendall. Pavement Life Cycle Assessment Framework (No. FHWA-HIF-16-014). Federal Highway Administration, Washington, DC, 2016.
Huang, Y., R. Bird, and O. Heidrich. “Development of a Life Cycle Assessment Tool for Construction and Maintenance of Asphalt Pavements.” Journal of Cleaner Production 17, no. 9 (2009): 283–296.
Kumar, S. A., M. Mazari, J. Garibay, R. E. Al Douri, S. Nazarian, and J. Si. Compaction Quality Monitoring of Lime-Stabilized Clayey Subgrade using Intelligent Compaction Technology. 2016 International Conference on Transportation and Development, American Society of Civil Engineers, Houston, TX, 2016.
Lemus, L., J. Beltran, M. Mazari, C. Tirado, R. Aldouri, and S. Nazarian. Improvement of Base and Soil Construction Quality by Using Intelligent Compaction Technology. Center for Transportation Infrastructure Systems, University of Texas at El Paso, El Paso, TX, 2017.
Lemus, L., A. Fathi, J. Beltran, A. Gholami, C. Tirado, M. Mazari, and S. Nazarian. Geospatial relationship of intelligent compaction measurement values with in situ testing for quality assessment of geomaterials. In International Conference on Transportation and Development 2018: Airfield and Highway Pavements, pp. 293–301. Reston, VA: American Society of Civil Engineers, 2018.
Liu, D., Y. Wang, J. Chen, and Y. Zhang. “Intelligent Compaction Practice and Development: A Bibliometric Analysis.” Engineering, Construction and Architectural Management (2019).
Mazari, M., J. Beltran, R. Aldouri, G. Chang, J. Si, and S. Nazarian. Evaluation and Harmonization of Intelligent Compaction Systems. International Conference on Transportation and Development, American Society of Civil Engineers, Houston, TX, 2016 (pp. 838–846).
Mazari, M., C. Tirado, S. Nazarian, and R. Aldouri. “Impact of Geospatial Classification Method on Interpretation of Intelligent Compaction Data.” Transportation Research Record 2657, no. 1 (2017): 37–46.
Mazari, M., and S. Nazarian. “Mechanistic Approach for Construction Quality Management of Compacted Geomaterials.” Transportation Geotechnics 13 (2017): 92–102.
Mooney, M. A., R.V. Rinehart, W.F. Norman, O.M. Musimbi, D.J. White, and P.K.R. Vennapusa, Intelligent Soil Compaction Systems (vol. 676). National Cooperative Highway Research Program, Transportation Research Board, 2010.
Nazarian, S., M. Mazari, I. N. Abdallah, A. J. Puppala, L. N. Mohammad, and M. Y. Abu-Farsakh. Modulus-Based Construction Specification for Compaction of Earthwork and Unbound Aggregate. Washington, DC: Transportation Research Board, 2015.
M I N E T A T R A N S P O R T A T I O N I N S T I T U T E 47
Nazarian, S., M. Mazari, G. Chang, R. Aldouri, and J. Beltran. Intelligent Compaction Roller Retrofit Kit Validation. Report FHWA TIDP-130 (096) (2015).
Nazarian, S., A. Fathi, C. Tirado, V. Kreinovich, S. Rocha, and M. Mazari. “Evaluating Mechanical Properties of Earth Material During Intelligent Compaction.” NCHRP Research Report 933 (2020).
Ozbay, K., D. Jawad, N. A. Parker, and S. Hussain. “Life-Cycle Cost Analysis: State of the Practice versus State of the Art.” Transportation Research Record 1864, no. 1 (2004): 62–70.
Pasetto, M., E. Pasquini, G. Giacomello, and A. Baliello. Life-Cycle Assessment of Road Pavements Containing Marginal Materials: A Comparative Analysis based on a Real Case Study. Pavement Life-Cycle Assessment (pp. 199–208). CRC Press, 2017.
Santos, J., J. Bryce, G. Flintsch, A. Ferreira, and B. Diefenderfer. “A Life Cycle Assessment of In-Place Recycling and Conventional Pavement Construction and Maintenance Practices.” Structure and Infrastructure Engineering 11, no. 9 (2015): 1199–1217.
Saravanan, V., M. Pourhomayoun, and M. Mazari. A Proposed Method to Improve Highway Construction Quality Using Machine Learning. In 2018 International Conference on Computational Science and Computational Intelligence (CSCI) (pp. 1218–1221). IEEE, 2018.
Satani, S., S. F. Aval, J. Garrido, and M. Mazari. Preliminary Evaluation of using Intelligent Compaction for Life Cycle Assessment and Life Cycle Cost Analysis of Pavement Structures. In Pavement, Roadway, and Bridge Life Cycle Assessment 2020: Proceedings of the International Symposium on Pavement. Roadway, and Bridge Life Cycle Assessment 2020, LCA 2020, Sacramento, CA, CRC Press, 2020.
Savan, C. M., K. W. Ng, and K. Ksaibati. “Benefit-Cost Analysis and Application of Intelligent Compaction for Transportation.” Transportation Geotechnics 9 (2016): 57–68.
Schwartz, C. W., Z. Afsharikia, and S. Khosravifar. Standardizing lightweight deflectometer modulus measurements for compaction quality assurance. No. MD-17-SHA-UM-3-20. Maryland. State Highway Administration, 2017.
Tighe, S. “Guidelines for Probabilistic Pavement Life Cycle Cost Analysis.” Transportation Research Record 1769, no. 1 (2001): 28-38.
Tirado, C., A. Fathi, M. Mazari, and S. Nazarian. Design Verification of Earthwork Construction by Integrating Intelligent Compaction Technology and Modulus-Based Testing. Transportation Research Board, No. 19-03542, 2019.
Walls, J., and Michael R. Smith. Life-cycle cost analysis in pavement design: Interim technical bulletin. No. FHWA-SA-98-079. United States. Federal Highway Administration, 1998.
M I N E T A T R A N S P O R T A T I O N I N S T I T U T E 48
White, D. J., M. J. Thompson, P. Vennapusa, and J. Siekmeier. “Implementing Intelligent Compaction Specification on Minnesota TH-64: Synopsis of Measurement Values, Data Management, and Geostatistical Analysis.” Transportation Research Record 2045, no. 1 (2008): 1–9.
Xu, Q., G. K. Chang, V. L. Gallivan, and R. D. Horan. “Influences of Intelligent Compaction Uniformity on Pavement Performances of Hot Mix Asphalt.” Construction and Building Materials 30 (2012): 746–752.
Xu, Q., and G. K. Chang. “Evaluation of Intelligent Compaction for Asphalt Materials.” Automation in Construction 30 (2013): 104–112.
Xu, X., M. Akbarian, J. Gregory, and R. Kirchain. “Role of the Use Phase and Pavement-Vehicle Interaction in Comparative Pavement Life Cycle Assessment as a Function of Context.” Journal of Cleaner Production 230 (2019): 1156–1164.
M I N E T A T R A N S P O R T A T I O N I N S T I T U T E 49
About the Authors
Mehran Mazari, Ph.D.
Mehran Mazari is an Assistant Professor in the Department of Civil Engineering at California State University specializing in Transportation Infrastructures and Materials. His research interests include sustainable and resilient transportation infrastructure, transportation geotechnics and pavement materials, and non-destructive evaluation of transportation infrastructures. He has been actively involved in a number of national and state-funded research projects; he is also a member of technical committees at the Transportation Research Board (TRB) of National Academies of Science and Engineering and the Highway Pavement Committee of the American Society of Civil Engineers (ASCE). Further, Dr. Mazari is the faculty director of the Sikand Center for Sustainable and Intelligent Infrastructure and founding director of Sustainable Infrastructure Materials (SIM) research lab at California State University Los Angeles.
Siavash F. Aval
Siavash is a research associate at the Department of Civil Engineering at California State University Los Angeles working on transportation infrastructure materials projects. He holds a master’s degree from the University of Massachusetts Dartmouth.
Siddharth M. Satani
Siddharth was a graduate student at the Department of Civil Engineering at California State University Los Angeles. He is now a project engineer at Mott, McDonald working on highway- and transportation-related projects.
David Corona
David is an undergraduate student at the Department of Civil Engineering at California State University Los Angeles. He is the recipient of the 2021 Transportation Research Board (TRB) Minority Fellowship. His main research interest is transportation engineering.
Joshua Garrido
Joshua is a graduate student at the Department of Civil Engineering at California State University Los Angeles. He is the recipient of the 2019 Transportation Research Board (TRB) Minority Fellowship and the 2020 Dwight David Eisenhower Transportation Fellowship from the Federal Highway Administration (FHWA). His main research interests are transportation engineering and data visualization.
Founded in 1991, the Mineta Transportation Institute (MTI), an organized research and training unit in partnership with the Lucas College and Graduate School of Business at San José State University (SJSU), increases mobility for all by improving the safety, efficiency, accessibility, and convenience of our nation’s transportation system.Through research, education, workforce development, and technology transfer, we help create a connected world. MTI leads the four-university Mineta Consortium for Transportation Mobility, a Tier 1 University Transportation Center funded by the U.S. Department of Transportation’s Office of the Assistant Secretary for Research and Technology (OST-R), the California Department of Transportation (Caltrans), and by private grants and donations.
MTI’s transportation policy work is centered on three primary responsibilities:
MINETA TRANSPORTATION INSTITUTELEAD UNIVERSITY OF
Mineta Consortium for Transportation Mobility
ResearchMTI works to provide policy-oriented research for all levels of government and the p rivate sector to foster the develop-ment of optimum surface transportation systems. Research areasinclude: bicycle and pedestrian issues; financing public and privatesector transportation improvements; intermodal connectivity and integration; safety and security of transportation systems; sustainability of transportation systems;transportation / land use / environment; and transportation planning and policy development. Certified Research Associates conduct the research. Certification requires an advanced degree, generally a Ph.D., a record of academic publications, and professional references. Research projects culminate in a peer-reviewed publication, available on TransWeb, the MTI website (http://transweb.sjsu.edu).
EducationThe Institute supports education programs for students seeking a career in the development and operation of surface transportation systems. MTI, through San José State University, offers an AACSB-accredited Master of Science in Transportation Management and graduate certificates in Transportation Management,Transportation Security, and High-Speed Rail Management that serve to prepare the nation’s transportation managers for the 21st century. With the
active assistance of the California Department of Transportation (Caltrans), MTI delivers its classes over a state-of-the-art videoconference network throughout the state of Californiaand via webcasting beyond, allowing working transportation professionals to pursue an advanced degree regardless of theirlocation. To meet the needs of employers seeking a diverseworkforce, MTI’s education program promotes enrollment to under-represented groups.
Information and Technology TransferMTI utilizes a diverse array of dissemination methods and media to ensure research results reach those responsible for managing change. These methods include publication, seminars, workshops, websites, social media, webinars,and other technology transfer mechanisms. Additionally, MTI promotes the availability of completed research to professional organizations and journals and works to integrate the research findings into the graduate education program.MTI’s extensive collection of transportation- related publications is integrated into San José State University’s world-class Martin Luther King, Jr. Library.
The contents of this report reflect the views of the authors, who are responsible for the facts and accuracy of the information presented herein.This document is disseminated in the interest of information exchange. The report is funded, partially or entirely, by a grant from the U.S. Department of Transportation’s University Transportation Centers Program. This report does not necessarily reflect the official views or policies of the U.S. government, State of California, or the Mineta Transportation Institute, who assume no liability for the contents or use thereof.This report does not constitute a standard specification, design standard, or regulation.
Disclaimer
MTI FOUNDERHon. Norman Y. Mineta
MTI BOARD OF TRUSTEES
Founder, Honorable Norman Mineta*Secretary (ret.), US Department of Transportation
Chair, Abbas MohaddesPresident & COOEconolite Group Inc.
Vice Chair,Will KemptonExecutive DirectorSacramento Transportation Authority
Executive Director, Karen Philbrick, PhD*Mineta Transportation InstituteSan José State University
Winsome BowenChief Regional Transportation StrategyFacebook
David CastagnettiCo-FounderMehlman Castagnetti Rosen & Thomas
Maria CinoVice PresidentAmerica & U.S. Government Relations Hewlett-Packard Enterprise
Grace Crunican** OwnerCrunican LLC
Donna DeMartinoManaging Director Los Angeles-San Diego-San Luis Obispo Rail Corridor Agency
Nuria Fernandez**General Manager & CEOSanta Clara Valley Transportation Authority (VTA)
John FlahertySenior FellowSilicon Valley American Leadership Form
William Flynn *President & CEOAmtrak
Rose GuilbaultBoard MemberPeninsula Corridor Joint Powers Board
Ian Jefferies*President & CEOAssociation of American Railroads
Diane Woodend Jones Principal & Chair of BoardLea + Elliott, Inc.
David S. Kim*Secretary California State Transportation Agency (CALSTA)
Therese McMillan Executive DirectorMetropolitan Transportation Commission (MTC)
Bradley MimsPresident & CEOConference of Minority Transportation Officials (COMTO)
Jeff MoralesManaging Principal InfraStrategies, LLC
Dan Moshavi, PhD*Dean, Lucas College and Graduate School of BusinessSan José State University
Toks Omishakin*DirectorCalifornia Department of Transportation (Caltrans)
Takayoshi OshimaChairman & CEOAllied Telesis, Inc.
Paul Skoutelas*President & CEOAmerican Public Transportation Association (APTA)
Beverley Swaim-Staley PresidentUnion Station Redevelopment Corporation
Jim Tymon*Executive DirectorAmerican Association of State Highway and Transportation Officials (AASHTO)
Larry Willis*President (Deceased Nov. 2020) Transportation Trades Dept., AFL-CIO
* = Ex-Officio** = Past Chair, Board of Trustees
Directors
Karen Philbrick, PhDExecutive Director
Hilary Nixon, PhDDeputy Executive Director
Asha Weinstein Agrawal, PhDEducation DirectorNational Transportation Finance Center Director
Brian Michael JenkinsNational Transportation Security Center Director