Embed Size (px)
Citation preview

Developing measures of cost-effectiveness and tenant outcomes in social housing
City Futures Research Centre
NSW Federation of HAs, 11 September 2015

Presentation overview
• Background – project origins and remit
• Phase 1 research process, findings & recommendations
• Phase 2 research components
• Draft report structure
• Trialling housing mgmt expenditure analysis methodology
• Findings of housing management expenditure analysis
• Draft recommendations

Background – project origins and remit
• Commissioned by AHURI in 2013 (at request of HMAC) to develop better metrics for comparing provider types/entities on: Unit costs of housing management service Tenant outcomes related to ‘housing management’ service
• Ideally accommodate state govt providers & larger CHPs
• Possible outcome – new performance metrics for annual collection and publication
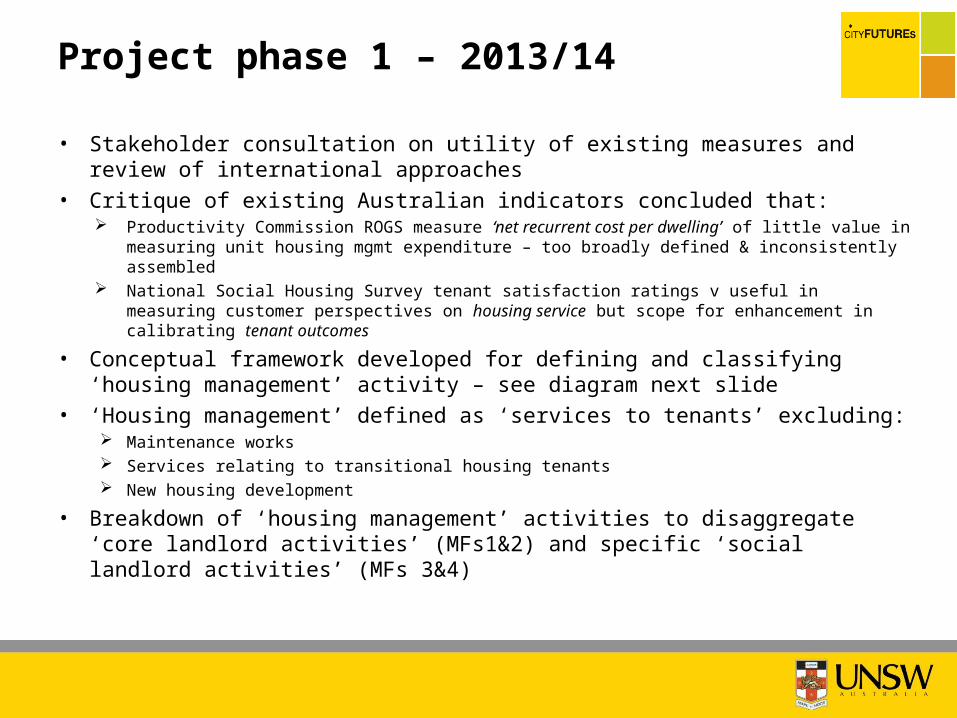
• Stakeholder consultation on utility of existing measures and review of international approaches
• Critique of existing Australian indicators concluded that: Productivity Commission ROGS measure ‘net recurrent cost per dwelling’ of little value in
measuring unit housing mgmt expenditure – too broadly defined & inconsistently assembled National Social Housing Survey tenant satisfaction ratings v useful in measuring customer
perspectives on housing service but scope for enhancement in calibrating tenant outcomes
• Conceptual framework developed for defining and classifying ‘housing management’ activity – see diagram next slide
• ‘Housing management’ defined as ‘services to tenants’ excluding: Maintenance works Services relating to transitional housing tenants New housing development
• Breakdown of ‘housing management’ activities to disaggregate ‘core landlord activities’ (MFs1&2) and specific ‘social landlord activities’ (MFs 3&4)
Project phase 1 – 2013/14

Proposed housing management conceptual framework
Source: Pawson, H., Milligan, V., Phibbs, P. & Rowley, S. (2014) Assessing cost effectiveness and tenant outcomes in social housing: Developing a framework; Positioning Paper; Melbourne: AHURI 1

Project phase 2 – empirical research components: 8 case study social landlords
• Develop & test expenditure analysis methodology
• Investigate social housing management activities contributing to social inclusion:
o Document via provider manager workshops
o Probe via online survey of CHP frontline staff
• Examine how social landlords measure ‘tenant outcomes’

Draft Final Report structure
Chapter
1. Introduction
2. Calibrating social housing management expenditure
3. Housing management activities contributing to tenant outcomes
4. Measuring added value contributed to tenant outcomes
5. Synthesis of findings, conclusions and recommendations

• Jointly with Elton Consulting, developed workbook (data input vehicle and rules manual) to: Define ‘housing management (HM) activities’ for this purpose
Guide grouping of relevant HM activities into proposed categories
Appropriately allocate all relevant salary and non-salary expenditure – including overheads, both:
a) Back office functions – whether delivered under in-house or contracted out model
b) Senior management staff salaries
• In-depth collaboration with 8 landlords (6 CHPs and 2 state housing providers) to work through problematic issues
• Rest of presentation concentrates on HM expenditure metrics
Trialling proposed framework for housing management expenditure analysis - overview
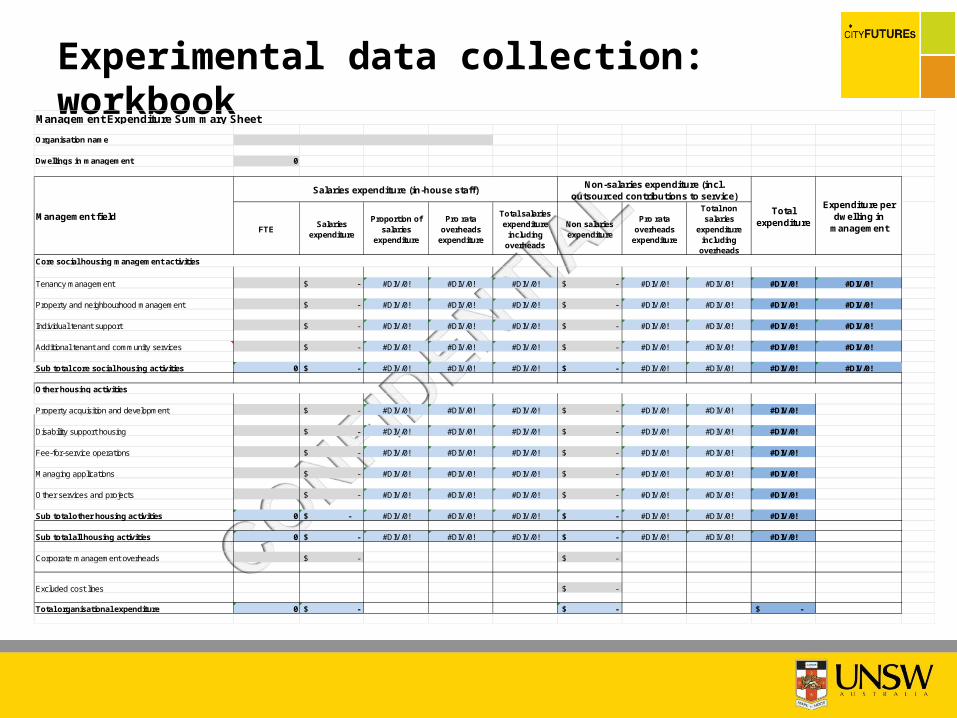
Experimental data collection: workbook
Organisation name
Dwellings in management 0
FTESalaries
expenditure
Proportion of salaries
expenditure
Pro rata overheads
expenditure
Total salaries expenditure
including overheads
Non salaries expenditure
Pro rata overheads
expenditure
Total non salaries
expenditure including
overheads
Tenancy management -$ #DIV/0! #DIV/0! #DIV/0! -$ #DIV/0! #DIV/0! #DIV/0! #DIV/0!
Property and neighbourhood management -$ #DIV/0! #DIV/0! #DIV/0! -$ #DIV/0! #DIV/0! #DIV/0! #DIV/0!
Individual tenant support -$ #DIV/0! #DIV/0! #DIV/0! -$ #DIV/0! #DIV/0! #DIV/0! #DIV/0!
Additional tenant and community services -$ #DIV/0! #DIV/0! #DIV/0! -$ #DIV/0! #DIV/0! #DIV/0! #DIV/0!
Sub total core social housing activities 0 -$ #DIV/0! #DIV/0! #DIV/0! -$ #DIV/0! #DIV/0! #DIV/0! #DIV/0!
Property acquisition and development -$ #DIV/0! #DIV/0! #DIV/0! -$ #DIV/0! #DIV/0! #DIV/0!
Disability support housing -$ #DIV/0! #DIV/0! #DIV/0! -$ #DIV/0! #DIV/0! #DIV/0!
Fee-for-service operations -$ #DIV/0! #DIV/0! #DIV/0! -$ #DIV/0! #DIV/0! #DIV/0!
Managing applications -$ #DIV/0! #DIV/0! #DIV/0! -$ #DIV/0! #DIV/0! #DIV/0!
Other services and projects -$ #DIV/0! #DIV/0! #DIV/0! -$ #DIV/0! #DIV/0! #DIV/0!
Sub total other housing activities 0 -$ #DIV/0! #DIV/0! #DIV/0! -$ #DIV/0! #DIV/0! #DIV/0!
Sub total all housing activities 0 -$ #DIV/0! #DIV/0! #DIV/0! -$ #DIV/0! #DIV/0! #DIV/0!
Corporate management overheads -$ -$
Excluded cost lines -$
Total organisational expenditure 0 -$ -$ -$
Core social housing management activities
Other housing activities
Management Expenditure Summary Sheet
Expenditure per dwelling in
managementManagement field
Total expenditure
Non-salaries expenditure (incl. outsourced contributions to service)
Salaries expenditure (in-house staff)
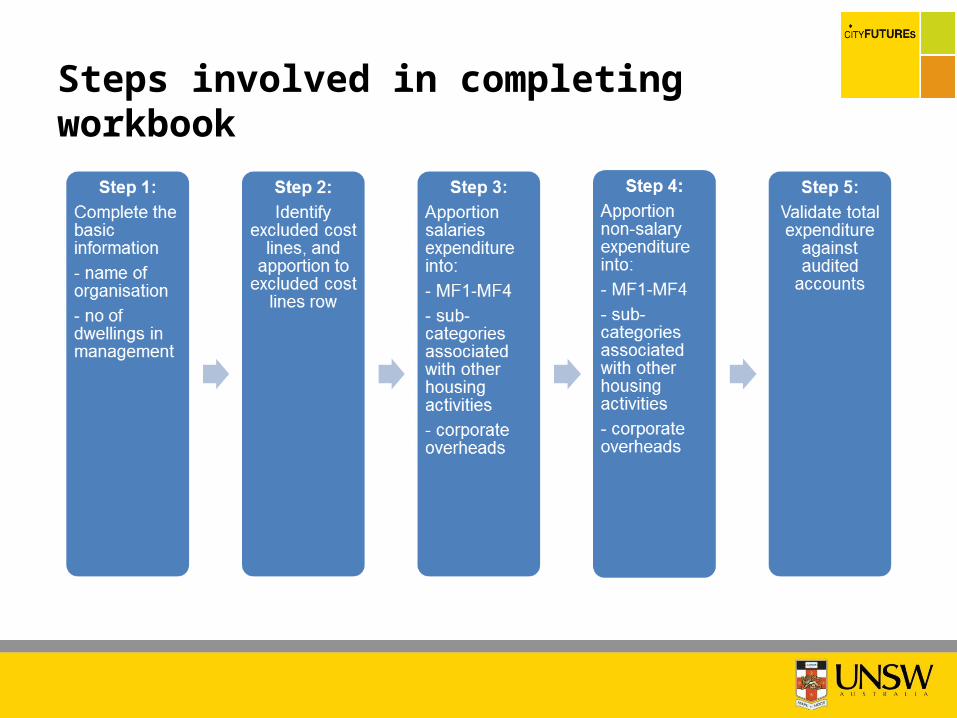
Steps involved in completing workbook
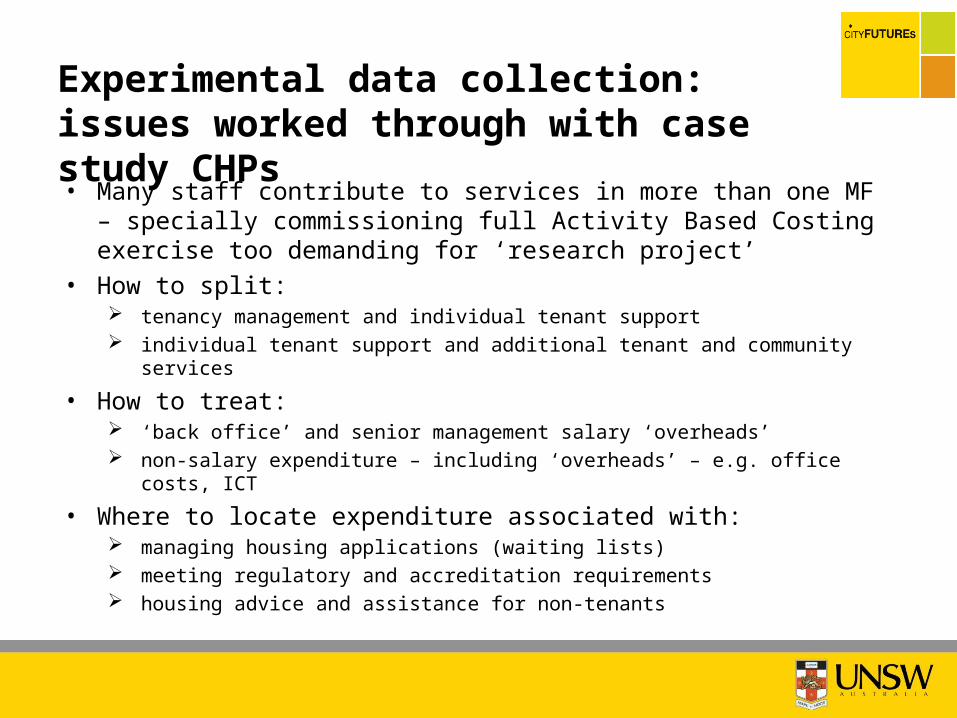
Experimental data collection: issues worked through with case study CHPs
• Many staff contribute to services in more than one MF – specially commissioning full Activity Based Costing exercise too demanding for ‘research project’
• How to split: tenancy management and individual tenant support individual tenant support and additional tenant and community services
• How to treat: ‘back office’ and senior management salary ‘overheads’ non-salary expenditure – including ‘overheads’ – e.g. office costs, ICT
• Where to locate expenditure associated with: managing housing applications (waiting lists) meeting regulatory and accreditation requirements housing advice and assistance for non-tenants
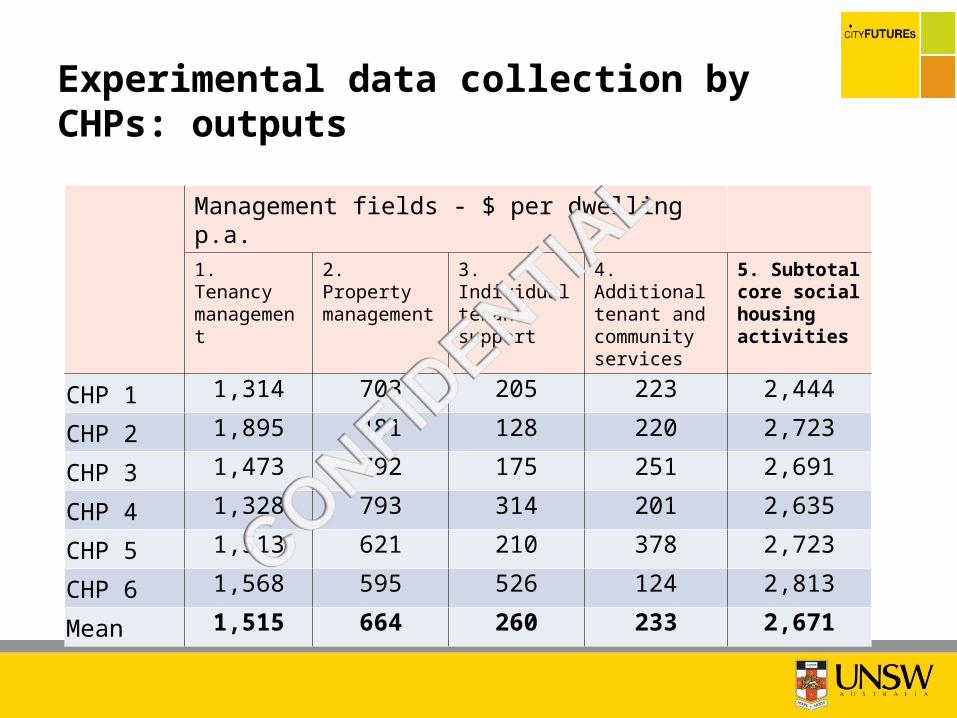
Experimental data collection by CHPs: outputs
Management fields - $ per dwelling p.a.
1. Tenancy management
2. Property management
3. Individual tenant support
4. Additional tenant and community services
5. Subtotal core social housing activities
CHP 1 1,314 703 205 223 2,444
CHP 2 1,895 481 128 220 2,723
CHP 3 1,473 792 175 251 2,691
CHP 4 1,328 793 314 201 2,635
CHP 5 1,513 621 210 378 2,723
CHP 6 1,568 595 526 124 2,813
Mean 1,515 664 260 233 2,671

Comments on ‘experimental’ housing management expenditure findings• ‘Total expenditure per dwelling’
figures in relatively narrow band - $2,444-$2,813
• Tenancy management in all cases >50% of total expenditure
• Across all CHPs just under a fifth of expenditure on ‘non-core’ activities

Experimental data collection: challenges faced by public housing providers
• Public housing organisational structures presented problems: Scale and complexity Integration of public housing administration within
multi-service Directorates Reliance on contributions to certain landlord services
from other Directorates
• Case for excluding ‘remote Indigenous’ housing and associated expenditure where significant
• Absence of clearly definable validation points – no self-contained annual accounts
• Substantial effort needed to fully capture all relevant expenditure (esp overheads and salary costs of other Directorates) – beyond scope of research project
• Acknowledged incompleteness of total expenditure estimates means too unreliable and potentially misleading for publication

Benchmarking recorded CHP total housing management expenditure per dwelling
• Recorded mean annual expenditure per dwelling across 6 CHPs: $2,671
• Crude estimate based on 2013/14 ARs suggests upper limit of $3,180 – true figure will be lower to the extent that landlords engage in business activities other than social housing management
• Average housing management expenditure per unit for UK housing associations equivalent to $2,038
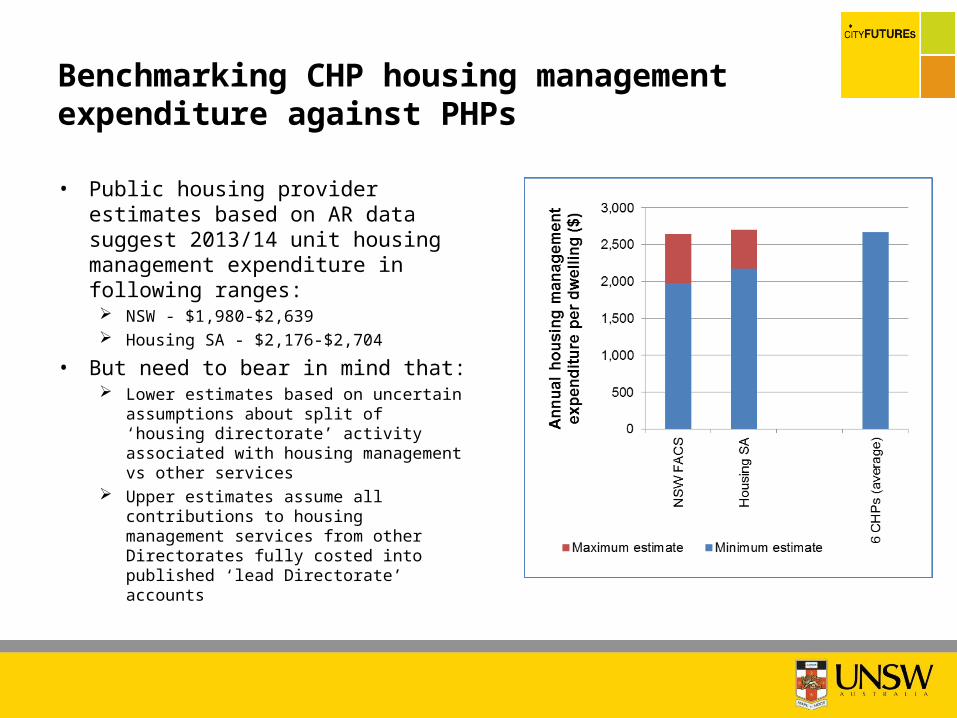
Benchmarking CHP housing management expenditure against PHPs
• Public housing provider estimates based on AR data suggest 2013/14 unit housing management expenditure in following ranges: NSW - $1,980-$2,639 Housing SA - $2,176-$2,704
• But need to bear in mind that: Lower estimates based on uncertain
assumptions about split of ‘housing directorate’ activity associated with housing management vs other services
Upper estimates assume all contributions to housing management services from other Directorates fully costed into published ‘lead Directorate’ accounts
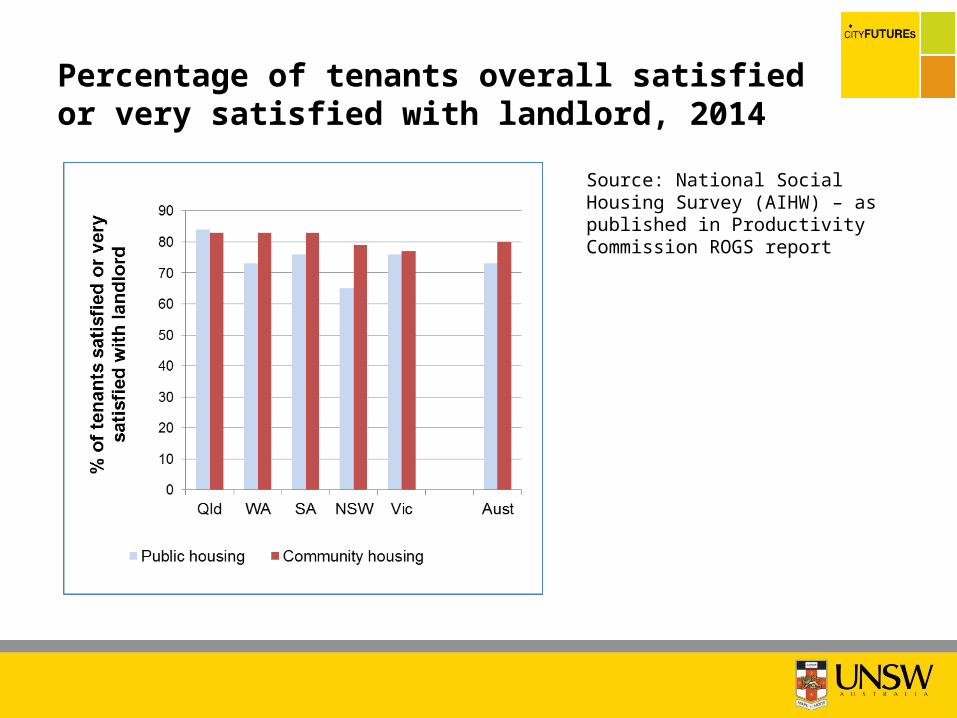
Percentage of tenants overall satisfied or very satisfied with landlord, 2014
Source: National Social Housing Survey (AIHW) – as published in Productivity Commission ROGS report
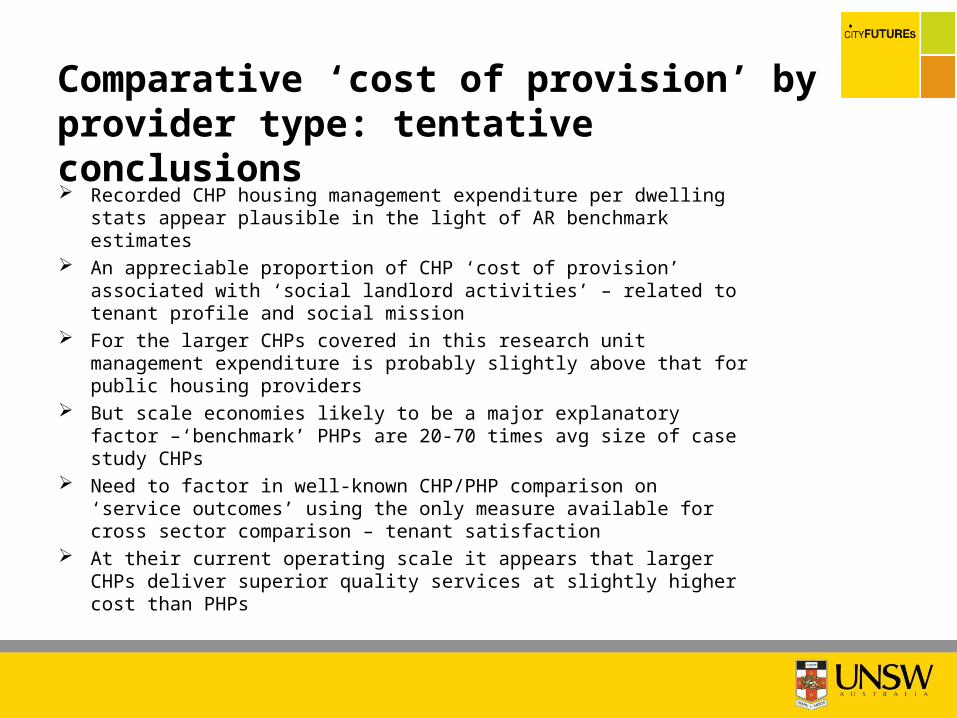
Comparative ‘cost of provision’ by provider type: tentative conclusions
Recorded CHP housing management expenditure per dwelling stats appear plausible in the light of AR benchmark estimates
An appreciable proportion of CHP ‘cost of provision’ associated with ‘social landlord activities’ – related to tenant profile and social mission
For the larger CHPs covered in this research unit management expenditure is probably slightly above that for public housing providers
But scale economies likely to be a major explanatory factor –‘benchmark’ PHPs are 20-70 times avg size of case study CHPs
Need to factor in well-known CHP/PHP comparison on ‘service outcomes’ using the only measure available for cross sector comparison – tenant satisfaction
At their current operating scale it appears that larger CHPs deliver superior quality services at slightly higher cost than PHPs
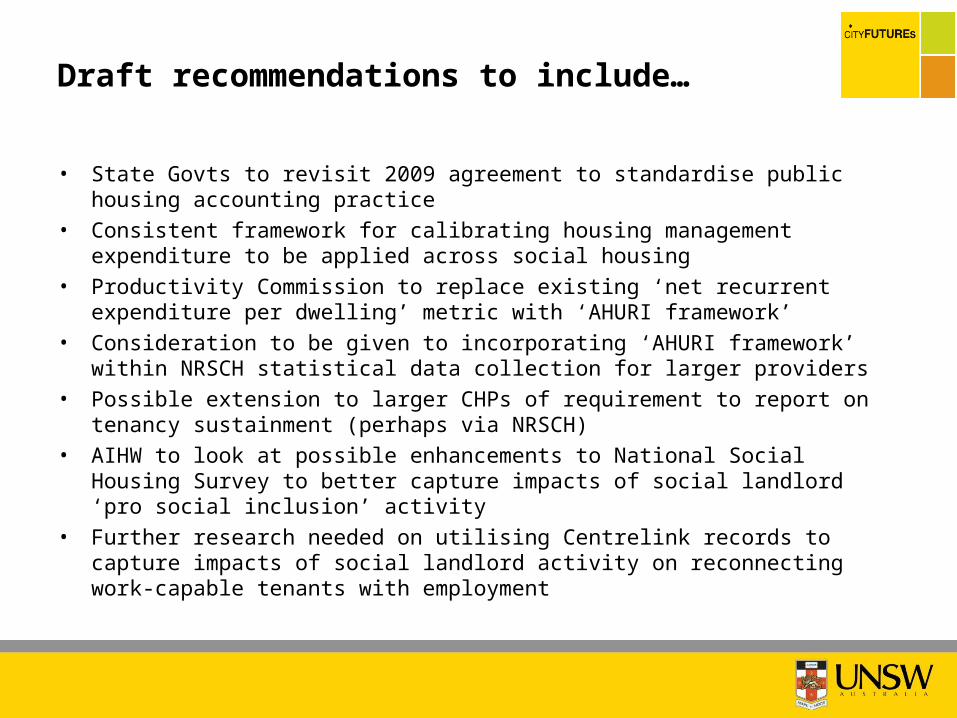
Draft recommendations to include…
• State Govts to revisit 2009 agreement to standardise public housing accounting practice
• Consistent framework for calibrating housing management expenditure to be applied across social housing
• Productivity Commission to replace existing ‘net recurrent expenditure per dwelling’ metric with ‘AHURI framework’
• Consideration to be given to incorporating ‘AHURI framework’ within NRSCH statistical data collection for larger providers
• Possible extension to larger CHPs of requirement to report on tenancy sustainment (perhaps via NRSCH)
• AIHW to look at possible enhancements to National Social Housing Survey to better capture impacts of social landlord ‘pro social inclusion’ activity
• Further research needed on utilising Centrelink records to capture impacts of social landlord activity on reconnecting work-capable tenants with employment