Embed Size (px)
Citation preview
PoS(PSTP2019)051
Developing New Q-meters for NMR Measurementsof Polarized Solids
James Maxwell∗†Thomas Jefferson National Accelerator FacilityE-mail: [email protected]
Enhanced polarization of target nuclei can be measured via the complex impedance of a resonantcircuit coupled to the target while sweeping the circuit through the nuclear Larmor frequency,observing the absorption or emission of energy by the spins in the material. For decades, solidpolarized targets at Jefferson Lab have relied upon continuous-wave Nuclear Magnetic Resonancepolarization measurements using Liverpool Q-meter systems. These Liverpool Q-meters are nolonger produced, and replacing the aging components is becoming increasingly difficult. Thepolarized target group at Bochum has produced replacement Q-meters in the Liverpool style us-ing modern components, and we are following their example while researching improvemnts tothe technique. We discuss our efforts to produce improved Q-meters for upcoming experimentsutilizing solid polarized targets in Jefferson Lab’s Hall B.
The 18th International Workshop on Polarized Sources, Targets, and Polarimetry, PSTP201923-27 September, 2019Knoxville, Tennessee
∗Speaker.†On behalf of the CLAS12 Polarized Target Collaboration.
c© Copyright owned by the author(s) under the terms of the Creative CommonsAttribution-NonCommercial-NoDerivatives 4.0 International License (CC BY-NC-ND 4.0). https://pos.sissa.it/
PoS(PSTP2019)051
New Q-meters for NMR Measurements James Maxwell
1. Introduction
Dynamic nuclear polarization (DNP) of solids allows the production of highly polarized targetswhich are a crucial piece of Jefferson Lab’s polarized scattering program [1]. DNP takes advantageof the very high electron polarization (P = tanh(µB/kT ))) at a practical temperature (T ∼ 1 K)and magnetic field (B∼ 5T ), to polarize nearby nuclei via flip-flop transitions in the electron-spin–nucleus-spin system. These transitions are driven by microwave radiation of frequency close to theelectron spin resonance frequency less or more the nuclear Larmor frequency (νesr±νnmr).
Nuclear Magnetic Resonance (NMR) is used to measure the polarization achieved in a targetsample. Using a coil of inductance L0 near the sample and perpendicular to the polarizing field B,an induced field B0 at the Larmor frequency ω0 drives spin flips, causing transitions of the Zeeman-splitting energy levels, hω0 = gµB. Depending on the average orientation of the spins to the field,these spins flips absorb or emit energy as they interact with the field generated by the inductorand its electrical circuit. The spin system’s response to the induced RF field B0 is its magneticsusceptibility, χ(ω), and is a function of the RF frequency ω . The magnetic susceptibility consistsof a dispersive term χ ′(ω) and an imaginary absorptive term χ ′′(ω). This absorptive term can beintegrated in frequency to give a proportional measure of the target polarization P:
χ(ω) = χ′(ω)− iχ ′′(ω), P = K
∫∞
0χ′′(ω)dω (1.1)
Here K contains information on the target nucleus as well as the properties of the NMR system,and is typically determined empirically through measurements at thermal equilibrium, when thepolarization can be determined from the known magnetic field and temperature via Boltzmannstatistics. Since χ ′′(ω) is non-zero only in a small range around the Larmor frequency, the integralonly need be performed very close to center. The inductance of the embedded coil couples to themagnetic susceptibility, via a filling factor η ,
LC(ω) = L0[1+4πηχ(ω)] (1.2)
so that a measurement that isolates the real part of the complex impedance of the coil versus fre-quency will give a proportional measure of the polarization.
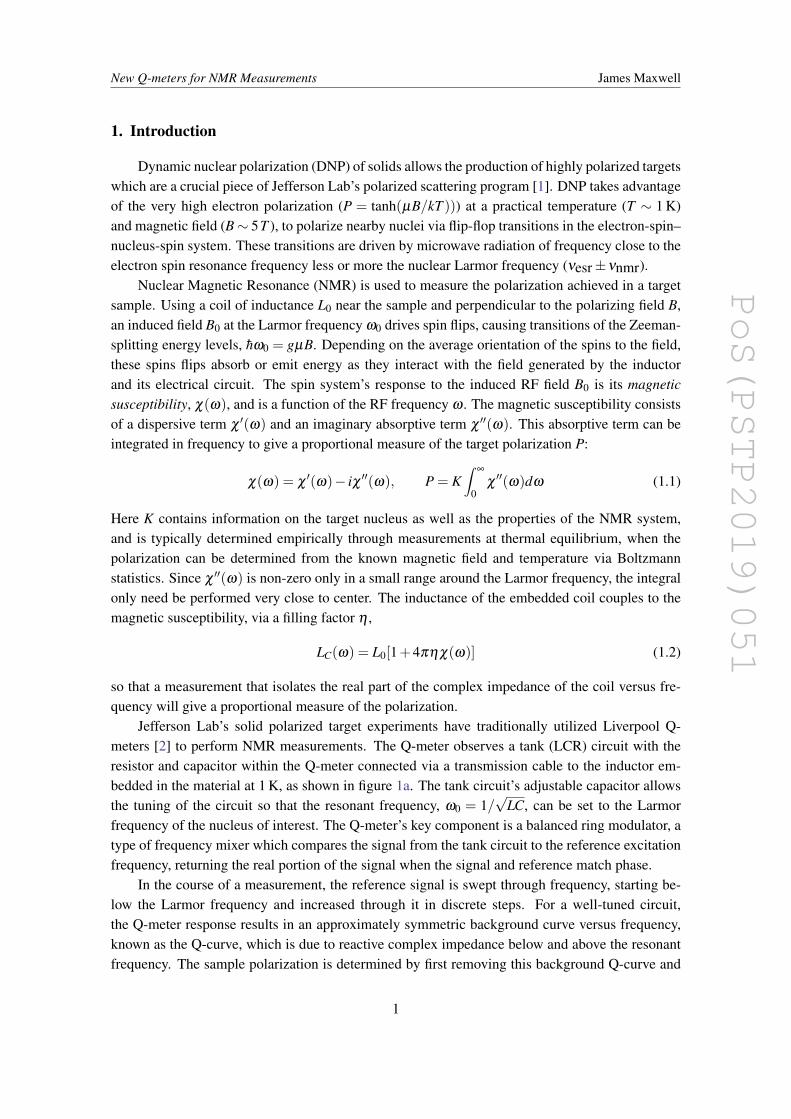
Jefferson Lab’s solid polarized target experiments have traditionally utilized Liverpool Q-meters [2] to perform NMR measurements. The Q-meter observes a tank (LCR) circuit with theresistor and capacitor within the Q-meter connected via a transmission cable to the inductor em-bedded in the material at 1 K, as shown in figure 1a. The tank circuit’s adjustable capacitor allowsthe tuning of the circuit so that the resonant frequency, ω0 = 1/
√LC, can be set to the Larmor
frequency of the nucleus of interest. The Q-meter’s key component is a balanced ring modulator, atype of frequency mixer which compares the signal from the tank circuit to the reference excitationfrequency, returning the real portion of the signal when the signal and reference match phase.
In the course of a measurement, the reference signal is swept through frequency, starting be-low the Larmor frequency and increased through it in discrete steps. For a well-tuned circuit,the Q-meter response results in an approximately symmetric background curve versus frequency,known as the Q-curve, which is due to reactive complex impedance below and above the resonantfrequency. The sample polarization is determined by first removing this background Q-curve and
1
PoS(PSTP2019)051
New Q-meters for NMR Measurements James Maxwell
(a) Traditional Q-meter NMR (b) “Cold” Q-meter NMR
Figure 1: Diagrams showing the traditional NMR layout, and the “cold” circuit NMR layout, whichincludes varactor-diode tuning capacitors and an electronic phase shifter.
integrating the remaining signal. The background Q-curve is measured by adjusting the magneticfield to be off resonance, and shifts in the background over time are removed through parameterizedfits.
When performing calibrations using un-enhanced polarization of material at thermal equilib-rium, and particularly when measuring deuteron signals, the signal size can approach the noisefloor of the system. By moving the resistor and tuning capacitor into the cryostat in a “cold” circuitNMR layout, thermal noise can be reduced [3]. Because the tuning capacitor is no long accessiblefrom outside the cryostat, variable capacitors, such as varactor diodes, can be used to remotely tunethe resonant circuit [4], as shown in Figure 1b.
The lengths of the cable used to connect the components of the Q-meter system must be chosencarefully for an accurate measurement. In the traditional Q-meter layout, the long transmission linebetween the Q-meter (with internal resistor and tuning capacitor) and the coil allows a proper tuneof the resonant circuit when the cable length is an integer multiple of half the wavelength of the RF(Nλ/2), effectively removing the complex impedance of the transmission line at ω0. Because thislength doesn’t change as the frequency is swept, the cable contributes to the background Q-curveabove and below ω0. The longer the Nλ/2 cable, the deeper the curve. In the cold circuit layout,the resistor, capacitor and inductor are together, removing this Nλ/2 transmission cable and itseffect on the Q-curve. However, two transmission lines connect the cold circuit to the Q-meter,labeled as “signal” and “supply” in Figure 1b, and these cables contribute complex impedance tothe measurement in different ways, as we discuss in section 2.1.
2
PoS(PSTP2019)051
New Q-meters for NMR Measurements James Maxwell
2. Development
In preparation for a suite of polarized target experiments scheduled to run in Hall B, we areworking to improve our NMR techniques. The first priority to address is the aging of our LiverpoolQ-meters, which have been in use since at least the 1990’s. These units are quite robust, but theyare no longer produced and include parts which are not replaceable. The Bochum target grouphas produced new Q-meters [5], following the original Liverpool design closely and utilizing anupdated version of the same mixer, the Minicircuits SRA-1 balanced ring modulator [6]. To meetour needs, we have produced new Q-meter boards, expanding on the improvements they added.
Our second objective is to revisit cold circuit NMR techniques, which were used briefly fordeuteron runs in JLab’s Hall B polarized target [7] using static capacitors that did not allow remotetuning. We have added varactor diodes to allow remote tuning of the capacitance [8], and havebeen assessing their use not only for deuterons, but for protons as well. Tests of cold circuit NMRmethods using in the CLAS12 polarized target refrigerator [9] have given unforeseen results. Todate, our tests have focused on cold circuit NMR of proton signals at 5 T and 213 MHz, a very dif-ferent regime than the 32.7 MHz frequency of the deuteron at 5 T. While the system performed asdesigned in other respects, we encountered polarization signals of the opposite magnitude, protrud-ing out of the Q-curve rather than into it as expected. This effect was observed with our prototypeQ-meter systems and with Liverpool Q-meters. Because no such effect was mentioned in Courtet al [3] which discussed cold NMR at 32.7 MHz, we suspected that the higher frequency couldcontribute to the effect. To further investigate, we turned to calculations of the circuit behavior.
2.1 Q-meter Calculation
To anticipate the behavior of the Q-meter system in various experimental circumstances, wehave developed computer code written in Python to calculate the Q-meter response. This workbegan from MathCAD code written by M. Houlden and G. Court, and was generalized to allowany length of transmission line in various circuit locations. The code contains equations describingthe complex impedance of the resonant circuit and supporting elements, as prescribed by Kirchoff’slaws, along with applications of the telegrapher’s equations to account for long transmission lines.Notable are the terms required to account for the input impedance of the transmission lines:
Zin(ω) = Z0ZL +Z0 tanh(γl)Z0 +ZL tanh(γl)
(2.1)
for the load impedance ZL. The characteristic impedance of the transmission line Z0 and propaga-tion constant γ are expressed in terms of length l, resistance R, inductance L, capacitance C andconductance G of the line:
Z0(ω) =
√R+ iωLG+ iωC
, γ(ω) =√(R+ iωL)(G+ iωC). (2.2)
The telegrapher’s equations take into account the impedance mismatches which come with certainlengths of transmission cable, and they strongly effect the circuit response versus frequency.
Our code takes as input the tuning capacitance, phase shift applied to the reference input tothe mixer, and the lengths of four possible transmission lines seen in Figure 1b: between the C
3
PoS(PSTP2019)051
New Q-meters for NMR Measurements James Maxwell
and L of the resonant circuit (the traditional Nλ /2 line), between the RF generator and the constantcurrent resistor Rcc (the cold circuit supply line), between the resonant circuit signal and Q-meteramplifier (the cold circuit signal line), and/or between the RF generator and the mixer reference(the reference line). The output of the code are the “diode” signal (the signal magnitude) and the“phase” signal (the output of the mixer). It should be noted that this code does not simulate themixer accurately. The balanced ring modulator used to down-mix the signal to the reference istreated as a perfect multiplier to implement the effect of the phase difference between the signaland reference. While this approximation is sufficient to understand most of the Q-meter’s effects,we are working to include a more accurate formulation of the mixer’s behavior.
In addition to simulating signals from known inputs, this code can also be used in reverse,as a function to fit baseline Q-meter signals and predict the inputs used to create them. Having arealistic fitting function allows more accurate fitting of baseline signal backgrounds. To extract thepolarization signal, we typically fit a third order polynomial to the background Q-curve. Fits to arealistic Q-meter response can provide better representation of the Q-curve, reducing error on thepolarization measurement due to to baseline subtraction.
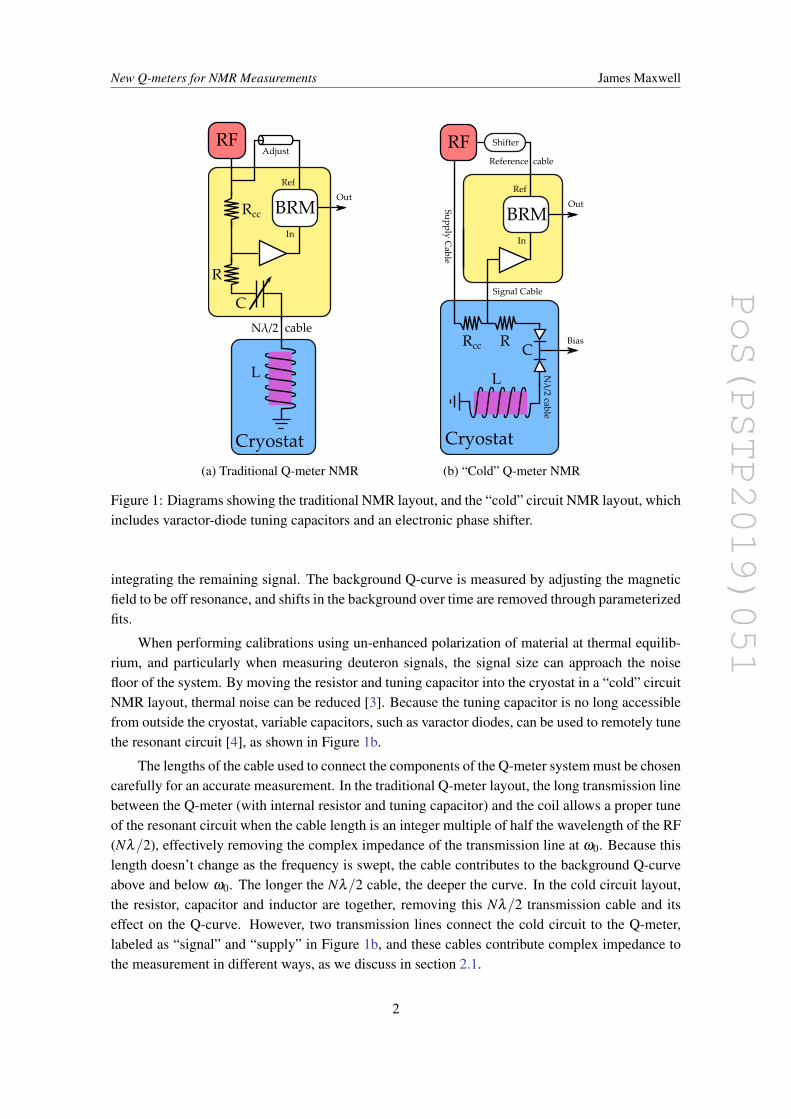
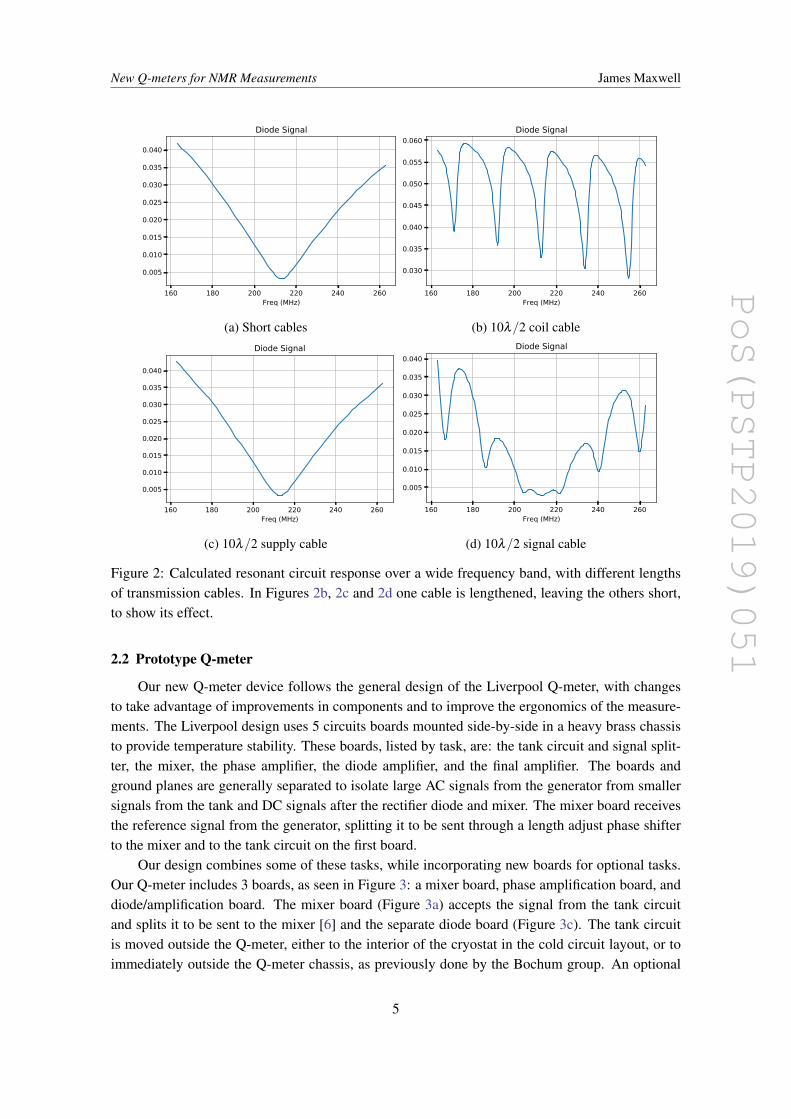
To address the polarization signal reversal discussed in section 2, we used the code to look atvarying cable lengths. The CLAS12 refrigerator is longer than the previous target, requiring at least10 λ/2 cable at 213 MHz to reach the target, and we suspected this extra cable could be involvedin the effect. Figure 2 shows resonant circuit responses taken at the Q-meter’s diode, where themagnitude of the complex impedance is displayed over a very large frequency band to illustrate theeffect of different cables lengths. In Figure 2a the components are not separated by transmissionlines, so a typical tank circuit response is seen, tuned with a minimum at 213 MHz. When a 10λ/2cable is introduced between the Q-meter and the coil of the inductor, strong nodes correspondingto impedance mismatches are seen in the frequency spectrum (Figure 2b). In the cold tank circuitlayout, the supply line from the signal generator is impedance matched with a 50 Ω resistor at thecircuit, so that the effect of a 10λ/2 cable is small, as seen in Figure 2c. However, the length of thesignal cable (between the tank circuit and the Q-meter’s amplifier) introduces nodes of a differentsort, creating nearby local minima and maxima on top of the tank attenuation curve, as in Figure2d.
These local minima and maxima due are the key to understanding the signal reversal effect.Varying the cable length or the tuning capacitance, and thereby shifting the central tune of Figure 2dto the left or right, easily allows the centering of either a minima or maxima in the 800 kHz windowviewed in the Q-meter measurement. Looking from the Q-meter’s narrow view, a phase change of180 degrees flips both the Q-curve and the polarization signal, but choosing a maxima instead ofa minima will flip the Q-curve but not the polarization signal. This means the signal reversal weobserved was some combination of mismatched length, tuning capacitance and/or phase shift. Toavoid signal distortion in the cold circuit layout, care must be taken in the selection of cable lengths(particularly the length of the signal cable), the tuning capacitance should not deviate greatly fromthat determined with short cables, and the overall DC offset of the signals should be observed. Thiseffect is much exaggerated at 213 MHz as the λ/2 length is 6.7 times shorter than that at 32.7 MHz,where previous studies of cold circuits for deuterons have been performed.
4
PoS(PSTP2019)051
New Q-meters for NMR Measurements James Maxwell
160 180 200 220 240 260Freq (MHz)
0.005
0.010
0.015
0.020
0.025
0.030
0.035
0.040
Diode Signal
(a) Short cables
160 180 200 220 240 260Freq (MHz)
0.030
0.035
0.040
0.045
0.050
0.055
0.060Diode Signal
(b) 10λ/2 coil cable
160 180 200 220 240 260Freq (MHz)
0.005
0.010
0.015
0.020
0.025
0.030
0.035
0.040
Diode Signal
(c) 10λ/2 supply cable
160 180 200 220 240 260Freq (MHz)
0.005
0.010
0.015
0.020
0.025
0.030
0.035
0.040Diode Signal
(d) 10λ/2 signal cable
Figure 2: Calculated resonant circuit response over a wide frequency band, with different lengthsof transmission cables. In Figures 2b, 2c and 2d one cable is lengthened, leaving the others short,to show its effect.
2.2 Prototype Q-meter
Our new Q-meter device follows the general design of the Liverpool Q-meter, with changesto take advantage of improvements in components and to improve the ergonomics of the measure-ments. The Liverpool design uses 5 circuits boards mounted side-by-side in a heavy brass chassisto provide temperature stability. These boards, listed by task, are: the tank circuit and signal split-ter, the mixer, the phase amplifier, the diode amplifier, and the final amplifier. The boards andground planes are generally separated to isolate large AC signals from the generator from smallersignals from the tank and DC signals after the rectifier diode and mixer. The mixer board receivesthe reference signal from the generator, splitting it to be sent through a length adjust phase shifterto the mixer and to the tank circuit on the first board.
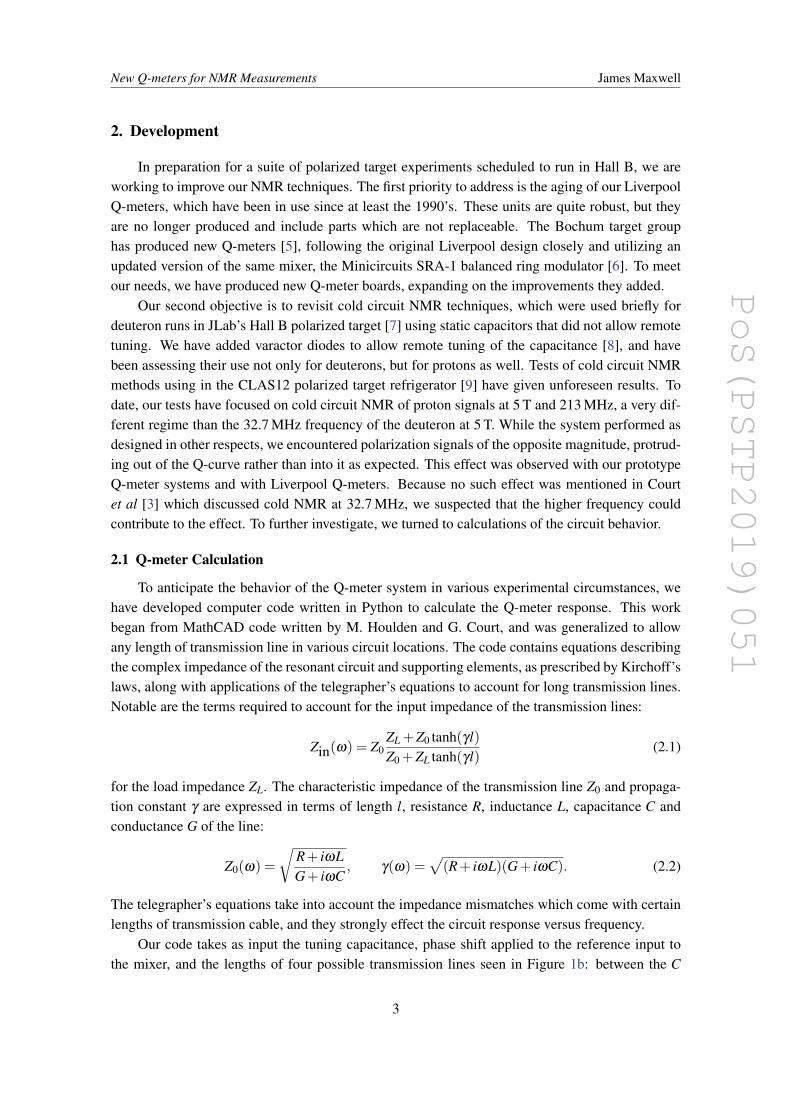
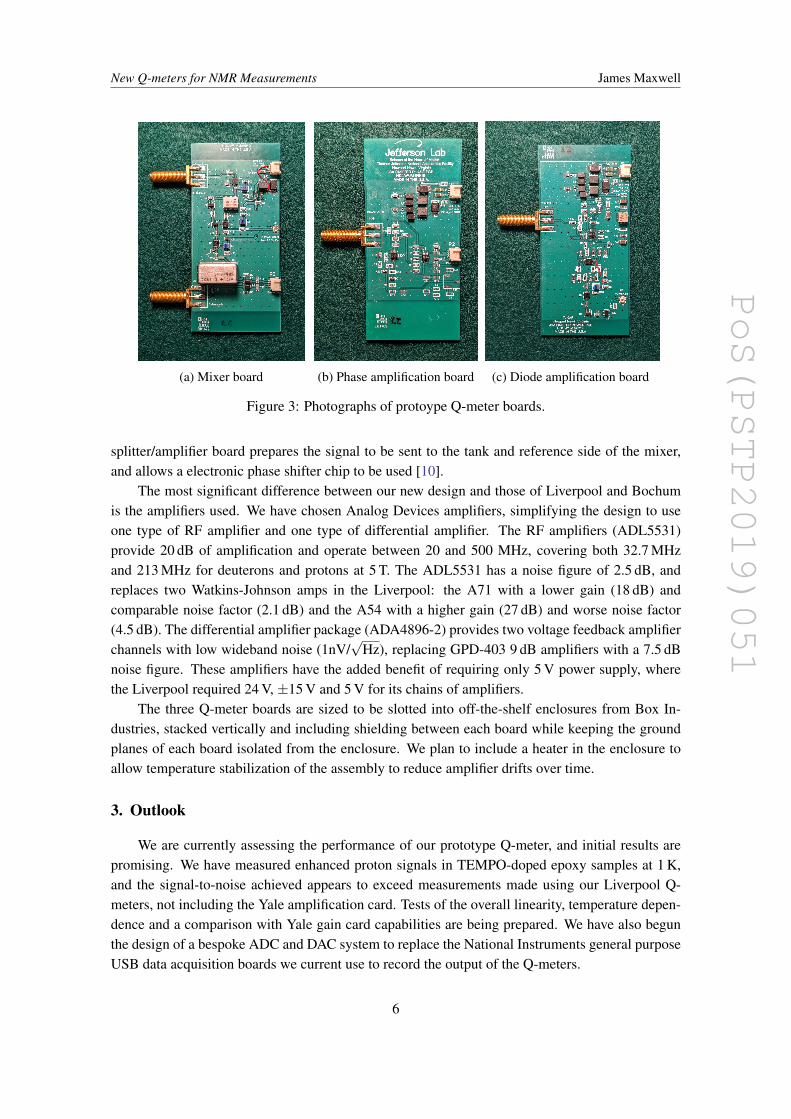
Our design combines some of these tasks, while incorporating new boards for optional tasks.Our Q-meter includes 3 boards, as seen in Figure 3: a mixer board, phase amplification board, anddiode/amplification board. The mixer board (Figure 3a) accepts the signal from the tank circuitand splits it to be sent to the mixer [6] and the separate diode board (Figure 3c). The tank circuitis moved outside the Q-meter, either to the interior of the cryostat in the cold circuit layout, or toimmediately outside the Q-meter chassis, as previously done by the Bochum group. An optional
5
PoS(PSTP2019)051
New Q-meters for NMR Measurements James Maxwell
(a) Mixer board (b) Phase amplification board (c) Diode amplification board
Figure 3: Photographs of protoype Q-meter boards.
splitter/amplifier board prepares the signal to be sent to the tank and reference side of the mixer,and allows a electronic phase shifter chip to be used [10].
The most significant difference between our new design and those of Liverpool and Bochumis the amplifiers used. We have chosen Analog Devices amplifiers, simplifying the design to useone type of RF amplifier and one type of differential amplifier. The RF amplifiers (ADL5531)provide 20 dB of amplification and operate between 20 and 500 MHz, covering both 32.7 MHzand 213 MHz for deuterons and protons at 5 T. The ADL5531 has a noise figure of 2.5 dB, andreplaces two Watkins-Johnson amps in the Liverpool: the A71 with a lower gain (18 dB) andcomparable noise factor (2.1 dB) and the A54 with a higher gain (27 dB) and worse noise factor(4.5 dB). The differential amplifier package (ADA4896-2) provides two voltage feedback amplifierchannels with low wideband noise (1nV/
√Hz), replacing GPD-403 9 dB amplifiers with a 7.5 dB
noise figure. These amplifiers have the added benefit of requiring only 5 V power supply, wherethe Liverpool required 24 V, ±15 V and 5 V for its chains of amplifiers.
The three Q-meter boards are sized to be slotted into off-the-shelf enclosures from Box In-dustries, stacked vertically and including shielding between each board while keeping the groundplanes of each board isolated from the enclosure. We plan to include a heater in the enclosure toallow temperature stabilization of the assembly to reduce amplifier drifts over time.
3. Outlook
We are currently assessing the performance of our prototype Q-meter, and initial results arepromising. We have measured enhanced proton signals in TEMPO-doped epoxy samples at 1 K,and the signal-to-noise achieved appears to exceed measurements made using our Liverpool Q-meters, not including the Yale amplification card. Tests of the overall linearity, temperature depen-dence and a comparison with Yale gain card capabilities are being prepared. We have also begunthe design of a bespoke ADC and DAC system to replace the National Instruments general purposeUSB data acquisition boards we current use to record the output of the Q-meters.
6
PoS(PSTP2019)051
New Q-meters for NMR Measurements James Maxwell
Our tests of the cold circuit NMR for 213 MHz protons have encountered several difficulties.In addition to being more susceptible to transmission line effects than 32.7 MHz deuterons, we haveencountered strong resonances in the frequency spectrum that are hard to predict. These resonancesshow up as large peaks that appear in the frequency spectrum when viewed over a large band asthe target is cooled below 20 K. In the narrow-band view of the Q-meter, these peaks make tuningthe circuit difficult as they are highly susceptible to thermal drifts inside the target cryostat. We arelikely seeing parallel resonances to ground changing with the temperature dependence of the cabledielectric. The small tuning capacitance (∼10 pF) required to tune at 213 MHz exacerbates thiseffect. We are proceeding to tests of the cold circuit layout with varactor diode tuning capacitorsat 32.7 MHz, where the lower thermal noise promised by this layout will be more valuable, andwhich we do not expect will suffer from the complications that have arisen at 213 MHz.
In addition to our work implementing a new Q-meter in the Liverpool style, we are inves-tigating an “all digital” method to perform these measurements. This method would rely uponfast ADCs to directly perform measurements of the 213 MHz signal rather than down mixing witha balanced ring modulator. We hope to have a proof-of-principle prototype to begin testing thistechnique late in 2020.
Hall B’s polarized target experiments are expected to commence in 2022, when our new Q-meter system should be ready to debut alongside the new CLAS12 horizontal DNP refrigerator [9].We do not anticipate that our existing Q-meter prototype boards will require significant alterationonce testing is complete, as they have operated well for several cool-downs.
Acknowledgements
We gratefully acknowledge the contributions of the members of the CLAS12 polarized targetcollaboration, especially the C. Keith and JLab Target Group, H. Dong and the JLab ElectronicsGroup, J. Pierce of ORNL, and V. Lagerquist of ODU. This material is based on work supportedby the U.S. Department of Energy, Office of Science, Office of Nuclear Physics under contractDE-AC05-06OR23177.
References
[1] D. G. Crabb and W. Meyer, Solid polarized targets for nuclear and particle physics experiments,Annual Review of Nuclear and Particle Science 47 (1997) 67.
[2] G. Court, D. Gifford, P. Harrison, W. Heyes and M. Houlden, A high precision q-meter for themeasurement of proton polarization in polarised targets, Nuclear Instruments and Methods in PhysicsResearch Section A 324 (1993) 433 .
[3] G. Court, M. Houlden, S. Bultmann, D. Crabb, D. Day, Y. Prok et al., High precision measurement ofthe polarization in solid state polarized targets using nmr, Nuclear Instruments and Methods inPhysics Research Section A 527 (2004) 253 .
[4] E. J. Veenendaal, R. Hulstman and H. B. Brom, A frequency-modulated q-meter for verylow-temperature nmr experiments, Journal of Physics E: Scientific Instruments 16 (1983) 649.
[5] J. Herick, Development of a new Q-meter module, in Proceedings, 16th International Workshop onPolarized Sources, Targets, and Polarimetry (PSTP 2015): Bochum, Germany, September 14-18,2015, vol. PSTP2015, p. 011, 2016, https://pos.sissa.it/243/011/pdf.
7

PoS(PSTP2019)051
New Q-meters for NMR Measurements James Maxwell
[6] MiniCircuits, “Double balanced mixer, https://www.minicircuits.com/pdfs/SRA-1-1+.pdf.”
[7] C. Keith, M. Anghinolfi, M. Battaglieri, P. Bosted, D. Branford, S. Bultmann et al., A polarized targetfor the clas detector, Nuclear Instruments and Methods in Physics Research Section A: Accelerators,Spectrometers, Detectors and Associated Equipment 501 (2003) 327 .
[8] J. D. Maxwell, NMR Measurements for Solid Polarized Targets at Jefferson Lab, PoS SPIN2018(2019) 102.
[9] J. Brock, 1 K Refrigerator for the CLAS12 Polarized Target: Design, Construction, and First Results,in These Proceedings, 2020.
[10] MiniCircuits, “Surface mount phase shifter, https://www.minicircuits.com/pdfs/SPHSA-251+.pdf.”
8