Embed Size (px)
Citation preview

Caving 2018 – Y Potvin and J Jakubec (eds) © 2018 Australian Centre for Geomechanics, Perth, ISBN 978-0-9924810-9-4
Caving 2018, Vancouver, Canada 407
Developing projects using CaveLogicTM
M Arancibia Maptek, Chile
F Soto Maptek, Chile
Abstract
This paper presents a new long-term planning software tool to develop projects exploited by mass caving methods. There are no easy to use applications currently available on the market. The software packages available commonly act as black boxes, are complex to use, and generally require highly specialised knowledge and training. The fundamental idea behind CaveLogicTM was to develop a friendly and intuitive tool, leaving aside the black boxes, to allow the user to concentrate on cave mine planning and not the software learning process. The application provides tools for the entire cycle from the block model deposit to the generation of long-term production plans.
CaveLogicTM integrates the possibility of generating footprints through a genetic algorithm, incorporating restrictions and caving parameters, as well as evaluating multiple scenarios such as multiple undercut level planning. CaveLogicTM enables the simulation of previously caved levels, allowing the planner to interactively modify the optimal solutions presented by the software. This paper involves a case study for a mining project planned for a fictitious mine transitioning from open pit to mining by caving, enhancing the management of large analysed nodes and block volumes.
CaveLogicTM uses an algorithm based on image processing and geomorphology applications, applying genetic algorithm guidelines. The algorithm accomplishes the commissioned task successfully and has a processing time per envelope in the order of seconds. The software includes tools to simulate previously caved sectors, and enables the mine engineer to interactively modify the solutions considered optimal by the software.
Keywords: caving, mine planning, software, genetic algorithm
1 Introduction
CaveLogicTM is a holistic software tool from MaptekTM designed to support the strategic planning of mining projects operated under caving methods. It was designed to be an easy to use model, with a quick learning curve, user customisation and enhanced objective traceability so the mine planning engineer can use their time and skills to find the best possible project, rather than setting up a model. This tool integrates the possibility of generating footprints through the genetic algorithm, incorporating the constraints and parameters of this type of mining and assessing multiple scenarios and plans with multiple caving levels.
The planning process is explained in different stages, opening the possibility of managing multiple scenarios. Figure 1 shows a typical process for a cave mining project, where a block model and topography are required as an entry point.
Figure 1 CaveLogic workflow
doi:10.36487/ACG_rep/1815_31_Arancibia
Developing projects using CaveLogicTM M Arancibia and F Soto
408 Caving 2018, Vancouver, Canada
Each component represents independent units, thus the composition of a group generates a specific project, enabling one to repeat some components in a scenario and create new ones as desired.
Within the planning process of a cave mining project, the value is directly associated with the definition of the economic envelope. The envelope for caving methods is complex to define as the model must incorporate the mixing process of the material with a high degree of uncertainty (Laubscher 2003), including rock mechanics constraints such as connection height, critical hydraulic radius, and maximum draw height governing this type of exploitation (Brown 2003), thus becoming a problem difficult to resolve through deterministic algorithms. There are several approximation algorithms leading to an acceptable solution through an efficient exploration of the solution space. The genetic algorithm is a method for solving optimisation problems based on the process of natural selection of biological evolution, exploring the solution space efficiently (Talbi 2009). The economic envelope problem boils down to, with precise block models, the creation of a series of algorithms that define blocks which maximise the return on the project and that, in turn, meet the series of constraints mentioned (Arcos Troncoso 2012).
2 Theory remarks
This section presents some theoretical principles for developing a caving project in CaveLogicTM, considering the basics for caving projects and the explanation of the envelope definition and scheduling algorithm.
2.1 Economic and dilution model
The economic model follows the guidelines for any kind of exploitation, but also includes the cost of development and repair of the infrastructure.
The process of gravitational flow is the dynamics of a set of particles, which are subjected to the interaction between gravity and forces arising from movement of these particles through the drawpoint. In caving methods, it is critical to know the flow of the particles forming the material being removed. This is because the determination of the exact moment in which the particle is in the extraction point helps in assessing the exact composition of material being extracted at a given period of time (Pierce 2010). This cannot be estimated through deterministic methods given the number of variables interfering with the gravitational flow, as well as the geological uncertainty of each of these variables (Vargas Vierling 2014). Therefore, different models were developed to approximate the trajectory of the particles.
The volumetric model is an empirical model designed by Heslop and Laubscher, which through a single parameter known as the entry point of dilution (PDE), tries to predict the composition of the mixed material for the whole life of the mine (Laubscher 1994).
2.2 Envelope defined by genetic algorithm
CaveLogicTM uses genetic algorithm guidelines as a framework for envelope definition, which is a method for solving optimisation problems based on the process of natural selection of biological evolution, exploring the solution space efficiently. The algorithm repeatedly modifies a population of individuals, where each represents a solution to the problem. At each iteration, the algorithm randomly selects individuals from the current population to produce children of the next generation. After several generations, the population evolves towards a solution considered optimal.
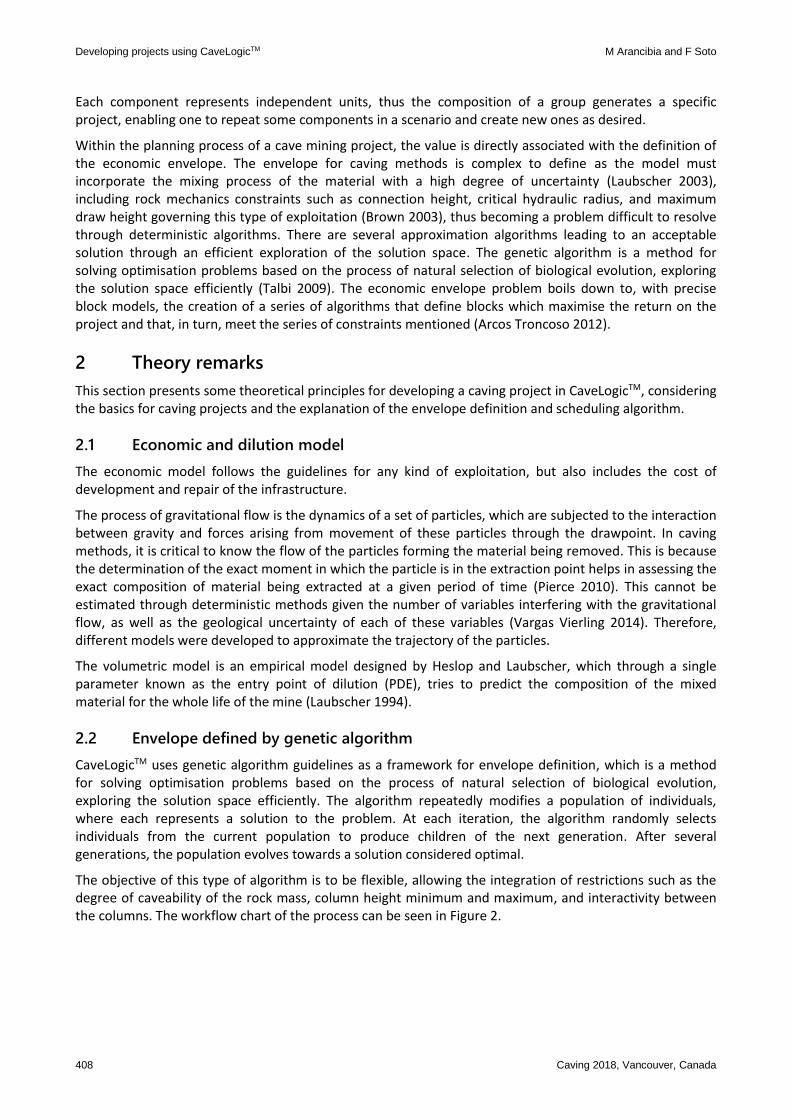
The objective of this type of algorithm is to be flexible, allowing the integration of restrictions such as the degree of caveability of the rock mass, column height minimum and maximum, and interactivity between the columns. The workflow chart of the process can be seen in Figure 2.
Mine planning
Caving 2018, Vancouver, Canada 409
Figure 2 Workflow used by the footprint definition algorithm used by CaveLogicTM
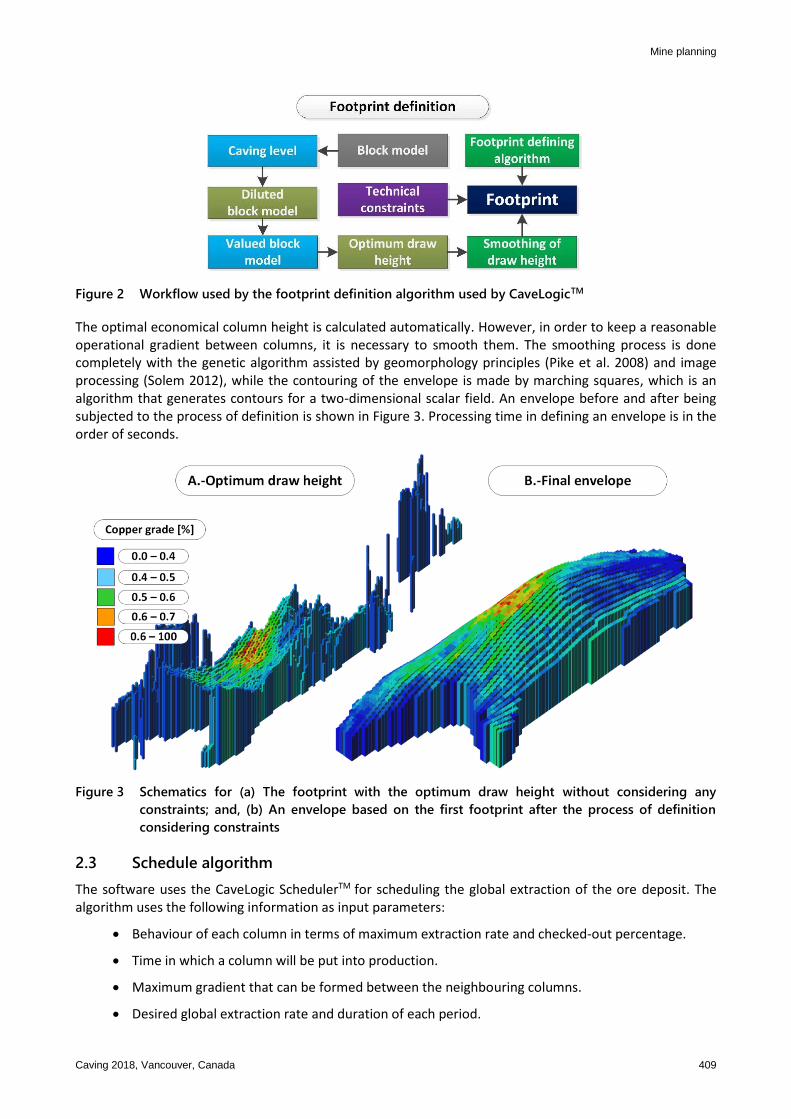
The optimal economical column height is calculated automatically. However, in order to keep a reasonable operational gradient between columns, it is necessary to smooth them. The smoothing process is done completely with the genetic algorithm assisted by geomorphology principles (Pike et al. 2008) and image processing (Solem 2012), while the contouring of the envelope is made by marching squares, which is an algorithm that generates contours for a two-dimensional scalar field. An envelope before and after being subjected to the process of definition is shown in Figure 3. Processing time in defining an envelope is in the order of seconds.
Figure 3 Schematics for (a) The footprint with the optimum draw height without considering any
constraints; and, (b) An envelope based on the first footprint after the process of definition
considering constraints
2.3 Schedule algorithm
The software uses the CaveLogic SchedulerTM for scheduling the global extraction of the ore deposit. The algorithm uses the following information as input parameters:
Behaviour of each column in terms of maximum extraction rate and checked-out percentage.
Time in which a column will be put into production.
Maximum gradient that can be formed between the neighbouring columns.
Desired global extraction rate and duration of each period.
Developing projects using CaveLogicTM M Arancibia and F Soto
410 Caving 2018, Vancouver, Canada
The algorithm takes as its main function the maximum tonnage that can be removed in a specific period in a column considering its current state.
𝑇𝑚𝑎𝑥 = ∫ 𝑓𝑑𝑟𝑎𝑤(𝑡)𝑑𝑡𝑡𝑒
𝑡𝑐 (1)
where:
𝑇𝑚𝑎𝑥 = maximum tonnage possible to extract in the current period.
𝑡𝑒 = extraction time plus current time in maximum extraction of the column.
𝑡𝑐 = current maximum extraction time of the column.
𝑓𝑑𝑟𝑎𝑤 = specific function of tonnage of a column in a period of time t.
The scheduling engine completes the following operations to develop a production plan, which satisfies the parameters and constraints in a specific time period:
Calculation of maximum possible extraction of active columns without considering draw control.
Identification of columns meeting the extraction criteria, to be extracted at the fastest possible rate.
The remaining columns will be subjected to analysis of total tonnes extracted to achieve draw control constraints.
The algorithm operates under an environment that allows a mass balance. This means, for instance, if a goal of production with only the columns that are in over-extraction is met, the engine will not extract from the other columns. The convergence time of the proposed algorithm is in the order of seconds.
3 Case study
The case study considered the development of a mining project transitioning from open pit to caving in order to mine remaining underground reserves, all based on fictitious data. The following sections show the methodology, characteristics of the fictitious deposit, details of the economic and dilution models plus the rock mechanics constraints, and finally the results of the developed project.
3.1 Methodology
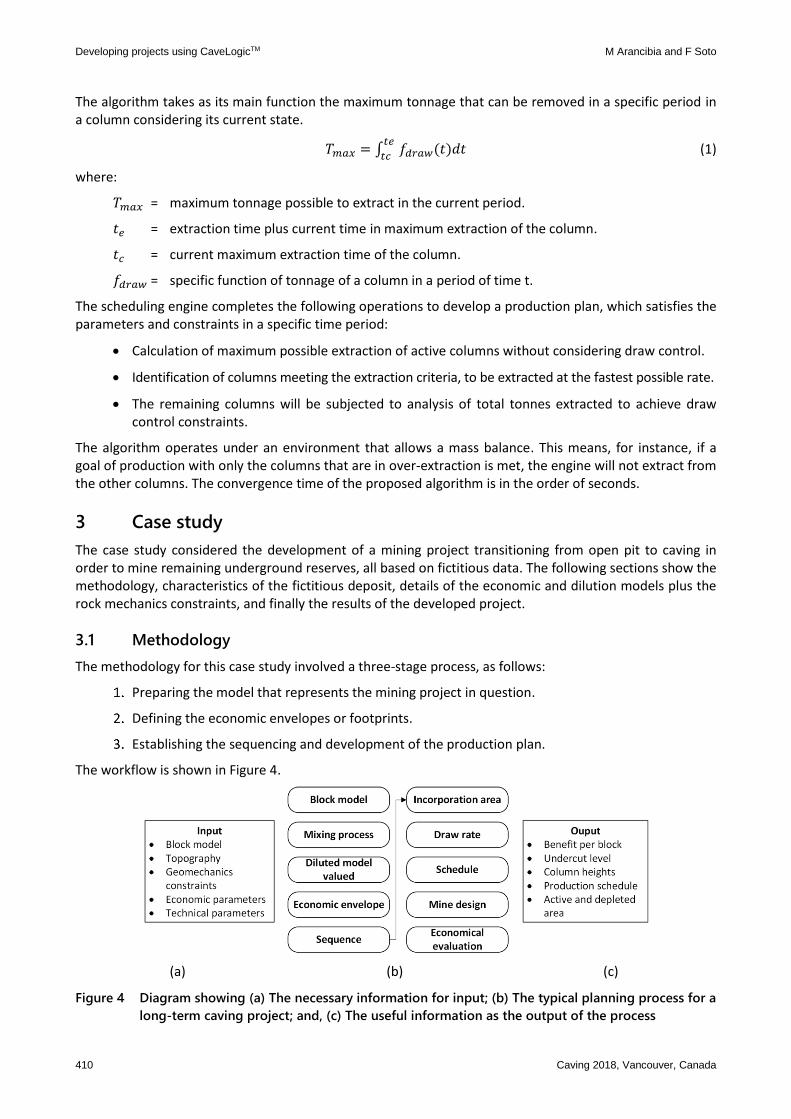
The methodology for this case study involved a three-stage process, as follows:
Preparing the model that represents the mining project in question.
Defining the economic envelopes or footprints.
Establishing the sequencing and development of the production plan.
The workflow is shown in Figure 4.
(a) (b) (c)
Figure 4 Diagram showing (a) The necessary information for input; (b) The typical planning process for a
long-term caving project; and, (c) The useful information as the output of the process
Mine planning
Caving 2018, Vancouver, Canada 411
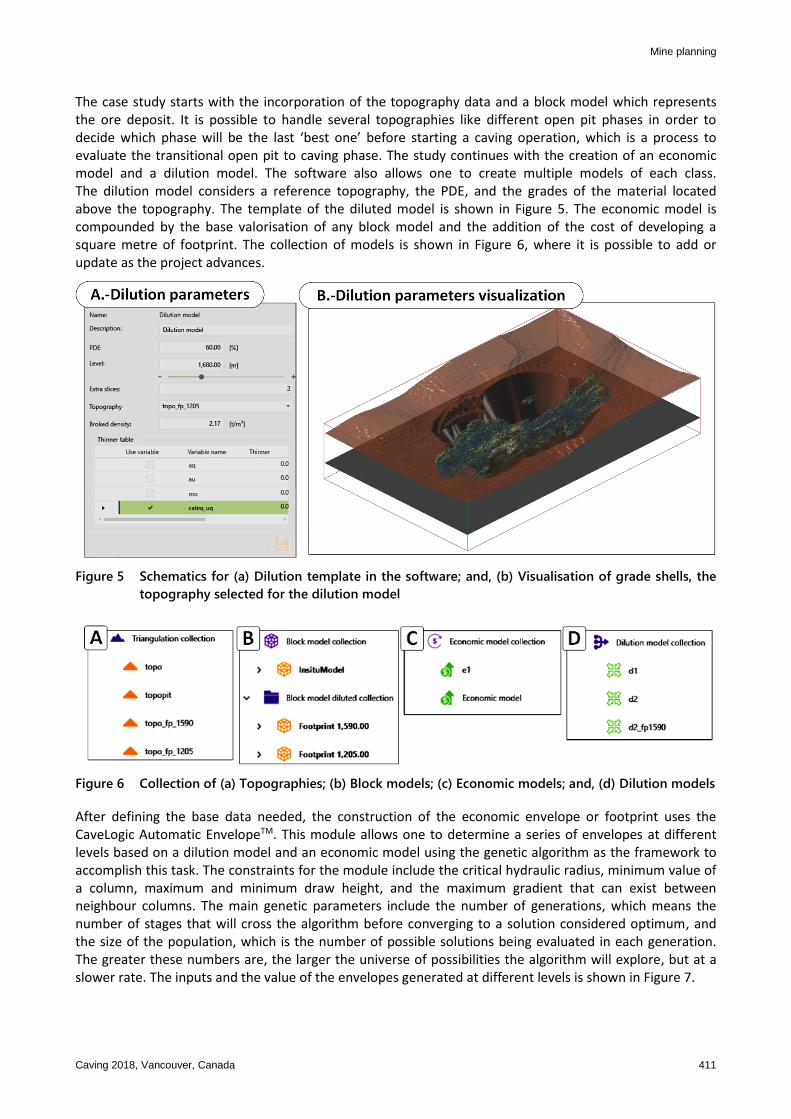
The case study starts with the incorporation of the topography data and a block model which represents the ore deposit. It is possible to handle several topographies like different open pit phases in order to decide which phase will be the last ‘best one’ before starting a caving operation, which is a process to evaluate the transitional open pit to caving phase. The study continues with the creation of an economic model and a dilution model. The software also allows one to create multiple models of each class. The dilution model considers a reference topography, the PDE, and the grades of the material located above the topography. The template of the diluted model is shown in Figure 5. The economic model is compounded by the base valorisation of any block model and the addition of the cost of developing a square metre of footprint. The collection of models is shown in Figure 6, where it is possible to add or update as the project advances.
Figure 5 Schematics for (a) Dilution template in the software; and, (b) Visualisation of grade shells, the
topography selected for the dilution model
Figure 6 Collection of (a) Topographies; (b) Block models; (c) Economic models; and, (d) Dilution models
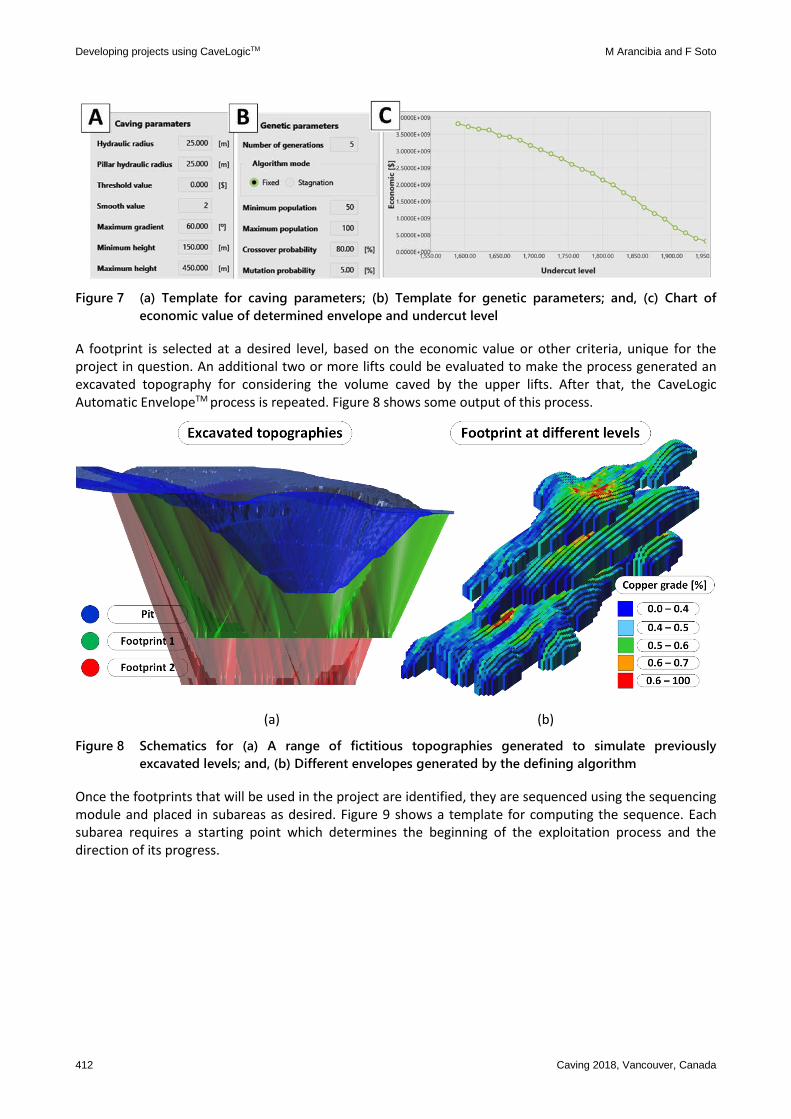
After defining the base data needed, the construction of the economic envelope or footprint uses the CaveLogic Automatic EnvelopeTM. This module allows one to determine a series of envelopes at different levels based on a dilution model and an economic model using the genetic algorithm as the framework to accomplish this task. The constraints for the module include the critical hydraulic radius, minimum value of a column, maximum and minimum draw height, and the maximum gradient that can exist between neighbour columns. The main genetic parameters include the number of generations, which means the number of stages that will cross the algorithm before converging to a solution considered optimum, and the size of the population, which is the number of possible solutions being evaluated in each generation. The greater these numbers are, the larger the universe of possibilities the algorithm will explore, but at a slower rate. The inputs and the value of the envelopes generated at different levels is shown in Figure 7.
Developing projects using CaveLogicTM M Arancibia and F Soto
412 Caving 2018, Vancouver, Canada
Figure 7 (a) Template for caving parameters; (b) Template for genetic parameters; and, (c) Chart of
economic value of determined envelope and undercut level
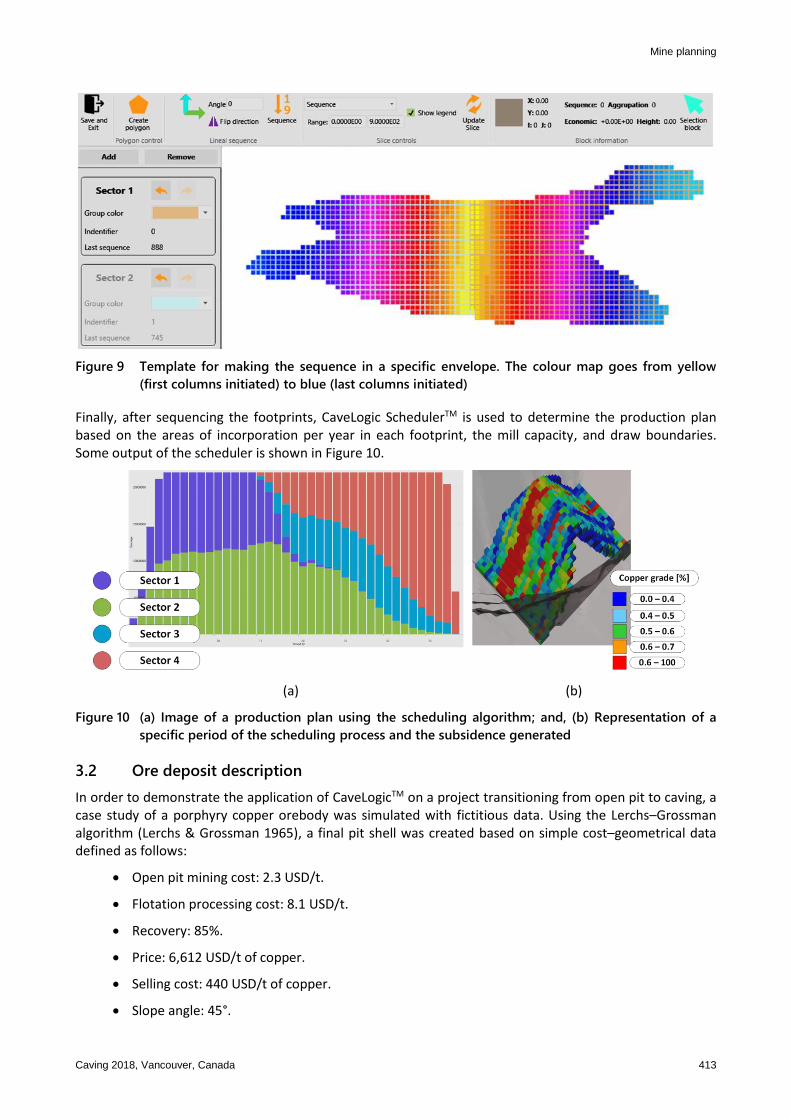
A footprint is selected at a desired level, based on the economic value or other criteria, unique for the project in question. An additional two or more lifts could be evaluated to make the process generated an excavated topography for considering the volume caved by the upper lifts. After that, the CaveLogic Automatic EnvelopeTM process is repeated. Figure 8 shows some output of this process.
(a) (b)
Figure 8 Schematics for (a) A range of fictitious topographies generated to simulate previously
excavated levels; and, (b) Different envelopes generated by the defining algorithm
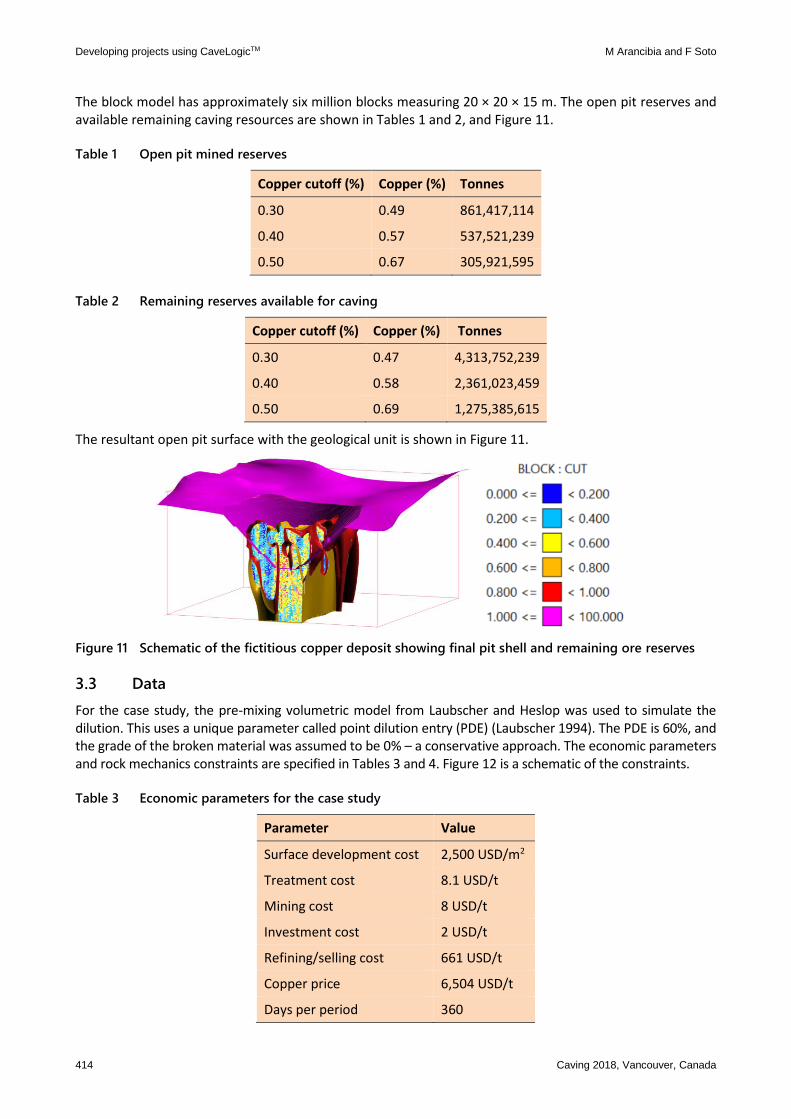
Once the footprints that will be used in the project are identified, they are sequenced using the sequencing module and placed in subareas as desired. Figure 9 shows a template for computing the sequence. Each subarea requires a starting point which determines the beginning of the exploitation process and the direction of its progress.
Mine planning
Caving 2018, Vancouver, Canada 413
Figure 9 Template for making the sequence in a specific envelope. The colour map goes from yellow
(first columns initiated) to blue (last columns initiated)
Finally, after sequencing the footprints, CaveLogic SchedulerTM is used to determine the production plan based on the areas of incorporation per year in each footprint, the mill capacity, and draw boundaries. Some output of the scheduler is shown in Figure 10.
(a) (b)
Figure 10 (a) Image of a production plan using the scheduling algorithm; and, (b) Representation of a
specific period of the scheduling process and the subsidence generated
3.2 Ore deposit description
In order to demonstrate the application of CaveLogicTM on a project transitioning from open pit to caving, a case study of a porphyry copper orebody was simulated with fictitious data. Using the Lerchs–Grossman algorithm (Lerchs & Grossman 1965), a final pit shell was created based on simple cost–geometrical data defined as follows:
Open pit mining cost: 2.3 USD/t.
Flotation processing cost: 8.1 USD/t.
Recovery: 85%.
Price: 6,612 USD/t of copper.
Selling cost: 440 USD/t of copper.
Slope angle: 45°.
Developing projects using CaveLogicTM M Arancibia and F Soto
414 Caving 2018, Vancouver, Canada
The block model has approximately six million blocks measuring 20 × 20 × 15 m. The open pit reserves and available remaining caving resources are shown in Tables 1 and 2, and Figure 11.
Table 1 Open pit mined reserves
Copper cutoff (%) Copper (%) Tonnes
0.30 0.49 861,417,114
0.40 0.57 537,521,239
0.50 0.67 305,921,595
Table 2 Remaining reserves available for caving
Copper cutoff (%) Copper (%) Tonnes
0.30 0.47 4,313,752,239
0.40 0.58 2,361,023,459
0.50 0.69 1,275,385,615
The resultant open pit surface with the geological unit is shown in Figure 11.
Figure 11 Schematic of the fictitious copper deposit showing final pit shell and remaining ore reserves
3.3 Data
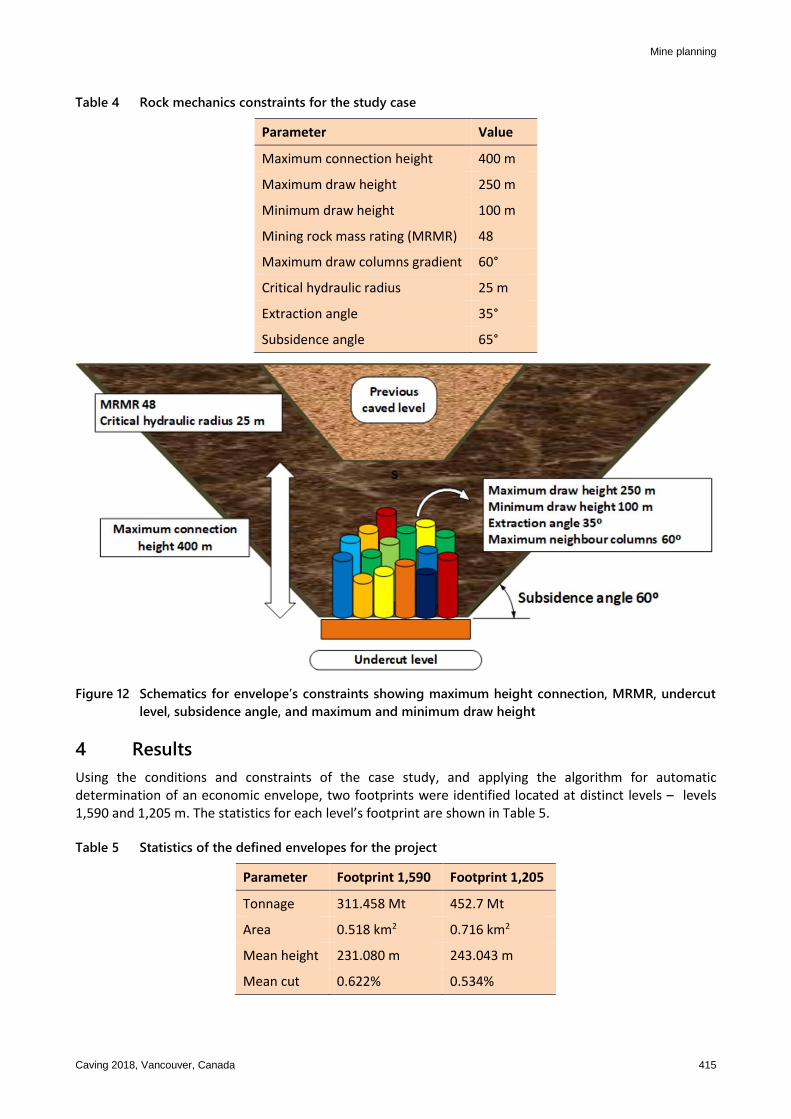
For the case study, the pre-mixing volumetric model from Laubscher and Heslop was used to simulate the dilution. This uses a unique parameter called point dilution entry (PDE) (Laubscher 1994). The PDE is 60%, and the grade of the broken material was assumed to be 0% – a conservative approach. The economic parameters and rock mechanics constraints are specified in Tables 3 and 4. Figure 12 is a schematic of the constraints.
Table 3 Economic parameters for the case study
Parameter Value
Surface development cost 2,500 USD/m2
Treatment cost 8.1 USD/t
Mining cost 8 USD/t
Investment cost 2 USD/t
Refining/selling cost 661 USD/t
Copper price 6,504 USD/t
Days per period 360
Mine planning
Caving 2018, Vancouver, Canada 415
Table 4 Rock mechanics constraints for the study case
Parameter Value
Maximum connection height 400 m
Maximum draw height 250 m
Minimum draw height 100 m
Mining rock mass rating (MRMR) 48
Maximum draw columns gradient 60°
Critical hydraulic radius 25 m
Extraction angle 35°
Subsidence angle 65°
Figure 12 Schematics for envelope’s constraints showing maximum height connection, MRMR, undercut
level, subsidence angle, and maximum and minimum draw height
4 Results
Using the conditions and constraints of the case study, and applying the algorithm for automatic determination of an economic envelope, two footprints were identified located at distinct levels – levels 1,590 and 1,205 m. The statistics for each level’s footprint are shown in Table 5.
Table 5 Statistics of the defined envelopes for the project
Parameter Footprint 1,590 Footprint 1,205
Tonnage 311.458 Mt 452.7 Mt
Area 0.518 km2 0.716 km2
Mean height 231.080 m 243.043 m
Mean cut 0.622% 0.534%
Developing projects using CaveLogicTM M Arancibia and F Soto
416 Caving 2018, Vancouver, Canada
4.1 Sequence results
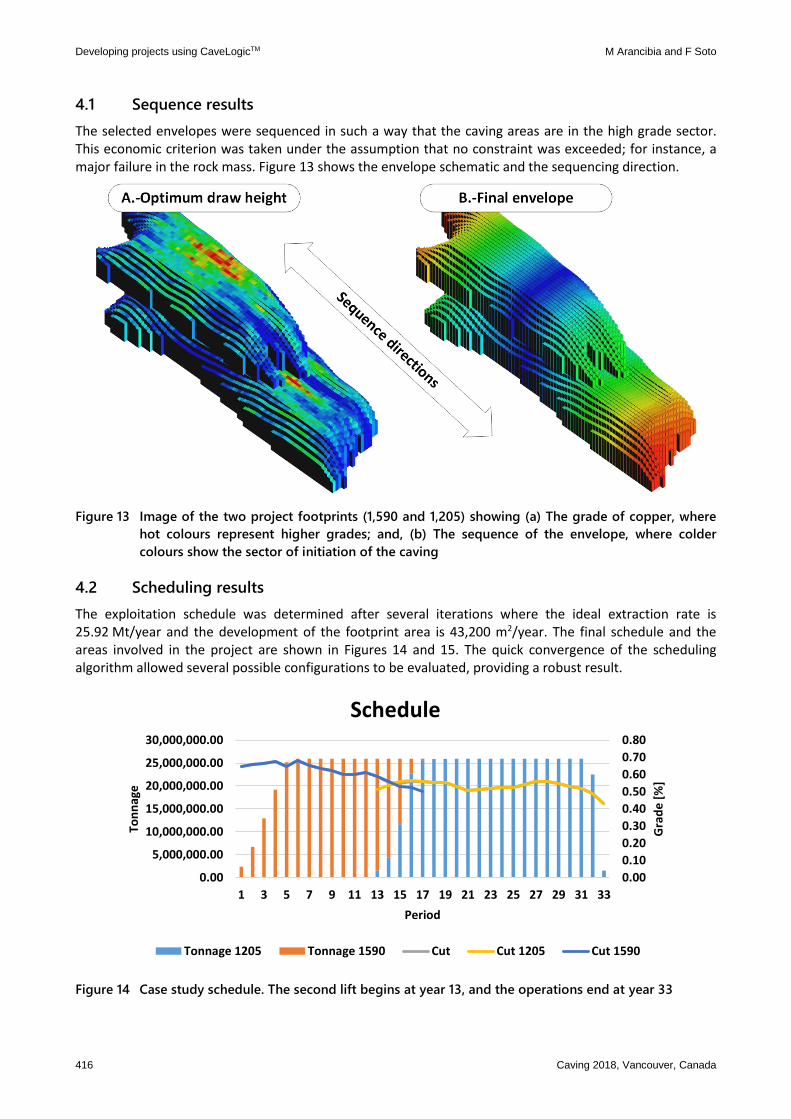
The selected envelopes were sequenced in such a way that the caving areas are in the high grade sector. This economic criterion was taken under the assumption that no constraint was exceeded; for instance, a major failure in the rock mass. Figure 13 shows the envelope schematic and the sequencing direction.
Figure 13 Image of the two project footprints (1,590 and 1,205) showing (a) The grade of copper, where
hot colours represent higher grades; and, (b) The sequence of the envelope, where colder
colours show the sector of initiation of the caving
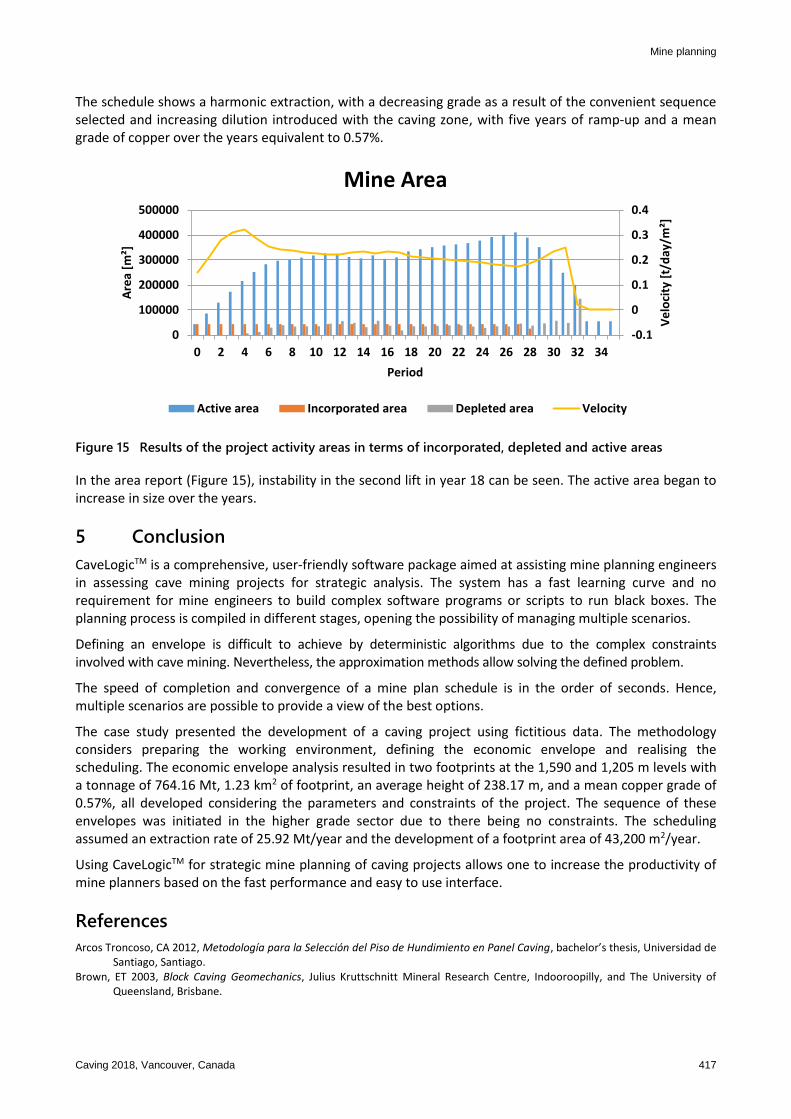
4.2 Scheduling results
The exploitation schedule was determined after several iterations where the ideal extraction rate is 25.92 Mt/year and the development of the footprint area is 43,200 m2/year. The final schedule and the areas involved in the project are shown in Figures 14 and 15. The quick convergence of the scheduling algorithm allowed several possible configurations to be evaluated, providing a robust result.
Figure 14 Case study schedule. The second lift begins at year 13, and the operations end at year 33
0.00
0.10
0.20
0.30
0.40
0.50
0.60
0.70
0.80
0.00
5,000,000.00
10,000,000.00
15,000,000.00
20,000,000.00
25,000,000.00
30,000,000.00
1 3 5 7 9 11 13 15 17 19 21 23 25 27 29 31 33
Gra
de
[%
]
Ton
nag
e
Period
Schedule
Tonnage 1205 Tonnage 1590 Cut Cut 1205 Cut 1590
Mine planning
Caving 2018, Vancouver, Canada 417
The schedule shows a harmonic extraction, with a decreasing grade as a result of the convenient sequence selected and increasing dilution introduced with the caving zone, with five years of ramp-up and a mean grade of copper over the years equivalent to 0.57%.
Figure 15 Results of the project activity areas in terms of incorporated, depleted and active areas
In the area report (Figure 15), instability in the second lift in year 18 can be seen. The active area began to increase in size over the years.
5 Conclusion
CaveLogicTM is a comprehensive, user-friendly software package aimed at assisting mine planning engineers in assessing cave mining projects for strategic analysis. The system has a fast learning curve and no requirement for mine engineers to build complex software programs or scripts to run black boxes. The planning process is compiled in different stages, opening the possibility of managing multiple scenarios.
Defining an envelope is difficult to achieve by deterministic algorithms due to the complex constraints involved with cave mining. Nevertheless, the approximation methods allow solving the defined problem.
The speed of completion and convergence of a mine plan schedule is in the order of seconds. Hence, multiple scenarios are possible to provide a view of the best options.
The case study presented the development of a caving project using fictitious data. The methodology considers preparing the working environment, defining the economic envelope and realising the scheduling. The economic envelope analysis resulted in two footprints at the 1,590 and 1,205 m levels with a tonnage of 764.16 Mt, 1.23 km2 of footprint, an average height of 238.17 m, and a mean copper grade of 0.57%, all developed considering the parameters and constraints of the project. The sequence of these envelopes was initiated in the higher grade sector due to there being no constraints. The scheduling assumed an extraction rate of 25.92 Mt/year and the development of a footprint area of 43,200 m2/year.
Using CaveLogicTM for strategic mine planning of caving projects allows one to increase the productivity of mine planners based on the fast performance and easy to use interface.
References
Arcos Troncoso, CA 2012, Metodología para la Selección del Piso de Hundimiento en Panel Caving, bachelor’s thesis, Universidad de Santiago, Santiago.
Brown, ET 2003, Block Caving Geomechanics, Julius Kruttschnitt Mineral Research Centre, Indooroopilly, and The University of Queensland, Brisbane.
-0.1
0
0.1
0.2
0.3
0.4
0
100000
200000
300000
400000
500000
0 2 4 6 8 10 12 14 16 18 20 22 24 26 28 30 32 34
Ve
loci
ty [
t/d
ay/m
²]
Are
a [m
²]
Period
Mine Area
Active area Incorporated area Depleted area Velocity

Developing projects using CaveLogicTM M Arancibia and F Soto
418 Caving 2018, Vancouver, Canada
Laubscher, D 1994, ‘Cave mining – the state of the art’, Journal of the South African Institute of Mining and Metallurgy, vol. 94, no. 10, pp. 279–293.
Laubscher, D 2003, Cave Mining Handbook, De Beers, Johannesburg. Lerchs, H & Grossman, I 1965, ‘Optimum design of open pit mines’, CIM Bulletin, vol. 58, no. 633, pp. 47–54. Pierce, ME 2010, A Model for Gravity Flow of Fragmented Rock in Block Caving Mines, PhD thesis, The University of Queensland,
Brisbane. Pike, RJ, Evans, IS & Hengl, T 2008, ‘Geomorphometry: a brief guide’, in T Hengl & H Reuter (eds), Geomorphometry: Concepts,
Software, Applications, Elsevier, Amsterdam. Solem, JE 2012, Programming Computer Vision with Python, O'Reilly Media, Sebastopol. Talbi, EG 2009, Metaheuristics: From Design to Implementation, John Wiley & Sons, Hoboken. Vargas Vierling, EA 2014, Cálculo Envolvente Económica para Minas de Caving Bajo Incertidumbre Geológica, MSc thesis,
Universidad de Chile, Santiago.