Embed Size (px)
Citation preview

Webinar Series sponsored by
Developing QC PlansThermo Fisher ScientificDeveloping QC PlansPart 4. Mitigating Risk with an
Individualized QC PlanJames O WestgardJames O. WestgardSten A. WestgardWestgard QC IncWestgard QC, Inc.
Madison, WIwwwwestgard comwww.westgard.com
1

Webinar Series sponsored by Thermo Fisher Scientific
September 17. Regulatory requirements and strategic approachOctober 8. Right‐sizing SQC procedures using “Westgard Sigma Rules”November 12. Performing a risk assessment to identify hazards and target failure modesy gDecember 10. Mitigating risk with an Individualized QC PlanIndividualized QC Plan
2

Part 4. Mitigating Risk with an di id li d l ( )Individualized QC Plan (IQCP)
– Describe approaches for mitigating risk in theDescribe approaches for mitigating risk in the medical laboratory
– Assess important capabilities of controlsp p– Identify a control – Repeat Patient Test, RPT – that can be implemented in POC applications
• Describe use for monitoring operator variability, bias, and lot to lot reagent changes
– Illustrate the structure for a QC Plan– Review approach and strategies
3

Review of Plan for Developing QC Plans
Validate Safety Characteristics
Yes No
Audit QC Practices
Determine Sigma Quality
Analyze2 levels of
controls/day?
DevelopTotal QC Plan
w/Right‐Sized SQC
DevelopRisk‐BasedIQC Plan
Monitor Quality & Patient Safety
4
Improve Quality & Safety
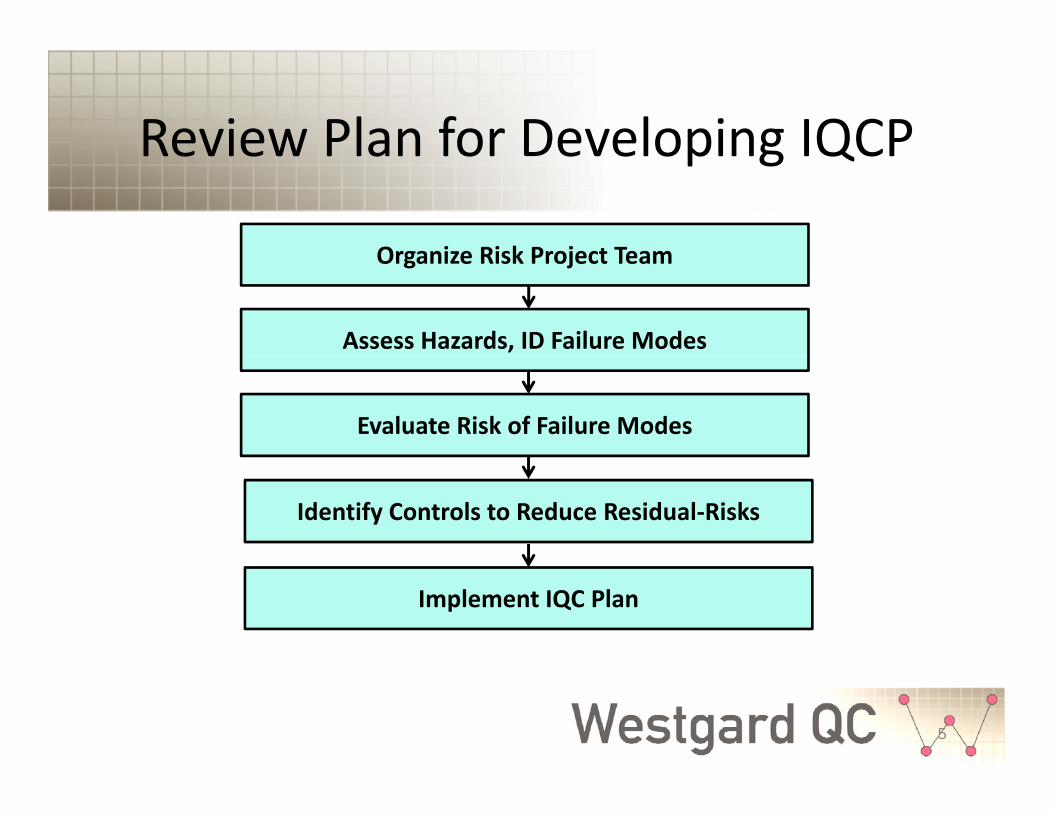
Review Plan for Developing IQCPReview Plan for Developing IQCP
Organize Risk Project TeamOrganize Risk Project Team
Assess Hazards, ID Failure Modes
Evaluate Risk of Failure Modes
Identify Controls to Reduce Residual‐Risks
Implement IQC Plan
5
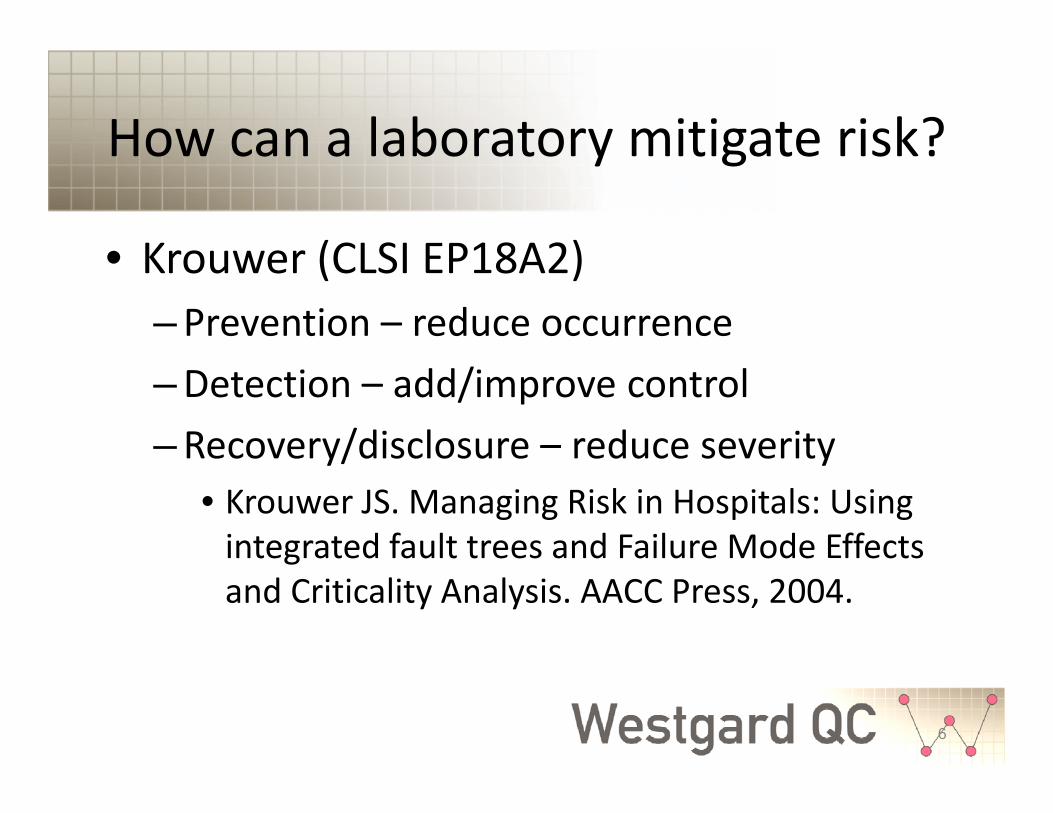
How can a laboratory mitigate risk?How can a laboratory mitigate risk?
• Krouwer (CLSI EP18A2)• Krouwer (CLSI EP18A2)–Prevention – reduce occurrence–Detection – add/improve control–Recovery/disclosure – reduce severityRecovery/disclosure reduce severity
• Krouwer JS. Managing Risk in Hospitals: Using integrated fault trees and Failure Mode Effects gand Criticality Analysis. AACC Press, 2004.
6

OccurrenceEliminate, Prevent, Reduce
• Main emphasis of The Joint Commission• Main emphasis of The Joint Commission “proactive risk reduction” methodology
B t f l ti difi ti f– But, for analytic processes, modification of methods is not advised because method then becomes “highly complex”becomes highly complex
– However, the lab can modify and improve pre‐analytic and post‐analytic processesanalytic and post analytic processes
• Validation of safety characteristics essential for mitigating analytic risksfor mitigating analytic risks
7

Risk Mitigation Strategies for the Medical Laboratory
(3) Recovery/disclosure(1)Occurrence Validate safety characteristics Specify corrective actions
Specify safety informationValidate safety characteristics
Calculate sigma-metrics
(2) Detection Right-size SQC procedures
Prioritize control mechanisms(4) QC Plan
Evaluate residual riskAssess practicality/reliability
Specify frequencyDocument plan
Implement controls
8

Improve DetectionImprove Detection
• Main emphasis of CLSI EP23 guidance• Main emphasis of CLSI EP23 guidance–Development of Risk‐based QC Plan–Recommends possible control mechanisms in “QC Toolbox”• Analyst/operator controls• Manufacturer’s built‐in controls• Stable control materials• Patient samples for control
9
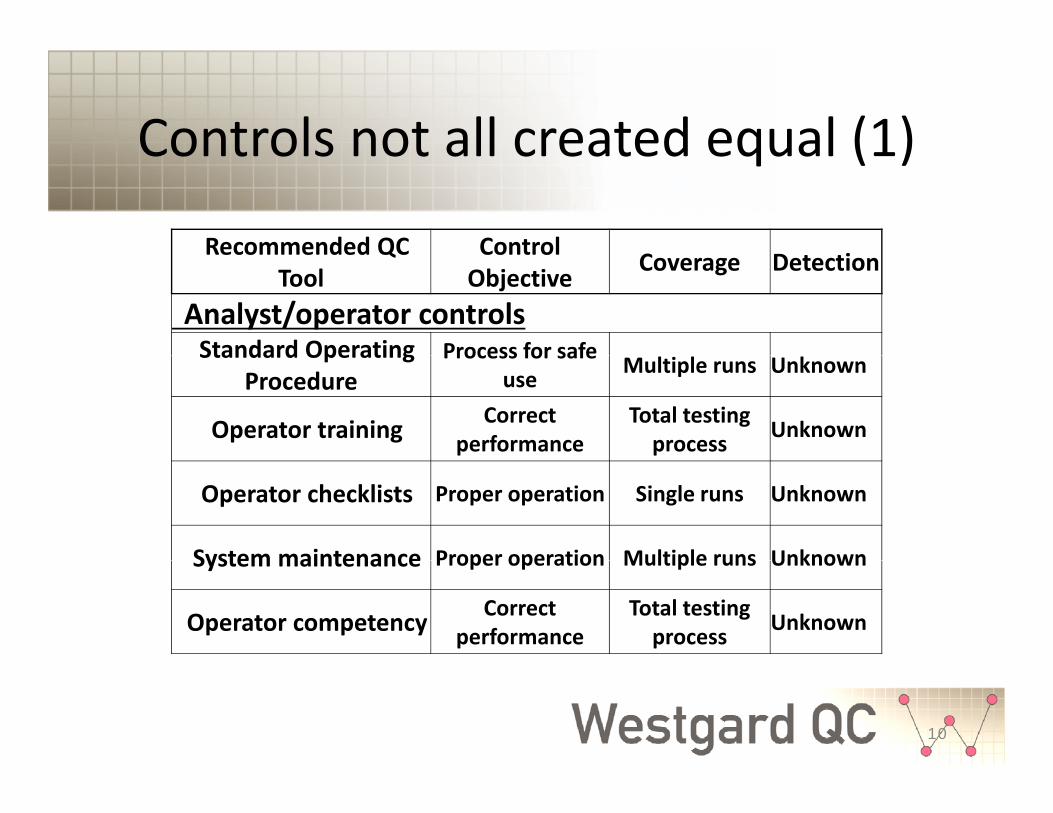
Controls not all created equal (1)Controls not all created equal (1)
Recommended QC ControlRecommended QC Tool
Control Objective Coverage Detection
Analyst/operator controlsStandard Operating Process for safeStandard Operating
ProcedureProcess for safe
use Multiple runs Unknown
Operator training Correct performance
Total testing process Unknown
Operator checklists Proper operation Single runs Unknown
System maintenance Proper operation Multiple runs UnknownSystem maintenance Proper operation Multiple runs Unknown
Operator competency Correct performance
Total testing process Unknown
10

Controls not all created equal (2)Controls not all created equal (2)Recommended QC Control Coverage Detection
Built‐in analyzer controlsElectronic checks Analyzer Single runs Unknown
Tool Objective Coverage Detection
Electronic checks components Single runs Unknown
Function tests Analyzer components Single runs Unknown
P t t P Si l l U kProcess tests Process steps Single samples Unknown
Calibration checks Analyzer stability Single runs Unknown
Integrated controls Analyzer stability Single runs Unknown
11

Controls not all created equal (3)Controls not all created equal (3)
Stable control materials
Recommended QC Tool
Control Objective Coverage Detection
Statistical QC Method stability Single runs Known
SQC with peer Method stability Multiple runs Unknown
comparisonMethod stability Multiple runs Unknown
Periodic EQA, PT Method accuracy Multiple runs Unknown
Trueness controls Method accuracy Multiple runs Unknown
12

Controls not all created equal (4)Controls not all created equal (4)
Patient data controls
Recommended QC Tool
Control Objective Coverage Detection
Patient data controlsImplausible values Random errors Single patients Knowable
Delta checks Random errors Single patients KnowableCorrelationCorrelation algorithms Random errors Single patients Knowable
Repeat patient testsShort‐term stability Single runs Knowable
Population statisticsLong‐term stability Single runs Knowable
13

Selection of Controls (1)Selection of Controls (1)
• DetectionDetection– Known or unknown? – Can you validate that manufacturer’s– Can you validate that manufacturer s control works?
– Low moderate or high detection?Low, moderate, or high detection?
• PrioritySi t t– Sigma strategy
– Low, moderate, highM i QC Mi i QC– Maximum QC to Minimum QC
14

Selection of Analytic Controls b d Si (2)
Control Mechanisms Sigma>5.5 Sigma 3.5‐5.5 Sigma<3.5Analytic operator controlsSt d d O ti P d Hi h Hi h Hi h
based on Sigma (2)Standard Operating Procedure High High HighOperator training High High HighOperator checklists High High HighSystem maintenance High High HighOperator competency High High High
Analytic test system controlsReagent storage & expiration Low Medium HighSample acceptability High High HighElectronic checks Low Medium HighFunction tests Low Medium HighFunction tests Low Medium HighProcess tests Low Medium HighCalibration checks Low Medium HighStatistical QC High High HighTrueness controls Low Low LowProficiency testing Regulatory Regulatory Regulatoryy g g y g y g yAnalytic test review controlsLimit checks High High HighImplausible values High High HighRepeat patient tests (RPT) Low Medium HighDelta checks Low Medium High
15
Correlation algorithms Low Medium HighPatient population algorithms Low Medium High

Selection of Controls (3)Selection of Controls (3)
• Practicalityy– How implement? – Manual or ComputerManual or Computer
• ReliabilityHo dependable and effe ti e?– How dependable and effective?
• Effort– How difficult to implement and perform?– Additional materials, training, procedures
16
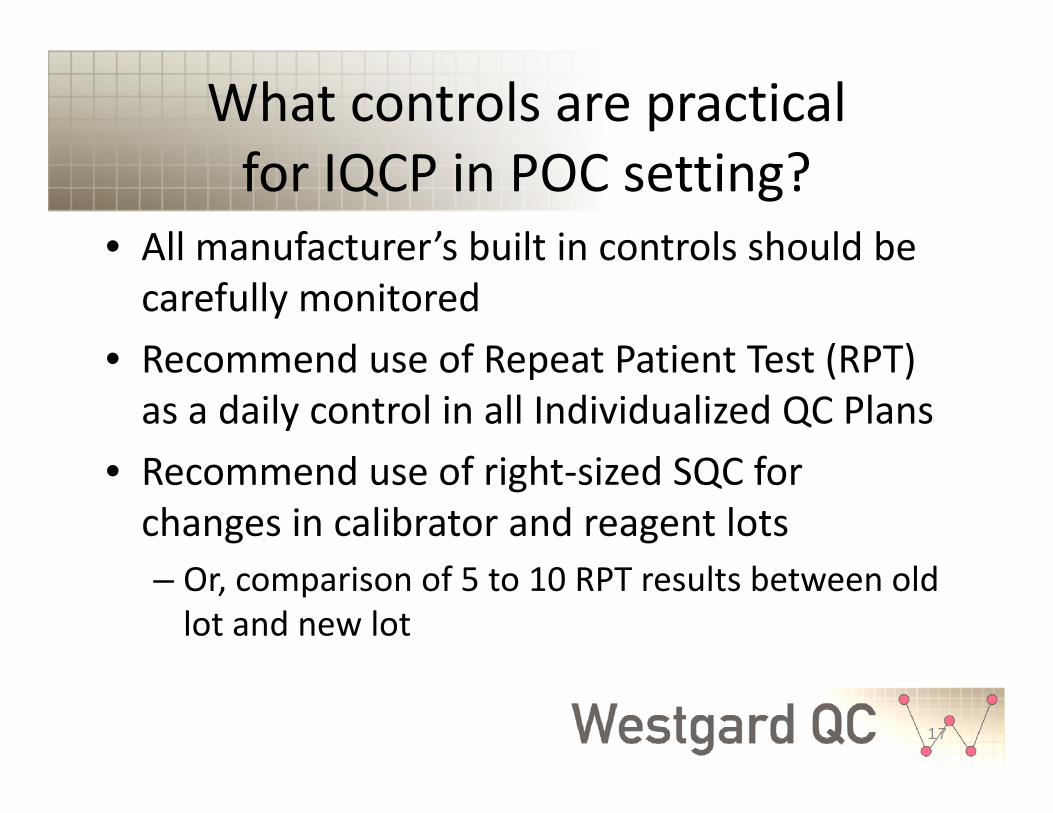
What controls are practical for IQCP in POC setting?
• All manufacturer’s built in controls should beAll manufacturer s built in controls should be carefully monitored
• Recommend use of Repeat Patient Test (RPT)• Recommend use of Repeat Patient Test (RPT) as a daily control in all Individualized QC PlansR d f i h i d SQC f• Recommend use of right‐sized SQC for changes in calibrator and reagent lots– Or, comparison of 5 to 10 RPT results between old lot and new lot
17

“Repeat Patient Test” Control (RPT)Repeat Patient Test Control (RPT)
• Advantage ‐makes use of original patientAdvantage makes use of original patient sample and Standard Operating Procedure– Monitor operator variability– Monitor operator variability
• Same operator repeats same patient test• Different operator repeats patient testDifferent operator repeats patient test
– Monitor bias vs another method• POC test vs Reference Lab test (inaccuracy, bias)( y, )
– Evaluate reagent lot to lot changes
18

How implement RPT control?How implement RPT control?
• Analyze patient samples in duplicateAnalyze patient samples in duplicate– Repeat 1 sample per day for 20 daysBest if that patient is near “normal” so can find a– Best if that patient is near normal so can find a similar patients to repeat each day
• Expect that the difference between the duplicateExpect that the difference between the duplicate analyses will increase as concentration increases
– Could also repeat “abnormal” patients to gather more information on the variability and bias of test results, but start with “normals”
19

Qualitative Data Analysis for RPTQualitative Data Analysis for RPT
• Obtain results of RPT from 20 day studyObtain results of RPT from 20 day study– Tabulate results of duplicatesCalculate the average of duplicates– Calculate the average of duplicates
– Calculate the difference between duplicatesG h diff lt t h– Graph differences vs average results to see how RPT varies with concentrationGraphically estimate “control limits” that are– Graphically estimate control limits that are expected to contain at least 95% of results
20
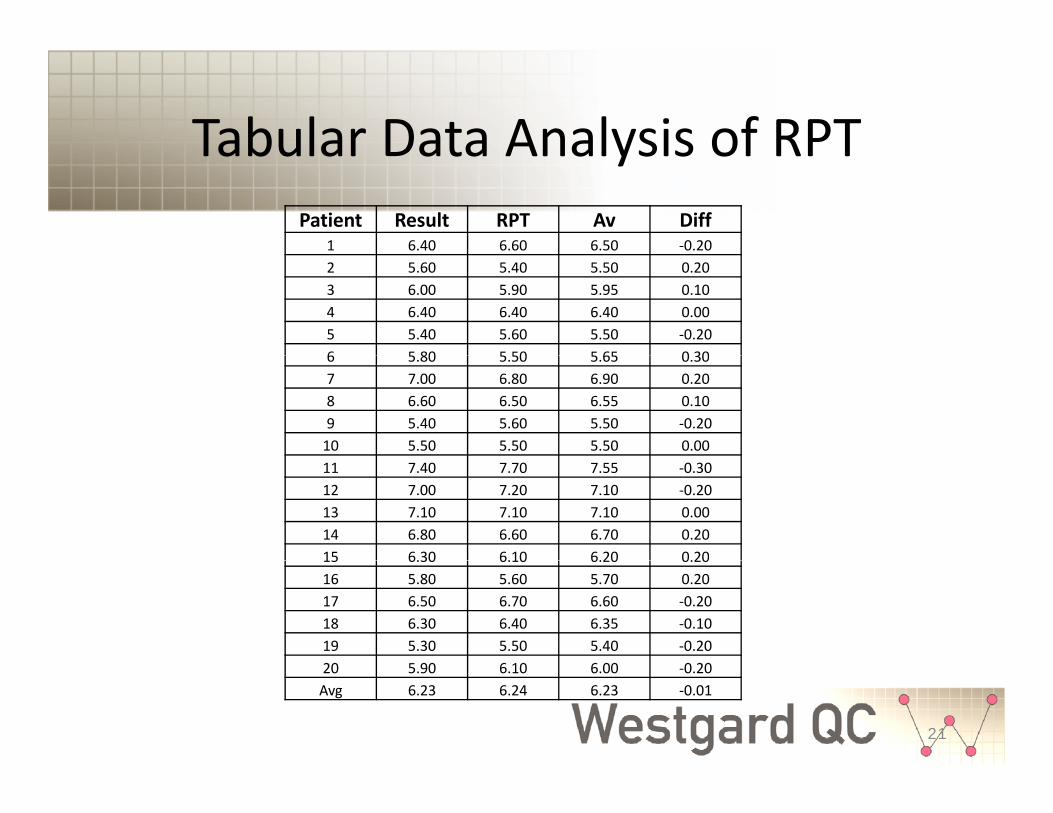
Tabular Data Analysis of RPTTabular Data Analysis of RPTPatient Result RPT Av Diff
1 6.40 6.60 6.50 ‐0.202 5.60 5.40 5.50 0.203 6.00 5.90 5.95 0.104 6.40 6.40 6.40 0.005 5.40 5.60 5.50 ‐0.206 5 80 5 50 5 65 0 306 5.80 5.50 5.65 0.307 7.00 6.80 6.90 0.208 6.60 6.50 6.55 0.109 5.40 5.60 5.50 ‐0.2010 5.50 5.50 5.50 0.0011 7.40 7.70 7.55 ‐0.3012 7.00 7.20 7.10 ‐0.2013 7.10 7.10 7.10 0.0014 6.80 6.60 6.70 0.2015 6.30 6.10 6.20 0.2015 6.30 6.10 6.20 0.2016 5.80 5.60 5.70 0.2017 6.50 6.70 6.60 ‐0.2018 6.30 6.40 6.35 ‐0.1019 5.30 5.50 5.40 ‐0.2020 5 90 6 10 6 00 0 20
21
20 5.90 6.10 6.00 ‐0.20Avg 6.23 6.24 6.23 ‐0.01

Graphical Data Analysis of RPT
0.50
Plot Difference vs Average
0 20
0.30
0.40
0.50
0.00
0.10
0.20
5.00 5.50 6.00 6.50 7.00 7.50 8.00eren
ce
‐0.30
‐0.20
‐0.10
Dif
fe
‐0.50
‐0.40
Average of Duplicates
22
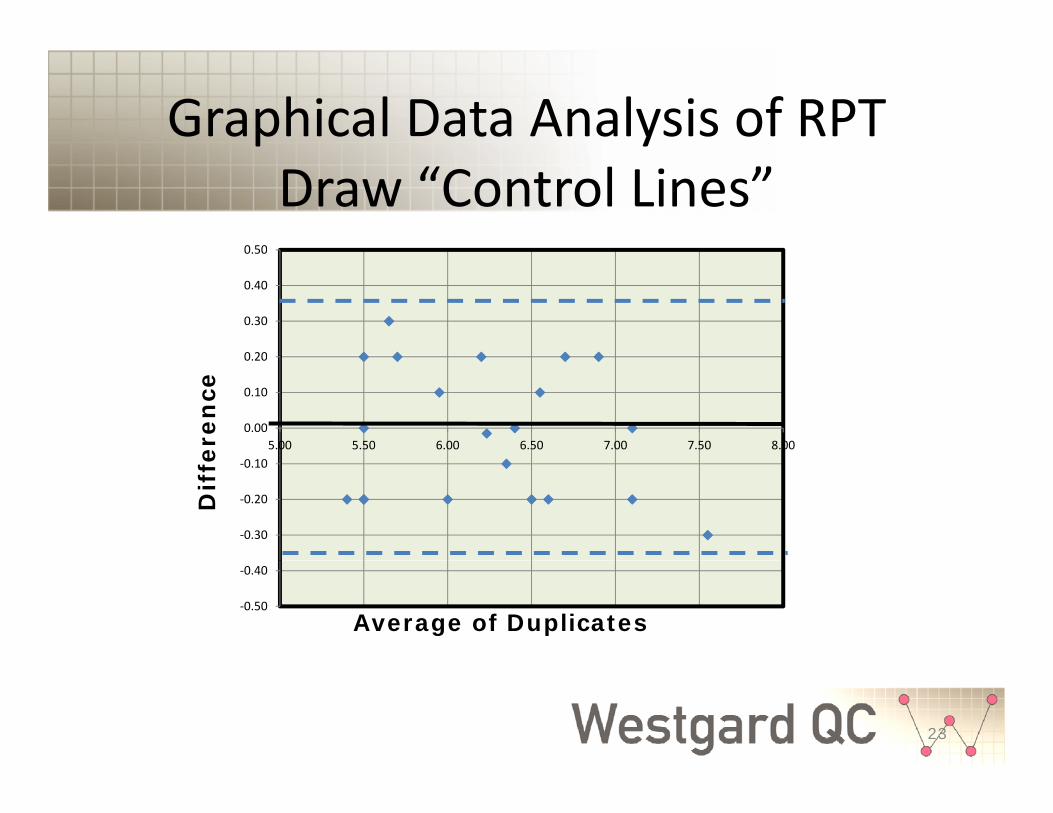
Graphical Data Analysis of RPT
0.50
Draw “Control Lines”
0 20
0.30
0.40
0.50
0.00
0.10
0.20
5.00 5.50 6.00 6.50 7.00 7.50 8.00eren
ce
‐0.30
‐0.20
‐0.10
Dif
fe
‐0.50
‐0.40
Average of Duplicates
23

RPT Control Chart for Monitoring Operator Variability
• Scale y‐axis so that “control limits” areScale y axis so that control limits are approximately 1/2 to 2/3 of maximum
• Scale x axis for 20 to 30 days or other• Scale x‐axis for 20 to 30 days, or other appropriate time period based on how often test is runtest is run
• Plot daily difference between duplicates vs the d bday or run number
• Identify cases where daily difference exceeds expected variation
24

Example Control ChartExample Control Chart
HbA1c RPT Control Chart
0.30
0.40
0.50Dif
0.00
0.10
0.20fer
‐0.30
‐0.20
‐0.10enc
‐0.50
‐0.40
0 5 10 15 20
e
D a y o r R u n
25
y

RPT Data Analysis for Assessing Bias vs Reference Lab
• RPT control can be used to compare resultsRPT control can be used to compare results with “reference” lab (other method, other lab)– 1st patient measurement at POC– 1 patient measurement at POC– 2nd patient measurement at reference lab
Sh ld i l d “ b l” t t lt• Should include “abnormal” test results• Data analysis same as “Bland‐Altman” plot for comparison of methods experiment
• Reference lab may perform these calculations in support of POC lab
26

RPT Control POC vs Ref LabRPT Control POC vs Ref LabPatient POC RefLab Avg Diff
1 6 40 6 50 6 45 0 101 6.40 6.50 6.45 ‐0.102 5.60 5.30 5.45 0.303 8.50 8.80 8.65 ‐0.304 9.40 9.10 9.25 0.305 5.40 5.50 5.45 ‐0.106 5 80 5 40 5 60 0 406 5.80 5.40 5.60 0.407 7.00 6.70 6.85 0.308 7.60 7.40 7.50 0.209 8.40 8.00 8.20 0.4010 5.50 5.40 5.45 0.1011 7.40 7.60 7.50 ‐0.2011 7.40 7.60 7.50 0.2012 7.00 7.10 7.05 ‐0.1013 9.10 9.10 9.10 0.0014 7.80 7.50 7.65 0.3015 6.30 6.00 6.15 0.3016 5.80 5.30 5.55 0.506 5 80 5 30 5 55 0 5017 8.51 8.70 8.61 ‐0.1918 6.30 6.40 6.35 ‐0.1019 5.90 5.90 5.90 0.0020 9.00 9.30 9.15 ‐0.30
AVG 7.14 7.05 7.09 0.09ObservedBias
27
AVG 7.14 7.05 7.09 0.09 Bias

Bland‐Altman PlotPOC vs Ref Lab
HbA1c Bland‐Altman Plot
0.30
0.40
0.50
Dif
HbA1c Bland Altman Plot
0 10
0.00
0.10
0.20ffer
ObservedBias
‐0.40
‐0.30
‐0.20
‐0.10ence
‐0.505.00 5.50 6.00 6.50 7.00 7.50 8.00 8.50 9.00 9.50 10.00
Average of POC & Ref Lab Results
28

RPT Controls forEvaluating Lot to Lot Changes
• “A laboratory must assume the possibility of y p ynoncommutability (of control materials) and use a set of patient samples measured by p p yusing both reagent lots to verify consistency of patient results between the reagent lots.”p g– Miller WG et al. Commutability limitations influence quality control results with different q yreagent lots. Clin Chem 2011;57:76‐83.
– Compared 5 to 10 patient repeats between reagent lots within 2‐4 hour period
29

Evaluating Lot to Lot ChangesEvaluating Lot to Lot Changes
• CLSI EP26A provides detailed methodology for p gy“User Evaluation of Between‐Reagent Lot Variation”• Provides tables for sample size and probability of error
detection for defined “Critical Difference” (CD)• Critical Difference defined by TEa in examples, but better
to consider CD=0.5*TEa• Decision criterion may be set as 0 6 times CD or• Decision criterion may be set as 0.6 times CD or
0.6*0.5*TEa or 0.3*TEa to provide 90% detection of bias for methods performing at 3 to 5 sigma
• 5 to 10 patient samples required 30

RPT Evaluation of Lot to Lot Changes
• Analyze 5 to 10 patients using both old and new y p glots (reagents, calibrators, cartridges)
• Calculate difference for new minus oldCalculate difference for new minus old• Calculate average of two results
l l diff i f bi• Calculate average difference as estimate of bias– If bias ≥ 0.3*TEa (CLSI EP26A criterion), new reagent l d f l d ff llot provides significantly different patient results
• Can also plot differences vs averages (Bland‐Altman Plot)
31
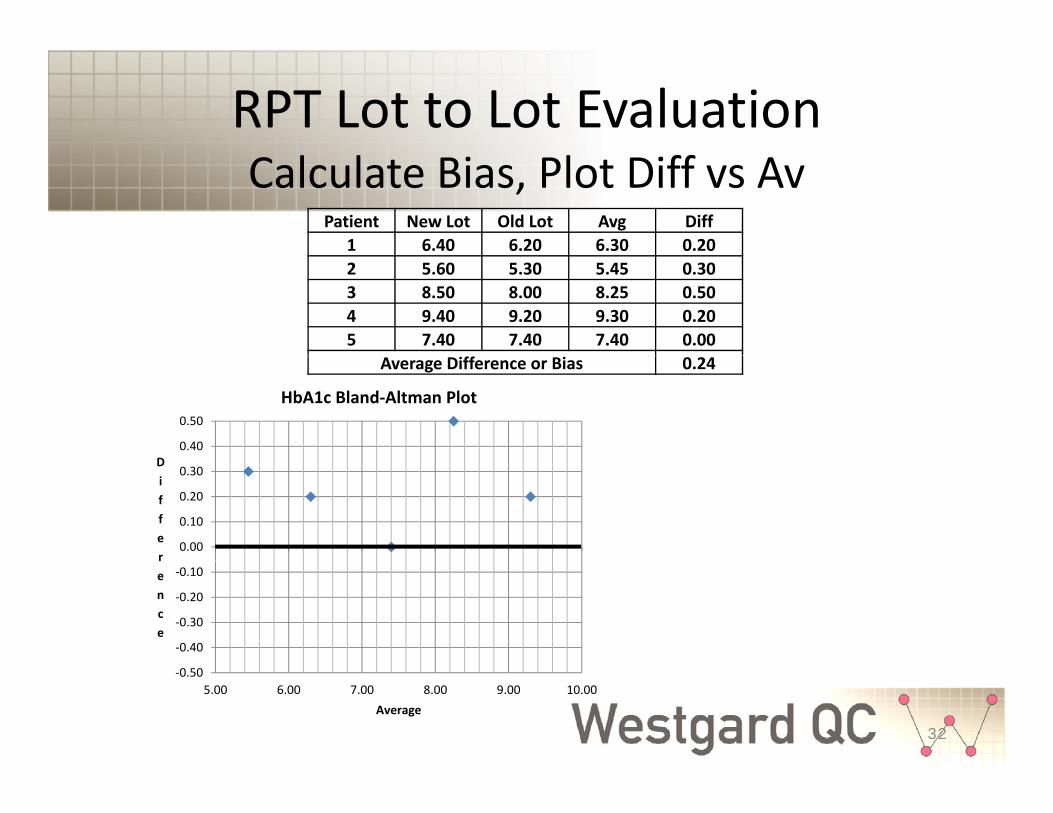
RPT Lot to Lot EvaluationCalculate Bias, Plot Diff vs Av
Patient New Lot Old Lot Avg Diff1 6.40 6.20 6.30 0.202 5.60 5.30 5.45 0.303 8.50 8.00 8.25 0.504 9.40 9.20 9.30 0.205 7.40 7.40 7.40 0.00
Average Difference or Bias 0.24
0.40
0.50
D
HbA1c Bland‐Altman Plot
0.00
0.10
0.20
0.30Differ
‐0.40
‐0.30
‐0.20
‐0.10rence
32
‐0.505.00 6.00 7.00 8.00 9.00 10.00
Average

RPT Lot to Lot EvaluationDraw “Bias Line”, Apply EP26A Criterion
Patient New Lot Old Lot Avg Diff1 6.40 6.20 6.30 0.202 5.60 5.30 5.45 0.303 8.50 8.00 8.25 0.504 9.40 9.20 9.30 0.205 7.40 7.40 7.40 0.00
Average Difference or Bias 0.24
0.40
0.50
D
HbA1c Bland‐Altman Plot
0.3*TEa @ 7%Hb is 0 3*0 06*7 0
0.00
0.10
0.20
0.30Differ is 0.3*0.06*7.0
or 0.13 %Hb
‐0.40
‐0.30
‐0.20
‐0.10rence
33
‐0.505.00 6.00 7.00 8.00 9.00 10.00
Average
Usefulness of RPT Controlfor POC and IQCP
• Practical in POC setting because makes use ofPractical in POC setting because makes use of patient sample and Standard Operating ProcedureProcedure
• Multiple usesM it i bilit f t– Monitor variability of operators
– Assess bias vs reference laboratoryl h f l– Evaluate change of reagent lots
• Simple calculations and graphic tools
34

Assemble Controls and Specify Frequency of QC
QC Plan FrequencyAnalyst/operator controls
Standard Operating Procedure Yearly SOP reviewOperator training Every operatorOperator checklists Daily
f h d lSystem maintenance Manuf. ScheduleOperator competency Yearly
Pre‐analytic controlsSample stability Each sample
Analytic controlsAnalytic controlsSample Acceptability Manuf, each sample
Built‐in controls Manuf.RPT1 operator DailyRPT1 Ref Lab 2/Week
RepeatPatient
RPT5‐10 Reagent Lot Each Reagent Lot changeProficiency Testing 3/year
Post‐analytic controlsMonitor Turn‐Around Time Each test
Test
35
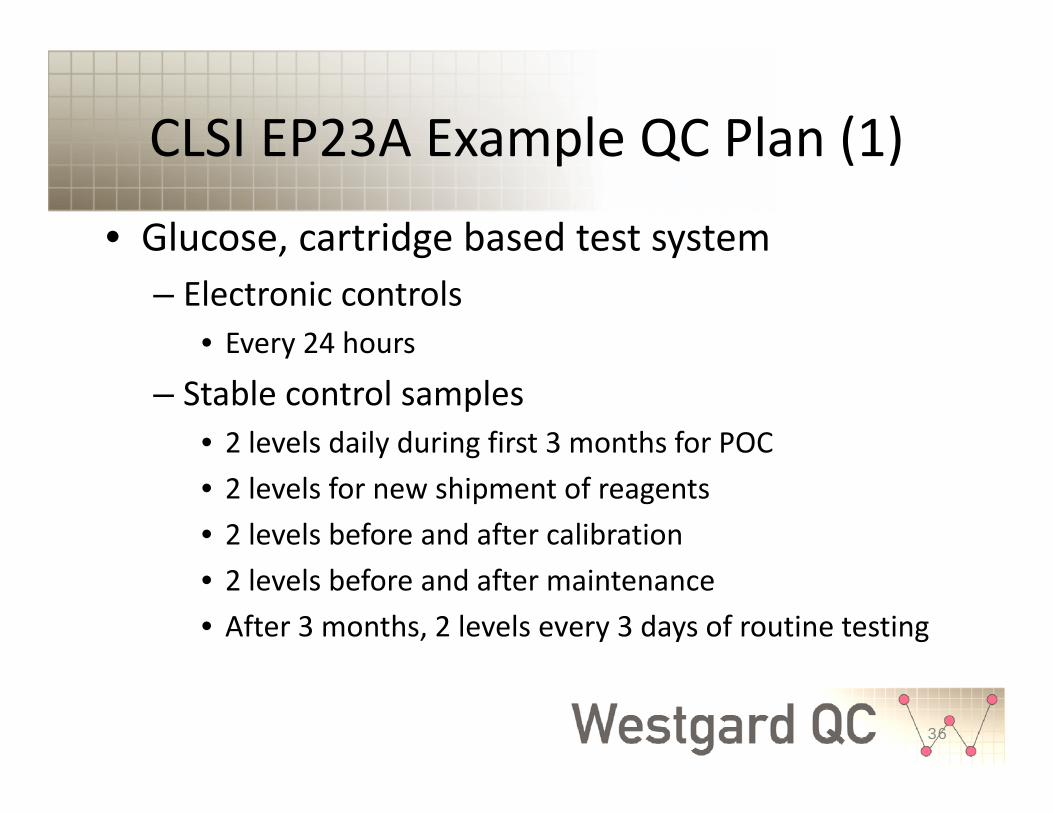
CLSI EP23A Example QC Plan (1)CLSI EP23A Example QC Plan (1)
• Glucose, cartridge based test system, g y– Electronic controls
• Every 24 hours y
– Stable control samples• 2 levels daily during first 3 months for POCy g• 2 levels for new shipment of reagents• 2 levels before and after calibration• 2 levels before and after maintenance• After 3 months, 2 levels every 3 days of routine testing
36

CLSI EP23A Example QC Plan (2)CLSI EP23A Example QC Plan (2)
• Proficiency testingy g– Participate in PT or EQA program at frequency specified p
• Calibration– After maintenanceAfter maintenance– With each reagent lot change
• Maintenance• Maintenance– Follow manufacturer’s schedule
& h d– Monitor storage temp, operating temp & humidity37
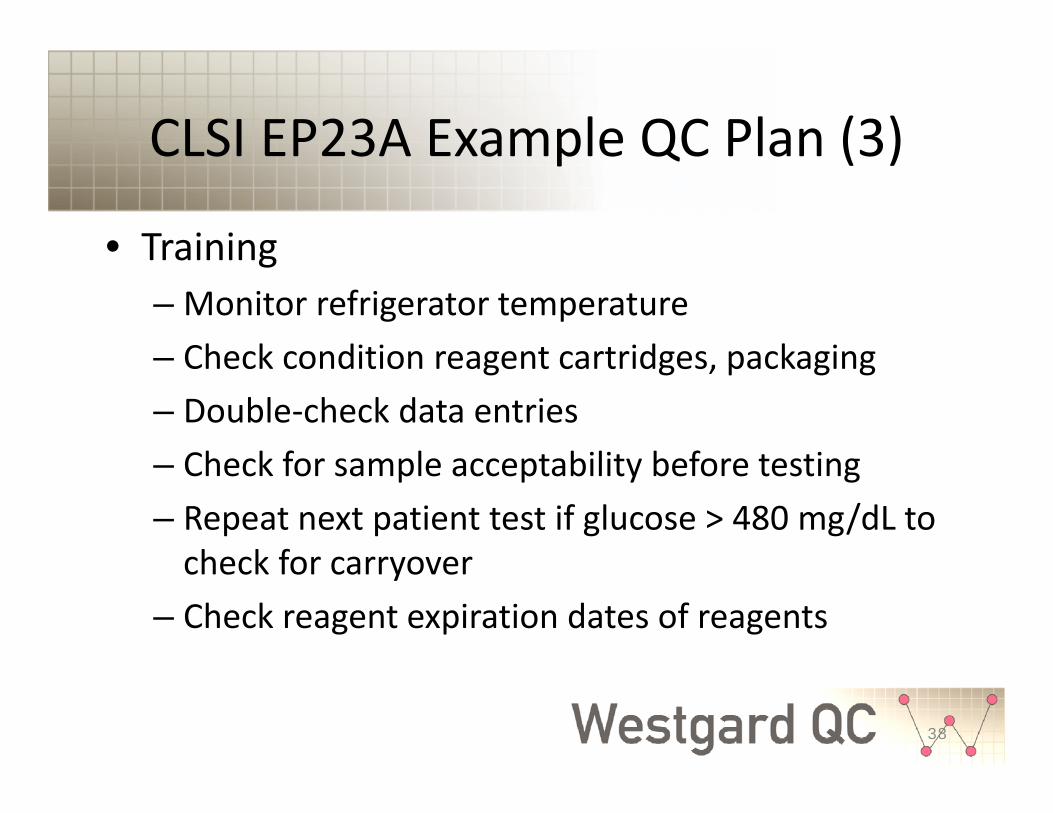
CLSI EP23A Example QC Plan (3)CLSI EP23A Example QC Plan (3)
• TrainingTraining– Monitor refrigerator temperatureCheck condition reagent cartridges packaging– Check condition reagent cartridges, packaging
– Double‐check data entriesCh k f l t bilit b f t ti– Check for sample acceptability before testing
– Repeat next patient test if glucose > 480 mg/dL to check for carryovercheck for carryover
– Check reagent expiration dates of reagents
38

Written Quality Control PlanWritten Quality Control Plan
• No standard format yet recommended• No standard format yet recommended• Should identify control mechanisms• Should specify frequency
– Original purpose of CLSI project
• Should specify recovery & disclosure– What to do when problems identified?What to do when problems identified?– Corrective actions– Information for safetyInformation for safety
39

Summary & Review (1)Strategies for Effective QC Plans
• Validate safety characteristics to assureValidate safety characteristics to assure method suitable for intended use– Critical first step in risk management– Critical first step in risk management
• Method must have the precision and accuracy (bias) needed for the intended medical or clinical use
– Precision determined by replication experiment– Bias determined by comparison of methods y pexperiment
40

Summary & Review (2)Strategies for Effective QC Plans
• Determine quality on the sigma‐scale toDetermine quality on the sigma scale to guide development of QC Plans– Use in house data for precision (replication– Use in‐house data for precision (replication experiment, QC data) and bias (comparison of methods, PT samples), p )
– Define TEa for intended use– Calculate Sigma as (TEa – Bias)/SD orCalculate Sigma as (TEa Bias)/SD or (%TEa ‐ %Bias)/%CV
41

Summary & Review (3)Strategies for Effective QC Plans
• Analyze at least 2 levels of controls daily y f ywhen possible, right‐size SQC, and develop Total QC PlanQ– Comply with CLIA default QC requirement– Right‐size SQC for the sigma quality of the testRight size SQC for the sigma quality of the test
• Use Westgard Sigma Rules to implement right control rules, right number of measurements
– Develop Total QC Plan• Add pre‐analytic and post‐analytic controls• Add other analytic controls based on sigma
42

Westgard Sigma Rules TM
Data QC Report Results
g g2 Levels of Controls
QC Report Results
13s 22s R4s 41s 8XNo No No No
Yes Yes Yes Yes Yes
No
Yes Yes
N=2R=1
N=2R=1
N=4R=1
N=2R=2
N=2R=4
N=4R=2
Take Corrective Action6σ 5σ 4σ 3σ
43
Sigma Scale = (%TEa-%Bias)/%CV

Westgard Sigma Rules TM
Data QC Report Results
g g3 Levels of Controls
QC Report Results
N N N N N13s
2of32s
R4s 31s 6XNo No No No
Yes Yes Yes Yes Yes
No
N=3R=1
N=3R=1
N=3R=1
N=3R=2
N=6R=1
Take Corrective Action
Si S l (%TE %Bi )/%CV6σ 5σ 4σ 3σ
Sigma Scale = (%TEa-%Bias)/%CV
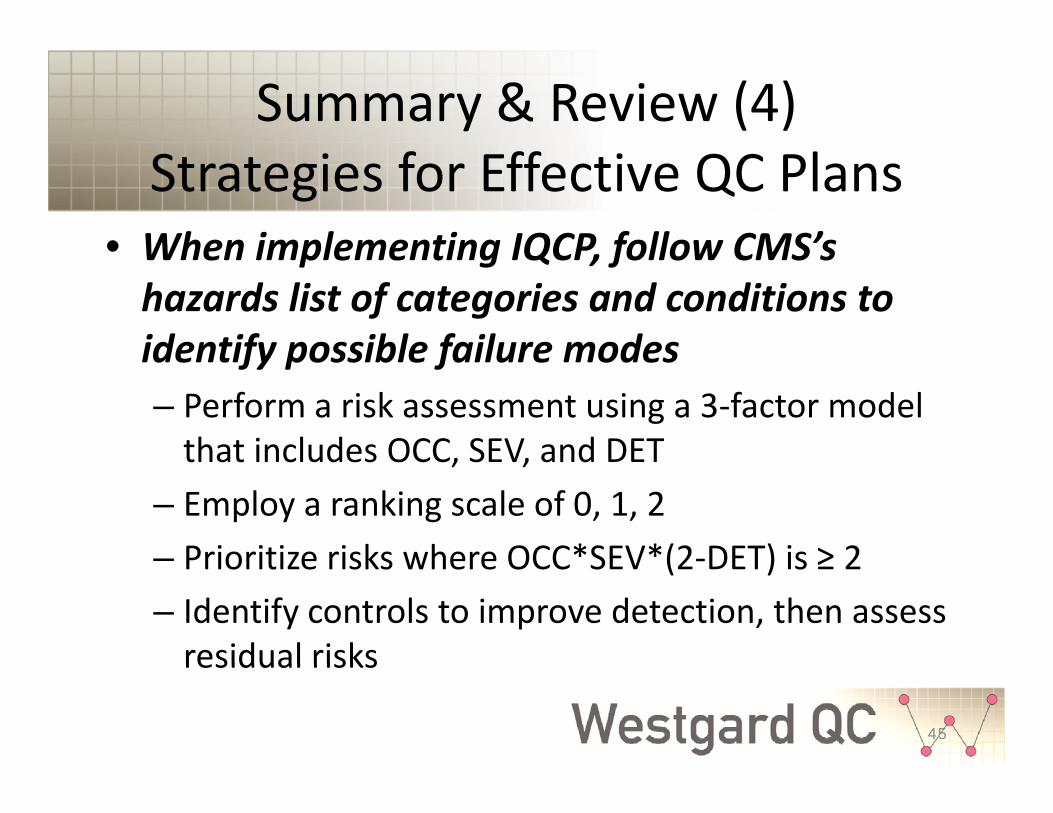
Summary & Review (4)Strategies for Effective QC Plans
• When implementing IQCP follow CMS’sWhen implementing IQCP, follow CMS s hazards list of categories and conditions to identify possible failure modesidentify possible failure modes– Perform a risk assessment using a 3‐factor model that includes OCC, SEV, and DETthat includes OCC, SEV, and DET
– Employ a ranking scale of 0, 1, 2– Prioritize risks where OCC*SEV*(2‐DET) is ≥ 2– Prioritize risks where OCC SEV (2‐DET) is ≥ 2– Identify controls to improve detection, then assess residual risksresidual risks
45

Summary & Review (5)Strategies for Effective QC Plans
• Review the CLSI EP23A “QC toolbox” toReview the CLSI EP23A QC toolbox to identify possible controls to mitigate risks– In TQC Plan implement right sized SQC to detect– In TQC Plan, implement right‐sized SQC to detect analytic errors in daily operation and any changes (events) of operating conditions ( ) p g
– In IQC Plan, implement Repeat Patient Test (RPT) control to monitor operator variability, bias vs reference method or reference lab, and acceptability of new reagent lots
46
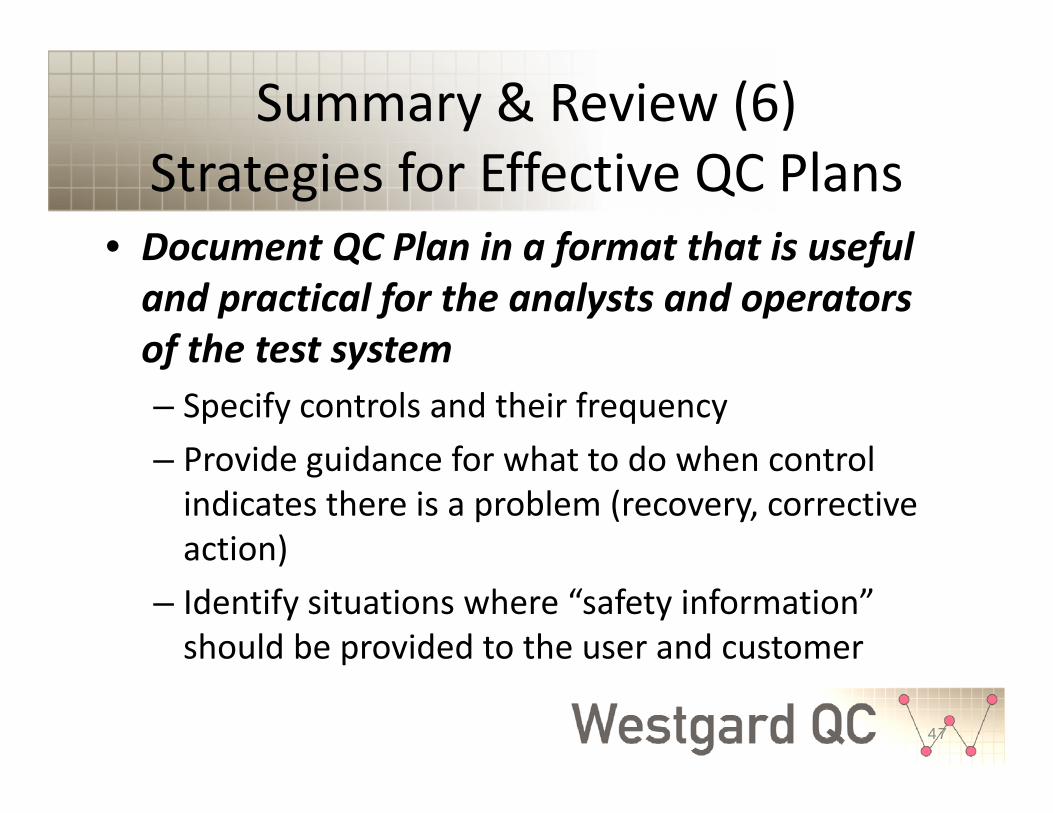
Summary & Review (6)Strategies for Effective QC Plans
• Document QC Plan in a format that is usefulDocument QC Plan in a format that is useful and practical for the analysts and operators of the test systemof the test system– Specify controls and their frequencyProvide guidance for what to do when control– Provide guidance for what to do when control indicates there is a problem (recovery, corrective action)ac o )
– Identify situations where “safety information” should be provided to the user and customerp
47

Summary & Review (7)Remember to include QA PlanRemember to include QA Plan
Validate Safety Characteristics
D t i Si Q lit
Yes No
Audit QC Practices
Determine Sigma Quality
A l
Develop Develop
Analyze2 levels of
controls/day?
DevelopTotal QC Plan
w/Right‐Sized SQC
DevelopRisk‐BasedIQC Plan
Monitor Quality & Patient Safety
Improve Quality & Safety
QA Plan3rd part of
IQCP
48
IQCP

Thank you for your kind attention!Thank you for your kind attention!
49

Any Questions?
MUCH, MUCH MORE
50
UC , UC OCan be found onlineAt www.westgard.com