Embed Size (px)
Citation preview

Developing the Cost Index Developing the Cost Index & Depreciation & Depreciation SchedulesSchedulesBy Dave DutyProperty Valuation Specialist IINorth Carolina Department of RevenueLocal Government DivisionProperty Tax Section
2011 Advanced Personal Property SeminarSheraton Four Seasons Hotel, Greensboro, NCTuesday September 13th, 2011

Let’s talk about these things:Let’s talk about these things:
The Cost Approach to ValueThe NCDOR Cost Index &
Depreciation SchedulesThe Producer Price IndexHistorical Cost vs. Allocated PriceMass AppraisalsVariations in the Trend FactorsVariances From the SchedulesTrends in the Billboard Manual

Review of the Cost Approach to Review of the Cost Approach to ValueValueWhat is it?
Installed cost-The Westmoreland Case
Replacement cost new
Composite resources
Depreciation
Economic life

Cost Approach to ValueCost Approach to ValueThe cost approach estimates market value on
the premise that the cost new of an asset is reduced by an amount equivalent to the total loss in value that has occurred through all forms of depreciation
Considered to be the best or most effective way to value machinery and equipment
Proven methodology, data is readily available, taxpayers tend to understand the concept fairly well
Most closely approximates the fair market valueMust determine the original historical installed
cost, the current replacement cost new, the loss in value due to depreciation, & obtain the useful economic life of the asset

Installed CostInstalled CostInvoice cost and all other costs
necessary to achieve normal utility of an asset
Bringing asset into production includes freight, taxes, installation, warranties, training, etc.
These costs are normally capitalized by the owner for accounting purposes
These costs offset income which lowers federal income tax liability

Support from Westmoreland Support from Westmoreland Case in Halifax CountyCase in Halifax County
NC Court of Appeals case page 8 & 9…the Department of Revenue has the
power to “prescribe the forms, books, and records to be used in the listing, appraisal, and assessment of property…
…guidelines provide that the acquisition cost of property includes “installation, sales tax, freight, and all other costs incurred with obtaining the property and making it ready for its intended use.”…
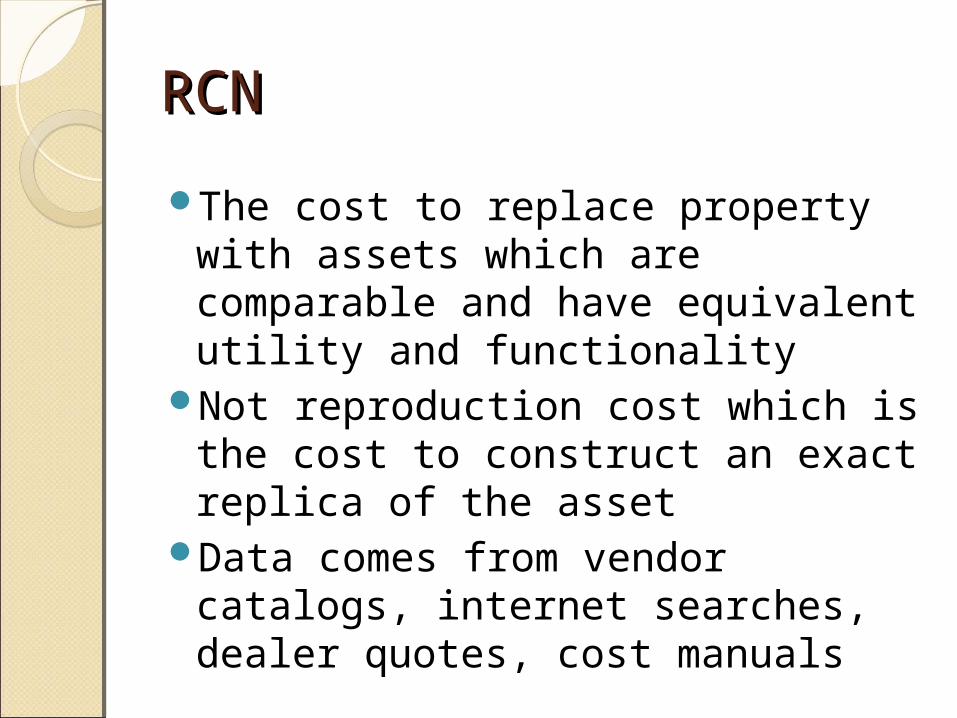
RCNRCN
The cost to replace property with assets which are comparable and have equivalent utility and functionality
Not reproduction cost which is the cost to construct an exact replica of the asset
Data comes from vendor catalogs, internet searches, dealer quotes, cost manuals

Ouch!Ouch!Wouldn’t it be nice if we could go to
one source of information that tracks increases and decreases in the costs of machinery and equipment?

Enter the NCDOR Cost Index Enter the NCDOR Cost Index & Depreciation & Depreciation Schedules !!!!!!!!!!Schedules !!!!!!!!!!We use index factors to
represent the overall price level changes for certain classes of property
The trending process applies the proper percentage of adjustment either positive or negative to historical cost data to find the replacement cost of an asset

Enter the NCDOR Cost Index Enter the NCDOR Cost Index & Depreciation & Depreciation Schedules !!!!!!!!!!Schedules !!!!!!!!!!Normally, it costs more to make a
product so the index factor increases
After depreciation is then applied, that remaining number is the good factor
So, higher costs to produce with pre-determined amounts of depreciation = lower good factors and lower values as the asset ages

Enter the NCDOR Cost Index Enter the NCDOR Cost Index & Depreciation & Depreciation Schedules !!!!!!!!!!Schedules !!!!!!!!!!
Depreciation is the loss in value from all causes of property having a limited economic life
RCN less Depreciation = Remaining good factors
Economic Life is the time period over which an asset may reasonably be expected to maintain utility or functionality

Review of the NCDOR Cost Index Review of the NCDOR Cost Index and Depreciation Schedules and Depreciation Schedules ManualManual
What is it?
Memorandum
Introduction
Major Category Descriptions
Valuation Tables

Cost Index & Dep. Cost Index & Dep. SchedulesSchedules
An effective & efficient method for determining current replacement cost new less depreciation to value property
Utilizes the cost approach to valuation
Widely accepted, but not required to be used by county appraisers

Annual MemorandumAnnual Memorandum
Summarizes changes from the previous year
More clarity in the categoryNew prevalent industry
descriptionsLife year adjustmentsRemindersExample: Propane gas tanksSpecial schedules


IntroductionIntroduction
A great description of what the schedules are and how the factors are determined
Example of how the good factors are calculated
Good factors-the product of the trending factor and straight-line depreciation over the economic life of the asset groupings


Major Category Major Category DescriptionsDescriptionsFrom aerospace to woodworking
equipment and industry categorization
Reference to the page number, schedule to use, and life years
Helps focus on the primary function of the business and the dominate type of equipment used
NAICS Code/Principle business in the county-captured on listing form


Valuation TablesValuation TablesProvide the good factor percentages
to apply to the reported costsA method to arrive at Fair Market
ValueData provided on the tables: The
year acquired, the age of the asset, the trend factor, the economic life in years, and the good factors
Good factors represent the remaining amount of replacement value new after depreciation-Import File


Yrs 1 2 3 4 5 6 7 8 9 10 11 12 13 14 15 16 17 18 19 20 21 22
A3 67 33 25
A5 80 61 42 25
A6 83 68 53 36 25
A8 87 76 67 55 41 29 25
A8T 78 64 53 41 29 19 9 5
A9 89 80 71 61 49 39 27 25
A10 90 81 74 65 56 47 36 25
A10T 81 69 59 49 39 30 22 14 6 5
A11 91 83 77 70 60 51 44 33 25
A12 92 84 80 73 65 59 51 41 31 25
A14 93 87 84 77 72 67 61 53 44 36 26 25
A15 93 88 85 80 75 70 64 58 49 41 34 25 25
A16 94 88 86 82 77 74 68 62 54 46 39 32 25
A17 94 89 87 83 80 76 71 65 58 51 44 37 30 25
A18 94 90 88 85 81 78 74 69 62 55 49 42 36 29 25
A20 95 91 90 87 84 82 79 74 68 62 56 50 45 39 33 28 25
B3 67 33 10
B5 80 61 42 25
B6 83 68 53 35 25
B7 86 72 60 46 32 25
B8 87 76 66 54 40 28 25
B10 90 81 74 64 55 44 34 25
B11 91 83 77 68 59 49 41 31 25
B12 92 84 79 72 63 56 48 38 29 25
B20 95 91 89 86 82 78 74 69 63 58 52 46 40 35 30 25 25
B25 96 93 92 90 87 84 82 78 73 69 64 60 55 51 47 43 39 35 30 26 25 25
C3 67 34 25
C6 83 68 53 36 25
Import FileImport File

Producer Price Index DataProducer Price Index Data
What is it?
Website tables
Migrate over to NCDOR Schedules
Examples
Facts about PPI

Producer Price IndexProducer Price Index
Comes from Bureau of Labor Statistics Data
Family of indexes that measures the average change over time in selling prices of goods & services
Makes use of NAICS codes!Data is from a sampling of
producers in manufacturing, mining, and service industries

Series Id: PCU333294333294Industry: Food product machinery manufacturingProduct: Food product machinery manufacturingBase Date: 198312 Download:
Year Jan Feb Mar Apr May Jun Jul Aug Sep Oct Nov Dec Annual
2001 171.1 170.9 170.8 171.0 171.0 171.0 171.3 171.3 172.6 171.7 172.3 172.3 171.4
2002 172.4 172.6 172.9 172.9 172.8 172.4 172.7 172.8 172.8 172.7 172.2 172.5 172.6
2003 173.5 173.6 174.0 174.2 174.9 174.9 175.1 175.1 175.1 175.4 176.1 175.2 174.8
2004 175.8 176.4 179.7 180.9 181.4 181.5 181.7 182.1 183.3 183.4 183.4 184.9 181.2
2005 186.8 186.9 187.2 187.7 189.0 189.0 189.2 189.5 189.7 190.4 191.8 191.8 189.1
2006 192.5 193.2 194.5 194.7 195.2 196.0 197.4 206.2 207.2 207.7 207.8 208.0 200.0
2007 210.6 211.3 211.9 212.2 212.3 213.5 213.9 215.0 215.3 216.5 217.0 217.1 213.9
2008 219.2 219.4 220.7 222.0 222.3 222.4 223.6 224.0 224.1 224.5 224.1 223.6 222.5
2009 224.2 224.3 224.0 224.4 224.6 224.6 224.3 224.1 224.2 224.2 224.3 224.2 224.3
2010 225.2 225.5 226.6 226.8 227.0 227.0 227.9 227.9 228.0 227.9 228.6 229.9 227.3
2011 230.4 231.3 232.3(P) 233.1(P) 233.2(P) 233.6(P)
P : Preliminary. All indexes are subject to revision four months after original publication.
Producer Price Index Industry Data

Percentage change over a Percentage change over a 12 month period:12 month period:
Select the month of September
Take 2010 figure, subtract 2009 figure and divide product by 2009 figure to arrive at percentage change
228.0 – 224.2 = 3.803.80 / 224.2 = + 0.017
Multiply by 100 x 0.017 = +1.7 % overall change


Consider the relationship between the Consider the relationship between the depreciation taken and the value depreciation taken and the value remaining-remaining-A -10 means it takes 10 years to fully
depreciatethe remaining value of the asset:Yr. Depreciation Taken Remaining Value1st 10% 90%2nd 20% 80%3rd 30% 70%4th 40% 60%5th 50% 50%6th 60% 40%7th 70% 30%8th 80% 20%9th 90% 10%10th 100% 0%
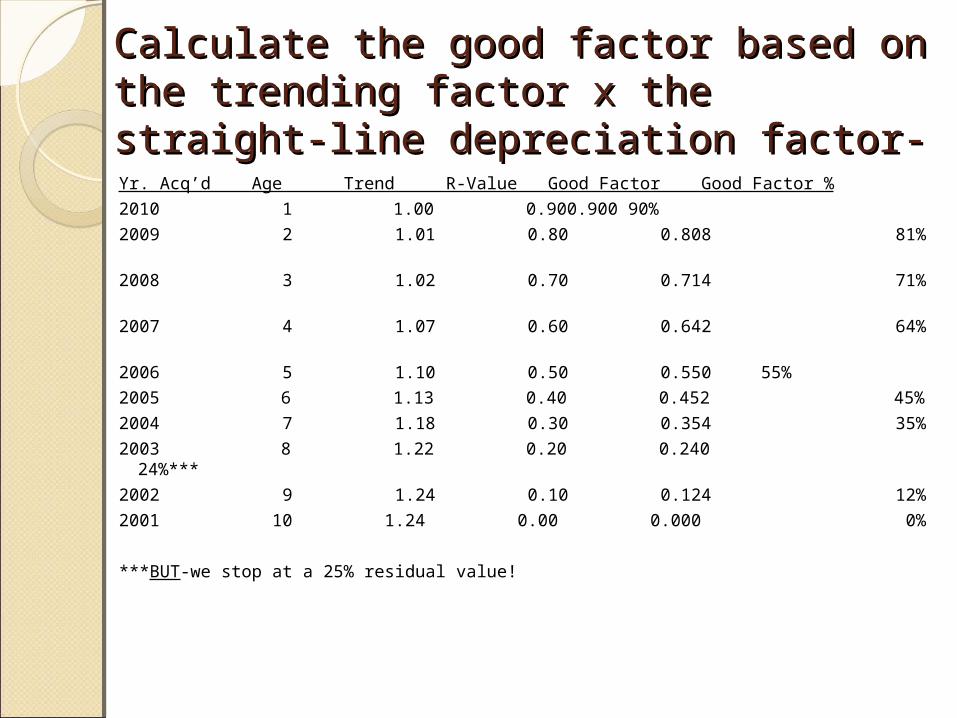
Calculate the good factor based on the Calculate the good factor based on the trending factor x the straight-line trending factor x the straight-line depreciation factor-depreciation factor-Yr. Acq’d Age Trend R-Value Good Factor Good Factor %
2010 1 1.00 0.90 0.900 90%
2009 2 1.01 0.80 0.808 81%
2008 3 1.02 0.70 0.714 71%
2007 4 1.07 0.60 0.642 64%
2006 5 1.10 0.50 0.550 55%
2005 6 1.13 0.40 0.452 45%
2004 7 1.18 0.30 0.354 35%
2003 8 1.22 0.20 0.240 24%***
2002 9 1.24 0.10 0.124 12%
2001 10 1.24 0.00 0.000 0%
***BUT-we stop at a 25% residual value!


Facts Facts
Targets US producers so imports are excluded
Price collected is revenue received by producers-not sales tax, excise tax, etc.-these are not revenue to producer
Used to deflate revenue streams to measure real growth
One of the oldest economic time series compiled by the Fed. Gov.-1891

Historical Costs vs. Allocated Historical Costs vs. Allocated Purchase Price ValuePurchase Price Value
What is it?
Our goal for equitable valuation
Undesirable features of allocated purchase price
Example of higher tax liability
Questions to ask

Historical vs. AllocatedHistorical vs. Allocated
Historical cost is the cost of the property when it was first placed into service by its original owner
Allocated cost or Acquisition cost is the price paid for an asset when acquired by the present owner

Our Goal for EquityOur Goal for Equity
Historical cost works well with the trend tables-value is gradually reduced over time
A full installed cost approach to disclosing reportable costs
The audit is an examination of the accounting records of the business owner

Undesirable Allocated Undesirable Allocated Purchase PricePurchase PriceShort circuits the use of the CI&DSNot based on cost new in the year of
manufactureArbitrary number selected by a non-
appraiserMotive is to lower income tax liabilityCould increase value on M & E, then
decrease value on “good will” to inflate the amount of depreciation, thus less income tax on the business

Allocation? : ( Allocation? : ( Requested amount could be after a
write down of assetsCould be a distressed sale or not
an arm’s length transaction-may I have a copy of your sales contract?
This may be an assigned value that fails to capture installed costs
What portion of the allocated cost do you remove when the asset is disposed of?

Allocation? Allocation? Using the allocated price is a
disservice to all other taxpayers-not uniform & equitable
Why can’t the new owner get the old records from the seller?
Why can’t the new owner get permission from the seller to allow the county to release the old records so the new owner can complete the listing properly?
The Last Resort!The Last Resort!Westmoreland case supports both
the inclusion of all costs and the methodology that the NCDOR has adopted and recommended
DO NOT DEPRECIATE the allocated purchase price-that price IS THE VALUE!!!
Leave good records in the file about why you accepted this methodology

Higher Tax Liability???Higher Tax Liability???
Given Data:2002 Commercial Bread Baking OvenHistorical Installed Cost = $100,000Use A-10 ScheduleSitused in Wake County = $0.534 rateSo…$100,000 x 25% = 25,000
divided by 100 = 250 units of value x $0.534 =
$13.35

Higher Tax Liability???Higher Tax Liability???Bought asset in 2010Allocated purchase price = $30,000So…$30,000 reported in current
year divided by 100 = 300 units of value x $0.534 = $160.20
Dear Mr. Business owner, Would you rather pay $13.35 or
$160.20 ??????

Questions to Questions to ask-----------------ask-----------------Does the price paid represent fair
market value?Were all of the assets purchased
from the prior owner?Have any of the assets been sold by
the new owner since the purchase?Were the reported costs of the prior
owner ever audited?What is the purchase price
allocation based on?

Questions to Questions to ask-----------------ask-----------------Was an appraisal made of the
property prior to the sale?Was an appraisal made of the
property after the sale?How many business locations
were involved in the purchase?May I read the sales contract?Are you sure you can’t get me
the historical installed costs?

Mass Appraisals???Mass Appraisals???
What is it?
How the schedules accomplish our goal
Elements to consider
Reverse Trending

Massive NumbersMassive Numbers
Appraising mass numbers of groups of assets vs. mass numbers of individual pieces of equipment
M & E, F & F, Computers, etc.Consider all elements in 105-317.1Getting a value by going backwards

Variations in the Trend FactorsVariations in the Trend Factors
The “T” Schedules
Example of the effects of a positive trend
Other impacted schedules
Residual values


Example of a positive trendExample of a positive trendYr. Acq’d Age Trend R-Value Good Factor Good %2010 1 1.00 0.98 0.980 98%2009 2 1.01 0.96 0.970
97%2008 3 1.06 0.94 0.996 99%2007 4 1.17 0.92 1.076 108%2006 5 1.21 0.90 1.089 109%2005 6 1.29 0.88 1.135 113%2004 7 1.32 0.86 1.135 114%2003 8 1.35 0.84 1.134 113%2002 9 1.36 0.82 1.115 111%2001 10 1.35 0.80 1.080 108%2000 11 1.38 0.78 1.076
107%1999 12 1.39 0.76 1.056 106%

VariationsVariationsU-12 stops @ 35% for tractorsU-5 goes down to 10% for data
processingU-6 & U-8 goes to 15% for semi-
conductors, digital & switching equip.B-5 goes to 10% for analog TV equip.D-6 goes to 15 % for POS, hand held
data, & electronic cash register equip.
M- does not drop below 40%-vaults

Residual ValuesResidual Values
25% is a conservative amount of value
Difficult to value older equipmentRemaining value is a “going
concern” value

Variances From the SchedulesVariances From the SchedulesIdle and non-idle equipment
Construction in Progress
Expensed items
Leased equipment
Leasehold improvements
Inventory
Questions to ask

VariancesVariancesIdle equipment Equipment that has been taken
off production status on a permanent basis---
Non-idle equipment Stand-by & seasonal equipment
that is waiting to be used at the proper time---
VariancesVariancesConstruction in Progress – CIP The investment in production
equipment which has not been placed into operation
Listed with the county @ 100%
Validation costs and physical wear & tear

VariancesVariancesExpensed Items The cost is expensed depending on the threshold amount IRS Section 179 items• Leased Equipment Generally valued at the same amount as owned
property Manufacturer/Lessor should report retail selling price

VariancesVariances
Leasehold Improvements Real estate improvements to
leased property contracted for, installed, and paid for by the lessee which may remain with the real estate
10 or 20 year life? Use the “N” schedule

VariancesVariancesInventory
Definition by the financial officer vs. the county definition
Supplies
Questions to ask?

QuestionsQuestions
Why is the equipment idle?Is the equipment permanently idle?What is the age of the equipment?Is there a market for the equipment?What are the future uses of the
equipment?What is the condition of the equipment?What is the remaining life of the
equipment?

Trends in the Billboard IndustryTrends in the Billboard Industry
The Billboard Manual
Base costs
Percent change in building costs
Manual is always current
Trends in the Billboard Trends in the Billboard ManualManual
2009 Billboard ManualA cost factor is applied to the base
costsThis factor is the percentage
increase or decrease over the previous year to construct a billboard structure
Fluctuates from year to yearNo need to revise the manual

Local Government Division---919-733-Local Government Division---919-733-77117711
Dave Duty---919-715-9771Dave Duty---919-715-9771
THE END