Embed Size (px)
Citation preview

Nidhi Chaudhary, Pardeep Goel, Surender Kumar: - Developing the reliability model for availability and behaviour analysis of a distillery using Regenerative Point Graphical Technique
www.ijifr.com [email protected], [email protected] IJIFR©2013
This paper is available online at - http://www.ijifr.com/searchjournal.aspx
Volume -1 Issue -4, December 2013. ID: IJIFR/V1/E3/014
26
ISSN (Online):2347-1697 INTERNATIONAL JOURNAL OF INFORMATIVE AND FUTURISTIC RESEARCH ( IJIFR)
Volume -1 Issue -4, December 2013 Research Area: Mathematics, Page No. : 26-40
Developing the reliability model for availability and behaviour
analysis of a distillery using Regenerative Point Graphical Technique
Nidhi Chaudhary
1, Pardeep Goel
2, Surender Kumar
3
*Assistant Professor of Mathematics, KITM College, Karnal
**Department of Mathematics, M.M (P.G) College, Fatehabad
***Research Scholar, JJT University, Jhunjhunu
Abstract
This paper discusses Availability Analysis of Using RPGT Called Regenerative Point
Graphical Technique. The reliability model for availability and behaviour analysis of
distillery plant is developed with a single server which consists of three non-identical units in
which main unit can work in reduced state due to partial failure. The main unit can fail
partially and hence can be in up-state, partially failed state or totally failed state. The system
can work with reduced capacity in a partially failed state. The repairs of the unit, treatment of
the server are considered as perfect. Using RPGT, expressions for the Mean time to system
failure, Total fraction of time for which the system is available, the busy period of the server,
the Number of server’s visits has been evaluated to study the system performance followed
by illustrations, special cases, Tables and Graphs.
Keywords: System Performance, Availability Analysis, Distillery Plant, Base-State, RPGT, Server Busy
Period, MTSF, Primary, Secondary, Tertiary Circuits
Introduction: In this paper the reliability model for availability and behaviour analysis of distillery
industry is developed. The whole industries are divided into three units for a better analysis. Division
of whole industry into three units can be taken up in various combinations. However, study can also
be taken for individual units. One part is considered as main unit and other to be taken as subsidiary
units. In which main unit can work in reduced state after partial failure. The main unit can fail
partially and hence can be in up-state, partially failed state or totally failed state and one of the
subsidiary unit have stand-by and third unit have units in series. The system can work with reduced
capacity in a partially failed state. The repair of the unit, treatment of the server is considered as
perfect. Using RPGT, expressions for the Mean time to system failure, Total fraction of time for
which the system is available, the busy period of the server, the Number of server’s visits has been
evaluated to study the system performance followed by illustrations, special cases, Tables and Graphs.
Gupta, Singh and Vanita [1] defined different types of circuits / cycles like primary, secondary and
tertiary circuits which are located in the transition diagram of the system and introduced the concept
of base state of the system for determining the key parameters of the system using RPGT. Using
RPGT Jindal [2] discussed behaviour and availability analysis of industrial systems. Gupta and Singh
[4 & 5] presented a new approach for availability analysis, behaviour and profit analysis of process
industries. Goel and Singh [3] discussed the availability analysis of the standby complex system
having imperfect switch. Nidhi, Goel & Garg [6] discussed Availability Analysis of a Soap Industry
Using Regenerative Point Graphical Technique (RPGT). In distillery, the first process is malting here.
The barley is made wet and spread on the malting floor to allow the germination process to start.
PA
PE
R I
D:
IJIF
R/V
1/E
4/0
14

Nidhi Chaudhary, Pardeep Goel, Surender Kumar : - Developing the reliability model for availability and behaviour analysis of a distillery using Regenerative Point Graphical Technique
www.ijifr.com PAPER ID: IJIFR/V1/E3/014 IJIFR©2013
27
ISSN (Online):2347-1697 INTERNATIONAL JOURNAL OF INFORMATIVE AND FUTURISTIC RESEARCH ( IJIFR)
Volume -1 Issue -4, December 2013 Research Area: Mathematics, Page No. : 26-11
Second process is grinding in which the dry malt is grinded to make a kind of coarse flour which will
be used in the next operations. Third process is brewing in which the grist will be mixed with the hot
water in the mash turn. Generally the volume of grist is mixed up with 4 volumes of water. In this
operation, 3 successive waters are used, at a temperature between 63 and 95%.Fourth process is
Fermentation of worth in which yeast is added. The action of the yeast on the sugar of the wart will
produce alcohol and carbon-dioxide. Fifth Process is distillation which is used to separate alcohol
from water and other substances contained in the wash. Sixth process is aging in which to have the
right to bear the name of whisky; a grain spirit must be aged at-least for 3 years in a oak cask. Seventh
process is bottling before putting the whisky on the market. Generally, the casks are mixed before
bottling to get a more standardized product like great wines. Last process is Labelling and Packaging
in which containers must be sealed so that any attempt to open the container will leave marks visible
to consumers.
2 Assumptions and Notations:
The following assumptions and notations/symbols are used:
1) The System consists of Three non-identical units ‘A’ ,’B’ and ‘D’ in which ‘A’ can work in
reduced state after partial failure. Unit ‘A’ represents the grinding and flooring, unit ’B’ represents the
processes brewing, mixing, fermentation, distillation and the third unit ‘D’ represents the bottling
labelling and packaging.
2) The unit ‘A’ can fail partially and hence can be in up-state, partially failed state (reduced
state) or totally failed state. The system can work with reduced capacity in a partially failed state and
is repaired when it fails completely or if the server is idle.
3) The unit ‘B’ have cold standby unit ‘C’.
4) Unit ‘D’ which is bottling labelling and packaging have units in series.
5) Priority policy is in order Mainstreams unit, redundant unit.
6) The system is down when any of mainstream units is failed.
7) There is a single repair facility catering to the needs of three units as and when need arises.
8) Nothing can fail further when the system is in failed state. If the mainstream unit fails, the
system is in degraded state and the failed unit is immediately put under repair.
9) If standby unit is on line, and main unit is repaired in the meantime then the main unit is
switched in as on line.
10) Upon failure, if the repairman is busy and if standby unit is also fail, it joins the end of the
queue of failed unit.
11) The distributions of the failure & repair times are exponential and general respectively and
also different for three units. They are also assumed to be independent of each other.
12) Repairs are perfect i.e. the Repair facility never does any damage to the units.
13) A Repaired unit works like a new one.
14) The system is discussed for steady state conditions.
pr/pf:- Probability/transition probability factor.
qi,j(t):- probability density function (p.d.f.) of the first passage time from a regenerative state ‘I’ to a
regenerative state ‘j’ or to a failed state ‘j’ without visiting any other regenerative state in (0,t]
pi,j:- Steady state transition probability from a regenerative state ‘i’ to a regenerative state ‘j’
without visiting any other regenerative state. pi,j= ; where denotes Laplace transformation.
: A circuit formed through un-failed states.

Nidhi Chaudhary, Pardeep Goel, Surender Kumar : - Developing the reliability model for availability and behaviour analysis of a distillery using Regenerative Point Graphical Technique
www.ijifr.com PAPER ID: IJIFR/V1/E3/014 IJIFR©2013
28
ISSN (Online):2347-1697 INTERNATIONAL JOURNAL OF INFORMATIVE AND FUTURISTIC RESEARCH ( IJIFR)
Volume -1 Issue -4, December 2013 Research Area: Mathematics, Page No. : 26-11
m- : A circuit (may be formed through regenerative or non-regenerative/failed states) whose terminals
are at the regenerative state m.
m- : A circuit (may be formed through only un-failed regenerative / non- regenerative states) whose
terminals are at the regenerative state m.
: r-th directed simple path from ‘i’-state to ‘j’-state; r takes positive integral values for different paths
from i-state to j-state.
: A directed simple failure free path from ‘ ’-state to i-state.
:pf of the state m reachable from the terminal state m of the m-cycle.
:pf of the state m reachable from the terminal state m of the m- .
Ri(t): Reliability of the system at time t, given that the system entered the un-failed regenerative state
‘i’ at t=0.
Ai(t): Probability that the system is available in up-state at time t, given that the system entered
regenerative state ‘i’ at t=0.
Bi(t): Probability that the server is busy doing a particular job at epoch t, given that the system entered
regenerative state ‘i’ at t=0.
Vi(t): The expected number of visits of the server for a given job in (0,t], given that the system
entered regenerative state ‘i’ at t=0.
Wi(t): Probability that the server is busy doing a particular job at epoch t without transiting to any
other regenerative state ‘i’ through one or more non- regenerative states, given that the system entered
the regenerative state ‘i’ at t=0.
: Mean sojourn time spent in state i, before visiting any other states;
: The total un-conditional time spent before transiting to any other regenerative states, given that the
system entered regenerative state ‘i’ at t=0.
ƞi: Expected waiting time spent while doing a given job, given that the system entered regenerative
state ‘i’ at t=0;
: Fuzziness measure of the ‘j’-state.
λ1/ λ2 / λ3 / λ4/ λ5 : Constant failure rate of the operative units A/A/B/C/D respectively.
g1(t)/g2(t)/ g3(t)/ g4(t) / g5(t) : Probability density function of the Repair rates of units A/A/B/C/D
respectively.
G1(t)/G2(t)/ G3(t)/ G4(t) / G5(t) : Cumulative density function of the Repair rates of failed units
A/A/B/C/D respectively.
A/ Ā/a : Main unit in the operative state/ partial failed state/failed state
B/b : operative state/ failed state.
(C)/c : Standby unit in cold stand-by/ failed state
D/d : operative state/ failed state.
Transition diagram of the system
Following the above assumptions and notations, the transition diagram of the system is shown in fig.1
Table 1: Symbolic representation of States
State Symbol Regenerative state/point
Up-state:
Failed state:
Degenerated/Reduced state

Nidhi Chaudhary, Pardeep Goel, Surender Kumar : - Developing the reliability model for availability and behaviour analysis of a distillery using Regenerative Point Graphical Technique
www.ijifr.com PAPER ID: IJIFR/V1/E3/014 IJIFR©2013
29
ISSN (Online):2347-1697 INTERNATIONAL JOURNAL OF INFORMATIVE AND FUTURISTIC RESEARCH ( IJIFR)
Volume -1 Issue -4, December 2013 Research Area: Mathematics, Page No. : 26-11
Figure 1: Transition diagram of Distillery Industry
The system can be in any of the following states with respect to the above symbols.
S0 = AB(C)D S1= ĀB(C)D
S2 = aB(C)D S3 = AbCD
S4 =ĀbCD S5 = ĀbcD
S6 = abCD S7 =AbcD
S8 = ĀbCd S9=AbCd
S10=AB(C)d S11=ĀB(C)d
States S0, S1,S2 , S3 ,S4, S5, S6,S7,S8,S9,S10 and S11are regenerative states.
4 Evaluations of parameters of the system:
4.1 Analysis of System:
The key parameters (under steady state conditions) of the system are evaluated by determining a ‘base-
state’ and applying RPGT. The MTSF is determined w. r. t the initial state’0’ and the other parameters
are obtained by using base-state.
4.1.1 Determination of base-state:
From the Transition diagram (fig.1), The Primary, Secondary, Tertiary Circuits at all vertices are shown
in Table-2.

Nidhi Chaudhary, Pardeep Goel, Surender Kumar : - Developing the reliability model for availability and behaviour analysis of a distillery using Regenerative Point Graphical Technique
www.ijifr.com PAPER ID: IJIFR/V1/E3/014 IJIFR©2013
30
ISSN (Online):2347-1697 INTERNATIONAL JOURNAL OF INFORMATIVE AND FUTURISTIC RESEARCH ( IJIFR)
Volume -1 Issue -4, December 2013 Research Area: Mathematics, Page No. : 26-11
Table 2: Primary, Secondary, Tertiary Circuits at a Vertex ‘j’
Vertex
‘j’
Primary( CL1) Secondary( CL2) Tertiary( CL3)
0 (0,1,0)
(0,3,0)
(0,1,2,0)
(0,10,0)
(0,1,4,6,3,0)
(1,11,1),(3,4,3),(3,7,3)
(3,9,3)
(1,11,1)
NIL
(1,11,1),
(4,3,4)
,(4,6,3,4),
(3,4,3),(3,7,3),(3,9,3)
NIL
NIL
NIL
NIL
NIL
(3,7,3),(3,9,3)
,(3,7,3),(3,9,3)
NIL
1 (1,0,1)
(1,2,0,1)
(1,4,3,0,1)
(1,4,6,3,0,1)
(1,11,1)
(0,3,0)
(0,10,0)
(0,3,0)
(0,10,0)
(4,3,4)
,(4,6,3,4)
(4,3,4)
,(4,6,3,4)
(3,0,3)
(3,4,3)
(3,7,3),(3,9,3)
(3,4,3),(3,7,3),(3,9,3)
NIL
(3,4,3),(3,7,3),(3,9,3)
NIL
(3,0,3),(3,7,3),(3,9,3)
,(3,0,3),(3,7,3),(3,9,3)
(3,0,3),(3,7,3),(3,9,3),
(3,0,3),(3,7,3),(3,9,3)
(0,10,0)
NIL
NIL
2 (2,0,1,2) (0,1,0), (0,10,0)
(0,3,0)
(0,1,4,6,3,0)
NIL
(3,4,3),(3,7,3),(3,9,3)
(1,11,1),(4,3,4),(4,6,3,4),(3,7,3),(3,9,3)
3 (3,0,1,4,3)
(3,0,3)
(3,4,3),(3,7,3),(3,9,3)
(0,1,0)
(0,1,2,0),(0,10,0)
(0,1,0)
(0,1,2,0),(0,10,0)
NIL
(1,11,1)
NIL
(1,11,1)
NIL
NIL
4 (4,3,4)
(4,6,3,4)
(4,3,0,1,4)
(4,6,3,0,1,4)
(3,0,3)
(3,7,3),(3,9,3)
(3,0,3)
(3,7,3),(3,9,3)
(3,0,3)
(3,7,3)
(3,9,3)
(0,1,0),(0,1,2,0)
(0,10,0)
(3,0,3)
(3,7,3),(3,9,3)
(0,1,0),(0,1,2,0)
(0,10,0)
(0,1,0),(0,1,2,0),(0,10,0)
NIL
(0,1,0),(0,1,2,0),(0,10,0)
NIL
(0,1,0),(0,1,2,0),(0,10,0)
NIL
NIL
(1,11,1),(1,11,1)
NIL
(0,1,0),(0,1,2,0),(0,10,0)
NIL
(1,11,1),(1,11,1)
NIL
5 (5,4,5) (4,3,4),
(4,6,3,4)
(4,3,0,1,4)
(4,6,3,0,1,4)
(3,0,3),(3,7,3),(3,9,3)
,(3,0,3),(3,7,3),(3,9,3)
(3,0,3),(3,7,3),(3,9,3),(0,1,0),(0,1,2,0),(0,3,0),(0,10,0)
(3,0,3),(3,7,3),(3,9,3),(0,1,0),(0,1,2,0),(0,3,0),(0,10,0)

Nidhi Chaudhary, Pardeep Goel, Surender Kumar : - Developing the reliability model for availability and behaviour analysis of a distillery using Regenerative Point Graphical Technique
www.ijifr.com PAPER ID: IJIFR/V1/E3/014 IJIFR©2013
31
ISSN (Online):2347-1697 INTERNATIONAL JOURNAL OF INFORMATIVE AND FUTURISTIC RESEARCH ( IJIFR)
Volume -1 Issue -4, December 2013 Research Area: Mathematics, Page No. : 26-11
6 (6,3,4,6)
(6,3,0,1,4,6)
(3,4,3),
(3,7,3),(3,9,3),(3,4,3)
(3,0,1,4,3)
(3,0,3)
(3,0,1,4,3)
,(3,0,3)
(3,7,3),(3,9,3)
(0,1,0)
(0,1,2,0)
(0,10,0),(1,11,1)
NIL
(0,1,0),(0,1,2,0),(0,10,0),(1,11,1)
(0,1,0),(0,1,2,0),(0,10,0)
(0,1,0),(0,1,2,0),(0,10,0),(1,11,1)
,(0,1,0),(0,1,2,0),(0,10,0)
NIL
(1,11,1)
(1,11,1)
NIL
7 (7,3,7) (3,0,1,4,3)
(3,4,3), (3,7,3),(3,9,3)
(3,0,3)
(0,1,0),(0,1,2,0),(0,10,0),(1,11,1)
NIL
(0,1,0),(0,1,2,0),(0,10,0)
8 (8,4,8) (4,3,4)
,(4,6,3,4)
(4,3,0,1,4)
(4,6,3,0,1,4)
(3,0,3),(3,7,3),(3,9,3)
,(3,0,3),(3,7,3),(3,9,3)
(3,0,3),(3,7,3),(3,9,3),(0,1,0),(0,1,2,0),(0,3,0),(0,10,0)
(3,0,3),(3,7,3),(3,9,3),(0,1,0),(0,1,2,0),(0,3,0),(0,10,0)
9 (9,3,9) (3,4,3), (3,7,3)
(3,0,1,4,3)
(3,0,3)
NIL
(0,1,0),(0,1,2,0),(0,10,0),(1,11,1)
(0,1,0),(0,1,2,0),(0,10,0)
10 (10,0,10) (0,1,0)
,(0,1,2,0)
,(0,3,0),
(0,1,4,6,3,0)
(1,11,1),
(1,11,1),
(3,4,3),(3,7,3),(3,9,3)
,(3,4,3),(3,7,3),(3,9,3),(4,6,3,4)
11 (11,1,11) (1,0,1),
(1,2,0,1),
(1,4,3,0,1)
(1,4,6,3,0,1)
(0,10,0),(0,3,0)
,(0,10,0) ,(0,3,0)
(0,10,0),(0,3,0),(4,3,4),(4,6,3,4),(3,7,3),(3,9,3)
(0,10,0),(0,3,0),(4,3,4),(4,6,3,4),(3,7,3),(3,9,3)
In the Transition diagram of fig.1,there are five, five, one, five, four, one, two, one, one, one, one &
one primary circuits are at vertices 0,1,2,3,4,5,6 ,7,8,9,10&11 respectively and ten, twelve, four, six,
eighteen, four, fourteen, five, four, four, four& four secondary circuits are at vertices
0,1,2,3,4,5,6,7,8,9,10 &11 respectively and seven, twenty three, eight, two, sixteen, twenty, sixteen,
seven, twenty, seven, nine& sixteen tertiary circuits are at vertices 0,1,2,3,4,5,6,7,8,9,10 & 11
respectively. Since there are largest no. of primary circuits at the vertex ‘3’with lesser number of
secondary & tertiary circuits. Therefore ‘3’ is a base-state.
Table 3: Primary, Secondary, Tertiary Circuits w.r.t Simple Paths (Base-State’3’)

Nidhi Chaudhary, Pardeep Goel, Surender Kumar : - Developing the reliability model for availability and behaviour analysis of a distillery using Regenerative Point Graphical Technique
www.ijifr.com PAPER ID: IJIFR/V1/E3/014 IJIFR©2013
32
ISSN (Online):2347-1697 INTERNATIONAL JOURNAL OF INFORMATIVE AND FUTURISTIC RESEARCH ( IJIFR)
Volume -1 Issue -4, December 2013 Research Area: Mathematics, Page No. : 26-11
Vertex (3 j0):P0
(P1) (P2)
1 (3 0):{3,0}
{0,1,0}
{0,1,2,0}
{0,10,0}
{1,11,1}
{1,11,1}
NIL
2 (3 1):{3,0,1}
{0,1,0}
{0,1,2,0}
{0,10,0},{1,11,1}
{1,11,1}
{1,11,1}
NIL
3
(3 2):{3,0,1,2} {0,1,0}
{0,1,2,0}
{0,10,0},{1,11,1}
{1,11,1}
{1,11,1}
NIL
4 (3 4):{3,4}
(3 4):{3,0,1,4}
NIL
{0,1,0}
{0,1,2,0}
{0,10,0},{1,11,1}
NIL
{1,11,1}
{1,11,1}
NIL
5 (3 5): {3,4,5}
(3 5):{3,0,1,4,5}
{5,4,5}
{0,1,0}
{0,1,2,0}
{0,10,0},{1,11,1},{5,4,5}
NIL
{1,11,1}
{1,11,1}
NIL
6 (3 6): {3,4,6}
(3 6):{3,0,1,4,6}
NIL
{0,1,0}
{0,1,2,0}
{0,10,0},{1,11,1}
NIL
{1,11,1}
{1,11,1}
NIL
7 (3 7):{3,7}
NIL NIL
8 (3 8):{3,4,8}
(3 8):{3,0,1,4,8}
{8,4,8}
{0,1,0}
{0,1,2,0}
{0,10,0},{1,11,1},{8,4,8}
NIL
{1,11,1}
{1,11,1}
NIL
9 (3 9):{3,9}
NIL NIL
10 (3 10):{3,0,10}
{0,1,0}
{0,1,2,0}
{0,10,0}
{1,11,1}
{1,11,1}
NIL
11 (3 11):{3,0,1,11}
{0,1,0}
{0,1,2,0}
{0,10,0},{1,11,1}
{1,11,1}
{1,11,1}
NIL
4.1.2 Transition Probabilities and the Mean Sojourn Times:
Nidhi Chaudhary, Pardeep Goel, Surender Kumar : - Developing the reliability model for availability and behaviour analysis of a distillery using Regenerative Point Graphical Technique
www.ijifr.com PAPER ID: IJIFR/V1/E3/014 IJIFR©2013
33
ISSN (Online):2347-1697 INTERNATIONAL JOURNAL OF INFORMATIVE AND FUTURISTIC RESEARCH ( IJIFR)
Volume -1 Issue -4, December 2013 Research Area: Mathematics, Page No. : 26-11
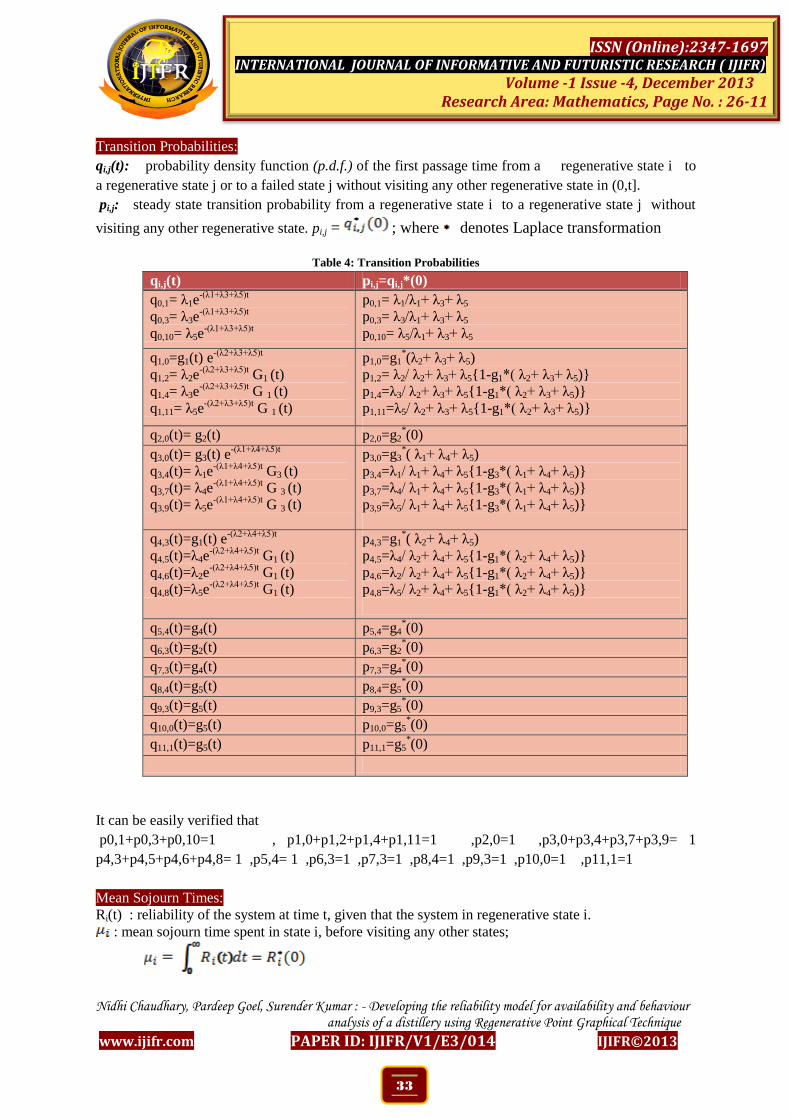
Transition Probabilities:
qi,j(t): probability density function (p.d.f.) of the first passage time from a regenerative state i to
a regenerative state j or to a failed state j without visiting any other regenerative state in (0,t].
pi,j: steady state transition probability from a regenerative state i to a regenerative state j without
visiting any other regenerative state. pi,j = ; where denotes Laplace transformation
Table 4: Transition Probabilities
qi,j(t) pi,j=qi,j*(0)
q0,1= λ1e-(λ1+λ3+λ5)t
q0,3= λ3e-(λ1+λ3+λ5)t
q0,10= λ5e-(λ1+λ3+λ5)t
p0,1= λ1/λ1+ λ3+ λ5
p0,3= λ3/λ1+ λ3+ λ5
p0,10= λ5/λ1+ λ3+ λ5
q1,0=g1(t) e-(λ2+λ3+λ5)t
q1,2= λ2e-(λ2+λ3+λ5)t
G1 (t)
q1,4= λ3e-(λ2+λ3+λ5)t
G 1 (t)
q1,11= λ5e-(λ2+λ3+λ5)t
G 1 (t)
p1,0=g1*(λ2+ λ3+ λ5)
p1,2= λ2/ λ2+ λ3+ λ5{1-g1*( λ2+ λ3+ λ5)}
p1,4=λ3/ λ2+ λ3+ λ5{1-g1*( λ2+ λ3+ λ5)}
p1,11=λ5/ λ2+ λ3+ λ5{1-g1*( λ2+ λ3+ λ5)}
q2,0(t)= g2(t) p2,0=g2
*(0)
q3,0(t)= g3(t) e-(λ1+λ4+λ5)t
q3,4(t)= λ1e-(λ1+λ4+λ5)t
G3 (t)
q3,7(t)= λ4e-(λ1+λ4+λ5)t
G 3 (t)
q3,9(t)= λ5e-(λ1+λ4+λ5)t
G 3 (t)
p3,0=g3*( λ1+ λ4+ λ5)
p3,4=λ1/ λ1+ λ4+ λ5{1-g3*( λ1+ λ4+ λ5)}
p3,7=λ4/ λ1+ λ4+ λ5{1-g3*( λ1+ λ4+ λ5)}
p3,9=λ5/ λ1+ λ4+ λ5{1-g3*( λ1+ λ4+ λ5)}
q4,3(t)=g1(t) e-(λ2+λ4+λ5)t
q4,5(t)=λ4e-(λ2+λ4+λ5)t
G1 (t)
q4,6(t)=λ2e-(λ2+λ4+λ5)t
G1 (t)
q4,8(t)=λ5e-(λ2+λ4+λ5)t
G1 (t)
p4,3=g1*( λ2+ λ4+ λ5)
p4,5=λ4/ λ2+ λ4+ λ5{1-g1*( λ2+ λ4+ λ5)}
p4,6=λ2/ λ2+ λ4+ λ5{1-g1*( λ2+ λ4+ λ5)}
p4,8=λ5/ λ2+ λ4+ λ5{1-g1*( λ2+ λ4+ λ5)}
q5,4(t)=g4(t) p5,4=g4*(0)
q6,3(t)=g2(t) p6,3=g2*(0)
q7,3(t)=g4(t) p7,3=g4*(0)
q8,4(t)=g5(t) p8,4=g5*(0)
q9,3(t)=g5(t) p9,3=g5*(0)
q10,0(t)=g5(t) p10,0=g5*(0)
q11,1(t)=g5(t) p11,1=g5*(0)
It can be easily verified that
p0,1+p0,3+p0,10=1 , p1,0+p1,2+p1,4+p1,11=1 ,p2,0=1 ,p3,0+p3,4+p3,7+p3,9= 1
p4,3+p4,5+p4,6+p4,8= 1 ,p5,4= 1 ,p6,3=1 ,p7,3=1 ,p8,4=1 ,p9,3=1 ,p10,0=1 ,p11,1=1
Mean Sojourn Times:
Ri(t) : reliability of the system at time t, given that the system in regenerative state i.
: mean sojourn time spent in state i, before visiting any other states;
Nidhi Chaudhary, Pardeep Goel, Surender Kumar : - Developing the reliability model for availability and behaviour analysis of a distillery using Regenerative Point Graphical Technique
www.ijifr.com PAPER ID: IJIFR/V1/E3/014 IJIFR©2013
34
ISSN (Online):2347-1697 INTERNATIONAL JOURNAL OF INFORMATIVE AND FUTURISTIC RESEARCH ( IJIFR)
Volume -1 Issue -4, December 2013 Research Area: Mathematics, Page No. : 26-11
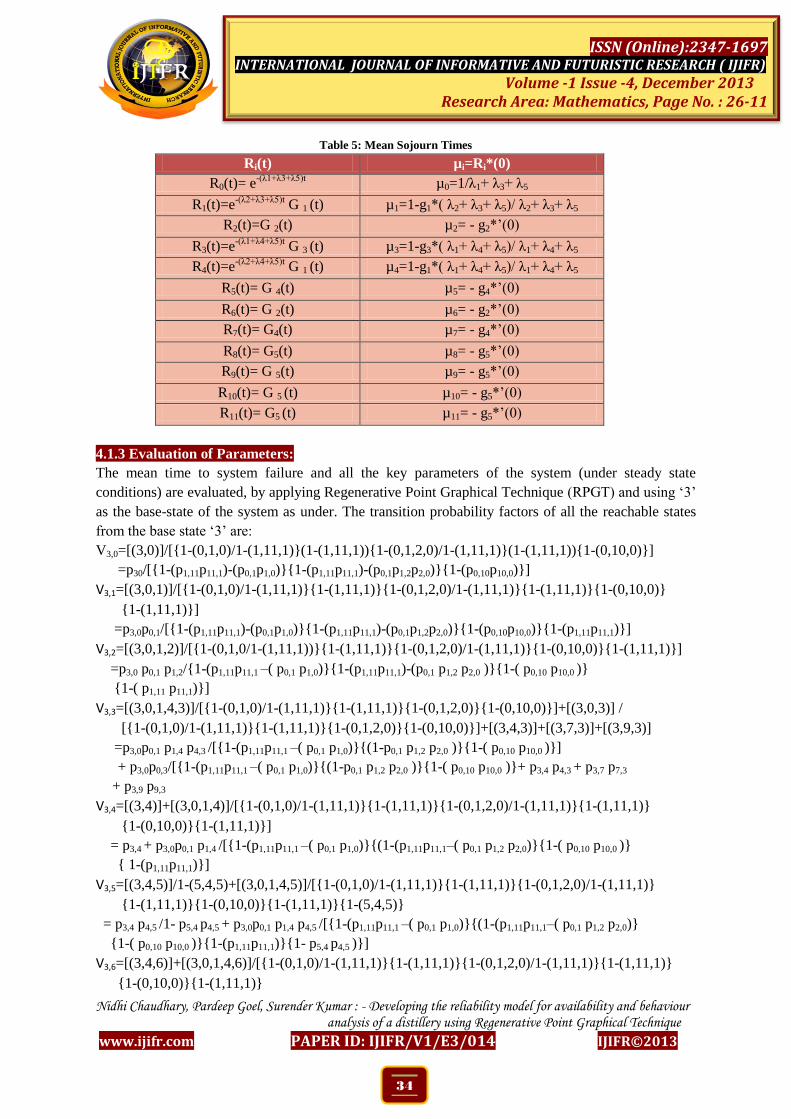
Table 5: Mean Sojourn Times
Ri(t) µi=Ri*(0)
R0(t)= e-(λ1+λ3+λ5)t
µ0=1/λ1+ λ3+ λ5
R1(t)=e-(λ2+λ3+λ5)t
G 1 (t) µ1=1-g1*( λ2+ λ3+ λ5)/ λ2+ λ3+ λ5
R2(t)=G 2(t) µ2= - g2*’(0)
R3(t)=e-(λ1+λ4+λ5)t
G 3 (t) µ3=1-g3*( λ1+ λ4+ λ5)/ λ1+ λ4+ λ5
R4(t)=e-(λ2+λ4+λ5)t
G 1 (t) µ4=1-g1*( λ1+ λ4+ λ5)/ λ1+ λ4+ λ5
R5(t)= G 4(t) µ5= - g4*’(0)
R6(t)= G 2(t) µ6= - g2*’(0)
R7(t)= G4(t) µ7= - g4*’(0)
R8(t)= G5(t) µ8= - g5*’(0)
R9(t)= G 5(t) µ9= - g5*’(0)
R10(t)= G 5 (t) µ10= - g5*’(0)
R11(t)= G5 (t) µ11= - g5*’(0)
4.1.3 Evaluation of Parameters:
The mean time to system failure and all the key parameters of the system (under steady state
conditions) are evaluated, by applying Regenerative Point Graphical Technique (RPGT) and using ‘3’
as the base-state of the system as under. The transition probability factors of all the reachable states
from the base state ‘3’ are:
V3,0=[(3,0)]/[{1-(0,1,0)/1-(1,11,1)}(1-(1,11,1)){1-(0,1,2,0)/1-(1,11,1)}(1-(1,11,1)){1-(0,10,0)}]
=p30/[{1-(p1,11p11,1)-(p0,1p1,0)}{1-(p1,11p11,1)-(p0,1p1,2p2,0)}{1-(p0,10p10,0)}]
V3,1=[(3,0,1)]/[{1-(0,1,0)/1-(1,11,1)}{1-(1,11,1)}{1-(0,1,2,0)/1-(1,11,1)}{1-(1,11,1)}{1-(0,10,0)}
{1-(1,11,1)}]
=p3,0p0,1/[{1-(p1,11p11,1)-(p0,1p1,0)}{1-(p1,11p11,1)-(p0,1p1,2p2,0)}{1-(p0,10p10,0)}{1-(p1,11p11,1)}]
V3,2=[(3,0,1,2)]/[{1-(0,1,0/1-(1,11,1))}{1-(1,11,1)}{1-(0,1,2,0)/1-(1,11,1)}{1-(0,10,0)}{1-(1,11,1)}]
=p3,0 p0,1 p1,2/{1-(p1,11p11,1 –( p0,1 p1,0)}{1-(p1,11p11,1)-(p0,1 p1,2 p2,0 )}{1-( p0,10 p10,0 )}
{1-( p1,11 p11,1)}]
V3,3=[(3,0,1,4,3)]/[{1-(0,1,0)/1-(1,11,1)}{1-(1,11,1)}{1-(0,1,2,0)}{1-(0,10,0)}]+[(3,0,3)] /
[{1-(0,1,0)/1-(1,11,1)}{1-(1,11,1)}{1-(0,1,2,0)}{1-(0,10,0)}]+[(3,4,3)]+[(3,7,3)]+[(3,9,3)]
=p3,0p0,1 p1,4 p4,3 /[{1-(p1,11p11,1 –( p0,1 p1,0)}{(1-p0,1 p1,2 p2,0 )}{1-( p0,10 p10,0 )}]
+ p3,0p0,3/[{1-(p1,11p11,1 –( p0,1 p1,0)}{(1-p0,1 p1,2 p2,0 )}{1-( p0,10 p10,0 )}+ p3,4 p4,3 + p3,7 p7,3
+ p3,9 p9,3
V3,4=[(3,4)]+[(3,0,1,4)]/[{1-(0,1,0)/1-(1,11,1)}{1-(1,11,1)}{1-(0,1,2,0)/1-(1,11,1)}{1-(1,11,1)}
{1-(0,10,0)}{1-(1,11,1)}]
= p3,4 + p3,0p0,1 p1,4 /[{1-(p1,11p11,1 –( p0,1 p1,0)}{(1-(p1,11p11,1–( p0,1 p1,2 p2,0)}{1-( p0,10 p10,0 )}
{ 1-(p1,11p11,1)}]
V3,5=[(3,4,5)]/1-(5,4,5)+[(3,0,1,4,5)]/[{1-(0,1,0)/1-(1,11,1)}{1-(1,11,1)}{1-(0,1,2,0)/1-(1,11,1)}
{1-(1,11,1)}{1-(0,10,0)}{1-(1,11,1)}{1-(5,4,5)}
= p3,4 p4,5 /1- p5,4 p4,5 + p3,0p0,1 p1,4 p4,5 /[{1-(p1,11p11,1 –( p0,1 p1,0)}{(1-(p1,11p11,1–( p0,1 p1,2 p2,0)}
{1-( p0,10 p10,0 )}{1-(p1,11p11,1)}{1- p5,4 p4,5 )}]
V3,6=[(3,4,6)]+[(3,0,1,4,6)]/[{1-(0,1,0)/1-(1,11,1)}{1-(1,11,1)}{1-(0,1,2,0)/1-(1,11,1)}{1-(1,11,1)}
{1-(0,10,0)}{1-(1,11,1)}
Nidhi Chaudhary, Pardeep Goel, Surender Kumar : - Developing the reliability model for availability and behaviour analysis of a distillery using Regenerative Point Graphical Technique
www.ijifr.com PAPER ID: IJIFR/V1/E3/014 IJIFR©2013
35
ISSN (Online):2347-1697 INTERNATIONAL JOURNAL OF INFORMATIVE AND FUTURISTIC RESEARCH ( IJIFR)
Volume -1 Issue -4, December 2013 Research Area: Mathematics, Page No. : 26-11
= p3,4 p4,6 + p3,0p0,1 p1,4 p4,6 /[{1-(p1,11p11,1 –( p0,1 p1,0)}{1-(p1,11p11,1–( p0,1 p1,2 p2,0)}
{1-( p0,10 p10,0 )}{1-(p1,11p11,1)}]
V3,7 = (3,7) = p3,7
V3,8=[(3,4,8)]/[1-(8,4,8)]+[(3,0,1,4,8)]/[{(1-(0,1,0)/1-(1,11,1))}{1-(1,11,1)}
{(1-(0,1,2,0)/1-(1,11,1))}{1-(1,11,1)}{1-(0,10,0}{1-(1,11,1)}{1-(8,4,8,)}]
= p3,4 p4,8/{1- p8,4 p4,8 }+ p3,0p0,1 p1,4 p4,8 /[{1-(p1,11p11,1 –( p0,1 p1,0)}
{1-(p1,11p11,1–( p0,1 p1,2 p2,0)}{1-( p0,10 p10,0 )}{1-(p1,11p11,1)}{1- p8,4 p4,8)}]
V3,9= (3,9) = p3,9
V3,10=(3,0,10)/[{(1-(0,1,0)/1-(1,11,1))}{1-(1,11,1)}{(1-(0,1,2,0)/1-(1,11,1))}{1-(1,11,1)}
{1-(0,10,0}{1-(1,11,1)}
= p3,0 p0,10 /[{1-(p1,11p11,1 –( p0,1 p1,0)}{1-( p1,11p11,1–( p0,1 p1,2 p2,0)}{1-( p0,10 p10,0 )}{1-(p1,11p11,1)}]
V3,11=(3,0,1,11)/[{1-(0,1,0)/1-(1,11,1)}{1-(1,11,1)}{1-(0,1,2,0)/1-(1,11,1)}{1-(1,11,1)}{1-(0,10,0}
{1-(1,11,1)}]
=p3,0p0,1p1,11/[{1-(p1,11p11,1–(p0,1p1,0)}{1-( p1,11p11,1–( p0,1 p1,2 p2,0)}{1-( p0,10 p10,0 )}{1-(p1,11p11,1)}]
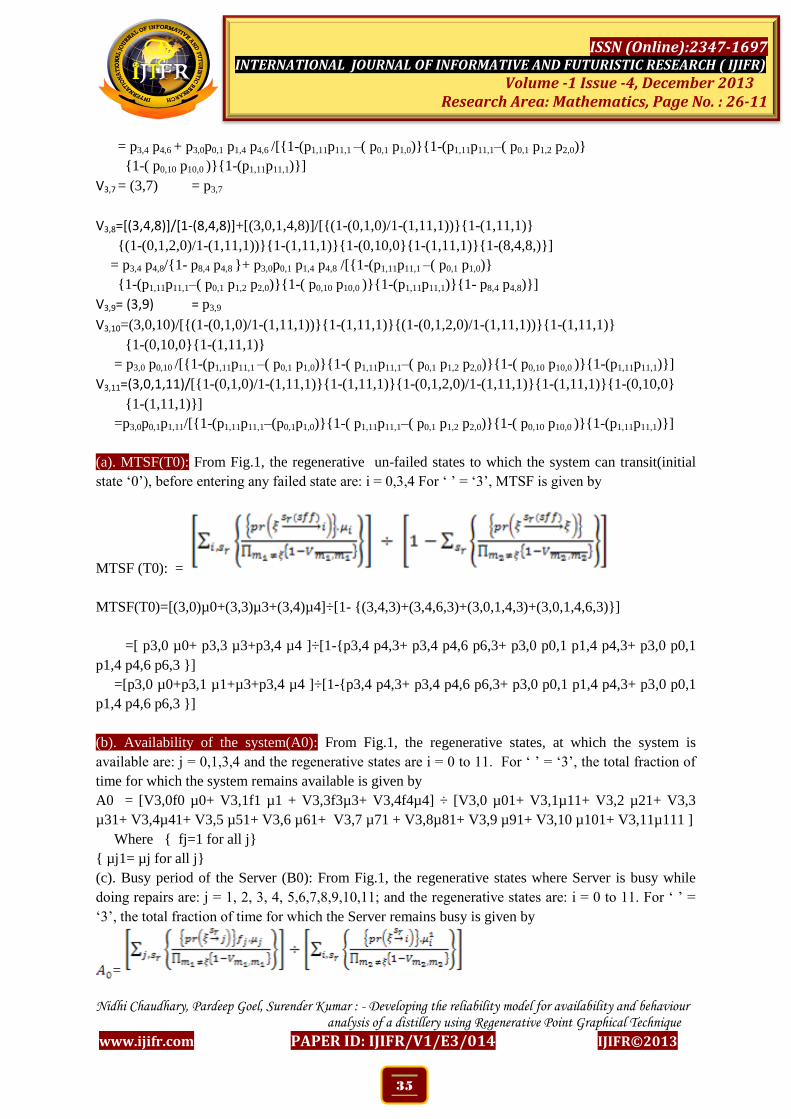
(a). MTSF(T0): From Fig.1, the regenerative un-failed states to which the system can transit(initial
state ‘0’), before entering any failed state are: i = 0,3,4 For ‘ ’ = ‘3’, MTSF is given by
MTSF (T0): =
MTSF(T0)=[(3,0)µ0+(3,3)µ3+(3,4)µ4]÷[1- {(3,4,3)+(3,4,6,3)+(3,0,1,4,3)+(3,0,1,4,6,3)}]
=[ p3,0 µ0+ p3,3 µ3+p3,4 µ4 ]÷[1-{p3,4 p4,3+ p3,4 p4,6 p6,3+ p3,0 p0,1 p1,4 p4,3+ p3,0 p0,1
p1,4 p4,6 p6,3 }]
=[p3,0 µ0+p3,1 µ1+µ3+p3,4 µ4 ]÷[1-{p3,4 p4,3+ p3,4 p4,6 p6,3+ p3,0 p0,1 p1,4 p4,3+ p3,0 p0,1
p1,4 p4,6 p6,3 }]
(b). Availability of the system(A0): From Fig.1, the regenerative states, at which the system is
available are: j = 0,1,3,4 and the regenerative states are i = 0 to 11. For ‘ ’ = ‘3’, the total fraction of
time for which the system remains available is given by
A0 = [V3,0f0 µ0+ V3,1f1 µ1 + V3,3f3µ3+ V3,4f4µ4] ÷ [V3,0 µ01+ V3,1µ11+ V3,2 µ21+ V3,3
µ31+ V3,4µ41+ V3,5 µ51+ V3,6 µ61+ V3,7 µ71 + V3,8µ81+ V3,9 µ91+ V3,10 µ101+ V3,11µ111 ]
Where { fj=1 for all j}
{ µj1= µj for all j}
(c). Busy period of the Server (B0): From Fig.1, the regenerative states where Server is busy while
doing repairs are: j = 1, 2, 3, 4, 5,6,7,8,9,10,11; and the regenerative states are: i = 0 to 11. For ‘ ’ =
‘3’, the total fraction of time for which the Server remains busy is given by
=

Nidhi Chaudhary, Pardeep Goel, Surender Kumar : - Developing the reliability model for availability and behaviour analysis of a distillery using Regenerative Point Graphical Technique
www.ijifr.com PAPER ID: IJIFR/V1/E3/014 IJIFR©2013
36
ISSN (Online):2347-1697 INTERNATIONAL JOURNAL OF INFORMATIVE AND FUTURISTIC RESEARCH ( IJIFR)
Volume -1 Issue -4, December 2013 Research Area: Mathematics, Page No. : 26-11
=
= [V3,0f0 µ0+ V3,1f1 µ1 + V3,3f3µ3+ V3,4f4µ4] ÷ [V3,0 µ01+
V3,1µ1
1+ V3,2 µ2
1+ V3,3 µ3
1+ V3,4µ4
1+ V3,5 µ5
1+ V3,6
µ61+ V3,7 µ7
1 + V3,8µ8
1+ V3,9 µ9
1+ V3,10 µ10
1+ V3,11µ11
1 ]
Where { fj=1 for all j}{ µj1= µj for all j}
(c). Busy period of the Server (B0): From Fig.1, the regenerative states where Server is busy while doing repairs
are: j = 1, 2, 3, 4, 5, 6, 7, 8, 9, 10, 11; and the regenerative states are: i = 0 to 11. For ‘’ = ‘3’, the total fraction
of time for which the Server remains busy is
=
=
(d). Expected number of Server’s visits: From Fig.1, the Regenerative States where the Server visits
(afresh) for repairs of the system are: j=1,3,10; the Regenerative States are: i = 0 to 11. For ‘’ = ‘3’,
the Expected number of Server’s Visits per unit time is given by
V1= =
V1 = [V3,1 +V3,3+ V3,10] ÷ [V3,0 µ01 + V3,1 µ11 + V3,2 µ21 + V3,3 µ31+ V3,4 µ41 + V3,5 µ51
+V3,6 µ61 + V3,7 µ71 + V3,8 µ81 + V3,9 µ91+ V3,10 µ101 + V3,11 µ111 ]
5 Particular Case
Let us take;
g1(t)= ω1e-ω
1t, g2(t)= ω2e
-ω2
t, g3(t)= ω3e
-ω3
t, g4(t)= ω4e
-ω4
t, g5(t)= ω5e
-ω5
t
we have,
p0,1= λ1/ λ1+λ3+ λ5, p0,3= λ3/ λ1+λ3+ λ5, p0,10 = λ5/ λ1+λ3+ λ5, p1,0= ω1/ ω1+
λ2+λ3+ λ5, p1,2= λ2 /ω1+ λ2+λ3+ λ5, p1,4= λ3 /ω1+ λ2+λ3+ λ5, p1,11= λ5/ω1+ λ2+λ3+ λ5, p2,0=1,
p3,0= ω3/ ω3+ λ1+λ4+ λ5, p3,4= λ1/ω3+ λ1+λ4+ λ5, p3,7= λ4/ω3+ λ1+λ4+ λ5, p3,9== λ5/ω3+ λ1+λ4+ λ5 ,
p4,3= ω1/ω1+ λ2+λ4+ λ5, p4,5= λ4/ ω1+ λ2+λ4+ λ5 , p4,6= λ2/ ω1+ λ2+λ4+ λ5, p4,8= λ5/ ω1+ λ2+λ4+
λ5, p5,4 =1, p6,3 =1, p7,3 = 1, p8,4 = 1, p9,3 = 1, p10,0 = 1, p11,1 = 1
µ0 = 1/λ1+λ3+λ5, µ1= 1/ω1+λ2+λ3+λ5, µ2= 1/ω2, µ3=1/ω3+λ1+λ4+λ5, µ4=1/ω1+λ1+λ4+λ5, µ5=1/ω4, µ6=1/ω2 ,
µ7=1/ω4 , µ8=1/ω5 , µ9=1/ω5 , µ10=1/ω5 , µ11=1/ω5
By using these results, we get the following:
MTSF(T0)= [ω3(ω1+λ1+λ4+ λ5)+(ω1+ λ1+λ4+ λ5)( λ1+λ3+ λ5)+ λ1(λ1+λ3+ λ5)](ω1+ λ2+λ3+ λ5)(ω1+ λ2+λ4+ λ5)
÷ [λ1 ω1(ω1+ λ2+λ3+ λ5)( λ1+λ3+ λ5)+ λ1 λ2(ω1+ λ2+λ3+ λ5)( λ1+λ3+ λ5)+ ω1ω3 λ1 λ3+ ω3 λ1 λ2 λ3] (ω1+ λ1+λ4+
λ5)

Nidhi Chaudhary, Pardeep Goel, Surender Kumar : - Developing the reliability model for availability and behaviour analysis of a distillery using Regenerative Point Graphical Technique
www.ijifr.com PAPER ID: IJIFR/V1/E3/014 IJIFR©2013
37
ISSN (Online):2347-1697 INTERNATIONAL JOURNAL OF INFORMATIVE AND FUTURISTIC RESEARCH ( IJIFR)
Volume -1 Issue -4, December 2013 Research Area: Mathematics, Page No. : 26-11
Availability (A0) = [[(ω1+λ2+λ3+ λ5)( λ1+λ3+λ5)-λ5(λ1+λ3+ λ5)- λ1ω1]
[(ω1+λ2+λ3+λ5)(λ1+λ3+λ5)-λ5(λ1+λ3+λ5)-λ1λ2](λ1+λ3)[ω2λ1(ω1+λ2+λ3)
+(ω3+λ1+λ4+λ5){λ1ω1+(λ4+λ5)(ω1+λ2+λ4+λ5)}]+ω3λ3(ω1+λ2+λ3+λ5)(λ1+λ3+λ5)2
[ω1ω2λ1+ω2(ω1+λ2+λ3+λ5)(ω1+λ2+λ4+λ5)+ω2λ1(ω1+λ2+λ3+λ5)]+[ω2(ω1+λ2+λ3)+ω2λ1+λ1λ2
(ω3+λ1+λ4+λ5)](ω3+λ1+λ4+λ5)((ω1+λ2+λ3+λ5)](ω1+λ2+λ4)((ω1+λ2+λ5)÷[(ω1+λ2+λ3+λ5)
(λ1+λ3+λ5)-λ5(λ1+λ3+λ5)-λ1ω1][(ω1+λ2+λ3+λ5)(λ1+λ3+λ5)-λ5(λ1+λ3+λ5)-λ1λ2] (λ1+λ3)[{(ω1+λ2+λ3)
{λ1λ4ω2(ω1+λ2+λ4+λ5)+λ1λ2ω4(ω1+λ2+λ5)}ω5(ω1+λ2+λ4)+λ5ω2ω4(ω1+λ2+λ5)
(ω1+λ2+λ4+λ5)}+ω2{λ1(ω1+λ2+λ3)+(ω3+λ1+λ4+λ5)λ1ω1+(λ4+λ5)(ω1+λ2+λ4+λ5)}]
+ω3λ3(ω1+λ2+λ3+λ5)(λ1+λ3+λ5)2[{ω1λ1+(ω1+λ2+λ3+λ5)(ω1+λ2+λ4+λ5)}ω2+ω2λ1(ω1+λ2+λ3+λ5)]
(ω1+λ2+λ4)(ω1+λ2+λ5)+[ω2(ω1+λ2+λ3)+ω2λ1+λ1λ2(ω3+λ1+λ4+λ5)(ω1+λ2+λ4+λ5)(ω1+λ2+λ4)
(ω1+λ2+λ5)+[(λ4ω5+λ5ω4)ω2(ω1+λ2+λ5)(ω1+λ2+λ4)(ω1+λ2+λ4+λ5)](ω3+λ1+λ4+λ5)ω4ω5+ω3)
(ω1+λ2+λ3+λ5)2(λ1+λ3+λ5)
2(ω1+λ2+λ4)[λ1λ3ω5{λ4ω2(ω1+λ2+λ4+λ5)+λ2ω4(ω1+λ2+λ5)
+λ5ω2ω4{λ1+(ω1+λ2+λ3+λ5)}(ω1+λ2+λ5)(ω1+λ2+λ4+λ5)
Busy period of the Server (B0 )=
[ω2ω3ω4λ1λ3(ω1+λ2+λ5)(ω1+λ2+λ4)(ω1+λ2+λ4+λ5)(λ3ω5+λ5(ω1+λ1+λ4+λ5))+ω3ω5λ1λ3
(ω1+λ1+λ4+λ5)(ω1+λ2+λ4)(ω2λ4(ω1+λ2+λ4+λ5)+ω4λ2(ω1+λ2+λ5))+ω2ω3ω4λ5(ω1+λ1+λ4+λ5)
(ω1+λ2+λ5)(ω1+λ2+λ4+λ5)(λ1λ3+ω1+λ2+λ4)+ω3(ω1+λ2+λ4+λ5){ω2λ1+λ1λ2(ω1+λ1+λ4+λ5)}]
(ω1+λ2+λ3+λ5)2(λ1+λ3+λ5)
2(ω3+λ1+λ4+λ5){(ω1+λ2+λ3+λ5)(λ1+λ3+λ5)-λ1λ2}+[λ1ω5(ω1+λ2+λ4)
{(ω1+λ2+λ5)(ω1+λ2+λ4+λ5)ω2ω4+λ4ω2(ω1+λ2+λ4+λ5)(ω1+λ1+λ4+λ5)+λ2ω4(ω1+λ1+λ4+λ5)
(ω1+λ2+λ5)}+ω2(ω1+λ1+λ4+λ5)(ω1+λ2+λ5)(ω1+λ2+λ4+λ5){λ4ω5(ω1+λ2+λ4)+λ5ω4
(λ1+ω1+λ2+λ4)}(ω3+λ1+λ4+λ5)(ω1+λ2+λ4+λ5)+{λ1ω1+(λ4+λ5)(ω1+λ2+λ4+λ5)}ω2] {(ω1+λ2+λ3+λ5)(λ1+λ3+λ5)-
λ5(λ1+λ3+λ5)-λ1ω1}{(ω1+λ2+λ3+λ5)(λ1+λ3+λ5)-λ5(λ1+λ3+λ5)-λ1λ2}
{ω1+λ2+λ3}{λ1+λ3}{(ω1+λ2+λ3+λ5)(λ1+λ3+λ5)-λ1λ2}÷[ω2ω3ω4λ1λ3(ω1+λ2+λ5)(ω1+λ2+λ4)
(ω1+λ2+λ4+λ5)(λ3ω5+λ5(ω1+λ1+λ4+λ5))+ω3ω5λ1λ3(ω1+λ1+λ4+λ5)(ω1+λ2+λ4)
(ω2λ4(ω1+λ2+λ4+λ5)+ω4λ2(ω1+λ2+λ5))+ω2ω3ω4λ5(ω1+λ1+λ4+λ5)(ω1+λ2+λ5)(ω1+λ2+λ4+λ5)
(λ1λ3+ω1+λ2+λ4)+ω3(ω1+λ2+λ4+λ5){(ω1+λ2+λ3)ω2+ω2λ1+λ1λ2(ω1+λ1+λ4+λ5)}](ω1+λ2+λ3+λ5)2
(λ1+λ3+λ5)2(ω3+λ1+λ4+λ5){(ω1+λ2+λ3+λ5)(λ1+λ3+λ5)-λ1λ2}+[λ1ω5(ω1+λ2+λ4){(ω1+λ2+λ5)
(ω1+λ2+λ4+λ5)ω2ω4+λ4ω2(ω1+λ2+λ4+λ5)(ω1+λ1+λ4+λ5)+λ2ω4(ω1+λ1+λ4+λ5)(ω1+λ2+λ5)}+ω2
(ω1+λ1+λ4+λ5)(ω1+λ2+λ5)(ω1+λ2+λ4+λ5){λ4ω5(ω1+λ2+λ4)+ λ5ω4(λ1+ω1+λ2+λ4)}(ω3+λ1+λ4+λ5)
(ω1+λ2+λ4+λ5)+{λ1ω1+(λ4+λ5)(ω1+λ2+λ4+λ5)}ω2]{(ω1+λ2+λ3+λ5)(λ1+λ3+λ5)-λ5(λ1+λ3+λ5)-
λ1ω1}{(ω1+λ2+λ3+λ5)(λ1+λ3+λ5)-λ5(λ1+λ3+λ5)-λ1λ2}{ω1+λ2+λ3}{λ1+λ3}{(ω1+λ2+λ3+λ5) (λ1+λ3+λ5)-λ1λ2}
Number of server’s visits (V0) =
[ω3(λ1+λ3+λ5)2(ω1+λ2+λ3+λ5)[(ω1+λ2+λ3+λ5)
2(λ1+λ5){(ω1+λ2+λ3+λ5)(λ1+λ3+λ5)-λ1λ2}+λ3
{ω1λ1+(ω1+λ2+λ3+λ5)(ω1+λ2+λ4+λ5)}(ω1+λ2+λ3){(ω1+λ2+λ3+λ5)(λ1+λ3+λ5)-λ5(λ1+λ3+λ5)-
λ1λ2}]+[{ω1λ1+(λ4+λ5)(ω1+λ2+λ4+λ5)}{(ω1+λ2+λ3+λ5)(λ1+λ3+λ5)-λ5(λ1+λ3+λ5)-λ1λ2}{λ1+λ3}
{ω1+λ2+λ3}{(ω1+λ2+λ3+λ5)(λ1+λ3+λ5)-λ5(λ1+λ3+λ5)-λ1ω1}{(ω1+λ2+λ3+λ5)(λ1+λ3+λ5)-λ1λ2}]]
(ω3+λ1+λ4+λ5)(ω1+λ1+λ4+λ5)(ω1+λ2+λ5)(ω1+λ2+λ4+λ5)(ω1+λ2+λ4)ω2ω4ω5÷
[ω2ω3ω4λ1λ3(ω1+λ2+λ5)(ω1+λ2+λ4)(ω1+λ2+λ4+λ5)(λ3ω5+λ5(ω1+λ1+λ4+λ5))+ω3ω5λ1λ3
(ω1+λ1+λ4+λ5)(ω1+λ2+λ4)(ω2λ4(ω1+λ2+λ4+λ5)+ω4λ2(ω1+λ2+λ5))+ω2ω3ω4λ5(ω1+λ1+λ4+λ5)
(ω1+λ2+λ5)(ω1+λ2+λ4+λ5)(λ1λ3+ω1+λ2+λ4)+ω3(ω1+λ2+λ4+λ5){(ω1+λ2+λ3)ω2+ω2λ1+λ1λ2
(ω1+λ1+λ4+λ5)}](ω1+λ2+λ3+λ5)2(λ1+λ3+λ5)
2(ω3+λ1+λ4+λ5){(ω1+λ2+λ3+λ5)(λ1+λ3+λ5)-
λ1λ2}+[λ1ω5(ω1+λ2+λ4){(ω1+λ2+λ5)(ω1+λ2+λ4+λ5)ω2ω4+λ4ω2(ω1+λ2+λ4+λ5)(ω1+λ1+λ4+λ5)
+λ2ω4(ω1+λ1+λ4+λ5)(ω1+λ2+λ5)}+ω2(ω1+λ1+λ4+λ5)(ω1+λ2+λ5)(ω1+λ2+λ4+λ5){λ4ω5(ω1+λ2+λ4)+
λ5ω4(λ1+ω1+λ2+λ4)}(ω3+λ1+λ4+λ5)(ω1+λ2+λ4+λ5)+{λ1ω1+(λ4+λ5)(ω1+λ2+λ4+λ5)}ω2]{(ω1+λ2+λ3+λ5)(λ1+λ3+λ5

Nidhi Chaudhary, Pardeep Goel, Surender Kumar : - Developing the reliability model for availability and behaviour analysis of a distillery using Regenerative Point Graphical Technique
www.ijifr.com PAPER ID: IJIFR/V1/E3/014 IJIFR©2013
38
ISSN (Online):2347-1697 INTERNATIONAL JOURNAL OF INFORMATIVE AND FUTURISTIC RESEARCH ( IJIFR)
Volume -1 Issue -4, December 2013 Research Area: Mathematics, Page No. : 26-11
)-λ5(λ1+λ3+λ5)-λ1ω1}{(ω1+λ2+λ3+λ5)(λ1+λ3+λ5)-λ5(λ1+λ3+λ5)-λ1λ2}{ω1+λ2+λ3}{
λ1+λ3}{(ω1+λ2+λ3+λ5)(λ1+λ3+λ5)-λ1λ2}
6 Analytical Discussions: The following tables, graphs and conclusions are obtained for:
λ1 = λ2= λ3= λ4= λ5= λ , ω1= ω2= ω3= ω4= ω4 = ω
(A) MTSF vs. Repair Rate:
The MTSF of the system is calculated for different values of the Failure Rate (λ) by taking λ=0.0005,
0.0006, 0.0007, 0.0008, 0.0009 and 0.0010 and for different values of the Repair Rate(ω) by taking
ω=0.80,0.85,0.90,0.95 and 1.00 .The data so obtained are shown in Table 6 and Graphically in fig.2
Table: 6: The data obtained from evaluation
λ T0
(ω=0.80)
T0 (ω=0.85) T0 (ω=0.90) T0 (ω=0.95) T0 (ω=1.00)
0.0005 809178.686 814732.000 861805.426 942141.816 1006014.270
0.0006 558512.905 591508.764 631306.077 699458.715 751551.648
0.0007 379730.524 479285.508 578840.492 678506.054 714567.8903
0.0008 252948.263 365715.9791 469245.789 56782.5698 699456.0987
0.0009 126150.052 240046.1222 345367.879 456784.4532 56345.6543
0.001 112345.890 127676.5936 23462.9876 32451.5642 44673.6754
Table 6 shows the behaviour of the MTSF(T0) vs. the repair rate(ω) of the unit of the system for
different values of the failure rate (λ).It is concluded that MTSF increases with increase in the values
of the repair rate(ω).
0
200000
400000
600000
800000
1000000
1200000
0.8 0.85 0.9 0.95 1
MTS
F(T0)
REPAIR RATE(ω)
MTSF GRAPH
T0(λ=0.0005)
T0((λ=0.0007)
Figure 2: MTSF Graph
Further it can be concluded from the fig.3 that values of MTSF( T0) shows the expected trend for
different values of failure rate(λ=0.0005 & 0.0006),as T0 increases in the values of repair rate(ω).
(B)Availability(A1) vs. the Repair Rate(ω) &failre rate :

Nidhi Chaudhary, Pardeep Goel, Surender Kumar : - Developing the reliability model for availability and behaviour analysis of a distillery using Regenerative Point Graphical Technique
www.ijifr.com PAPER ID: IJIFR/V1/E3/014 IJIFR©2013
39
ISSN (Online):2347-1697 INTERNATIONAL JOURNAL OF INFORMATIVE AND FUTURISTIC RESEARCH ( IJIFR)
Volume -1 Issue -4, December 2013 Research Area: Mathematics, Page No. : 26-11
The Availability of the system is calculated for different values of the failure rate (λ) by taking λ
=0.0005, 0.0006, 0.0007, 0.0008, 0.0009 and 0.001 and for different values of the repair rate (ω) by
taking ω =0.80, 0.85, 0.90, 0.95 and1.0.The data so obtained are shown in table 7 and graphically in
fig.3 Table 7: The behaviour of the Availability (A0) vs. the Repair rate (ω) of the unit of the system for different values of
the failure rate (λ).
λ A0 (ω=0.80) A0 (ω=0.85) A0 (ω=0.90) A0 (ω=0.95) A0 (ω=1.00)
0.0005 0.4147411 0.5278114 0.66573563 0.7800141 0.99308441
0.0006 0.41422548 0.52755351 0.66420895 0.77848596 0.99157184
0.0007 0.41271037 0.52656525 0.66268337 0.77696039 0.99004626
0.0008 0.40919573 0.52431836 0.66121781 0.77544480 0.98852072
0.0009 0.40968062 0.5223305 0.65975255 0.77394253 0.98700848
0.001 0.40816598 0.52008361 0.62570068 0.76789092 0.98548293
Table shows the behaviour of the Availability (A0) vs. the Repair rate (ω) of the unit of the system for
different values of the failure rate (λ).It is concluded that Availability (A0) increases with increase in
the values of the Repair rate (ω) and decreases with the increase in failure rates.
Figure 3: Availability Graph
Further it can be concluded from the fig.3 that values of availability( A0) shows the expected trend
for different values of failure rate(λ=0.0005 & 0.0007),as A0 increases in the values of repair rate(ω).
6 Conclusion:
From the Graphs and Tables, we see that as the Repair Rate (ω) increases, Availability of the
system increases, which would be. The Regenerative-Point Graphical Technique is useful for
the evaluation of the parameters in a simple way, without writing any state equation and
without doing any lengthy and cumbersome calculations. This study can be extended to time
dependent case. As it is easy for the management to control repair rates in comparison to
Nidhi Chaudhary, Pardeep Goel, Surender Kumar : - Developing the reliability model for availability and behaviour analysis of a distillery using Regenerative Point Graphical Technique
www.ijifr.com PAPER ID: IJIFR/V1/E3/014 IJIFR©2013
40
ISSN (Online):2347-1697 INTERNATIONAL JOURNAL OF INFORMATIVE AND FUTURISTIC RESEARCH ( IJIFR)
Volume -1 Issue -4, December 2013 Research Area: Mathematics, Page No. : 26-11
failure rates, fixing the target of availability repair rates can be determined and managed by
having efficient server.
7 References:
[1] Gupta, V. K. Singh & Vanita (2010), ‘ The New Concept of Base State in the Reliability Analysis’; Journal
of Mathematics and System Science (JMASS), Vol. 6, No. 2.
[2] Jindal, G. (2012), ‘Behavior and Availability Analysis of Some Industrial Systems’; Ph.D. Thesis, JJTU
(Jhunjhunu).
[3] Goel, P. & Singh, J. (1995), ‘Availability Analysis of a Stand-by Complex System Having Imperfect
Switch.’ Microelectronics and Relief, Vol. 35, No. 2 pp 285-288.
[4] Gupta, V. K. & Singh, J. (2007), ‘A New Approach for Availability Analysis’; IEEF transitions on
reliability, Tr 2007-107.
[5] Gupta, V. K (2008), ‘Behavior and Profit Analysis of Some Process Industries’; Ph.D. Thesis, NIT
Kurukshetra (India).
[6] Nidhi, Goel & Garg discussed Availability Analysis of a Soap Industry Using Regenerative Point Graphical
Technique (RPGT) Vol. 1 Issue 2, October, 2013 IJIFR, ISSN: 2347-1697.