Embed Size (px)
Citation preview
Eduproxima: Jurnal Ilmiah Pendidikan IPA http://jurnal.stkippgritulungagung.ac.id/index.php/eduproxima
EDUPROXIMA 3 (1) (2021) 50-64 50
DEVELOPING THE TWO-TIER MULTIPLE CHOICE TESTS IN
ENHANCING STUDENTS’ HIGHER-ORDER THINKING SKILLS ON
HUMAN DIGESTIVE SYSTEM
Muhammad Jamhari
SMA Unggulan CT Foundation Deli Serdang
Email: [email protected]
ABSTRACT
The aim of this study was to develop the two-tier multiple choice tests based on two indicators of higher-order
thinking skills); level C4 and level C5. The subjects were: (1) an expert who validated the contents; (2) an
expert who validated the constructs; (3) an expert who validated the items’ readability; and (4) eleventh graders.
This was an R&D study adopted from Borg & Gall model. The results showed that: (1) validation of the
contents indicated the mean score of 3.67 (very feasible category); (2) validation of the constructs indicated the
mean score of 3.67 (very feasible category); (3) validation of the readability indicated the mean score of 3.50
(very feasible category); and (4) the students’ responses indicated that the tests were very good in small group
tests of 93%. It was concluded that the two-tier multiple choice tests were very feasible in enhancing students’
higher-order thinking skills.
Keywords : Two-tier multiple choice tests, higher-order thinking skills, R&D
INTRODUCTION
Biology learning is a science learning that
requires investigation or experimentation
as part of scientific work. Scientific work
emphasizes students to think creatively,
critically, analytically, and divergently as
well (BSNP, 2012). The ability of students
to think critically and creatively is
included in the form of higher-order
thinking skills. The importance of
mastering higher-order thinking skills is
contained in several points of the High
School Graduate Competency Standards.
The expected points are that students can
build and apply information or knowledge
logically, critically, creatively, and
innovatively; demonstrate the ability to
think logically, critically, creatively, and
innovatively in decision making; and
demonstrate the ability to analyze and
solve many complex problems
(Permendiknas, 2006).
The lower-order thinking ability of
students is one of the problems of
education in Indonesia. This can be seen
from the results of international studies,
TIMSS (Trends in Mathematics and
Science Study). There are three aspects of
cognitive abilities measured by TIMSS;
knowing, applying and analyzing. The
results of the study published by TIMSS in
2015 shows that the scores achieved by
Indonesian students are still below the
international mean score of 500. Indonesia
is still ranked 45th out of 48 participating
countries with a mean score of 397
(Mullis, et al., 2016). Likewise with the

Eduproxima: Jurnal Ilmiah Pendidikan IPA http://jurnal.stkippgritulungagung.ac.id/index.php/eduproxima
EDUPROXIMA 3 (1) (2021) 50-64 51
results of studies for science conducted by
the PISA (Program for International
Student Assessment) in the last two years
2012 and 2015, according to the
Organization for Economic Cooperation
and Development (OECD) Indonesia is
ranked 64th out of 65 participating
countries with a score of 382 in 2012, with
an international mean score of 500, while
in 2015 the mean score of Indonesian
students’ achievement for science was
ranked 62 out of 70 participating countries
with a score of 403, meaning that the
ability of students in Indonesia is still low
compared to other countries and is below
the international average level (OECD,
2015).
The formative test that teachers
often use in schools is the traditional
assessment (written test) in the form of
multiple choices, because the assessment
of the questions is more objective and the
scoring is easy. But the likelihood of
students guessing answers or answering
questions by chance is very large. Multiple
choice questions are also unable to
measure higher cognitive abilities
(Purwanto, 2010). One form of test that
can overcome this problem is the two-tier
multiple choice test (TTMC). TTMC is a
diagnostic test that was first developed by
David F. Treagust in 1988 which was later
developed again in 2006. TTMC is a two-
tier multiple choice, where the first level
contains questions about the concept being
tested while the second level contains the
reasons for each answer to the questions at
the first level as a form of diagnostic test
(Treagust, 2006).
The study that has been conducted
by Tuysuz (2009) shows that many
students only memorize the subject matter,
where the level of student learning occurs
in the low-level cognitive domain so they
are unable to deal with two-tier multiple
choice tests that require higher-order
thinking skills. Students can also easily
guess the answer in traditional multiple
choice questions with 5 answer choice
options and the probability of guessing the
correct answer is 20%. But in the two-tier
multiple choice tests, it is 4%, ordinary
students face the test in the traditional
multiple choice tests so that students learn
problem-solving techniques rather than
studying the subject of the exam. These
results were obtained from research
conducted to the ninth grade students by
giving 15 two-tier multiple choice items to
141 students, it was seen that the mean
score of the traditional multiple choice
tests (X=9.40) was higher than the mean
score of two-tier multiple choice tests
(X=5.48), this showed that students were
more successful in traditional multiple
choice tests due to guessing the answers
easily and committing the plagiarism.
Halaydina & Downing (1989) and
Treagust (2006) suggested that one of the
advantages of the two-tier multiple choice
tests is that it can measure students’
cognitive abilities at a higher level (higher-
order thinking skills). The two-tier
multiple choice tests can be used to test
students’ understanding and identify
students’ higher-order thinking skills.
Cullinane (2011) suggested that the
inclusion of reasons at the second level can
be used to improve higher-order thinking
skills and see students’ ability to give
reasons. In addition, the inclusion of
reasons at the second level of these
questions can be used to reduce the chance
of a chance answer which is often a
weakness of the regular multiple choice
questions. Assessment of objective, easy,
and fast questions is an advantage of two-
tier multiple choice tests compared to
Eduproxima: Jurnal Ilmiah Pendidikan IPA http://jurnal.stkippgritulungagung.ac.id/index.php/eduproxima
EDUPROXIMA 3 (1) (2021) 50-64 52
other high-order thinking skills, for
example essay questions. The two-tier
multiple choice assessment model has
proven to be very successful in educational
settings (Boo, 2002; Boo & Ang, 2005;
Adodo, 2013).
The results of the TIMSS, PISA as
well as several studies of other researchers
indicated that the higher-order thinking
skills of Indonesian students are still pretty
low. Likewise, interviews with teachers
and preliminary observations that have
been carried out at SMA Unggulan CT
Foundation Deli Serdang where 40
multiple choice items in the midterm exam
have a composition of instruments at
levels C1 (24%), C2 (38%), C3 (18%) and
C4 (20%), respectively. Bloom’s cognitive
domain and only 16.5% of students were
able to correctly answer three C4 items out
of 40 items, whereas ideally 85% of the
formative tests carried out by teachers
should include higher-order thinking skills
(C4-C6).
This has shown the minimal use of
test instruments to reveal students’ higher-
order thinking skills, it shows that students
do not have the ability to solve non-routine
problems or questions that are required to
think higher. Given the challenges of
improving the quality of education in
various aspects of life, it is very important
to instill and improve students’ higher-
order thinking skills. This can be achieved
if education in schools is directed not only
to the ability to memorize and understand
scientific concepts, but also to increase the
students’ abilities and thinking skills,
especially their high-order thinking skills.
The test used to measure students’ higher-
order thinking skills can use assessment
types such as modified multiple choice.
According to Ramirez & Ganaden (2006),
one of the modified multiple choice
alternatives that can be used to measure
higher-order thinking skills is a two-tier
multiple choice test.
Therefore, it is necessary to
develop a two-tier multiple choice test
which can enhance students’ higher-order
thinking skills in order to create a good
learning environment even students can
find their own knowledge or an answer by
constructing the knowledge they have
acquired. A good test will help students
construct their knowledge, because the test
does not only measure student
achievement but it must be able to be a
good learning tool for students, with the
right test will help students master
learning. With TTMC, higher-order
thinking skills will be increasingly
stimulated to grow rapidly and without
using TTMC in the learning process, a
student will find it difficult to have the
higher-order thinking skills in the learning
process.
METHOD
This study was conducted from September
to November 2019 in SMA Unggulan CT
Foundation Deli Serdang for the eleventh
grade students. This was a Research and
Development study adopted with Borg &
Gall model. This instrument was
developed based on the needs analysis to
evaluate and measure students’ higher-
order thinking skills. In developing the
test, the researcher adapted it based on the
Borg & Gall R&D model on the grounds
that the development design has the aim of
developing and validating the product
(Borg & Gall, 1987).
Eduproxima: Jurnal Ilmiah Pendidikan IPA http://jurnal.stkippgritulungagung.ac.id/index.php/eduproxima
EDUPROXIMA 3 (1) (2021) 50-64 53
The development of the test
consisted of several stages; (1) problem
identification (analyzing problems and
needs/gathering information: reviewing the
literature, observing test instruments, and
identifying problems); (2) planning
(planning of test development for eleventh
grade students); (3) developing the
preliminary form of the product with the
Borg & Gall model); (4) preliminary field
tests (initial field tests); (5) product
revision (revision of tests based on
experts); (6) field tests (wider field tests);
(7) product revision (revision based on
references to suggestions, criticism, and
previous assessments); (8) main field tests
(final field tests); and (9) revision (revision
or improvement if necessary). Testing the
instrument that has been developed was
carried out in three stages; individual tests,
small group tests, and field tests (large-
scale tests).
The design of the two-tier multiple
choice tests consisted of several stages; (1)
conducting the needs analysis and
interviews (Stage I); (2) developing the
initial form of the product, validating the
contents, constructs, and readability by the
experts (Stage II); (3) initial field tests (10
students); (4) revision of development
(Stage III); (5) wider field tests (30
students); (6) revision of development
(Stage IV); (7) final product/field tests; (8)
revision if necessary (Stage V); and (9)
identification of students’ higher-order
thinking skills (Stage VI).
The results of the two-tier multiple
choice tests obtained in the first tests will
be used to test the item validity, reliability,
and analysis of the TTMC. The scoring
criteria refers to Tuysuz’s (2009) scoring
criteria.
According to Tuysuz (2009), the
types of student answers were then
categorized based on the types of students’
answers at each question tier. Students’
answers were categorized as in Table 1.
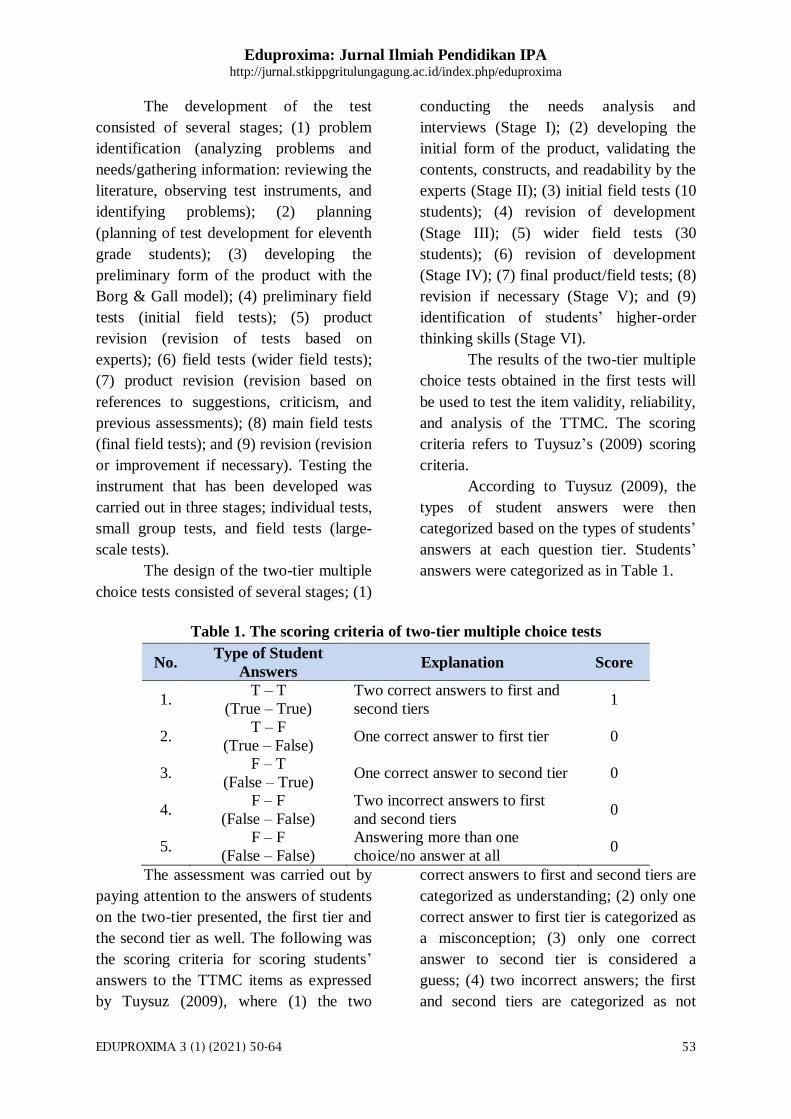
Table 1. The scoring criteria of two-tier multiple choice tests
No. Type of Student
Answers Explanation Score
1. T – T
(True – True)
Two correct answers to first and
second tiers 1
2. T – F
(True – False) One correct answer to first tier 0
3. F – T
(False – True) One correct answer to second tier 0
4. F – F
(False – False)
Two incorrect answers to first
and second tiers 0
5. F – F
(False – False)
Answering more than one
choice/no answer at all 0
The assessment was carried out by
paying attention to the answers of students
on the two-tier presented, the first tier and
the second tier as well. The following was
the scoring criteria for scoring students’
answers to the TTMC items as expressed
by Tuysuz (2009), where (1) the two
correct answers to first and second tiers are
categorized as understanding; (2) only one
correct answer to first tier is categorized as
a misconception; (3) only one correct
answer to second tier is considered a
guess; (4) two incorrect answers; the first
and second tiers are categorized as not

Eduproxima: Jurnal Ilmiah Pendidikan IPA http://jurnal.stkippgritulungagung.ac.id/index.php/eduproxima
EDUPROXIMA 3 (1) (2021) 50-64 54
understanding; (5) answering more than
one choice/no answer is categorized as not
understanding.
The score of students’ higher-order
thinking skills is the total score obtained
by the students when completing the
higher-order thinking test items. The final
grades obtained by students are:
𝑇ℎ𝑒 𝑡𝑜𝑡𝑎𝑙 𝑠𝑐𝑜𝑟𝑒 𝑜𝑏𝑡𝑎𝑖𝑛𝑒𝑑
𝑀𝑎𝑥𝑖𝑚𝑢𝑚 𝑠𝑐𝑜𝑟𝑒 𝑥 100% (1)
The data results of ability test is
analyzed to determine the category of
students’ higher-order thinking skills. The
category of students’ higher-order thinking
abilities is determined as in Table 2.
Table 2. The category of students’ higher-order thinking skills
Students’ Scores Level of Students’ HOTS
80 < score ≤ 100 Very Good
60 < score ≤ 80 Good
40 < score ≤ 60 Satisfactory
20 < score ≤ 40 Poor
0 ≤ score ≤ 20 Very Poor
According to Purwanto (2005), in
calculating the feasibility level of the
assessment tool, it can be visibly shown in
Table 3.
Table 3. The criteria of test instrument feasibility
Feasibility Level Value Score
Not Feasible 1 <60%
Less Feasible 2 65% - 74%
Feasible 3 75% - 84%
Very Feasible 4 85% - 100%
According to the answer category, Very
Good (VG) has a score of 4, Good (G) has
a score of 3, Satisfactory (S) has a score 2,
and Poor (P) has a score of 1 (Sugiyono,
2009), as seen in Table 4.
Table 4. The criteria of instrument answers
Score Answers’ Criteria
4 Very Good
3 Good
2 Satisfactory
1 Poor
According to Majid (2014),
students’ response analysis were obtained
through the students’ response
questionnaire instruments which were
analyzed by the following steps: (1)
counting the number of students who
responded positively to statements from
every aspect, with the negative category of
criteria 1 and 2 and the positive category
of criteria 3 and 4, and (2) determining the
category for positive responses by
matching the percentage results with
predefined criteria. If the results of the
analysis showed that the students’
Eduproxima: Jurnal Ilmiah Pendidikan IPA http://jurnal.stkippgritulungagung.ac.id/index.php/eduproxima
EDUPROXIMA 3 (1) (2021) 50-64 55
responses had not been positive, then a
revision was made to the test developed.
Determination of the percentage of
students’ answers for each statement/ item
of the questionnaire using the following
formula:
P = 𝑓
𝑛 𝑥 100% (2)
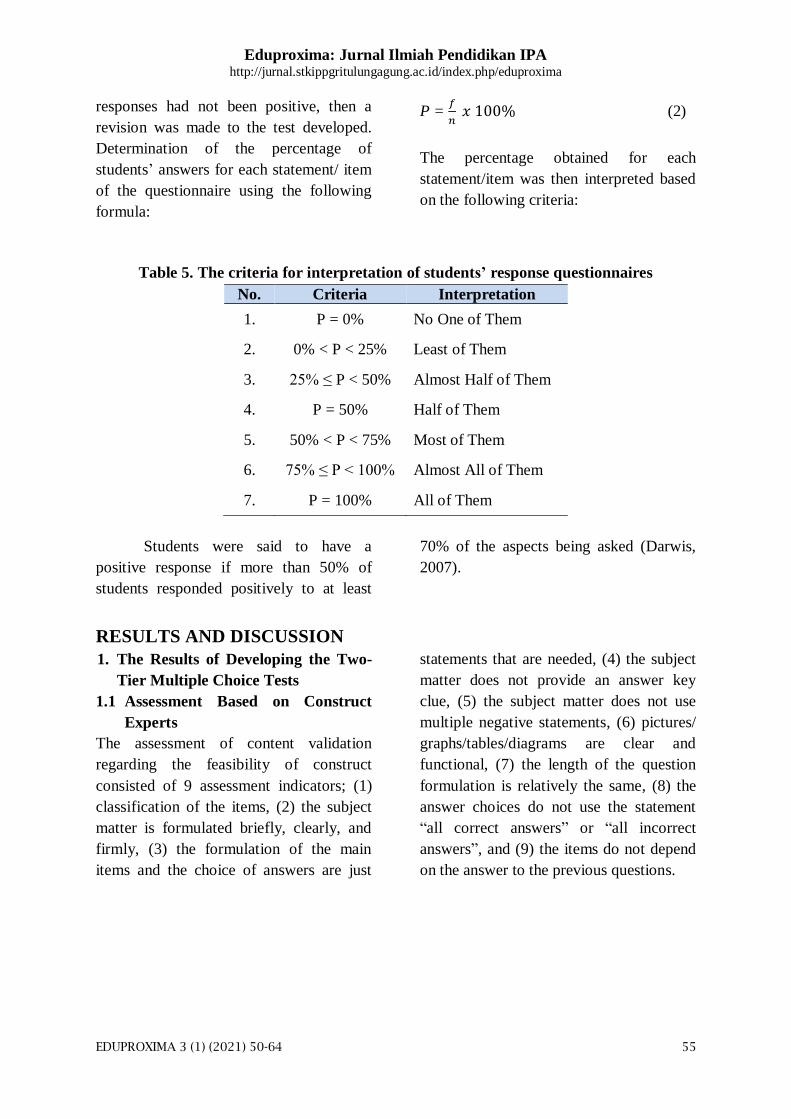
The percentage obtained for each
statement/item was then interpreted based
on the following criteria:
Table 5. The criteria for interpretation of students’ response questionnaires
No. Criteria Interpretation
1. P = 0% No One of Them
2. 0% < P < 25% Least of Them
3. 25% ≤ P < 50% Almost Half of Them
4. P = 50% Half of Them
5. 50% < P < 75% Most of Them
6. 75% ≤ P < 100% Almost All of Them
7. P = 100% All of Them
Students were said to have a
positive response if more than 50% of
students responded positively to at least
70% of the aspects being asked (Darwis,
2007).
RESULTS AND DISCUSSION
1. The Results of Developing the Two-
Tier Multiple Choice Tests
1.1 Assessment Based on Construct
Experts
The assessment of content validation
regarding the feasibility of construct
consisted of 9 assessment indicators; (1)
classification of the items, (2) the subject
matter is formulated briefly, clearly, and
firmly, (3) the formulation of the main
items and the choice of answers are just
statements that are needed, (4) the subject
matter does not provide an answer key
clue, (5) the subject matter does not use
multiple negative statements, (6) pictures/
graphs/tables/diagrams are clear and
functional, (7) the length of the question
formulation is relatively the same, (8) the
answer choices do not use the statement
“all correct answers” or “all incorrect
answers”, and (9) the items do not depend
on the answer to the previous questions.
Eduproxima: Jurnal Ilmiah Pendidikan IPA http://jurnal.stkippgritulungagung.ac.id/index.php/eduproxima
EDUPROXIMA 3 (1) (2021) 50-64 56
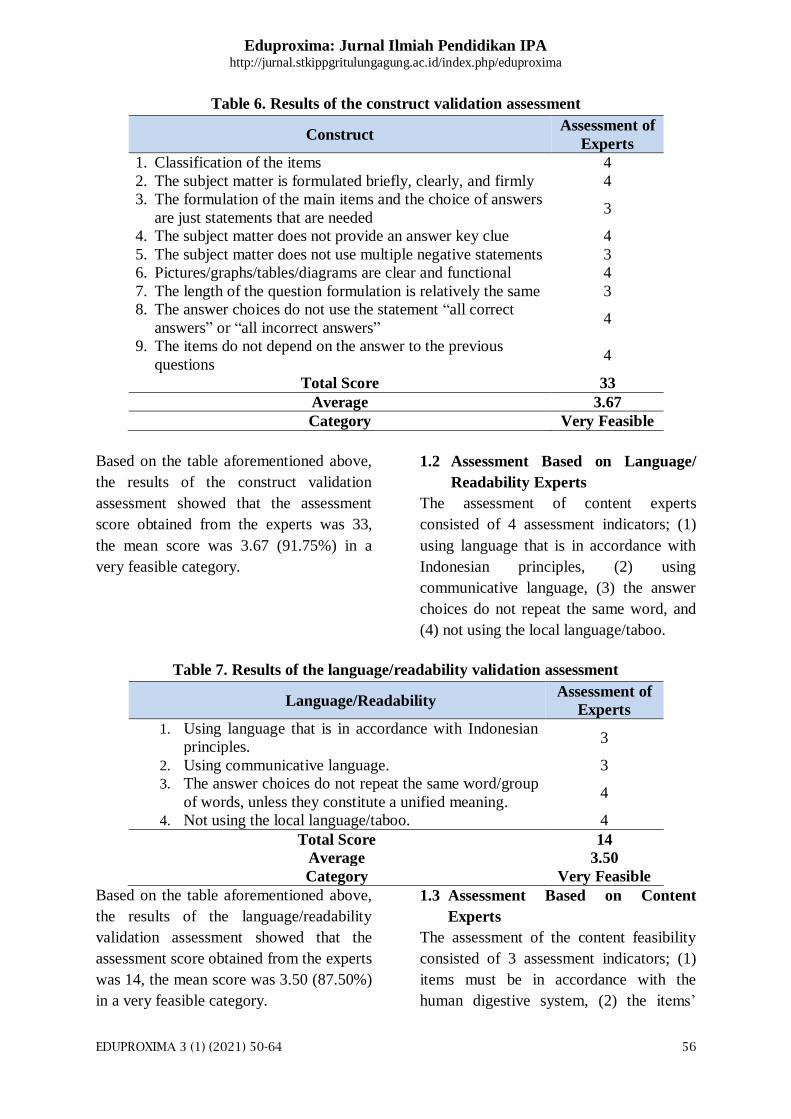
Table 6. Results of the construct validation assessment
Construct Assessment of
Experts
1. Classification of the items 4
2. The subject matter is formulated briefly, clearly, and firmly 4
3. The formulation of the main items and the choice of answers
are just statements that are needed 3
4. The subject matter does not provide an answer key clue 4
5. The subject matter does not use multiple negative statements 3
6. Pictures/graphs/tables/diagrams are clear and functional 4
7. The length of the question formulation is relatively the same 3
8. The answer choices do not use the statement “all correct
answers” or “all incorrect answers” 4
9. The items do not depend on the answer to the previous
questions 4
Total Score 33
Average 3.67
Category Very Feasible
Based on the table aforementioned above,
the results of the construct validation
assessment showed that the assessment
score obtained from the experts was 33,
the mean score was 3.67 (91.75%) in a
very feasible category.
1.2 Assessment Based on Language/
Readability Experts
The assessment of content experts
consisted of 4 assessment indicators; (1)
using language that is in accordance with
Indonesian principles, (2) using
communicative language, (3) the answer
choices do not repeat the same word, and
(4) not using the local language/taboo.
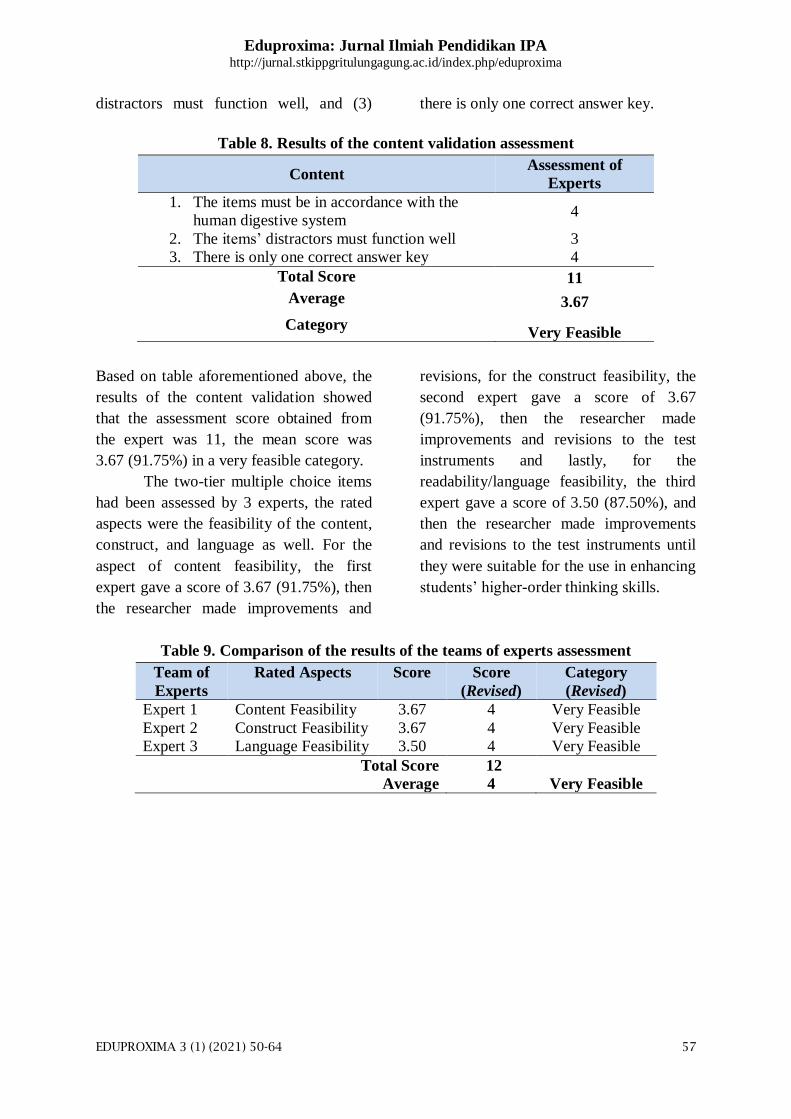
Table 7. Results of the language/readability validation assessment
Language/Readability Assessment of
Experts
1. Using language that is in accordance with Indonesian
principles. 3
2. Using communicative language. 3
3. The answer choices do not repeat the same word/group
of words, unless they constitute a unified meaning. 4
4. Not using the local language/taboo. 4
Total Score 14
Average 3.50
Category Very Feasible
Based on the table aforementioned above,
the results of the language/readability
validation assessment showed that the
assessment score obtained from the experts
was 14, the mean score was 3.50 (87.50%)
in a very feasible category.
1.3 Assessment Based on Content
Experts
The assessment of the content feasibility
consisted of 3 assessment indicators; (1)
items must be in accordance with the
human digestive system, (2) the items’
Eduproxima: Jurnal Ilmiah Pendidikan IPA http://jurnal.stkippgritulungagung.ac.id/index.php/eduproxima
EDUPROXIMA 3 (1) (2021) 50-64 57
distractors must function well, and (3) there is only one correct answer key.
Table 8. Results of the content validation assessment
Content Assessment of
Experts
1. The items must be in accordance with the
human digestive system 4
2. The items’ distractors must function well 3
3. There is only one correct answer key 4
Total Score 11
Average 3.67
Category Very Feasible
Based on table aforementioned above, the
results of the content validation showed
that the assessment score obtained from
the expert was 11, the mean score was
3.67 (91.75%) in a very feasible category.
The two-tier multiple choice items
had been assessed by 3 experts, the rated
aspects were the feasibility of the content,
construct, and language as well. For the
aspect of content feasibility, the first
expert gave a score of 3.67 (91.75%), then
the researcher made improvements and
revisions, for the construct feasibility, the
second expert gave a score of 3.67
(91.75%), then the researcher made
improvements and revisions to the test
instruments and lastly, for the
readability/language feasibility, the third
expert gave a score of 3.50 (87.50%), and
then the researcher made improvements
and revisions to the test instruments until
they were suitable for the use in enhancing
students’ higher-order thinking skills.
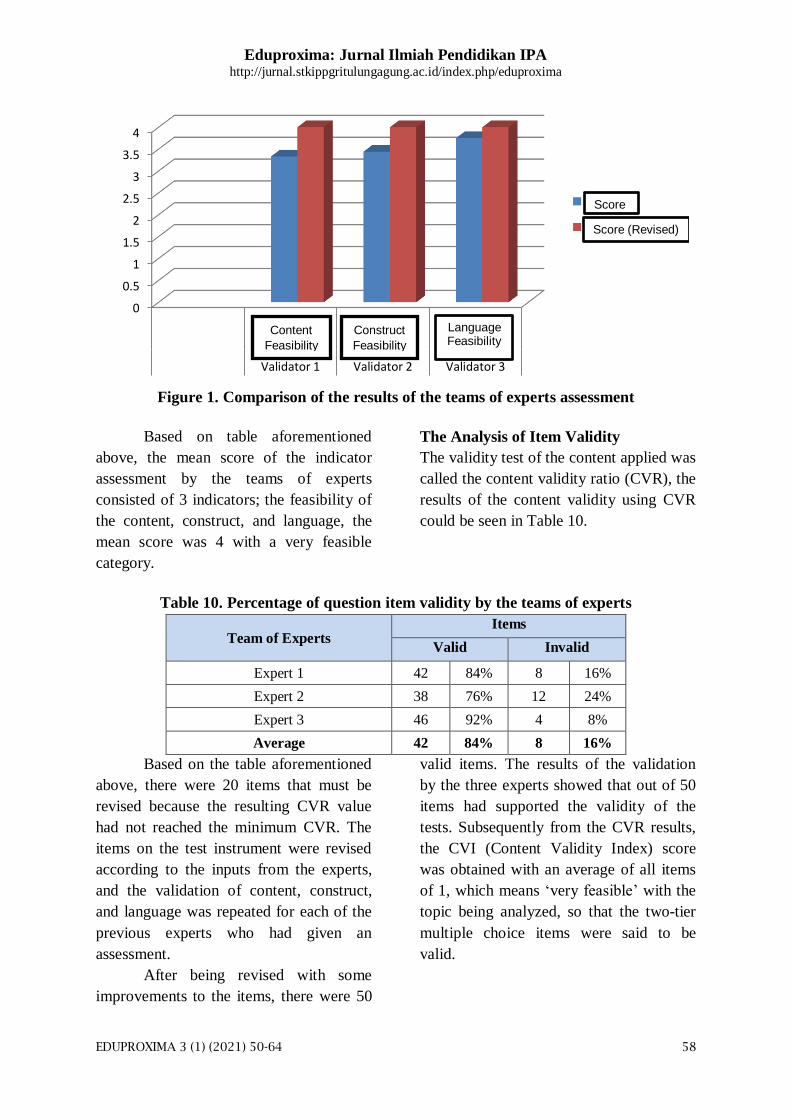
Table 9. Comparison of the results of the teams of experts assessment
Team of
Experts
Rated Aspects Score Score
(Revised)
Category
(Revised)
Expert 1 Content Feasibility 3.67 4 Very Feasible
Expert 2 Construct Feasibility 3.67 4 Very Feasible
Expert 3 Language Feasibility 3.50 4 Very Feasible
Total Score 12
Average 4 Very Feasible
Eduproxima: Jurnal Ilmiah Pendidikan IPA http://jurnal.stkippgritulungagung.ac.id/index.php/eduproxima
EDUPROXIMA 3 (1) (2021) 50-64 58
Figure 1. Comparison of the results of the teams of experts assessment
Based on table aforementioned
above, the mean score of the indicator
assessment by the teams of experts
consisted of 3 indicators; the feasibility of
the content, construct, and language, the
mean score was 4 with a very feasible
category.
The Analysis of Item Validity
The validity test of the content applied was
called the content validity ratio (CVR), the
results of the content validity using CVR
could be seen in Table 10.
Table 10. Percentage of question item validity by the teams of experts
Team of Experts Items
Valid Invalid
Expert 1 42 84% 8 16%
Expert 2 38 76% 12 24%
Expert 3 46 92% 4 8%
Average 42 84% 8 16%
Based on the table aforementioned
above, there were 20 items that must be
revised because the resulting CVR value
had not reached the minimum CVR. The
items on the test instrument were revised
according to the inputs from the experts,
and the validation of content, construct,
and language was repeated for each of the
previous experts who had given an
assessment.
After being revised with some
improvements to the items, there were 50
valid items. The results of the validation
by the three experts showed that out of 50
items had supported the validity of the
tests. Subsequently from the CVR results,
the CVI (Content Validity Index) score
was obtained with an average of all items
of 1, which means ‘very feasible’ with the
topic being analyzed, so that the two-tier
multiple choice items were said to be
valid.
0
0.5
1
1.5
2
2.5
3
3.5
4
KelayakanMateri
KelayakanKonstruksi
KelayakanBahasa
Validator 1 Validator 2 Validator 3
Skor
Skor (Revised)
Language Feasibility
Score
Score (Revised)
Content
Feasibility
Construct
Feasibility
Eduproxima: Jurnal Ilmiah Pendidikan IPA http://jurnal.stkippgritulungagung.ac.id/index.php/eduproxima
EDUPROXIMA 3 (1) (2021) 50-64 59
The Analysis of Students’ Response
Questionnaires
After students answered the test items
given, questionnaires were given.
Students’ response questionnaires were
used to determine the readability of the
questions that would be used on the test to
enhance the higher-order thinking skills.
These students’ response questionnaires
were given to 3 individual students (one-
to-one) and after being revised they were
given back to 6 other students or small
groups outside the test subjects.
The results of the students’
response questionnaires that had been
given to 5 students of 69% in which out of
the 50 items there were 14 items that
received negative responses, then they
were revised and after the small group
tests were carried out to 10 students of
93% in which out of 50 items, 3 items
received negative responses (items number
21, 24, and 37).
The Analysis of the Two-Tier Multiple
Choice Test Reliability
Based on the results of field tests involving
the eleventh grade students of SMA
Unggulan CT Foundation Deli Serdang.
The number of eleventh grade students (N)
were 25 people. Based on the results of
tests on these students, the level of test
reliability could be calculated.
The score of the rtable was obtained
from the Kunder-Richardson formula with
α = 0.05 and the sample (N) = 25 was
0.349. If the score of rvalue = 0.918 with
ttable = 0.349 and the obtained rvalue > rtable
(0.918>0.349). The calculation results
could be interpreted by comparing the
calculation results with rtable. It was
concluded that the reliability of the two-
tier multiple choice tests was said to be
reliable in the moderate category.
The Analysis of the Two-Tier Multiple
Choice Test Discrimination Index
The discrimination index of the test
instrument was obtained based on the
students’ answers in the field tests. The
negative sign (-) on the results of the
discrimination index showed that the
quality of the test was inverted, when
high-ability students had low scores or
when low-ability students had high results.
Items of the high-order thinking tests
could be mentioned as good if the items
had the smallest discrimination index of
0.20, this indicated that the items had
sufficiently minimal discrimination index.
The discrimination index could be seen in
Table 11.
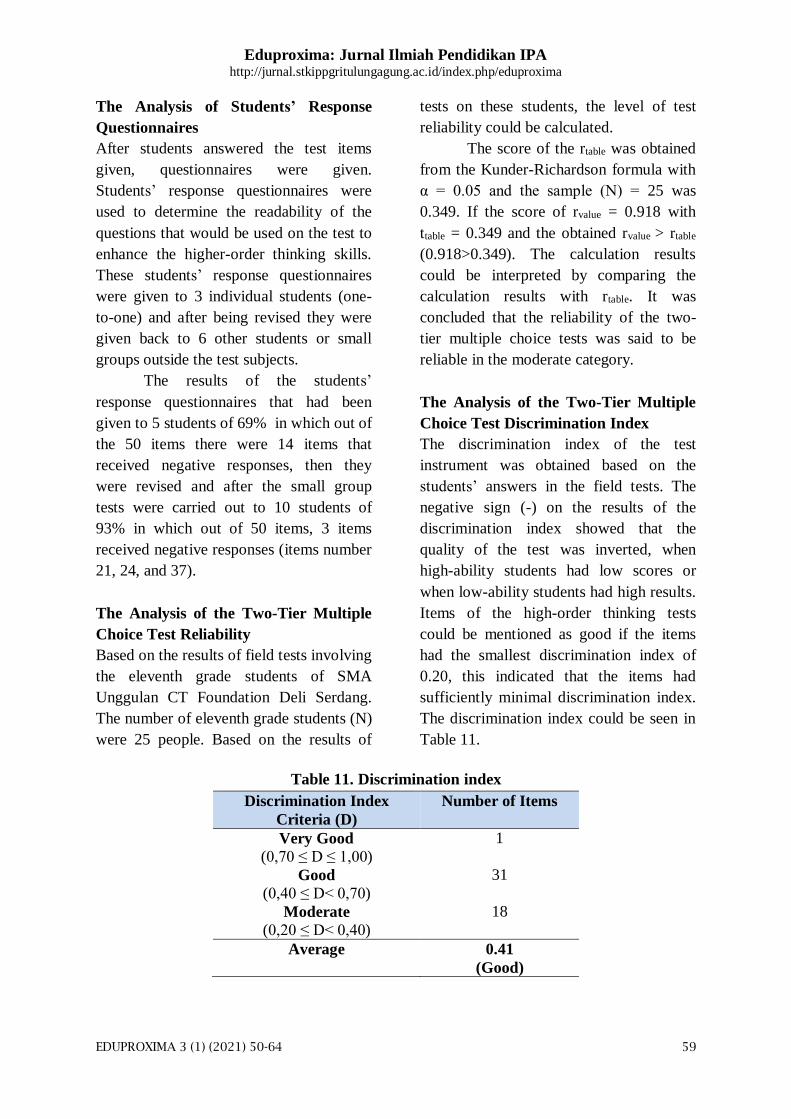
Table 11. Discrimination index
Discrimination Index
Criteria (D)
Number of Items
Very Good
(0,70 ≤ D ≤ 1,00)
1
Good
(0,40 ≤ D< 0,70)
31
Moderate
(0,20 ≤ D< 0,40)
18
Average 0.41
(Good)
Eduproxima: Jurnal Ilmiah Pendidikan IPA http://jurnal.stkippgritulungagung.ac.id/index.php/eduproxima
EDUPROXIMA 3 (1) (2021) 50-64 60
Based on the analysis of the
discrimination index of the students’
higher-order thinking tests, the mean score
of the discrimination index was 0.41 in a
good category.
The Analysis of the Two-Tier Multiple
Choice Test Difficulty Level
The test could be stated as good if the
items had a difficulty level in the interval
0.31-0.70, this showed that the items were
not way too easy and not way too difficult.
The score of the items’ difficulty level was
obtained from the students’ answers in the
field tests. The results of the difficulty
level analysis of the two-tier multiple
choice tests showed the score of 0.64 in a
moderate category.
The Results of Students’ Higher-Order
Thinking Skills
Based on the students’ answers to the two-
tier multiple choice test given, it could be
seen that the level of students’ higher-
order thinking skills in each cognitive
aspect. The cognitive aspects of higher-
order thinking skills include the cognitive
level of analyzing (C4) and evaluating
(C5), it could be seen in Table 12.
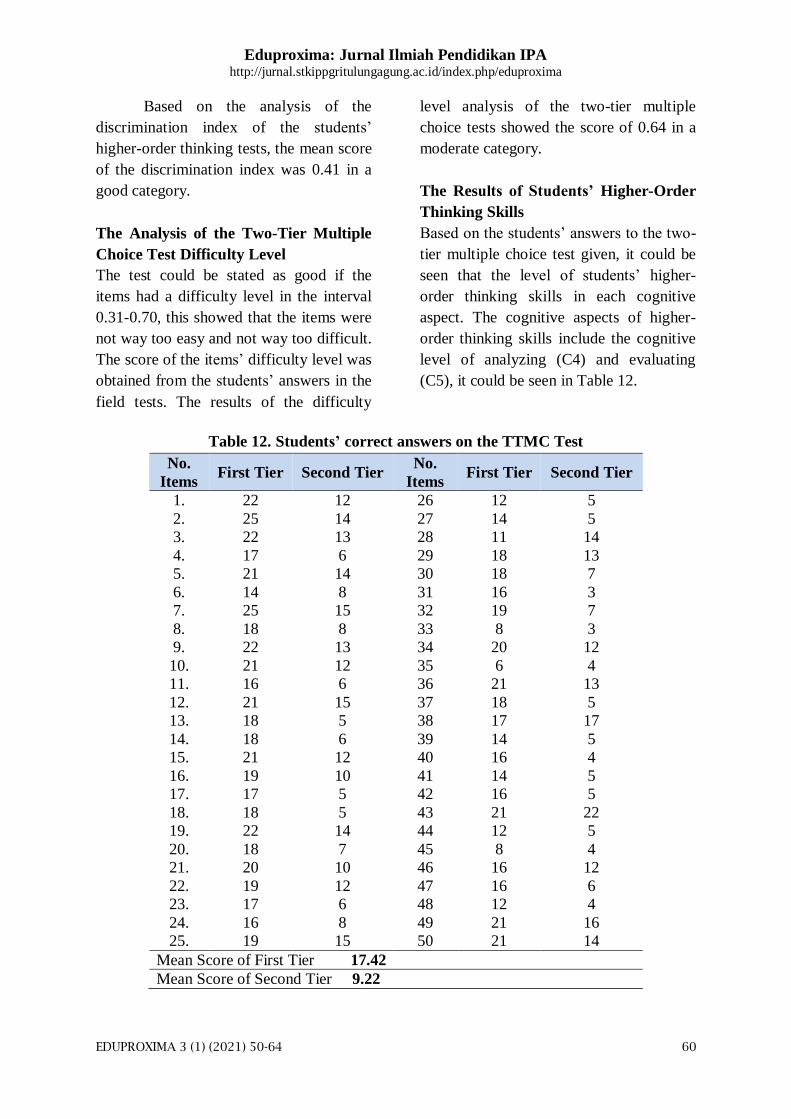
Table 12. Students’ correct answers on the TTMC Test
No.
Items First Tier Second Tier
No.
Items First Tier Second Tier
1. 22 12 26 12 5
2. 25 14 27 14 5
3. 22 13 28 11 14
4. 17 6 29 18 13
5. 21 14 30 18 7
6. 14 8 31 16 3
7. 25 15 32 19 7
8. 18 8 33 8 3
9. 22 13 34 20 12
10. 21 12 35 6 4
11. 16 6 36 21 13
12. 21 15 37 18 5
13. 18 5 38 17 17
14. 18 6 39 14 5
15. 21 12 40 16 4
16. 19 10 41 14 5
17. 17 5 42 16 5
18. 18 5 43 21 22
19. 22 14 44 12 5
20. 18 7 45 8 4
21. 20 10 46 16 12
22. 19 12 47 16 6
23. 17 6 48 12 4
24. 16 8 49 21 16
25. 19 15 50 21 14
Mean Score of First Tier 17.42
Mean Score of Second Tier 9.22
Eduproxima: Jurnal Ilmiah Pendidikan IPA http://jurnal.stkippgritulungagung.ac.id/index.php/eduproxima
EDUPROXIMA 3 (1) (2021) 50-64 61
From the aforementioned table, it
showed the comparison of the number of
students’ correct answers to the TTMC
tests. The average number of students’
correct answers in the first tier was 17.42
higher than the second tier of 9.22, this has
proven that students still had difficulty in
finding the reasons for each answer they
have chosen, this could happen because
students did not understand the questions
given or they just guessed the answers,
because the condition where the answer
was correct on the first tier and incorrect
on the second tier was due to the students
found out the answers to the questions but
did not find out a strong reason for the
answers, the answers were incorrect on the
first tier and correct on the second tier
because the student guessed the first tiers’
answers from that matters.
Overall, the mean percentage of
correct answers in the field tests was
normally distributed, where the percentage
in the first tier was greater than that in the
second tier. The number of students’
answers based on the cognitive domain of
Bloom’s taxonomy as revised by Anderson
& Krathwohl (2001) included as an
indicator of higher-order thinking skills;
C4 (analyzing), and C5 (evaluating), could
be seen in Table 13.
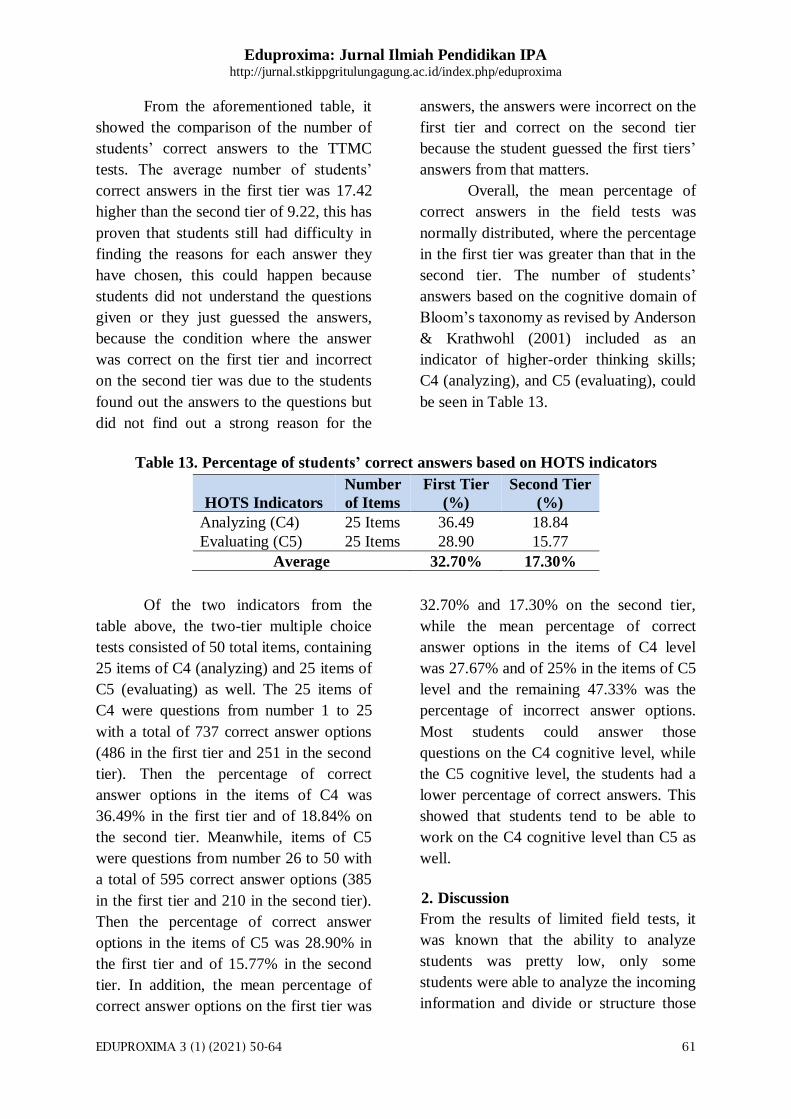
Table 13. Percentage of students’ correct answers based on HOTS indicators
HOTS Indicators
Number
of Items
First Tier
(%)
Second Tier
(%)
Analyzing (C4) 25 Items 36.49 18.84
Evaluating (C5) 25 Items 28.90 15.77
Average 32.70% 17.30%
Of the two indicators from the
table above, the two-tier multiple choice
tests consisted of 50 total items, containing
25 items of C4 (analyzing) and 25 items of
C5 (evaluating) as well. The 25 items of
C4 were questions from number 1 to 25
with a total of 737 correct answer options
(486 in the first tier and 251 in the second
tier). Then the percentage of correct
answer options in the items of C4 was
36.49% in the first tier and of 18.84% on
the second tier. Meanwhile, items of C5
were questions from number 26 to 50 with
a total of 595 correct answer options (385
in the first tier and 210 in the second tier).
Then the percentage of correct answer
options in the items of C5 was 28.90% in
the first tier and of 15.77% in the second
tier. In addition, the mean percentage of
correct answer options on the first tier was
32.70% and 17.30% on the second tier,
while the mean percentage of correct
answer options in the items of C4 level
was 27.67% and of 25% in the items of C5
level and the remaining 47.33% was the
percentage of incorrect answer options.
Most students could answer those
questions on the C4 cognitive level, while
the C5 cognitive level, the students had a
lower percentage of correct answers. This
showed that students tend to be able to
work on the C4 cognitive level than C5 as
well.
2. Discussion
From the results of limited field tests, it
was known that the ability to analyze
students was pretty low, only some
students were able to analyze the incoming
information and divide or structure those
Eduproxima: Jurnal Ilmiah Pendidikan IPA http://jurnal.stkippgritulungagung.ac.id/index.php/eduproxima
EDUPROXIMA 3 (1) (2021) 50-64 62
information into smaller parts to recognize
patterns or relationships, only some
students were able to recognize and
distinguish the causes and effects of a
complicated scenario, and unable to
identify and connect the elements of the
parts, so that the hierarchy was clear even
though it was less systematic in writing.
The ability to evaluate students was also
quite low, only some students were able to
provide an assessment of solutions, ideas,
and methodologies using suitable criteria
or existing standards to ensure the value of
their effectiveness or benefits, and only
some students were able to make
hypothesis, and were unable to accept or
reject a statement based on the criteria on
predetermined items.
Based on the results of the data of
the two-tier multiple choice tests, it
showed that most students still had
difficulty in determining the reasons for
the answer options they have chosen. This
could be seen in Table 13, that the
percentage of correct answers on the
different first tier and second tier. About
32.70% of students could answer correctly
on the first level (first tier) and 17.30% of
students’ answers were correct on the
second level (second tier).
The mean score of students’
higher-order thinking skills at both levels
of the instruments showed that the score
was still below the Minimum
Accomplishment Criteria (≥72) meaning
that students’ higher-order thinking skills
had not shown the optimum results. The
ability to think cannot occur spontaneously
because higher-order thinking skills need
to be trained. To change a person’s
thinking ability requires a process and
practice that is not quite short (Afcariono,
2008). Learning to develop higher-order
thinking skills will be successful if doing
lots of practice and tests (Sagala, 2011).
Developing the higher-order thinking
skills cannot be done partially in certain
lines, but a comprehensive and integrative
strengthening strategy is needed so that all
potential and resources can be utilized
(Kurniawati & Atmojo, 2017).
CONCLUSION
It can be concluded that: (1) the result of
the content validation of the two-tier
multiple choice tests had a mean score of
3.67 (91.75%) in a very feasible category,
(2) the language or readability validation
of the two-tier multiple choice tests had a
mean score of 3.50 (87.50%) in a very
feasible category, (3) the construct
validation of the two-tier multiple choice
tests had a mean score of 3.67 (91.75%) in
a very feasible category, and (4) according
to the students’ responses to the two-tier
multiple choice tests was 93% in a very
good category. It could be concluded that
the two-tier multiple choice tests were
very feasible for the use in enhancing
students’ higher-order thinking skills on
human digestive system.
ACKNOWLEDGMENTS
The author acknowledge the contribution
of our colleagues in SMA Unggulan CT
Foundation Deli Serdang for their
wonderful insights and meaningful
discussion in the working of this study.
The author also would like to thank to
Prof. rer.nat. Binari Manurung, M.Si. from
Master’s Degree of Biology Education,
Eduproxima: Jurnal Ilmiah Pendidikan IPA http://jurnal.stkippgritulungagung.ac.id/index.php/eduproxima
EDUPROXIMA 3 (1) (2021) 50-64 63
Universitas Negeri Medan, North
Sumatera for his contribution in validating
and assessing these research instruments.
BIBLIOGRAPHY
Adodo, S.O. 2013. Effects of Two-Tiers
Multiple Choice Diagnostic
Assessment Items on Students’
Learning Outcome in Basic Science
Technology (BST). Academic Journal
of Interdisciplinary Studies, 2(2): 201-
210.
Afcariono, M. 2008. Penerapan
Pembelajaran Berbasis Masalah untuk
Meningkatkan Kemampuan Berpikir
Siswa pada Mata Pelajaran Biologi.
Jurnal Pendidikan Inovatif, 3(2): 65-
68.
Anderson, L.W., D.R. Krathwohl. 2001. A
Taxonomy for Learning, Teaching, and
Assesing: A Revision of Bloom’s
Taxonomy of Educatioanl Objectives.
New York: Addison Wesley Longman,
Inc.
Badan Standar Nasional Pendidikan. 2012.
Permendikbud No.66 tentang
Standar Penilaian Pendidikan. Jakarta:
Kementerian Pendidikan dan
Kebudayaan. Tersedia: http://luk.staff.
ugm.ac.id/atur/bsnp/Permendikbud66-
2013SPenilaian.pdf [15 September
2019].
Boo, H.K. 2002. Primary Science
Assessment and Its Contribution to the
Nurturing of Creativity. Proceeding of
the International Education Research
Conference Organized by the AARE
(Australian Association for Research in
Education). Brisbane, Australia ISSN
1324-9320.
Boo, H.K.., Ang, K.C. 2005. Using Two-
Tiers Reflective Multiple Choice
Questions to Cater to Creative
Thinking. AARE. International
Education Research Conference
National Institute of Education,
Nanyang Technological University
Singapore.
Borg, W.R., M.D. Gall. 1987. Educational
Research: an Introduction. New York:
Longman Inc.
Cullinane, A., Liston, M. 2011. Two-Tier
Multiple Choice Questions: An
Alternative Method of Formative
Assessment for First Year
Undergraduate Biology Students,
Limerick: National Center for
Excellence In Mathematics and
Education Science Teaching and
Learning (NCE-MSTL).
Darwis, M. 2007. Model Pembelajaran
Matematika yang Melibatkan
Kecerdasan Emosional. Disertasi
Program Pascasarjana Program Studi
Pendidikan Matematika Universitas
Negeri Surabaya. Tidak diterbitkan.
Halaydina, T.M., Downing, S.M. 1989. A
Taxonomy of Multiple Choice Item
Writing Rules. Applied Measurements
InEducation. 2(1): 37-50.
Kurniawati, W., Atmojo, S.E. 2017.
Pembelajaran Sains Bermuatan
Karakter Ilmiah Dengan Alat Peraga
Barang Bekas dan Asesmen Kinerja.
JPI (Jurnal Pendidikan Indonesia),
6(1): 41-50.
Majid, A. 2014. Pengembangan Modul
Matematika pada Materi Garis dan
Sudut Setting Pembelajaran Kooperatif
Tipe Think Pair Share (TPS) untuk
Siswa Kelas VII SMP. Tesis tidak
diterbitkan. Makassar: UNM.
Mullis, I.V.S., Martin, M.O., Foy, P. 2016.
TIMSS Advanced 2015 International
Results in Advanced Mathematics and
Physics. Chestnut Hill, MA: TIMSS &
PIRLS International Study Center,
Boston College.
OECD. 2015. PISA 2015 Results: PISA
2015 Results in Focus (Volumes 1 - V).
[online]. Tersedia: http://www.oecd.
Eduproxima: Jurnal Ilmiah Pendidikan IPA http://jurnal.stkippgritulungagung.ac.id/index.php/eduproxima
EDUPROXIMA 3 (1) (2021) 50-64 64
org/pisa/pisa-2015-results-in-focus.pdf
19 September 2019].
Permendiknas No. 23. 2006. Standar
Kompetensi Lulusan untuk Satuan
Pendidikan Dasar dan Menengah.
Jakarta: Depdiknas.
Purwanto, S. 2005. Penggunaan Model
Assesmen Portofolio dalam Penilaian
Proses dan Hasil Belajar Matematika
Siswa SMU. 3(2): 26-34.
Purwanto, N. 2010. Prinsip-prinsip dan
Teknik Evaluasi Pengajaran.
Bandung: PT. Remaja Rosdakarya.
Ramirez., Rachel, P.B., Mildred.,
Ganaden. 2006. Creative Activities and
Students’ Higher Order Thinking
Skills. Journal of Education Quarterly,
December 2008. 66(1): 22-23.
Sagala, S. 2011. Konsep dan Makna
Pembelajaran. Bandung: Alfabeta.
Sugiyono. 2009. Metode Penelitian
Kualitatif dan R&D. Bandung:
Alfabeta.
Treagust, D.F. 2006. Diagnostic
Assesment in Science as a Means to
Improving Teaching, Learning, and
Retention. UniServe Science
Symposium Proceedings: Assesment in
Science Teaching and Learning,
Uniserve. 10(2): 1-9.
Tuysuz, C. 2009. Development of Two-
Tiers Diagnostic Instrument and
Assess Student’s Misunderstanding in
Chemistry. Scientific Research and
Essay, 5(9): 97-108.