Embed Size (px)
Citation preview
1
Development and Application of a
Physics-Based Simulation Model to
Investigate Residential PM2.5
Composition and Size Distribution
Across the US J.M. Logue, M.M. Lunden, B.C. Singer
Environmental Energy Technologies Division
August 2014
2
Disclaimer
This document was prepared as an account of work sponsored by the United States
Government. While this document is believed to contain correct information, neither the
United States Government nor any agency thereof, nor The Regents of the University of
California, nor any of their employees, makes any warranty, express or implied, or assumes
any legal responsibility for the accuracy, completeness, or usefulness of any information,
apparatus, product, or process disclosed, or represents that its use would not infringe privately
owned rights. Reference herein to any specific commercial product, process, or service by its
trade name, trademark, manufacturer, or otherwise, does not necessarily constitute or imply
its endorsement, recommendation, or favoring by the United States Government or any
agency thereof, or The Regents of the University of California. The views and opinions of
authors expressed herein do not necessarily state or reflect those of the United States
Government or any agency thereof, or The Regents of the University of California.
Ernest Orlando Lawrence Berkeley National Laboratory is an equal opportunity
employer.
Funding was provided by the U.S. Dept. of Energy Building Technologies Program, Office of
Energy Efficiency and Renewable Energy under DOE Contract No. DE-AC02-05CH11231;
by the U.S. Dept. of Housing and Urban Development Office of Healthy Homes and Lead
Hazard Control through Interagency Agreement I-PHI-01070, and by the California Energy
Commission through Contract 500-08-061.
3
SUMMARY
INTRODUCTION: Reducing PM2.5 exposure in homes could substantially improve health.
METHODS: We have modified the Lawrence Berkeley National Lab Population Impact
Assessment Modeling Framework to determine indoor PM2.5 concentrations and exposures in
a set of 50,000 homes representing the US housing stock. A mass-balance model calculated
time-dependent pollutant concentrations within each home. The model included size- and
species-dependent removal mechanisms and age-based occupancy patterns. We conducted an
initial analysis of the impact of increasing central HVAC MERV rating on homes with central
ducting on indoor concentrations of outdoor PM2.5.
RESULTS: On average, compared to homes with no filter, MERV6 reduced indoor
concentrations by 6%, MERV11 by 19% and MERV14 by 39%. The impact varied by climate
zone based on system run time and outdoor conditions that drive infiltration (temperature and
wind) and outdoor aerosol composition.
CONCLUSIONS: The modeling framework will allow for the identifications of cost
effective methods to control PM2.5 indoors.
IMPLICATIONS: PM2.5 exposures have a substantial impact on the health of occupants of
the US housing stock. The impact of filtration on home energy use could have a sizeable net
impact on the energy use of the housing stock. It is critical to provide guidance for energy
efficient filtration to maximize the benefits and minimize the energy impacts. The correct
filtration strategy for a given home will be a function of home location, characteristics, and
occupant behavior. Costs and benefits of a given strategy may vary widely within a given
location. LBNL has developed a tool to model the expected variations in costs and benefits
associated with filtration across the US housing stock. This tool will aid us in providing
guidance for filtration in US homes.
CITATION: Logue, J.M; Lunden,M.M.; Singer, B.C.; (2014) Development and application
of a physics-based simulation model to investigate residential PM2.5 composition and size
distribution across the US. Indoor Air Conference, Hong Kong, China, 7-12 July 2014
4
INTRODUCTION
Atmospheric PM2.5 varies in particle size distribution and composition both spatially and
temporally as sources, atmospheric formation and ageing, and removal processes vary. Spatial
variations occur over large regions, and from the sources that vary from urban to rural areas
within regions. Temporal variations occur over diurnal, weekly, and seasonal time scales.
Elevated concentrations of PM2.5 in the atmosphere have been associated with increased
morbidity and mortality in the population.
Although the majority of health studies have correlated outdoor concentrations with health
problems, most exposure to PM2.5 occurs indoors (VanRyswyk et al. 2013). People spend
more that 90% of their time indoors and more than 70% in their homes (Klepeis et al. 2001).
Reducing concentrations in homes could provide an annual health benefit of $50-150 billion
in the US (Logue et al. 2012).
A significant fraction of the PM2.5 inside homes originated outdoors and is transported into the
building by ventilation. In addition, there can be significant indoor sources of PM2.5 with
cooking and smoking the two most important (Wallace et al. 2004). A number of factors
influence the concentration of PM2.5 indoors. Loss mechanisms include deposition as outdoor
air infiltrates through the building envelope, deposition to indoor surfaces, and particle
removal by filtration. Some particles can undergo chemical reactions indoors, which can lead
to a net gain or loss (Lunden et al. 2003a; Lunden et al. 2008). Lastly, particles can be emitted
from a variety of indoor sources including combustion and chemical reactions.
The varied approaches to reducing indoor concentrations impact both occupant exposures and
energy use. Providing guidance to effectively reduce indoor PM2.5 concentrations at low
energy cost requires an understanding of the variations in PM2.5 sources, composition, and
other parameters relevant to the US housing stock.
In order to compare the costs and benefits of various PM2.5 control technologies, we modified
the Population Impact Assessment Modeling (PIAM) framework to model
PM2.5concentrations and exposures across the US housing stock. The model currently
includes infiltration of PM2.5 from the outdoors as well as cooking. This initial analysis
analyzed the impact of adding MERV rated filters to homes that have central duct systems.
METHODOLOGIES
The PIAM applies physics-based simulation model(s) to calculate one or more environmental
or energy performance parameters for each home in a sample cohort developed to represent a
population. Results from the individual homes are compiled to provide the statistics for
population impacts. The approach can be applied at varying temporal or spatial scales; two
recent applications examined the impact of air sealing and ventilation on annual energy use
for homes across the U.S. (Logue et al. 2013)and the gaseous pollutant exposure impacts of
cooking burners on the occupants of the Southern California housing stock (Logue et al.
2014).
We have expanded the PIAM Framework to determine indoor PM2.5 concentrations. A single-
zone mass balance model is applied to each home. The model includes factors that affect
5
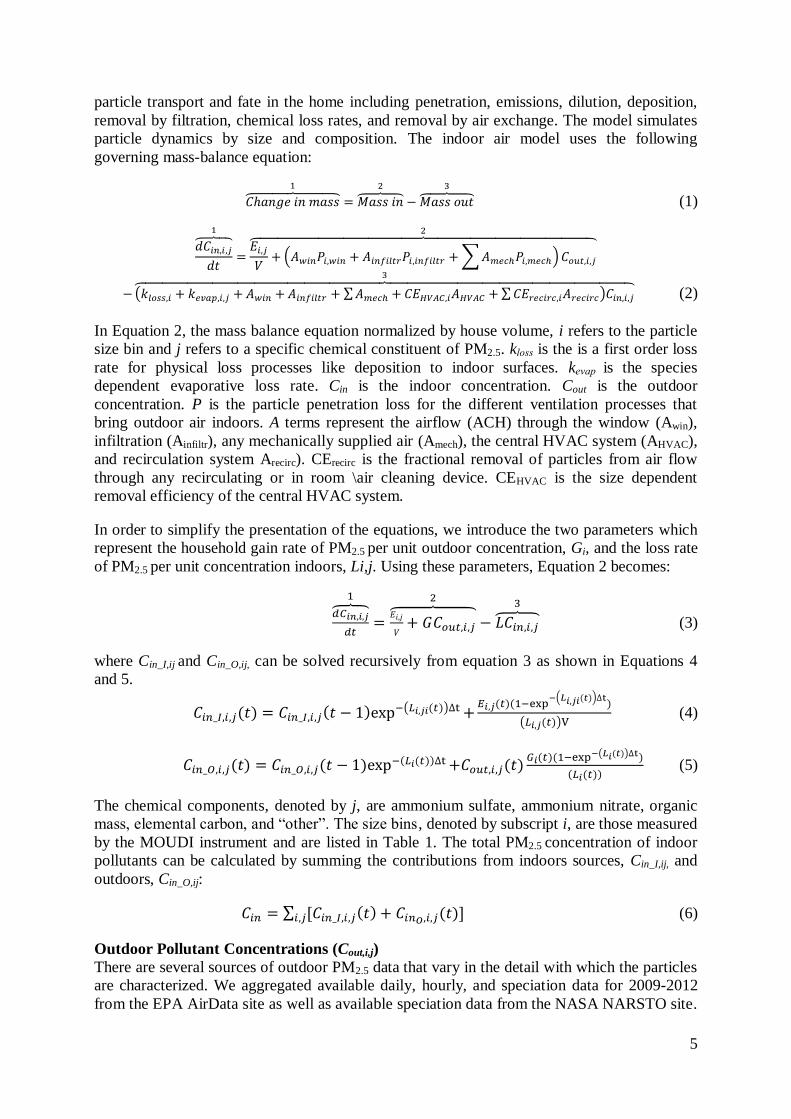
particle transport and fate in the home including penetration, emissions, dilution, deposition,
removal by filtration, chemical loss rates, and removal by air exchange. The model simulates
particle dynamics by size and composition. The indoor air model uses the following
governing mass-balance equation:
𝐶ℎ𝑎𝑛𝑔𝑒 𝑖𝑛 𝑚𝑎𝑠𝑠⏞ 1
= 𝑀𝑎𝑠𝑠 𝑖𝑛⏞ 2
−𝑀𝑎𝑠𝑠 𝑜𝑢𝑡⏞ 3
(1)
𝑑𝐶𝑖𝑛,𝑖,𝑗𝑑𝑡
⏞ 1
=𝐸𝑖,𝑗𝑉+ (𝐴𝑤𝑖𝑛𝑃𝑖,𝑤𝑖𝑛 + 𝐴𝑖𝑛𝑓𝑖𝑙𝑡𝑟𝑃𝑖,𝑖𝑛𝑓𝑖𝑙𝑡𝑟 +∑𝐴𝑚𝑒𝑐ℎ𝑃𝑖,𝑚𝑒𝑐ℎ)𝐶𝑜𝑢𝑡,𝑖,𝑗
⏞ 2
−(𝑘𝑙𝑜𝑠𝑠,𝑖 + 𝑘𝑒𝑣𝑎𝑝,𝑖,𝑗 +𝐴𝑤𝑖𝑛 +𝐴𝑖𝑛𝑓𝑖𝑙𝑡𝑟 + ∑𝐴𝑚𝑒𝑐ℎ + 𝐶𝐸𝐻𝑉𝐴𝐶,𝑖𝐴𝐻𝑉𝐴𝐶 +∑𝐶𝐸𝑟𝑒𝑐𝑖𝑟𝑐,𝑖𝐴𝑟𝑒𝑐𝑖𝑟𝑐)𝐶𝑖𝑛,𝑖,𝑗⏞
3
(2)
In Equation 2, the mass balance equation normalized by house volume, i refers to the particle
size bin and j refers to a specific chemical constituent of PM2.5. kloss is the is a first order loss
rate for physical loss processes like deposition to indoor surfaces. kevap is the species
dependent evaporative loss rate. Cin is the indoor concentration. Cout is the outdoor
concentration. P is the particle penetration loss for the different ventilation processes that
bring outdoor air indoors. A terms represent the airflow (ACH) through the window (Awin),
infiltration (Ainfiltr), any mechanically supplied air (Amech), the central HVAC system (AHVAC),
and recirculation system Arecirc). CErecirc is the fractional removal of particles from air flow
through any recirculating or in room \air cleaning device. CEHVAC is the size dependent
removal efficiency of the central HVAC system.
In order to simplify the presentation of the equations, we introduce the two parameters which
represent the household gain rate of PM2.5 per unit outdoor concentration, Gi, and the loss rate
of PM2.5 per unit concentration indoors, Li,j. Using these parameters, Equation 2 becomes:
𝑑𝐶𝑖𝑛,𝑖,𝑗
𝑑𝑡
⏞ 1
=𝐸𝑖,𝑗
𝑉+ 𝐺𝐶𝑜𝑢𝑡,𝑖,𝑗
⏞ 2
− 𝐿𝐶𝑖𝑛,𝑖,𝑗⏞ 3
(3)
where Cin_I,ij and Cin_O,ij, can be solved recursively from equation 3 as shown in Equations 4
and 5.
𝐶𝑖𝑛_𝐼,𝑖,𝑗(𝑡) = 𝐶𝑖𝑛_𝐼,𝑖,𝑗(𝑡 − 1)exp−(𝐿𝑖,𝑗𝑖(𝑡))∆t +
𝐸𝑖,𝑗(𝑡)(1−exp−(𝐿𝑖,𝑗𝑖(𝑡))∆t)
(𝐿𝑖,𝑗(𝑡))V (4)
𝐶𝑖𝑛_𝑂,𝑖,𝑗(𝑡) = 𝐶𝑖𝑛_𝑂,𝑖,𝑗(𝑡 − 1)exp−(𝐿𝑖(𝑡))∆t +𝐶𝑜𝑢𝑡,𝑖,𝑗(𝑡)
𝐺𝑖(𝑡)(1−exp−(𝐿𝑖(𝑡))∆t)
(𝐿𝑖(𝑡)) (5)
The chemical components, denoted by j, are ammonium sulfate, ammonium nitrate, organic
mass, elemental carbon, and “other”. The size bins, denoted by subscript i, are those measured
by the MOUDI instrument and are listed in Table 1. The total PM2.5 concentration of indoor
pollutants can be calculated by summing the contributions from indoors sources, Cin_I,ij, and
outdoors, Cin_O,ij:
𝐶𝑖𝑛 = ∑ [𝐶𝑖𝑛_𝐼,𝑖,𝑗(𝑡) + 𝐶𝑖𝑛𝑂,𝑖,𝑗(𝑡)]𝑖,𝑗 (6)
Outdoor Pollutant Concentrations (Cout,i,j)
There are several sources of outdoor PM2.5 data that vary in the detail with which the particles
are characterized. We aggregated available daily, hourly, and speciation data for 2009-2012
from the EPA AirData site as well as available speciation data from the NASA NARSTO site.
6
Using the aggregated data from these sites, the PIAM model creates a weeklong, outdoor,
minutely profile of PM2.5 mass divided into the 30 bins defined by chemical species and
particle size. Values used are average for the modeled season.
For each home, a representative county is stochastically selected by sampling from the
counties located in the specified climate zone, state combination for that home weighted by
county population. For the selected county, the closest monitoring sites with PM2.5 daily data,
hourly data, speciation data, and size distribution data are selected based on the distance
between the county center and the location of measurement sites. Briefly the four major steps
used to develop outdoor concentration profiles from monitoring data are as follows; profiles
are developed for a typical weekday (Monday through Friday) and a typical weekend day
(Saturday, Sunday).during each season. 1) The hourly data is first used to develop diurnal
profiles of the pattern of hourly concentrations relative to daily averages. 2) From the daily
data we determine average outdoor concentration for weekends and weekdays. The weekend
and weekday non-dimensional diurnal profiles are multiplied by the weekend and weekday
daily average concentrations to develop quantitative diurnal concentration profiles. 3) The
weekend/weekday diurnal profiles are then separated into five diurnal profiles, one for each
chemical species based on the closest speciation site data. 4) The average weekend/weekday
fraction of each chemical species mass in each particle size bin is determined from data from
the closest monitoring site with size distribution data. Organic mass was determine by
multiplying the organic carbon by 1.4, the mean organic mass to organic carbon ratio found
by Russell (2003).
Representative Housing Stock Development
We developed a weighted, representative set of 50,877 US homes for use in modeling
conditions across the US housing stock based on the Residential Energy Consumption Survey
(RECS) (US EIA 2009). The model requires several housing parameters that are not available
in the RECS; these parameters were estimated or assigned based on home characteristics that
were specified in the RECS. The estimated or assigned parameters include normalized
leakage of the building envelope, home size, hourly weather conditions, and thermostat
temperatures for RECS entries that did not have specified values. Full details of this process
are described in Logue et al (2013).
When applying this model to the existing database of homes, we used an existing, simple
airflow model to determine the hourly air exchange rate due to natural ventilation based on
home characteristics and window opening size. Walker and Wilson (1998) developed an
algorithm to calculate infiltration through the building envelope as a function of a limited
number of home characteristics, outdoor weather data, and home leakage area. The size of
window opening in each home is determined as a function of outdoor temperature and
whether or not the home had cooling based on the algorithm implemented by Baxter (2013).
In the US housing stock, 71% of homes reported having ducted heating systems and 76%
reported having some level of ducted cooling in the home (US EIA 2009). One option for
controlling PM2.5 is to increase the MERV filter rating of the duct system and potentially
increase the run time of the system. To access the impact of these types of systems on
concentrations, we need to estimate the airflow and runtimes of central HVAC systems. In
previous work, we conducted simulations for three homes representing new, average, and old
construction, corresponding to homes built according to the 2008 California Title 24 standard,
a typical 1980s home and a typical 1940s home. Logue et al (2013) determined the average
fractional hourly run time of the HVAC system for each home for heating and cooling as a
function of the indoor-set point and outdoor temperature difference for a set of IECC climate
7
zones. We are using this data to estimate the hourly run time of the heating and cooling
system, when present, as a function indoor-set point temperatures and outdoor temperatures
for each of the modeled homes.
Size and species dependent model parameters
Deposition rates are a function of physical particle size and home characteristics. Thatcher et
al (2003) and Long et al. (2001b) measured size dependent deposition rates in homes in
winter and summer. For each size bin, Long and Thatcher reported the median and standard
deviation of the measured deposition rate. We determined the median and standard deviation
of the expected deposition rate for each of our defined particle bins by combining the
weighted values for the bins used in sited studies assuming a normal distribution. For the
model implementation, for each home, we selected one of the sets of data, sampled from the
distribution for the size bin with the lowest variability, and then assigned the same percentage
change in deposition for all of the size bins.
Particle penetration factors depend on particle size, but it is not a very strong dependence
(Long et al. 2001b; Chen and Zhao 2011) for the particle size bins that are significant
contributors to PM2.5 mass. We assigned penetration factor as a function of how air enters the
home. For air that is supplied through the windows, we assume that the penetration factor is
1.0.. When air infiltrates through the building envelope, we used a similar approach as we did
for the particle first order deposition loss rate using penetration data from Thatcher et al.
(2003) and Long et al (2001a).
Previous work by Lunden et al. (2003b) showed that ammonium sulfate could be modeled
effectively using penetration, deposition loss rate values, and the building air exchange rate.
Lunden et al. (2003a) found that ammonium nitrate loss rates are higher than those expected
just from deposition alone. We used the fit derived by Herring et al. (2007) of the Lunden et
al. data to estimate the evaporative loss rate of ammonium nitrate as a function of home
temperature and particle size. Lunden et al. (2008) showed that elemental carbon follows a
similar behavior as ammonium sulfate indoors, but that organic carbon concentrations are
impacted by chemical transformation indoors. We used the measured data reported by
Thatcher et al. (2003) and Lunden et al. (2008) to estimate a first order chemical evaporative
loss rate for organic mass as a function of particle size.
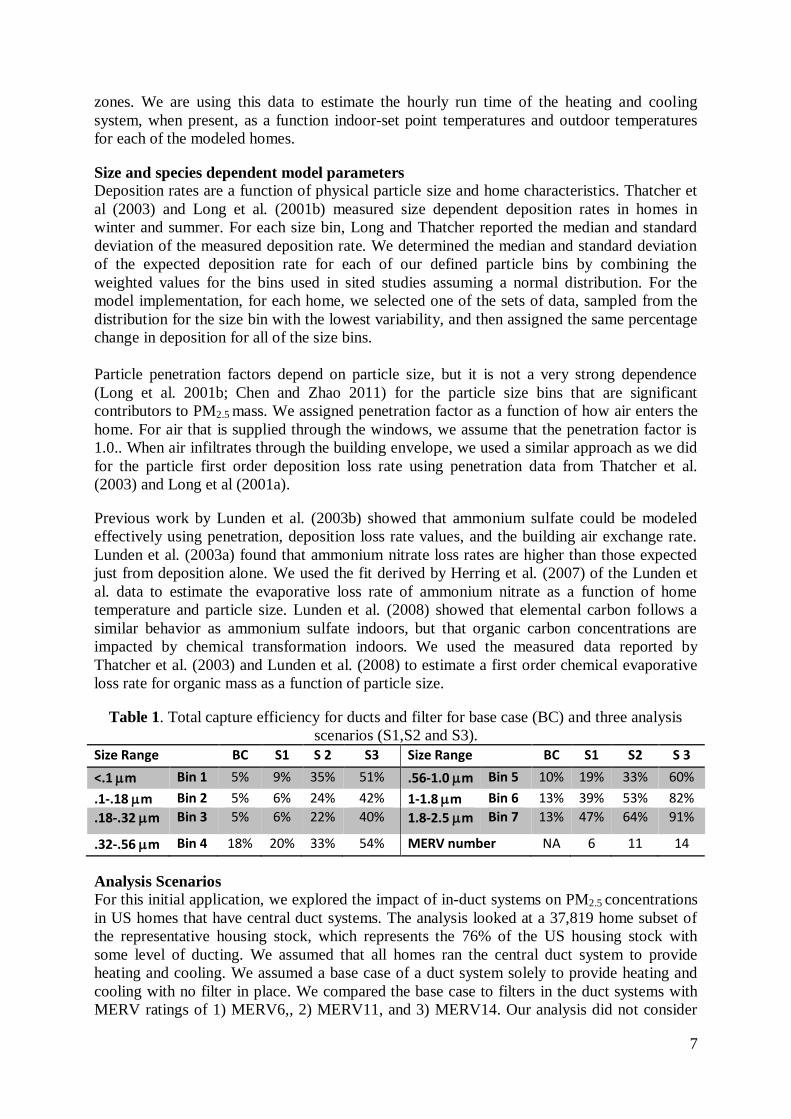
Table 1. Total capture efficiency for ducts and filter for base case (BC) and three analysis
scenarios (S1,S2 and S3).
Size Range BC S1 S 2 S3 Size Range BC S1 S2 S 3
<.1 m Bin 1 5% 9% 35% 51% .56-1.0 m Bin 5 10% 19% 33% 60%
.1-.18 m Bin 2 5% 6% 24% 42% 1-1.8 m Bin 6 13% 39% 53% 82%
.18-.32 m Bin 3 5% 6% 22% 40% 1.8-2.5 m Bin 7 13% 47% 64% 91%
.32-.56 m Bin 4 18% 20% 33% 54% MERV number NA 6 11 14
Analysis Scenarios
For this initial application, we explored the impact of in-duct systems on PM2.5 concentrations
in US homes that have central duct systems. The analysis looked at a 37,819 home subset of
the representative housing stock, which represents the 76% of the US housing stock with
some level of ducting. We assumed that all homes ran the central duct system to provide
heating and cooling. We assumed a base case of a duct system solely to provide heating and
cooling with no filter in place. We compared the base case to filters in the duct systems with
MERV ratings of 1) MERV6,, 2) MERV11, and 3) MERV14. Our analysis did not consider
8
the impacts of increased MERV filters on filter bypass, duct leakage, or reductions in duct
flow rate due to increased pressure drop. MERV filter particle capture efficiency values were
taken from two sources (Hanley et al. 1994; EPA 2008). A MERV14 filter likely has too large
of a pressure drop for most existing home HVAC systems, however the results can be thought
of as providing an upper bound on the potential benefits from adding a higher MERV filter to
existing duct systems. Duct only capture efficiencies were taken for home HVAC system
efficiencies measured by Stephens and Siegel (2012; 2013). We combined the duct and filter
capture efficiencies using the formula given by Stephens and Siegel (2012):
𝐶𝐸𝐻𝑉𝐴𝐶 = 𝐶𝐸𝑑𝑢𝑐𝑡𝑠+𝑓𝑖𝑙𝑡𝑒𝑟 = 1 − (1 − 𝐶𝐸𝑑𝑢𝑐𝑡𝑠)(1 − 𝐶𝐸𝑓𝑖𝑙𝑡𝑒𝑟) (7)
The total calculated duct and filter particle removal efficiency for each particle size bin is
shown in Table 1. There are no data for the 0.1-0.3 m size range, which encompasses most
of two of our seven modeled size bins (0.1-0.18 m bin and 0.18-0.32 m bin). For those bins
we assumed the same duct capture efficiency as for the smallest modeled bin (<0.1 m).
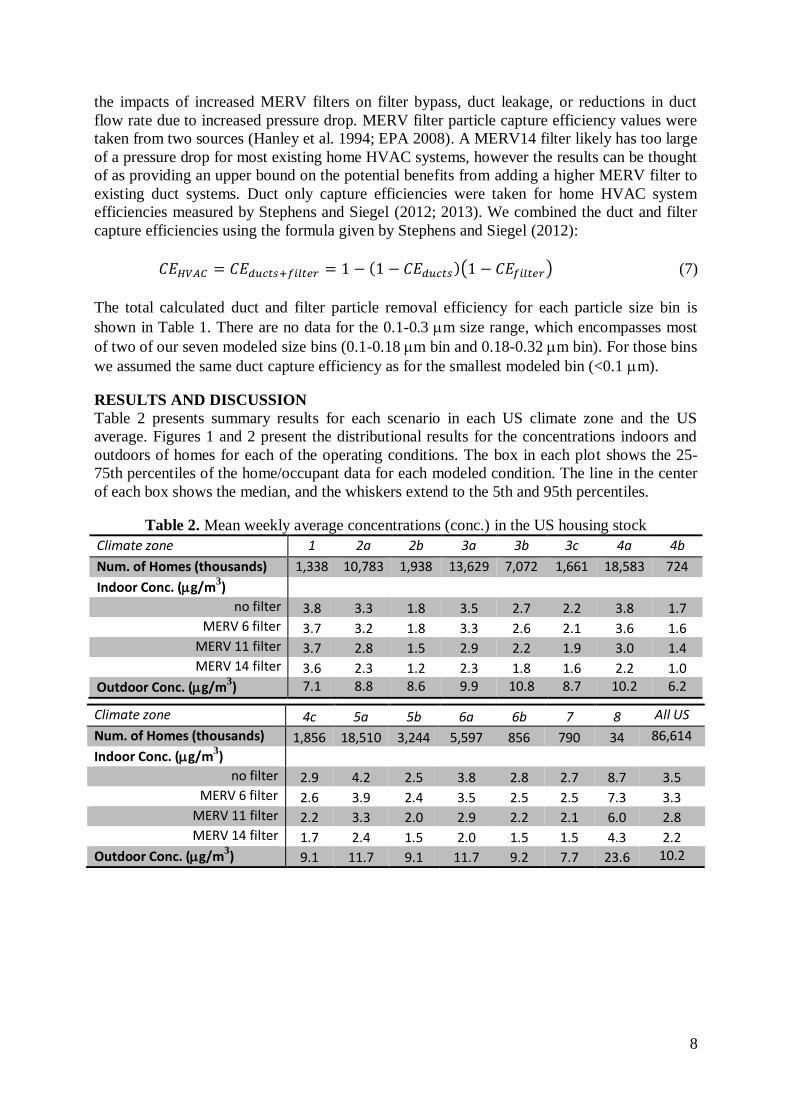
RESULTS AND DISCUSSION
Table 2 presents summary results for each scenario in each US climate zone and the US
average. Figures 1 and 2 present the distributional results for the concentrations indoors and
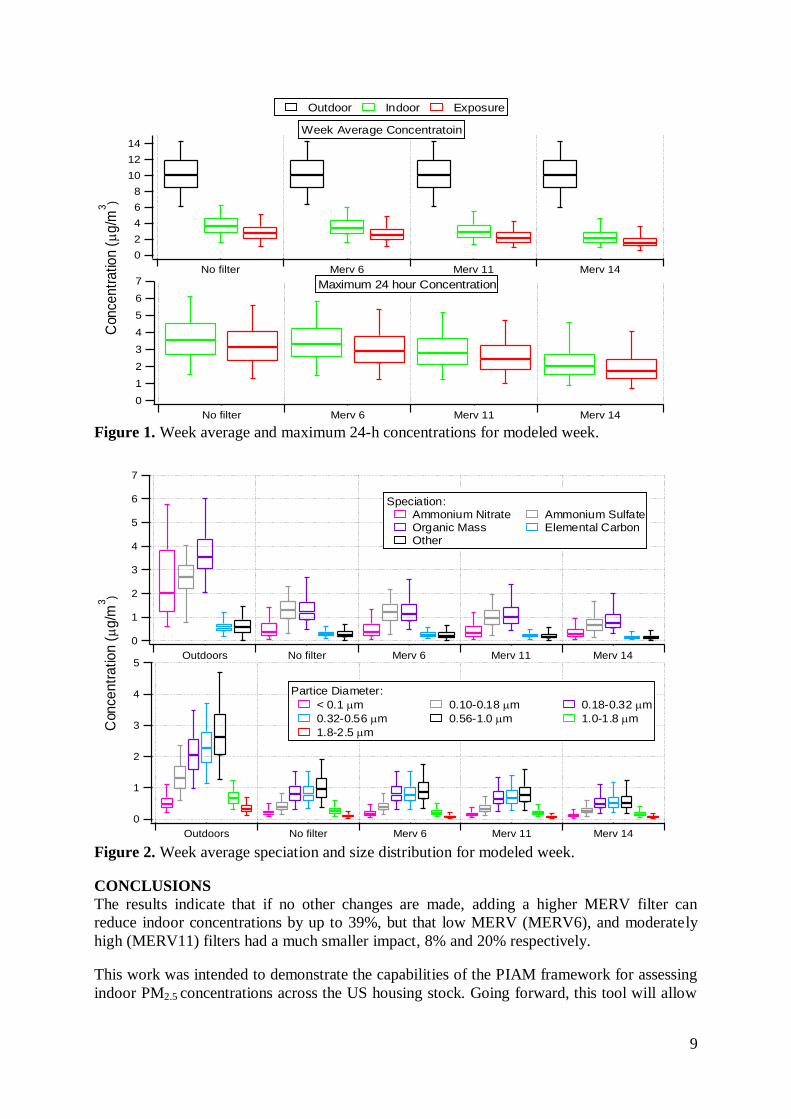
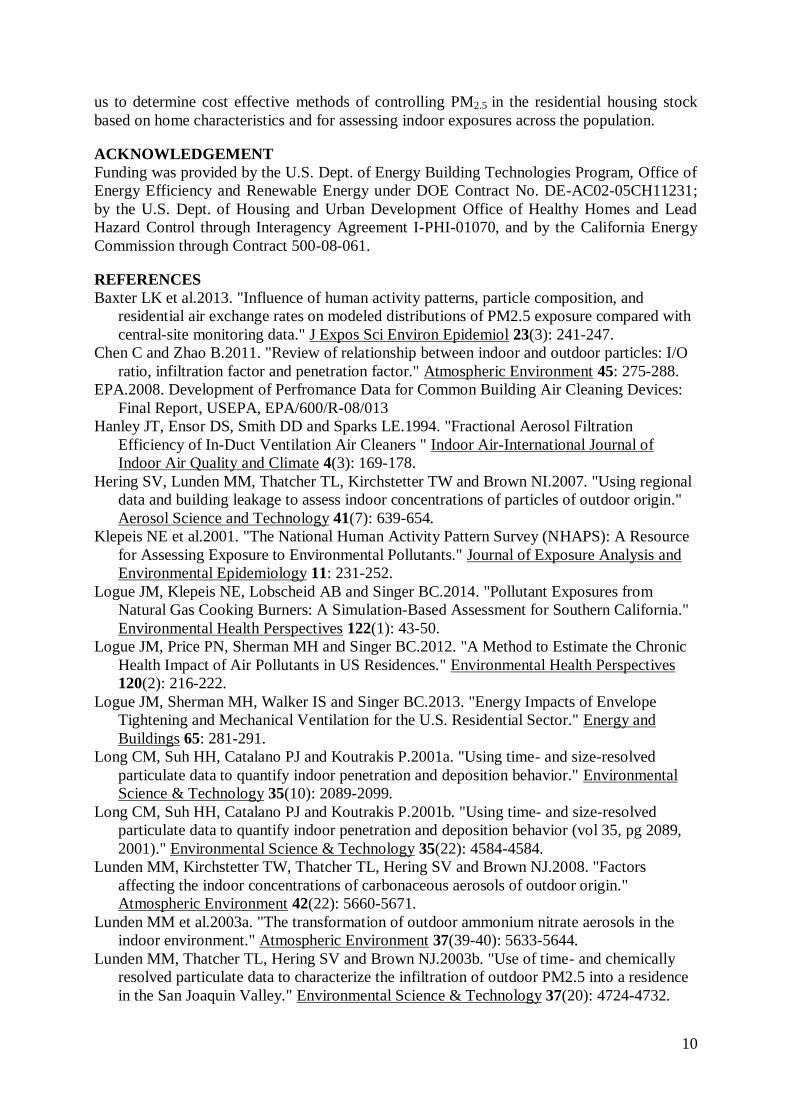
outdoors of homes for each of the operating conditions. The box in each plot shows the 25-
75th percentiles of the home/occupant data for each modeled condition. The line in the center
of each box shows the median, and the whiskers extend to the 5th and 95th percentiles.
Table 2. Mean weekly average concentrations (conc.) in the US housing stock
Climate zone 1 2a 2b 3a 3b 3c 4a 4b
Num. of Homes (thousands) 1,338 10,783 1,938 13,629 7,072 1,661 18,583 724
Indoor Conc. (g/m3)
no filter 3.8 3.3 1.8 3.5 2.7 2.2 3.8 1.7 MERV 6 filter 3.7 3.2 1.8 3.3 2.6 2.1 3.6 1.6
MERV 11 filter 3.7 2.8 1.5 2.9 2.2 1.9 3.0 1.4 MERV 14 filter 3.6 2.3 1.2 2.3 1.8 1.6 2.2 1.0
Outdoor Conc. (g/m3) 7.1 8.8 8.6 9.9 10.8 8.7 10.2 6.2
Climate zone 4c 5a 5b 6a 6b 7 8 All US
Num. of Homes (thousands) 1,856 18,510 3,244 5,597 856 790 34 86,614
Indoor Conc. (g/m3)
no filter 2.9 4.2 2.5 3.8 2.8 2.7 8.7 3.5 MERV 6 filter 2.6 3.9 2.4 3.5 2.5 2.5 7.3 3.3
MERV 11 filter 2.2 3.3 2.0 2.9 2.2 2.1 6.0 2.8 MERV 14 filter 1.7 2.4 1.5 2.0 1.5 1.5 4.3 2.2
Outdoor Conc. (g/m3) 9.1 11.7 9.1 11.7 9.2 7.7 23.6 10.2
9
Figure 1. Week average and maximum 24-h concentrations for modeled week.
Figure 2. Week average speciation and size distribution for modeled week.
CONCLUSIONS
The results indicate that if no other changes are made, adding a higher MERV filter can
reduce indoor concentrations by up to 39%, but that low MERV (MERV6), and moderately
high (MERV11) filters had a much smaller impact, 8% and 20% respectively.
This work was intended to demonstrate the capabilities of the PIAM framework for assessing
indoor PM2.5 concentrations across the US housing stock. Going forward, this tool will allow
14
12
10
8
6
4
2
0
No filter Merv 6 Merv 11 Merv 147
6
5
4
3
2
1
0
No filter Merv 6 Merv 11 Merv 14
Week Average Concentratoin
Maximum 24 hour Concentration
Con
cen
tra
tion
(
g/m
3)
Outdoor Indoor Exposure
7
6
5
4
3
2
1
0
Outdoors No filter Merv 6 Merv 11 Merv 145
4
3
2
1
0
Outdoors No filter Merv 6 Merv 11 Merv 14
Speciation:Ammonium Nitrate Ammonium SulfateOrganic Mass Elemental CarbonOther
Partice Diameter:
< 0.1 m 0.10-0.18 m 0.18-0.32 m
0.32-0.56 m 0.56-1.0 m 1.0-1.8 m
1.8-2.5 mCon
ce
ntr
atio
n (
g/m
3)
10
us to determine cost effective methods of controlling PM2.5 in the residential housing stock
based on home characteristics and for assessing indoor exposures across the population.
ACKNOWLEDGEMENT
Funding was provided by the U.S. Dept. of Energy Building Technologies Program, Office of
Energy Efficiency and Renewable Energy under DOE Contract No. DE-AC02-05CH11231;
by the U.S. Dept. of Housing and Urban Development Office of Healthy Homes and Lead
Hazard Control through Interagency Agreement I-PHI-01070, and by the California Energy
Commission through Contract 500-08-061.
REFERENCES
Baxter LK et al.2013. "Influence of human activity patterns, particle composition, and
residential air exchange rates on modeled distributions of PM2.5 exposure compared with
central-site monitoring data." J Expos Sci Environ Epidemiol 23(3): 241-247.
Chen C and Zhao B.2011. "Review of relationship between indoor and outdoor particles: I/O
ratio, infiltration factor and penetration factor." Atmospheric Environment 45: 275-288.
EPA.2008. Development of Perfromance Data for Common Building Air Cleaning Devices:
Final Report, USEPA, EPA/600/R-08/013
Hanley JT, Ensor DS, Smith DD and Sparks LE.1994. "Fractional Aerosol Filtration
Efficiency of In-Duct Ventilation Air Cleaners " Indoor Air-International Journal of
Indoor Air Quality and Climate 4(3): 169-178.
Hering SV, Lunden MM, Thatcher TL, Kirchstetter TW and Brown NI.2007. "Using regional
data and building leakage to assess indoor concentrations of particles of outdoor origin."
Aerosol Science and Technology 41(7): 639-654.
Klepeis NE et al.2001. "The National Human Activity Pattern Survey (NHAPS): A Resource
for Assessing Exposure to Environmental Pollutants." Journal of Exposure Analysis and
Environmental Epidemiology 11: 231-252.
Logue JM, Klepeis NE, Lobscheid AB and Singer BC.2014. "Pollutant Exposures from
Natural Gas Cooking Burners: A Simulation-Based Assessment for Southern California."
Environmental Health Perspectives 122(1): 43-50.
Logue JM, Price PN, Sherman MH and Singer BC.2012. "A Method to Estimate the Chronic
Health Impact of Air Pollutants in US Residences." Environmental Health Perspectives
120(2): 216-222.
Logue JM, Sherman MH, Walker IS and Singer BC.2013. "Energy Impacts of Envelope
Tightening and Mechanical Ventilation for the U.S. Residential Sector." Energy and
Buildings 65: 281-291.
Long CM, Suh HH, Catalano PJ and Koutrakis P.2001a. "Using time- and size-resolved
particulate data to quantify indoor penetration and deposition behavior." Environmental
Science & Technology 35(10): 2089-2099.
Long CM, Suh HH, Catalano PJ and Koutrakis P.2001b. "Using time- and size-resolved
particulate data to quantify indoor penetration and deposition behavior (vol 35, pg 2089,
2001)." Environmental Science & Technology 35(22): 4584-4584.
Lunden MM, Kirchstetter TW, Thatcher TL, Hering SV and Brown NJ.2008. "Factors
affecting the indoor concentrations of carbonaceous aerosols of outdoor origin."
Atmospheric Environment 42(22): 5660-5671.
Lunden MM et al.2003a. "The transformation of outdoor ammonium nitrate aerosols in the
indoor environment." Atmospheric Environment 37(39-40): 5633-5644.
Lunden MM, Thatcher TL, Hering SV and Brown NJ.2003b. "Use of time- and chemically
resolved particulate data to characterize the infiltration of outdoor PM2.5 into a residence
in the San Joaquin Valley." Environmental Science & Technology 37(20): 4724-4732.
11
Russell LM.2003. "Aerosol organic-mass-to-organic-carbon ratio measurements."
Environmental Science & Technology 37(13): 2982-2987.
Stephens B and Siegel JA.2012. "Comparison of Test Methods for Determining the Particle
Removal Efficiency of Filters in Residential and Light-Commercial Central HVAC
Systems." Aerosol Science and Technology 46(5): 504-513.
Stephens B and Siegel JA.2013. "Ultrafine particle removal by residential heating, ventilating,
and air-conditioning filters." Indoor Air 23(6): 488-497.
Thatcher TL, Lunden MM, Revzan KL, Sextro RG and Brown NJ.2003. "A concentration
rebound method for measuring particle penetration and deposition in the indoor
environment." Aerosol Science and Technology 37(11): 847-864.
US EIA.2009. Residential Buildings Energy Consumption Survey (RECs), U.S. Energy
Information Administration.
VanRyswyk K et al.2013. "Impact of microenvironments and personal activities on personal
PM2.5 exposures among asthmatic children." Journal of Exposure Science and
Environmental Epidemiology doi: 10.1038/jes.2013.20: 1-9.
Walker IS and Wilson DJ.1998. "Field validation of equations for stack and wind driven air
infiltration calculations." HVAC&R Research 4(2).
Wallace LA, Emmerich SJ and Howard-Reed C.2004. "Source strengths of ultrafine and fine
particles due to cooking with a gas stove." Environmental Science & Technology 38(8):
2304-2311.