Embed Size (px)
Citation preview

Development and Characterisation of Metal-SupportedSolid Oxide Fuel Cells
G. Schiller
German Aerospace Center (DLR) Institute of Technical Thermodynamics
9th International Symposium on Advances in Electrochemical Science and Technology (ISAEST-9),December 2-4, 2010, Hotel Green Park, Chennai, India

ISAEST-9, December 2-4, 2010, Chennai, India
Outline
Introduction
German Aerospace Center (DLR)
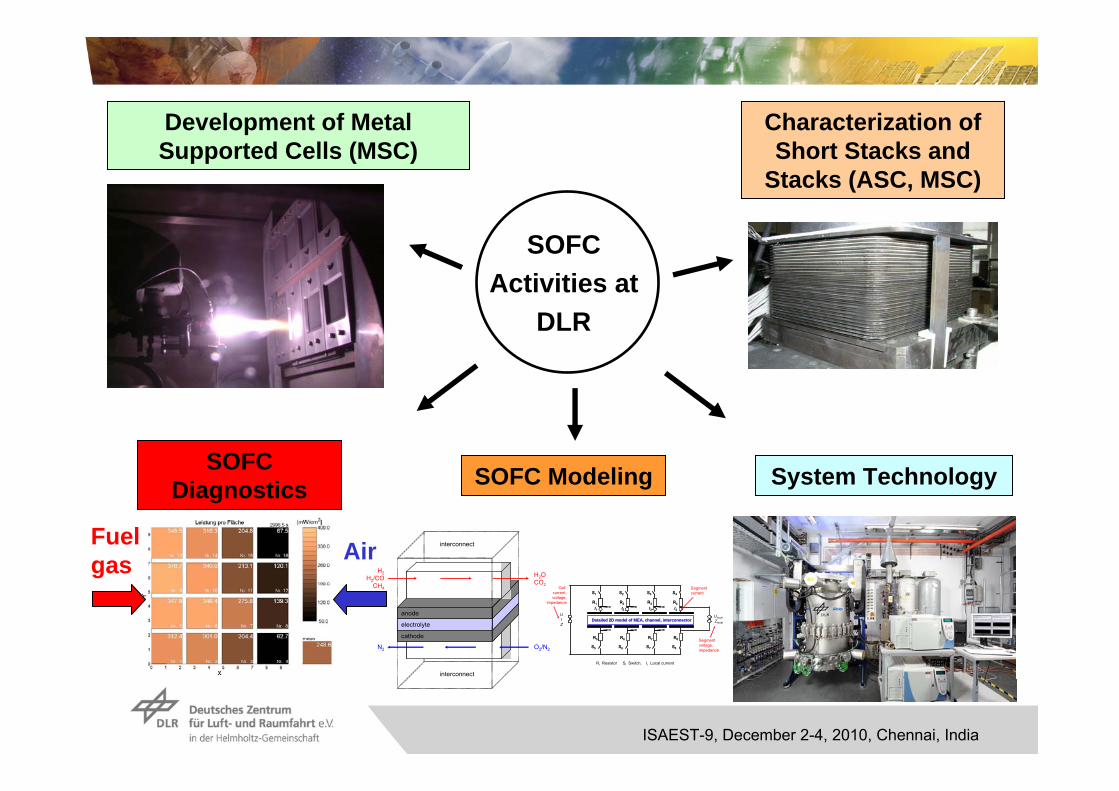
SOFC Activities at DLR
Development of Metal Supported SOFC Concept of DLR
Development of Functional Layers and Cells
Electrochemical Cell Performance
Advanced Characterisation Techniques
Spatially Resolved Cell Characterisation
New Imaging Methods for SOFC Characterisation
Conclusions

ISAEST-9, December 2-4, 2010, Chennai, India
DLRGerman Aerospace Center
Research InstitutionSpace AgencyProject Management Agency

ISAEST-9, December 2-4, 2010, Chennai, India
Locations and Employees
6700 employees across 33 institutes and facilities at
13 sites.
Offices in Brussels, Paris and Washington.
Cologne
Oberpfaffenhofen
Braunschweig
Goettingen
Berlin
Bonn
Neustrelitz
Weilheim
Bremen Trauen
Lampoldshausen
Hamburg
Stuttgart

ISAEST-9, December 2-4, 2010, Chennai, India
Research Areas
AeronauticsSpaceTransportEnergySpace AgencyProject Management Agency

ISAEST-9, December 2-4, 2010, Chennai, India
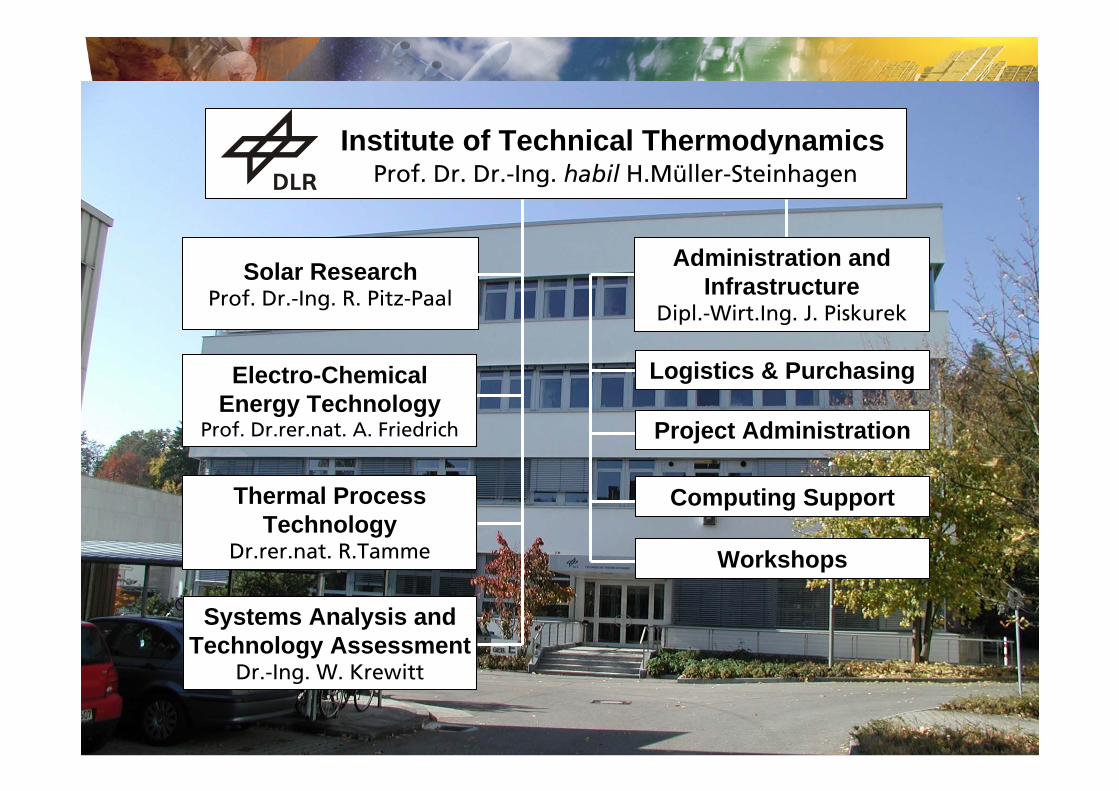
DLR Site Stuttgart
Employees: 560Size of site: 25 860 m²Research institutes:
Institute of Structures and DesignInstitute of Vehicle ConceptsInstitute of Technical PhysicsInstitute of Technical ThermodynamicsInstitute of Combustion Technology
ISAEST-9, December 2-4, 2010, Chennai, India
Solar Research Prof. Dr.-Ing. R. Pitz-Paal
Systems Analysis and Technology Assessment
Dr.-Ing. W. Krewitt
Electro-ChemicalEnergy Technology
Prof. Dr.rer.nat. A. Friedrich
Thermal ProcessTechnology
Dr.rer.nat. R.Tamme
Institute of Technical ThermodynamicsProf. Dr. Dr.-Ing. habil H.Müller-Steinhagen
Administration and Infrastructure
Dipl.-Wirt.Ing. J. Piskurek
Logistics & Purchasing
Project Administration
Computing Support
Workshops

ISAEST-9, December 2-4, 2010, Chennai, India
ISAEST-9, December 2-4, 2010, Chennai, India
SOFC Activities at
DLR
Characterization of Short Stacks and
Stacks (ASC, MSC)
Development of Metal Supported Cells (MSC)
System TechnologySOFC Diagnostics
Fuelgas Air
SOFC Modeling
H2H2/CO
CH4
H2OCO2
anode
electrolyte
cathode
O2/N2N2
interconnect
interconnect
Ri Resistor Si Switch, Ii Local current
Segmentvoltage,impedance
UlocalZlocal
Segmentcurrent
UIZ
Detailed 2D model of MEA, channel, interconnector
R1 R3 R4R2
R5 R7 R8R6
S1 S3 S4S2
S5 S7 S8S6
I4I3I2I1
Detailed 2D model of MEA, channel, interconnector
R1 R3 R4R2
R5 R7 R8R6
S1 S3 S4S2
S5 S7 S8S6
I4I3I2I1
Cell current,voltage,
impedance

ISAEST-9, December 2-4, 2010, Chennai, India
Development of Metal Supported Cells
LSM + YSZ
YSZ
Ni+YSZNi+YSZ
YSZ
LSM + YSZ
Ni+YSZ
YSZ
LSCF CGO
FeCr
YSZ/SSZ
LSCF CGO
Ni+YSZ
ESC ASC ASC MSC
Improved power density
Improved long-term stability
Reduced operating temperatureAdvantages of MSC:
• High robustness• High resistance against thermal and redox cycling• Good integration into interconnects (bipolar plates)• Low cost of metal support and cell materials (thin layers)

ISAEST-9, December 2-4, 2010, Chennai, India
SOFC Metal Supported Cell
30 m
25 m
35 mBipolar plate
Bipolar plate
porous metallic substrateanodeelectrolyte
contact layercathode current collectorcathode active layer
protective coating
not used airoxygen/air
air channel
fuel channel
fuel brazing not used fuel + H O2
(not in scale)
Plasma Deposition Technology
Thin-Film Cells
Ferritic Substrates and Interconnects
Compact Design with Thin Metal Sheet Substrates
Brazing, Welding and Glass Seal as Joining and Sealing Technology

ISAEST-9, December 2-4, 2010, Chennai, India
Vacuum Plasma Spraying of SOFC Cells

ISAEST-9, December 2-4, 2010, Chennai, India
Plasma Spray Laboratory at DLR Stuttgart
ISAEST-9, December 2-4, 2010, Chennai, India
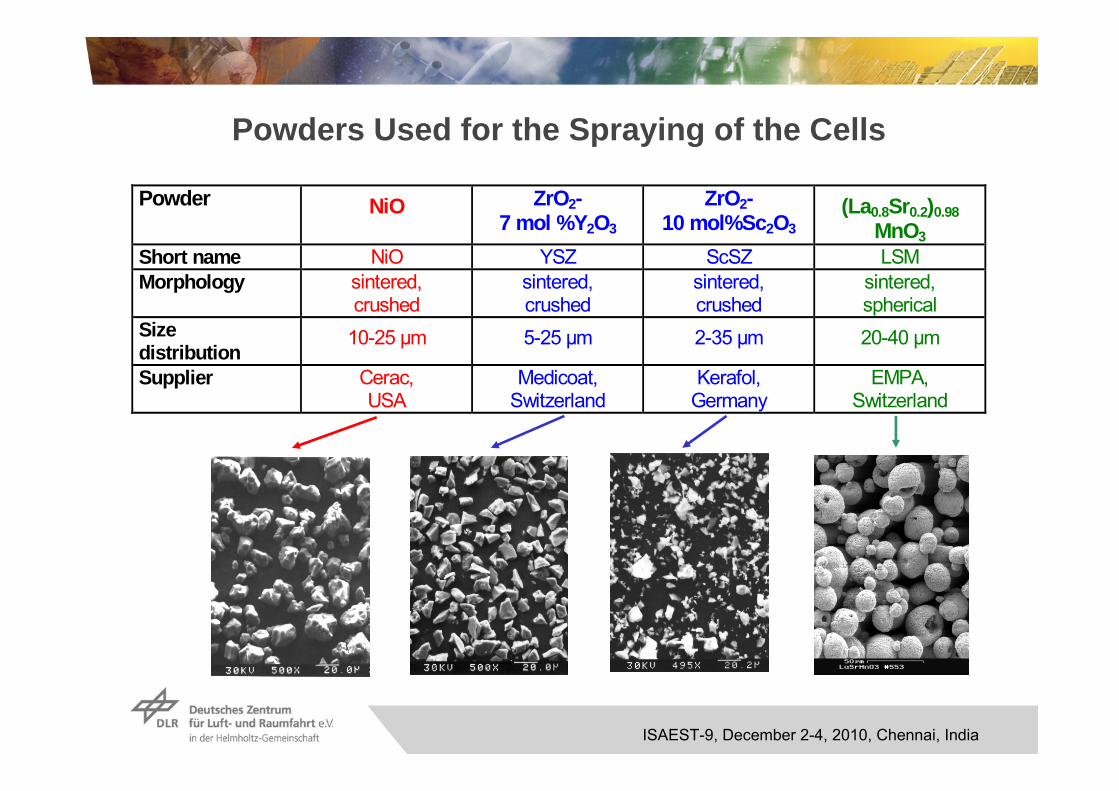
Powders Used for the Spraying of the Cells
Powder NiO ZrO2-7 mol %Y2O3
ZrO2-10 mol%Sc2O3
(La0.8Sr0.2)0.98MnO3
Short name NiO YSZ ScSZ LSMMorphology sintered,
crushedsintered,crushed
sintered,crushed
sintered,spherical
Sizedistribution
10-25 µm 5-25 µm 2-35 µm 20-40 µm
Supplier Cerac,USA
Medicoat,Switzerland
Kerafol,Germany
EMPA,Switzerland

ISAEST-9, December 2-4, 2010, Chennai, India
Morphology of Porous Metal Substrate PM Fe-26Cr-(Mo,Ti,Mn,Y2O3) of Plansee SE

ISAEST-9, December 2-4, 2010, Chennai, India
Metallographic Cross Section of MSC Cell
Porously sintered ferrite plate
8YSZ-electrolyte
Ni/8YSZ-anode
La0.7Sr0.15Ca0.15CrO3-barrier layer
8YSZ-electrolyte
LaSrMnO3-cathode
Perovskite-type barrier layer

ISAEST-9, December 2-4, 2010, Chennai, India
Plasma-spayed cell with sealing by laser welding
Stack Assembly Based on Metal Supported CellStack Assembly Based on Metal Supported Cell
1 = Metallic lower plate2 = Active cell on substrat 4 = Cassette 5 = Stack3 = Metallic frame

ISAEST-9, December 2-4, 2010, Chennai, India
Stack Assembly Based on Metal Supported CellStack Assembly Based on Metal Supported Cell
Current MS-SOFC Repeat Unit
90x120 mm² footprint – ca 100 cm² cell area
Counter flow design
Stamped sheet ferritic steel bipolar plate
Welded Fe-Cr substrate

ISAEST-9, December 2-4, 2010, Chennai, IndiaVortrag > Autor > Dokumentname > Datum
Performance of Plasma Sprayed Metal Supported CellPerformance of Plasma Sprayed Metal Supported Cell
MSC Cell12.5 cm² cell at 800°C; H2/N2 and Air
3-Cell Stack100 cm² single cells at 800°C; H2/N2; Air

ISAEST-9, December 2-4, 2010, Chennai, India
Thermal Cycling
15 thermal cycles performed, 12 down to 350 °C and 3 to ambient temperatureDegradation after thermal cycles was 10.3 %
Thermal cyclesMSC-02-17, 800°C
2 H2+2 N2/ 4 Air (SLPM)458 / 1227 h
0
200
400
600
800
1000
1200
0 50 100 150 200 250 300current density i [mA/cm²]
cell
volta
ge U
[mV]
0
50
100
150
200
250
300
350
400
pow
er d
ensi
ty p
[mW
/cm
²]
U1_startU2_startU1_endU2_endp1_startp2_startp1_endp2_end
p
U
ISAEST-9, December 2-4, 2010, Chennai, India
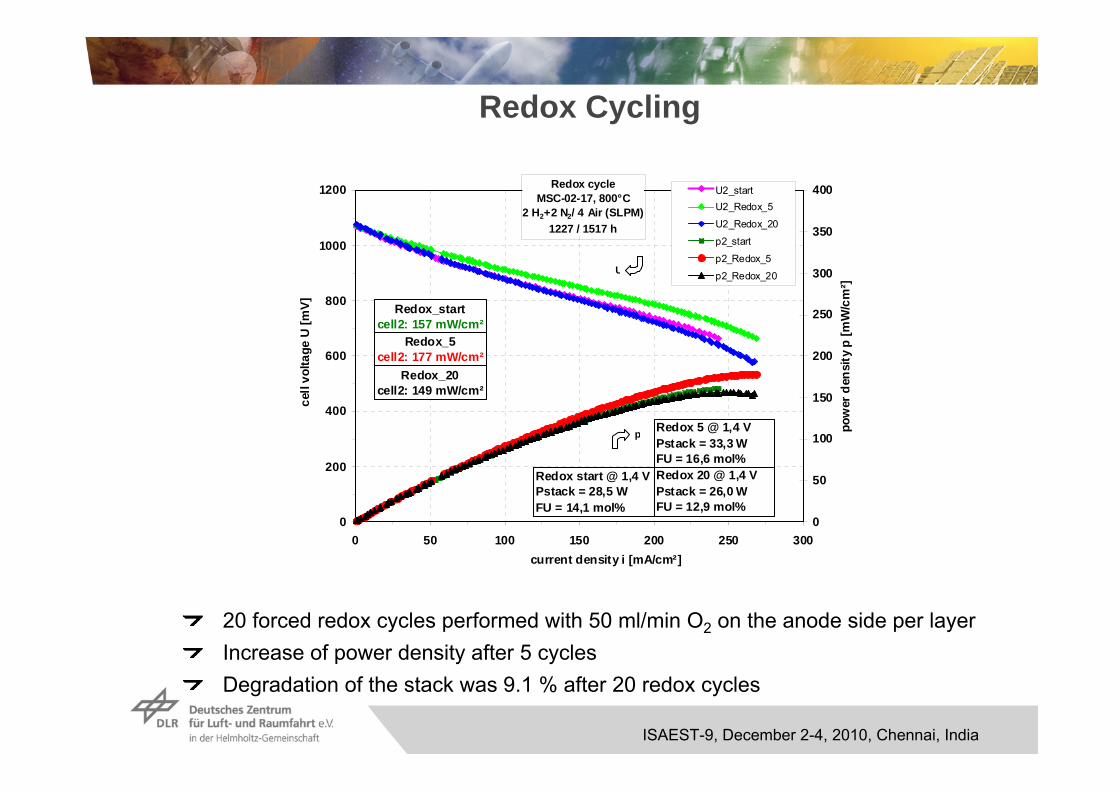
Redox Cycling
20 forced redox cycles performed with 50 ml/min O2 on the anode side per layerIncrease of power density after 5 cyclesDegradation of the stack was 9.1 % after 20 redox cycles
Redox cycleMSC-02-17, 800°C
2 H2+2 N2/ 4 Air (SLPM)1227 / 1517 h
0
200
400
600
800
1000
1200
0 50 100 150 200 250 300current density i [mA/cm²]
cell
volta
ge U
[mV]
0
50
100
150
200
250
300
350
400
pow
er d
ensi
ty p
[mW
/cm
²]
U2_startU2_Redox_5
U2_Redox_20
p2_start
p2_Redox_5
p2_Redox_20
p
U
Redox_startcell2: 157 mW/cm²
Redox_5cell2: 177 mW/cm²
Redox_20cell2: 149 mW/cm²
Redox start @ 1,4 VPstack = 28,5 WFU = 14,1 mol%
Redox 5 @ 1,4 VPstack = 33,3 WFU = 16,6 mol%Redox 20 @ 1,4 VPstack = 26,0 WFU = 12,9 mol%

ISAEST-9, December 2-4, 2010, Chennai, India
Investigation of Degradation and Cell Failures
Insufficient understanding of cell degradation and cell failures in SOFC
Extensive experimental experience is not generally available which would allow accurate analysis and improvements
Long term experiments are demanding and expensive
Only few tools and diagnostic methods available for developers due to the restrictions of the elevated temperatures

ISAEST-9, December 2-4, 2010, Chennai, India
„Sophisticated“ (non-traditional) In-situ Diagnostics
Electrochemical impedance spectroscopy on stacks
Spatially resolved measuring techniques for current, voltage, temperature
and gas composition
Optical imaging
Optical spectroscopy
Acoustic emission detection
X-ray tomography

ISAEST-9, December 2-4, 2010, Chennai, India
Motivation for Spatially Resolved Cell Characterisation
Problems: Strong local variation of gas composition, temperature, and current density
This may lead to:Reduced efficiencyThermomechanical stressDegradation of electrodes
Effects are difficult to understand due to the strong interdependence of gas composition, electrochemical performance and temperature

ISAEST-9, December 2-4, 2010, Chennai, India
Measurement Setup for Segmented Cells
16 galvanically isolated segmentsLocal and global i-V characteristicsLocal and global impedance measurements
Local temperature measurementsLocal fuel concentrationsFlexible design: substrate-, anode-, and electrolyte-supported cellsCo- and counter-flow

ISAEST-9, December 2-4, 2010, Chennai, India
Modelling and Simulation
Ri Resistor Si Switch, Ii Local current
Segmentvoltage,impedance
UlocalZlocal
Segmentcurrent
UIZ
Detailed 2D model of MEA, channel, interconnector
R1 R3 R4R2
R5 R7 R8R6
S1 S3 S4S2
S5 S7 S8S6
I4I3I2I1
Detailed 2D model of MEA, channel, interconnector
R1 R3 R4R2
R5 R7 R8R6
S1 S3 S4S2
S5 S7 S8S6
I4I3I2I1
Cell current,voltage,
impedance
H2H2/CO
CH4
H2OCO2
anode
electrolyte
cathode
O2/N2N2
interconnect
interconnect
Electrochemistry: Elementary kineticsPorous electrodes: Massand charge transportChannels: Transient Navier-Stokes conservationequations (Mass, momentum, particles, energy) Interconnects: energyconservation
W. G. Bessler, S. Gewies, and M. Vogler, Electrochimica Acta 53, 1782-1800 (2007)

ISAEST-9, December 2-4, 2010, Chennai, India
Segmented Cells
Anode supported cells: Segmented cathode (H.C.Starck/InDEC)
Electrolyte supported cells: Segmented cathode and anode

ISAEST-9, December 2-4, 2010, Chennai, India
Test Rig
ISAEST-9, December 2-4, 2010, Chennai, India
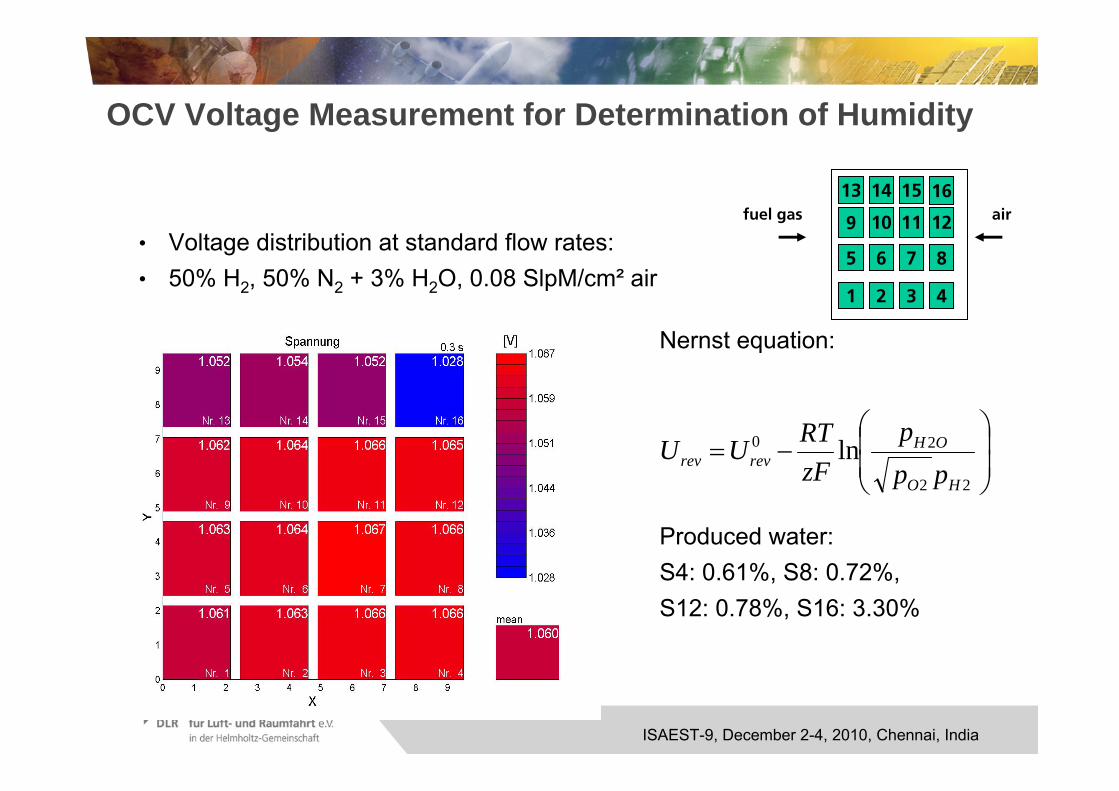
OCV Voltage Measurement for Determination of Humidity
• Voltage distribution at standard flow rates:• 50% H2, 50% N2 + 3% H2O, 0.08 SlpM/cm² air
13 14 15 16
9 10 11 12
5 6 7 8
1 2 3 4
fuel gas air
22
20 lnHO
OHrevrev pp
pzFRTUU
Nernst equation:
Produced water:S4: 0.61%, S8: 0.72%, S12: 0.78%, S16: 3.30%

ISAEST-9, December 2-4, 2010, Chennai, India
Power Density Distributution under Conditionsof High Fuel Utilisation
Counter-flow
Anode: 33% H2, 1% H2O,
66% N2
Cathode: air
T = 800 °C
Cell voltage: 0.59 V
Fu = 80%
Lit.: Fuel Cells, 10 (3), 411-418 (2010)

ISAEST-9, December 2-4, 2010, Chennai, India
Assessment of Local Performance with Segmented SOFCs
Experiment
ModelUlocalZlocal
UIZ
UlocalZlocal
UIZ
16segments
Global Global behaviorbehavior
LocalLocalbehaviorbehavior
CellCell cancan bebe locallylocally in in criticalcritical conditionsconditions!!

ISAEST-9, December 2-4, 2010, Chennai, India
Variation of Load - Reformate
Anode supported cell, LSCF cathode, 73,96 cm², gas concentrations (current density equivalent): 54.9% N2, 16.7% H2, 16.5% CO, 6,6% CH4, 2.2% CO2, 3.2% H2O (0.552 A/cm²), 0.02 SlpM/cm² air
0,0
50,0
100,0
150,0
200,0
250,0
300,0
Segment 9 Segment 10 Segment 11 Segment 12
pow
er d
ensi
ty p
[mW
/cm
²]
0,0
15,0
30,0
45,0
60,0
75,0
90,0
fuel
util
isat
ion
fu [%
]
p(i) 100 mA/cm² p(i) 200 mA/cm² p(i) 400 mA/cm² p(i) 435 mA/cm²
fu 100 mA/cm² fu 200 mA/cm² fu 400 mA/cm² fu 435 mA/cm²
fu
100
200
400435
100
200
400435
Pow
er d
ensi
tym
W/c
m2
Fuel
util
isat
ion
(%)

ISAEST-9, December 2-4, 2010, Chennai, India
Alteration of the Gas Composition at 435 mA/cm²
0
0,05
0,1
0,15
0,2
0,25
0,3
Segment 9 Segment 10 Segment 11 Segment 12
Gas
konz
entra
tion
/ %
H2 CO CH4 CO2 H2O
Con
cent
ratio
n/ %
H2
10 11 12
CO
CH4
H2O
CO2
9
ISAEST-9, December 2-4, 2010, Chennai, India
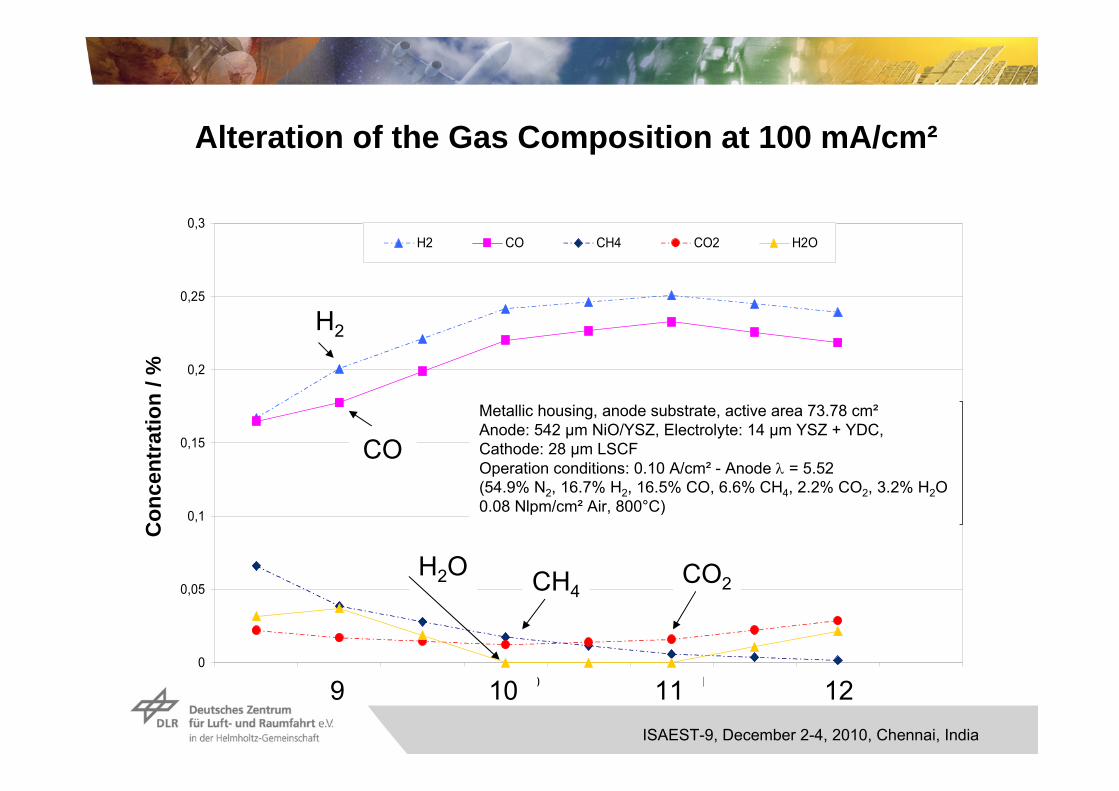
Alteration of the Gas Composition at 100 mA/cm²
0
0,05
0,1
0,15
0,2
0,25
0,3
Segment 9 Segment 10 Segment 11 Segment 12
Gas
konz
entra
tion
/ %
H2 CO CH4 CO2 H2O
KS4X050609-7 in Metallischem Gehäuse; Substrat: Anodensubstrat, aktive Zellfläche:73,78 cm²,A: 542 µm NiO/YSZ, E: 14 µm YSZ + YDC,
K: 28 µm LSCF, Kontaktierung: 30 µm LSP16+Pt3600,Integral, Gasflüsse: 0,552 A/cm² Stromdichteäquivalent (54,9% N2, 16,7% H2,
16,5% CO, 6,6%CH4, 2,2%CO2, 3,2% H20) // 0,08 SlpM/cm² Luft, 800 °C, 100 mA/cm²
Metallic housing, anode substrate, active area 73.78 cm²Anode: 542 µm NiO/YSZ, Electrolyte: 14 µm YSZ + YDC,Cathode: 28 µm LSCFOperation conditions: 0.10 A/cm² - Anode = 5.52(54.9% N2, 16.7% H2, 16.5% CO, 6.6% CH4, 2.2% CO2, 3.2% H2O0.08 Nlpm/cm² Air, 800°C)
Con
cent
ratio
n/ %
9 10 11 12
H2
CO
H2O CO2CH4

ISAEST-9, December 2-4, 2010, Chennai, India
Potential for Optical Spectroscopies
Raman spectroscopyLaser Doppler Anemometry (LDA)Particle Image Velocimetry (PIV)Fast-Fourier Infrared (FTIR)Coherent Anti-Stokes Raman Spectroscopy (CARS)Electronic Speckle Pattern Interferometry (ESPI)
Digital CCD camera
Distance microscope(resolution1 µm)
Quarz window
Transparentflow field
Imagingspectrograph
Lenses/filter
Pulsed Nd:YAG laser(532 nm, 10 ns)
Open tube(5 mm)
a) In situ microscopy b) In situ Raman laser diagnostics
15 cm
Heat & radiation shield
SOFC

ISAEST-9, December 2-4, 2010, Chennai, India
Setup for 1D-Raman Spectroscopy
3 double pulse Nd:YAG PIV 400 laser systemsλ = 532 nmRepetition rate: 10 HzSingle pulse: E ≤ 350 mJ / ~7 nsPulse energy: 6 x 300 mJ Pulse length: ~380 ns
(temporal resolution)

ISAEST-9, December 2-4, 2010, Chennai, India
Transparent Flowfield for SOFC
Top view
Side view

ISAEST-9, December 2-4, 2010, Chennai, India
Experimental Setup for Raman Spectroscopy Measurements

ISAEST-9, December 2-4, 2010, Chennai, India
Cell Housing with Transparent Flowfield in Hot Furnace

ISAEST-9, December 2-4, 2010, Chennai, India
Preliminary Results
Large scatter in detected signalImprovement of S/N ratio needed
H2 + 3% H2O850 °C

ISAEST-9, December 2-4, 2010, Chennai, India
Preliminary Results
Measurements and evaluation still in progressTendencies of the species concentration profiles can be seen
H2 + 3% H2O850 °C
ISAEST-9, December 2-4, 2010, Chennai, India
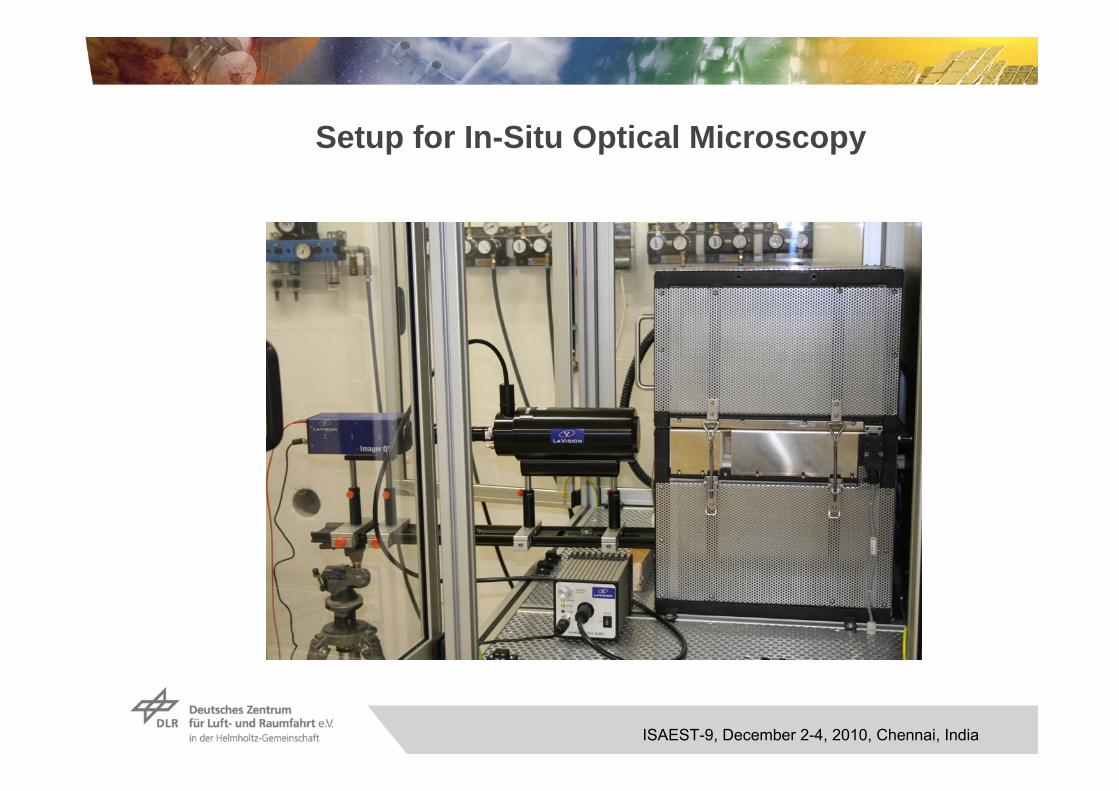
Setup for In-Situ Optical Microscopy

ISAEST-9, December 2-4, 2010, Chennai, India
Conclusions
The development of the metal supported SOFC concept has a high potential for SOFC application in dynamic operation with multiple thermal and redoxcycles
Scale-up to a full size cassette with adequate cell performance is under way
In-situ diagnostic techniques allow for a largely extended insight into fuel cellprocesses
The obtained experimental data using a segmented cell setup that allows forthe measurement of local i-V characteristics, gas composition and temperaturecan be used for modeling and simulation
Strong gradients of gas concentrations and current density particularly at operation with high fuel utilisation may result in locally critical operatingconditions
Additional in-situ diagnostic methods such as optical microscopy and gas-phase Raman Spectroscopy can provide further information for theunderstanding of cell reactions and processes

ISAEST-9, December 2-4, 2010, Chennai, India
Acknowledgment
I‘d like to thank my colleagues who contributed to this presentation:Asif AnsarCorinna AuerHolger AxWolfgang BesslerClaudia ChristennPatric SzaboCaroline Willichand all co-workers in our Department „Electrochemical Energy Technology“
Financial support from German Federal Ministry of Economics and fromState Ministry of Baden-Württemberg is gratefully acknowledged.

ISAEST-9, December 2-4, 2010, Chennai, India

ISAEST-9, December 2-4, 2010, Chennai, India
Locally Resolved Power Density Distribution and Fuel Utilisation in Dependence of H2 Concentrations
0.0
50.0
100.0
150.0
200.0
250.0
300.0
Segment5
Segment6
Segment7
Segment8
pow
erde
nsity
p[m
W/c
m²]
0.0
20.0
40.0
60.0
80.0
100.0
120.0
fuel
utilis
atio
nfu
[%]
p(i) 2%H2 p(i) 5%H2 p(i) 10%H2 p(i) 20%H2p(i) 50%H2 p(i) 100%H2 fu 2%H2 fu 5%H2fu 10%H2 fu 20%H2 fu 50%H2 fu 100%H2
fu