Embed Size (px)
Citation preview

FINAL TECHNICAL REPORT March 1, 2002, through September 30, 2003
Project Title: DEVELOPMENT AND DEMONSTRATION OF ADVANCED
MINING TECHNOLOGIES TO REDUCE PRODUCTION COSTS ICCI Project Number: 01-1/1.1D-5 Principal Investigator: Dr. Y. P. Chugh, Southern Illinois University Other Investigators: M. McGolden, J. Hirschi, K. Thatavarthy, A. Moharana, E. Roberts and B. Meyer Project Manager: Dr. Ronald Carty, Illinois Clean Coal Institute
ABSTRACT
The overall goal of this project is to develop technologies that would reduce underground coal production cost by 20%. This report documents studies in three areas: 1) industrial engineering studies of a high-voltage miner and face haulage systems, 2) improved efficiency of continuous miner wet scrubbers through design modifications and surfactant use, and 3) control of out-of-seam dilution. The Coal Industry Research Steering Committee identified these areas as high priority to achieve the desired cost reduction. Industrial engineering studies involved 1) performing time studies and production modeling of typical mining layouts and equipment currently in use in Illinois, and 2) assessing impact of a battery shuttle car and a surge car on production. Studies indicate that use of battery shuttle cars has the potential to increase a typical section production by about 15%. Performance characteristics of currently used face haulage systems were developed to identify needs for advanced face haulage systems. Improving efficiency of wet scrubbers for dust control involved systematically evaluating the effect of variables such as spray nozzle type, spray pressure, volume of water, surfactant concentration, and spatial distribution of sprays. Two-filter, two-spray concepts for a wet scrubber were tested. Laboratory results indicate that a properly designed two-filter, two-spray scrubber can reduce dust concentrations by over 50% from 3.58 mg/m3 to 1.9 mg/m3. These results were achieved with a smaller volume of water (5-gpm) at lower spray pressure (40-psi) with only 50% of the surfactant concentration used in previous tests. This study attempted to analyze dilution of run-of-mine coal and its impacts on cost due to intentional or non-intentional mining of roof and floor strata. A simplified mathematical model to understand dilution was developed. An analysis of questionnaire data and personal interviews with mining professionals led to the conclusion that an education and training program, emphasizing cost impacts of dilution, should be developed for production workers.
EXECUTIVE SUMMARY Background With financial support from the Illinois Clean Coal Institute and coal mine operators throughout Illinois, the authors have been working on the project “Identification of Cost Cutting Strategies for Underground Coal Mines in Illinois”, since October 2000. A 20% cost cutting goal, with respect to the current typical FOB price of $20 per ton, was established. The project is being driven by a steering committee, hereby known as the Coal Industry Research Steering Committee, consisting of representatives from most of the active coal companies in Illinois as well as other industry partners. The first phase of the project was completed under a previous ICCI grant. The following four top-priority areas of focus were identified for future research and development efforts.
1. Potential of high-voltage continuous miners to increase face productivity 2. Development of alternative face haulage systems to optimize production capacity
of continuous miners 3. Improved dust control in face areas 4. Control of out-of-seam dilution
This report documents results of studies performed in these areas. Area I: Industrial Engineering Studies of High-Voltage Continuous Miner
Performance and Alternate Face Haulage Systems Industrial engineering studies tasks included: 1) production modeling of high voltage and standard voltage continuous miners in a room-and-pillar layout, 2) collection of time studies data in a longwall development section and its production modeling, 3) perform time studies on face haulage systems currently in use to develop their characteristics, and 4) offer an information transfer workshop to mining professionals in Illinois. Two time study data collection forms were developed in concert with industry and used throughout the project. Time study data collection involved two persons; one at the production face and one at the feeder. Statistical data analysis procedures were utilized to develop elemental times data, which were then used in the Suboleski-SIU Production model (SSP) for production estimation. The SSP is a simplified production model for partial extraction mining layouts. It estimates expected unit shift production rates by calculating the mining rate averaged over two or three crosscuts of advance (belt move to belt move). The original model, developed by Suboleski, has been modified at SIU to improve data input and data output characteristics. The results of the industrial engineering studies are summarized below:

• The major difference between standard-voltage and high-voltage miners is in load time during normal cutting operation. In a side-by-side comparison of two continuous miners at one mine, average load time, change-out time, and reset time during normal operation for a standard-voltage miner were 0.772, 0.622, and 1.175 minutes, respectively. Similar data for a high-voltage miner were 0.555, 0.628, and 0.917 minutes, respectively. Similar data for the two miners during clean-up operation (1.461, 0.596, 1.792 and 1.408, 0.595, 1.754 minutes, respectively) are statistically similar. Therefore, a high-voltage miner has the potential to increase production by 30% provided coal can be hauled away from the face, and the roof bolting cycle is matched with the cutting cycle.
• Haulage unit capacity is the most important variable affecting production potential of a mining section followed by loading rate of the continuous miner. Haulage unit capacity must be suitably designed for continuous miner characteristics for optimal production.
• Continuous haulage may have limited potential in Illinois mines because of rolling floor structure, and relatively weak roof and floor conditions. Therefore, battery shuttle cars alone or in conjunction with a surge car may be the best alternative to increase production potential of standard- or high-voltage continuous miners.
• Tethered shuttle cars limit production potential of a continuous miner since no more than three such shuttle cars can operate effectively.
Area II: Development of a Modified Wet Scrubber for Improved Dust Control Improved productivity in the face area requires that respirable dust in the mining areas be controlled to less than 2 mg/m3. Since wet scrubbers on continuous miners represent the most common technology for dust control, an improved wet scrubber with the use of surfactants was an important research area in this project. The more specific objectives of this research were to 1) systematically evaluate the effect of different variables affecting dust control, and 2) develop and test concepts for an improved wet scrubber. An industry driven dust control steering committee met three (3) times to provide oversight and guidance to this research. All studies were performed in the SIU–Joy Dust Control Facility located at the Illinois Coal Development Park in Carterville, IL. The variables considered here were number of filter layers, type of spray (full-cone or hollow-cone, vertical or horizontal), spray water volume, surfactant concentration, and number of sprays and number of filters. Statistical experiment design and data analysis techniques were utilized. The following is a summary of the results.
• Reducing spray pressure from 80-psi to 30-psi for a single filter, single horizontal spray has negligible effect on dust concentration. Therefore, lower water spray pressure may be used.
• Concepts for a two-filter, two-spray wet scrubber were developed and incorporated into the scrubber unit provided by Joy. In this design, the first water-only vertical spray (2-gpm) wets most of the coarse dust. The ultra-fine dust, non-

wettable by water alone, is wetted by the second vertical water-surfactant spray and removed by the second vertical or inclined filter.
• An optimized two-filter, two-spray wet scrubber reduced dust concentrations by over 50% from 3.58 mg/m3 to about 1.9 mg/m3 in the laboratory. This was achieved with a smaller volume of water (5-gpm) at 40-psi spray pressure with about 50% of the surfactant concentration used in previous tests.
• A dust measurement laboratory was developed at SIU in cooperation with the Mine Safety and Health Administration (MSHA).
The dust control steering committee recommended that the developed concepts be incorporated into a commercial scrubber and tested in the field. Area III: Identification of “Best Practices” for Reduction in Out-of-Seam Dilution In Illinois, only 60%-70% of the run-of-mine coal is of marketable quality for power generation. The remaining 30%-40% has very low heating value (≈ 1,000 Btu/lb) because of high ash content related to immediate roof and floor strata associated with a coal seam. The mining of the immediate roof and floor strata, along with rock bands in the coal seam, represent in-seam and out-of-seam dilution (OSD). Since only OSD may be controlled, most of the discussion here refers to OSD only. The OSD affects production cost and profitability of a mining enterprise since the marketable coal represents the only revenue stream. The OSD facet of mining and its impacts on production costs is not well understood. It is only in the last 2-3 years that industry has considered ways to reduce OSD. The goals of this research were to 1) understand the impact of OSD on production cost, 2) identify “best practices” to reduce OSD, based on interviews with mining professionals in Illinois, and 3) develop an activity to have an exchange of ideas on the OSD topic. The overall approach consisted of: 1) developing a methodology for assessing cost and profitability impacts, 2) identifying variables affecting dilution, 3) developing a questionnaire to collect data, 4) interviewing coal companies personnel, and 5) identifying “best practices” to minimize dilution. A questionnaire was developed and sent to all mines in Illinois. The questionnaire sought information on geology of immediate roof and floor strata and the coal seam, mining practices, and an assessment of practices adopted by industry to control dilution. After a review of the data provided by the mine, the project staff met with company professionals to discuss data reported in the questionnaire. A mathematical model was developed to understand the problem of OSD. The model was used to clearly define the effect of OSD on production and profitability of a mining operation. The questionnaire and personal interview information and data were utilized to identify “best practices” for OSD control. An analysis of questionnaire data and personal interviews led to the following findings:
• Dilution has not been a major priority at most mines until recently. Most managers are now starting to talk about dilution to the face workers to enhance dilution awareness and its financial impacts. Cost of dilution is not fully understood.

• Most managers believe equipment controls for horizon control and interface detection (both currently available) do not work and are not necessary.
• Improved dust control at the face will help control dilution by enhancing visibility.
• Exploration data do not provide enough accuracy in seam thickness, and structural behavior of roof and floor to be useful for dilution control. Immediate roof and floor strata are generally not characterized for impacts on coal quality.
• Education and training of first line supervisors, continuous miner operators, and roof bolter operators is the key to minimizing dilution. Education and training must include cost and profitability impacts of dilution.
• Partial management of dilution underground has safety concerns and must be approved by MSHA.
• This study estimates the cost of dilution to be about $4.60/clean ton. Identification and development of “best practices” was performed in four areas: 1) engineering characterization, 2) equipment and technological control, 3) management controls, and 4) education and training. The selected areas identified as large pay off areas for further development were: 1) work with MSHA to develop safer ways to manage OSD underground and then sort out and dispose of dilution underground to reduce material handling costs, processing costs, and waste disposal costs, 2) develop education and training programs with emphasis on cost of dilution and its impacts on company profitability, and 3) implement management initiatives for coal quality control.

1
OBJECTIVES
In an earlier project, “Identification of Cost-Cutting Strategies for Underground Coal Mines in Illinois”, funded by the ICCI in October 2000, the following four top-priority areas were identified for research and development: 1) high-voltage continuous miners, 2) alternate face haulage systems, 3) development of a modified wet scrubber for improved dust control, and 4) reduction in out-of-seam dilution. Therefore, this project focused development and demonstration in these areas. The project goals are briefly described below in three areas. Area I: Industrial Engineering Studies of High-voltage Continuous Miner
Performance and Alternate Face Haulage Systems The overall goal in this project area is to develop matched production systems, which will 1) increase face productivity, and 2) produce raw coal at lowest cost per ton. The specific objectives of the industrial engineering studies are to 1) compare the production potential of high-voltage and standard-voltage continuous miners, 2) develop production characteristics of existing face haulage systems to identify needs for improved face haulage systems such as a battery shuttle car and a surge car behind the miner, and 3) offer an information transfer workshop to mining professionals in Illinois. Area II: Development of a Modified Wet Scrubber for Improved Dust Control The overall goal in this area is to develop a commercial wet scrubber that is more efficient for dust control than current scrubbers. The more specific objectives are to 1) systematically evaluate the effect of different variables on dust control, and 2) develop and test concepts for an improved wet scrubber using surfactants. Area III: Identification of “Best Practices” for Reduction in Out-of-seam Dilution The overall goal in this area is to reduce out-of-seam dilution. The more specific objectives of this area are to 1) understand the impact of OSD on production cost, and 2) identify “best practices” to reduce OSD based on interviews with mining professionals in Illinois, and 3) develop an exchange of ideas on the OSD topic.
INTRODUCTION AND BACKGROUND
The industrial engineering study on continuous miner performance focused on developing a production simulation model for partial extraction mining systems using results from an industrial engineering study of a high-voltage miner conducted under the previous grant. The study of alternate face haulage systems aimed at developing and demonstrating battery-powered shuttle cars to maximize the production capacity of new high-capacity continuous miners. The study examined the new car in both a traditional haulage scenario and in a “surge car” scenario that minimizes change-out delays typical of batch haulage. However, the car is yet to be tested in an Illinois mine. The project team

2
has simulated the parameters of the advanced haulage systems under various conditions and these have been discussed with a cooperating industrial partner, Phillips Machine Service. The coal industry continues to produce technological improvements that reduce operating costs, increase productivity, and provide a safer work environment. As each improvement is made, the new weakest link in the system is exposed. Design and implementation of the new higher horsepower continuous miners simply magnified the need for a better batch haulage system to optimize their performance. Face productivity improvements possible with the success of this project alone will make an impact that could reduce the production costs of continuous miner operations by greater than 10%. The financial impact on longwall operations would obviously be different, since the great majority of their production is from the longwall face. However, most longwall operations are restricted by their development rates, and this system should provide similar benefits to longwall operations also. In some cases, due to their pillar and entry configurations, the impact on longwall development may even be greater than typical continuous miner operations. Since productivity and production measures are easily quantified, and are constantly monitored by the industry, the benefits of this project will be easy to identify. Use of the Suboleski-SIU Production (SSP) model should also make it relatively simple to estimate potential improvements due to any change in equipment or operation cycles. Since the 2 mg/m3 dust standard was established in 1977, dust control research has focused on assisting mines with compliance. The most significant advancement in this area was the development of the flooded bed scrubber on the continuous miner. Additionally, considerable improvements have been made in the dust suppression efficiency of water sprays. However, research has shown that these technologies do a better job of controlling the larger, non-respirable dust particles than the smaller ones that are of greater concern because of their effect on the miners’ long-term health1. Thus, new technologies, such as the use of surfactants, must be developed to more effectively remove the finest dust particles from the mine atmosphere. The first objective of this work was to investigate the effect of wetting agents on the suppression of respirable coal dust as measured by commonly accepted practices. This was accomplished by measuring efficiency improvements on a continuous miner scrubber. Saha2 studied the effect of filter layers, surfactant concentration and spray pressure on dust concentration. The results obtained indicated that the number of filter layers was the most critical parameter followed by spray pressure and surfactant concentration for reducing dust concentrations. A single full-cone surfactant spray of 5.9-gpm, 40-psi was used and tests were conducted at high spray pressures of 60-, 80- and 100-psi. This was considered as a drawback of this study since the industry suggests lower spray pressures and reduced spray water volume thereby reducing surfactant costs. This study was
1 Kim, J. and Tien, J. C., 1994, “The Effect of Added Base on Coal Wetting Ability of Nonionic Surfactant Solution Used for Dust Control”, Min. Eng., Dec., pp. 151-154. 2 Saha, A., 2001, “An Assessment of the Effectiveness of Surfactants on Dust Control using a Continuous Miner Scrubber”, M. S. Thesis, Department of Mining and Mineral Resources Engineering, SIUC, pp. 77.

3
conducted to modify the wet scrubber system in several phases to improve its efficiency and obtain reduced dust concentrations. In Illinois, only 60%-70% of the run-of-mine coal is of marketable quality for power generation. The remaining 30%-40% has very low heating value (≈ 1,000 Btu/lb) because of high ash content in the immediate roof and floor strata associated with a coal seam. The mining of the rock bands in the coal seam along with immediate roof and floor strata represent in-seam and out-of-seam dilution (OSD). Since only OSD may be controlled, most of the discussion here refers to OSD only. The OSD affects production cost and profitability of a mining enterprise because only the marketable coal represents the revenue stream. The OSD facet of mining and its impacts on production cost are not well understood. It is only in the last 2-3 years that industry is reviewing ways to reduce OSD. There is a potential to reduce production cost by 5%-10% if OSD cost is significantly reduced. Out-of seam dilution can be linked to quality of roof and floor materials, type of mining equipment, seam height, and management attitudes etc. Each mining operation has different issues. However, in all cases, the potential exists to significantly improve mine profitability through a reduction in out-of-seam dilution. The most common causes of out-of seam dilution are 1) weak roof and floor strata, 2) low seam height, 3) larger and heavier equipment, and 4) high production systems.
EXPERIMENTAL PROCEDURES Area I: Industrial Engineering Studies of High-Voltage Continuous Miner
Performance and Alternate Face Haulage Systems Industrial engineering (IE) studies Every operating mine in Illinois was contacted regarding the IE studies and during the course of this project, time studies were performed at six (6) mines. The time studies were all two-man time studies using standardized data collection forms typical of those used throughout the industry. One form, used by a person stationed at the face area, captures loading and change-out times by recording when haulage units arrived at the change-out point and at the continuous miner. The other form, used by a person stationed at the feeder, captures dump times and switch-out times by recording when the haulage units arrived at and left the feeder. The stopwatches used by each person were synchronized at the beginning of the study period and correlating times on both data sheets provides tram times, which were used in conjunction with mine maps to determine tram speeds. Recorded times were then entered into an EXCEL spreadsheet that computed incremental and mean times for loading, dumping, travel, change-out, miner resets, and delays. Standard deviations were also determined and used to check for data relevancy. These spreadsheets also included a summary sheet listing of all average values for each cut from

4
which overall averages were determined for input into the SSP (Suboleski-SIU Production) model. Brief description of the SSP model The SSP model is a simple deterministic worksheet. It determines an expected unit shift production rate by calculating the mining rate averaged over two or three crosscuts of advance (belt move to belt move). The model is divided into three worksheets: data section, calculation section, and output section. The data section consists of describing mine plan parameters including change-out distances, haul distances, depth of cut, and number of cars used for each cut. Additional input parameters, which remain relatively constant for a particular mine, are entered in the calculation section. These include loading rates, dump rates, length of the miner and car, shuttle car capacities and speeds, and geological parameters such as mining height, amount of reject, etc. In the calculation section, the model determines the time taken in each cut for loading, dumping, tramming, and changing out and adds them together with expected delays to get the total cycle time for the particular cut. The number of cars used for a particular cut determines the amount of time the miner is waiting on cars and the amount of time the cars spend waiting at the change-out point, if any. This is also part of the total cycle time. The production per shift is determined by multiplying the mining depth, height, and width with the density of coal. The production rate is determined by dividing shift production by the total cycle time. The output section gives a brief summary of calculated production rates as well as averaged load times, change-out times, and wait-on-car times on a per cut and a per shift basis. The aim of the production model is to provide a worksheet where input parameters can be individually varied and the effects studied in an effort to maximize output of the production system. The model described above does not optimize the production system. Optimization is left to the user and is typically done by making multiple runs. The project team continues to improve the model to develop it for mine planning and optimizing production potential of a mining layout. Area II: Development of a Modified Wet Scrubber for Improved Dust Control The overall research was divided into four phases: Phase 1 studies - Reduced spray pressure; Phase 2 studies – Two-spray system; Phase 3 studies – Modification of the spray system; and Phase 4 studies – Scrubber studies for Mine 1 and Mine 2 coals. Design factors Several factors can improve the dust control efficiency of a continuous miner scrubber. a) Filter Layers: The filter medium in the wet scrubber consists of layers of stainless steel wire mesh secured in a flat filter panel. Filters containing 5, 10, 15, 20, 30 and 40 layers of wire mesh are commercially available. The 20-layer panel is the most common

5
filter used throughout the industry. For this study, 5-, 10-, and 20-layer filters were employed in testing. b) Spray Type: Potable water supply was available at the Illinois Coal Development Park and was used for all scrubber tests. Full-cone and hollow-cone spray nozzles, and horizontal and vertical sprays were tested to evaluate their effectiveness for dust control. c) Spray Volume: Multiple low gpm (gallons-per-minute) spray nozzles were used instead of a single high gpm spray nozzle to improve the interaction between dust-laden air and spray water. Full-cone and hollow-cone spray nozzles with spray volumes of 0.5-, 0.67, 1-, 2-, 3- and 4-gpm spray nozzles at 40-psi spray pressure were employed in this study. d) Surfactant Concentration: Surfactants were added to increase the wetting characteristics of plain water. Most tests were conducted using 0.005% concentration. A limited number of tests were conducted using 0.006% and 0.007% concentrations. Experimental design methods In an experiment, one or more variables (or factors) are purposely changed in order to observe their effect on one or more response variables. The (statistical) design of experiments (DOE) is an efficient procedure for planning experiments so that the data obtained can be analyzed to yield valid and objective conclusions. The DOE begins with determining the objectives of an experiment and selecting the factors for the study. Several experimental designs are useful when one is attempting to model a response surface. For the first two phases, a three-level completely randomized Box-Behnken experimental design approach was used. A test matrix of 17 tests was prepared with the assistance of the Design Expert software package developed by Stat-Ease, Inc. For the remaining phases, a D-optimal design provided by a computer algorithm was used. Such designs are particularly useful when classical designs do not apply. Unlike standard classical designs such as factorials and fractional factorials, D-optimal design matrices are usually not orthogonal and effect estimates are correlated (NIST/SEMATECH e-Handbook of Statistical Methods). The D-optimal design procedure generates multi-factor experiments with both quantitative and qualitative factors. The factors can have a mixed number of levels. For example, spray pressure can be varied over three levels 20-, 30- and 40-psi. Test facility Chugh3 developed the SIU dust control laboratory in collaboration with Joy Mining Machinery. As shown in Figure 1, the laboratory consists of the scrubber system, a controllable dust feeder, and a sampling room modeled after a mine entry or tunnel.
3 Chugh, Y.P., Hirschi, J., Saha, A., and Mohanty, M., 2002 “Evaluating the Use of Surfactants to Enhance Dust Control Efficiency of Wet Scrubbers for Illinois Coal Seams”, U.S. Mine Ventilation Symposium, 2002.

6
Figure 1: Layout of the SIU-Joy Dust Control Laboratory (not to scale). Coals and surfactants studied Three different coal samples from various companies were used in this study. The coals are: 1) Mine 1 (#6 Coal), Northern Illinois, 2) Mine 2 (#6 Coal), Southwestern Illinois, and 3) Mine 3 (#5 Coal), Central Illinois. The coal samples were collected in 55-gallon (210 liters) barrels and transferred to the pilot-scale research facility at SIU. The barrels were marked properly and sealed airtight to minimize the effect of oxidation. Raw coal was first ground in a Gundlach hammer mill and then, this ground coal was fed into a Jetamiser compressed air pulverizer. The fine pulverized coal dust produced was stored in drums and was sealed airtight. The ground coal dust was sieved and only – 200 mesh size dust was used for the small-scale laboratory experiments. For the large-scale scrubber tests pulverized coal dust from Jetamiser was used. Four different nonionic surfactants were used in this study. The surfactants used, their ingredients, solubility in water and specific gravity are shown in Table 1.
Table 1: Properties of surfactants used for the study.
Surfactant Ingredients Solubility in water
Specific gravity
1 Alcohols, C9-11, ethoxylated Complete 0.984
2 Alkyl phenol ethoxylate, Dipropylene glycol
monomethyl ether and Sodium cocyl isethionate
Complete 1.219
3 Alkyl phenol, sodium stearate Complete > 1 4 Not mentioned Complete 1.016
12 ft wide X 9 ft high
25 ft
4 ft
15 ft
Fan
Sump Pump Spray
Scrubber System
Sampling Room
Filter
Demister Chamber
Dust Feeder
Sampling Locations

7
Dust characteristics For the scrubber studies in dust control research, it is important to determine the amount of respirable dust (less than 15 microns) in a given coal dust sample. Micro-Trac ultra-fine particle size analysis was conducted on Mine 1 and Mine 2 pulverized coals. Four runs were made for each coal. A summary of the particle size analysis for Mine 1 and Mine 2 coals is shown in Figure 2. The above analysis shows that respirable dust accounts for 80 to 85 percent of the coal dust sample. This is a significant amount and it allows the project team to be confident that the dust concentration results from scrubber tests performed would be applicable to respirable coal dust control in the field.
0.0
10.0
20.0
30.0
40.0
50.0
60.0
70.0
80.0
90.0
100.0
1 10 100 1000
Size (micron)
Cum
. Wei
ght
Pass
ing
(%)
Mine 2 Mine 1
Figure 2: Particle size analysis for dust in scrubber tests. Area III: Identification of “Best Practices” for Reduction in Out-of-seam Dilution The overall approach consisted of: 1) developing methodology for assessing cost and profitability impacts, 2) identifying variables affecting dilution, 3) developing a questionnaire to collect data, 4) interviewing coal companies’ personnel, and 5) identifying solutions to minimize dilution. A questionnaire was developed and sent to all coal mines in Illinois. It sought information on geology of immediate roof and floor strata and the coal seam, mining practices, and an assessment of practices adopted by the industry to control dilution. After a review of the data provided by the mine, the project staff met with company professionals to discuss data reported in the questionnaire. A mathematical model was developed to understand the problem of OSD. The model was used to clearly define the effect of OSD on production and profitability of a mining operation. The questionnaire data and personal interview information data were utilized to develop recommendations to reduce OSD.

8
RESULTS AND DISCUSSION Task 1.1: Perform Computer Simulation Studies of Productivity using High-voltage
and Standard-voltage Continuous Miners The goals of this task were to: • Develop a production model that can accurately predict the production of a
continuous miner section within an acceptable error limit. • Make the production model easy to use for mining professionals. Simplify input and
output sections such that mine management can use the model as a handy tool for production planning as well as manpower allocation.
• Demonstrate that the higher productivity of the high-voltage miner can only be realized if the haulage system is not allowed to become a bottleneck.
• Provide a simple tool to the mining industry for making equipment selection decisions and mine planning.
Toward the above goals the following tasks were performed: • A production model in EXCEL format developed by Dr. Stan Suboleski of A. T.
Massey Company was procured. • Separate input and output worksheets were added to the model to facilitate its use by
the industry. • Modeling of various scenarios in many Illinois mines was performed and the
accuracy of the results verified. The modified model has been termed Suboleski-SIU Production (SSP) model
Statistical analysis of high-voltage and standard-voltage continuous miner time study data During the previous project, the project team conducted a detailed time study analyzing the production characteristics of a new high-voltage continuous miner. The study was performed at an Illinois mine with one operating super-section and the results were reported to the ICCI in the Final Technical Report for project 00-1/1.1A-1. The higher loading rates and tram speeds of the high-voltage machine were clearly evident, as was the lack of improvement in mine productivity. This deficiency turned the attention of the project team to haulage systems and a concerted effort was made to reevaluate the data from a haulage perspective. During the course of the time study, the two continuous miners operated in two different sections in the mine. The high-voltage miner was identified as Miner B, while the machine with standard voltage was labeled Miner A. The first section (001) was a room-and-pillar panel; the second section (002) was a main entry development. Because these sections had different pillar spacing, the data were evaluated separately. The main parameters investigated in the statistical analysis were load time, change-out time, and reset time. Mean times were calculated for each cut and for all of the cuts combined. A comparison of the mean and standard deviation for each miner and each section are given in Table 2.

9
Table 2: Summary of statistical analysis of high-voltage and standard-voltage miner time study data.
Load Time Change-out Time Reset Time
Type of Cars Section Miner µ σ n µ σ n µ σ n
Normal 001 A 0.798 0.064 29 0.548 0.0635 29 1.304 0.379 28 Clean Up 001 A 1.566 0.736 29 0.554 0.2054 29 1.791 0.984 24 Normal 001 B 0.553 0.052 37 0.563 0.0868 37 0.898 0.287 37
Clean Up 001 B 1.511 0.632 36 0.563 0.2099 37 2.093 1.003 31 Normal 002 A 0.747 0.078 73 0.697 0.2203 73 1.047 0.429 71
Clean Up 002 A 1.357 0.647 73 0.638 0.274 73 1.794 0.998 67 Normal 002 B 0.557 0.08 75 0.694 0.1953 75 0.936 0.448 71
Clean Up 002 B 1.306 0.685 76 0.628 0.2718 75 1.416 0.763 67 µ - mean value; σ - standard deviation; n – number of observations.
As previously reported, there was a significant difference between the performances of the miners as far as normal load time is concerned. By using the high-voltage miner, a reduction in normal load time of 30% was obtained in section 001. For section 002, the reduction in normal load time was 25%. The data for change-out time and reset time for the two miners are similar. There was a difference in the reset time in the first section but there was no significant difference in the second section. Reset time data also have a large standard deviation so there is less confidence when comparing the reset times for the two miners. Operating on the hypothesis that a further analysis of similar cuts between the miners would give a better understanding as to whether change-out time and reset time are related to the type of miner, a comparison of like cuts was performed on the first section. The high-voltage miner had a lower mean normal load time in each category of cuts as expected. The normal reset time of the high-voltage miner was also lower than the standard miner in each category of like cuts in the first section. Since the study was conducted in a mine with weak floor, the results here may not be applicable to all mines. Other variables, such as number of haulage units assigned to each miner and change-out distance, could also have an impact upon change-out time, but they were not studied due to difficulties in extrapolating haulage data from a continuous miner time study. While analyzing the high-voltage miner data, the project team began searching for and evaluating various production modeling and simulation packages. While very few Illinois operations were using such a tool, some did have them available. In attempting to upgrade one of these packages, the project team was referred to Dr. Stan Suboleski of A.T. Massey. He provided his own “Mathematical Model of Production”, a spreadsheet converted from Lotus to Excel, along with some detailed instructions on how to use it. With Dr. Suboleski’s spreadsheet in hand, project staff visited three Illinois mines and collected time study data for two or three cuts. Loading rates, car capacities, tram speeds, and dump times were calculated from the data and input into the spreadsheet. Cut

10
sequences and haulage routes provided by mine management were also entered as input data. In all three cases, the spreadsheet was found to effectively model the production characteristics for the mine. However, the size of the spreadsheet led to challenges in manipulating the input data and giving visual presentations to mine management. With Dr. Suboleski’s approval and guidance, a modified model was developed to overcome these challenges. This modified model was called the Suboleski-SIU Production model (SSP). The SSP has been used widely in this project to estimate a mine’s production rate under various conditions. A base case is established using present mining conditions and working equipment. It is correlated to actual production results by adjusting a value for unexpected delays. Then, by varying input values for different parameters such as loading rate, car capacity, etc., sensitivity analyses are performed. Some of these studies are described below. All studies assume 20-foot entry width, unless otherwise noted. During industrial engineering studies at the mines, the project team found that, apart from continuous miners and face haulage systems, the bolter has an impact on section production. The mines where the bolter was able to bolt the face faster than the continuous miner cycle were able to make the most cuts per shift. Thus, the bolter can limit the number of faces that can be mined per shift. The impact of the bolter has not been incorporated in the SSP, but the project team plans to do so in the near future. Case study – Mine A Mine A is a room-and-pillar super-section (two miners per section) operation utilizing battery ram-car haulage. Panels have eleven entries on 60-foot centers with 20-foot entry width advancing four crosscuts between belt moves. A typical cut sequence is shown in Figure 3. A base case was established with time study data collected by project staff and then five scenarios were evaluated for their effect on production enhancement. It was assumed in this study that the roof bolting cycle is always less than the continuous miner cycle. Thus, roof bolting is not a limiting factor in the production.
191 189 187 185 183 192 190 188 186 184 182
179 209 199 177 207 197 175 205 195 173 201 193 171 203 211 181 202 212 180 200 210 178 198 208 176 196 206 174 194 204 172
169 167 165 163 161 170 168 166 164 162 160
136 134 132 130 128 138 139 137 135 133 131
126 157 146 124 155 144 122 153 142 120 150 140 118 151 159 129 148 158 127 147 156 125 145 154 123 143 152 121 141 149 119
116 114 112 110 108 117 115 113 111 109 107
85 83 81 79 77 86 84 82 80 78 76
73 103 93 71 101 91 69 99 89 67 95 87 65 97 105 75 96 106 74 94 104 72 92 102 70 90 100 68 88 98 66
63 61 59 57 55 64 62 60 58 56 54
30 28 26 24 22 32 33 31 29 27 25
20 51 40 18 49 38 16 47 36 14 44 34 12 45 53 23 42 52 21 41 50 19 39 48 17 37 46 15 35 43 13
10 8 6 4 2 11 9 7 5 3 1
CUT SEQUENCE FOR 11 ENTRY WALK-BETWEEN SUPERSECTION 4 CROSSCUT ADVANCE BETWEEN BELT MOVES
Figure 3: A typical cut sequence. Mine A’s standard operating procedure (base case) was to have four battery ram-cars running with a fifth car available as a spare and for long hauls. Production figures from Mine A show an average production rate of 2100 raw tons per unit shift (RTPUS). After

11
entering the time study data, the unexpected delay value was adjusted to achieve the SSP Model output shown in Table 3. The output indicates that the miners are loading 46% of the 375-minute production shift cycle to achieve 2107 RTPUS. Virtually no time is spent waiting on haulage at the change-out points. The variable “feet per car” is the ratio of the shuttle car payload to tons of coal per foot of advance. It is the PI’s opinion that a better variable to track will be the “shuttle car fill factor” rather than “feet per car”.
Table 3: Base case scenario of four (4) haulage units with 9-ton capacity. Expected production rate 2107 RTPUS Expected mining rate 5.62 tons/minute Tons per foot of advance 5.85 tons Feet per car 1.56 feet Shifts per cycle 11.80 Shifts
(All times in minutes) Total Average/Cut Average/Shift Load Time 2033.1 9.6 172.2
Change-out Time 1329.3 6.3 112.6 Wait on Car 3.7 0.02 0.3
In-Cut Delays 1060.0 5.0 89.8 Cycle Time 4426.1 20.8 375.0 Cars Loaded 2710.8 12.8 229.7
Linear advance (feet) 4252.6 20.06 360.3 It was observed during the time studies that haulage units waited at the change-out points for long periods of time. This was confirmed in the calculation section of the SSP Model where “wait on car” values were consistently negative. The observations and the model both suggest that four haulage units may be too many, an inefficient use of manpower and equipment. Thus, the first scenario to be evaluated was decreasing the number of haulage units from four to three. Table 4 gives the model output for this scenario.
This scenario results in a loss of 13 RTPUS, a negligible amount. Loading time is still 44% and there are only 13 minutes of “wait on car” delays. Both of these negatives can be overcome by increasing haulage capacity. The next two scenarios focus on this variable. Scenario 2, shown in Table 5, builds upon Scenario 1 by using only three cars and changing car capacity from 9 tons to 10 tons. Scenario 3, shown in Table 6, returns to the base case and changes capacity from 9 tons to 11 tons. Scenario 3 results clearly show the value of haulage unit capacity.

12
Table 4: Scenario 1 – Reducing haulage units from four (4) to three (3). Expected production rate 2094 RTPUS Expected mining rate 5.58 tons/minute Tons per foot of advance 5.85 tons Feet per car 1.56 feet Shifts per cycle 12.24 Shifts
(All times in minutes) Total Average/Cut Average/Shift Load Time 2033.11 9.59 166.05
Change-out Time 1329.29 6.27 108.57 Wait on Car 169.06 0.80 13.81
In-Cut Delays 1060.00 5.00 86.57 Cycle Time 4591.46 21.66 375.00 Cars Loaded 2710.82 12.79 221.40
Linear advance (feet) 4382.99 20.67 357.97
Table 5: Scenario 2 – Scenario 1 with haulage unit capacity increased to 10-tons. Expected production rate 2156 RTPUS Expected mining rate 5.75 tons/minute Tons per foot of advance 5.85 tons Feet per car 1.71 feet Shifts per cycle 11.74 Shifts
(All times in minutes) Total Average/Cut Average/Shift Load Time 2033.1 9.6 173.2
Change-out Time 1218.5 5.8 103.8 Wait on Car 90.9 0.4 7.7
In-Cut Delays 1060.0 5.0 90.3 Cycle Time 4402.6 20.8 375.0 Cars Loaded 2480.4 11.7 211.3
Linear advance (feet) 4326.8 20.4 368.5 At the request of Mine A management, the effect of changing section layout was also evaluated. Various options were considered but only one is reported here – mining on 70-foot centers rather than 60-foot centers. As expected, Table 7 shows that increasing pillar size has a negative effect on production.

13
Table 6: Scenario 3 – Base case with haulage unit capacity increased to 11-tons. Expected production rate 2218 RTPUS Expected mining rate 5.91 tons/Minute Tons per foot of advance 5.85 tons Feet per car 1.90 feet Shifts per cycle 11.20 Shifts
(all times in minutes) Total Average/Cut Average/Shift Load Time 2033.1 9.6 181.5
Change-out Time 1107.7 5.2 98.9 Wait on Car 0.0 0.0 0.0
In-Cut Delays 1060.0 5.0 94.6 Cycle Time 4200.9 19.8 375.0 Cars Loaded 2224.6 10.5 198.6
Linear advance (feet) 4248.0 20.0 379.2
Table 7: Scenario 4 – Base case with pillar sizes increased to 70 x 70-foot centers.
Walk between supersection – 11 entries on 70 ft X 70 ft (c-c) 4 haulage units – capacity of 9 tons Expected production rate 2018 RTPUS Expected mining rate 5.38 tons/Minute Tons per foot of advance 5.85 tons Feet per car 1.56 feet Shifts per cycle 13.56 Shifts (All times in minutes) Total Average/Cut Average/Shift
Load Time 2244.10 9.59 165.42 Change-out Time 1658.32 7.09 122.24
Wait on Car 15.01 0.06 1.11 In-Cut Delays 1170.00 5.00 86.24 Cycle Time 5087.42 21.74 375.00 Cars Loaded 2992.13 12.79 220.55
Linear advance (feet) 4680.00 20.00 344.97 Finally, the effect of using a high-voltage miner was evaluated. As reported earlier, the loading rate of the high-voltage machine is about 30% greater than a normal machine. For Mine A, Table 8 shows that the high-voltage miner with a 20% greater loading rate achieves a 7.5% increase in RTPUS with regard to base case. This increase may be economically justified.

14
Table 8: Scenario 5 – Base case with high-voltage miner (20 % loading rate increase).
Walk between supersection – 11 entries on 60 ft X 60 ft (C-C) 4 haulage units – capacity of 9 tons Expected production rate 2267 RTPUS Expected mining rate 6.04 tons/minute Tons per foot of advance 5.85 tons Feet per car 1.56 feet Shifts per cycle 11.0 Shifts (All times in minutes) Total Average/Cut Average/Shift
Load Time 1722.50 8.13 156.52 Change-out Time 1329.29 6.27 120.79
Wait on Car 15.00 0.07 1.36 In-Cut Delays 1060.00 5.00 96.32 Cycle Time 4126.78 19.47 375.00 Cars Loaded 2710.82 12.79 246.33
Linear advance (feet) 4265.28 20.12 387.59 Task 1.2: Perform Industrial Engineering Studies on a Longwall Gate Entry
Development Continuous Miner Section The goals of this task were to: • Perform industrial engineering (time studies) on gate entry development for a
longwall face. • Increase the time study database to include longwall mines entry development data. • Validate the SSP model for the longwall entry development operations. Towards the above goals the following studies were made: • Time studies were conducted at a longwall mine in the state of Illinois. • The collected data were analyzed statistically to develop the characteristics of the
haulage system. • The values obtained above were used in the SSP model to validate the model.
Continuous miner sections in longwall mines differ from traditional room-and-pillar production units in that the primary focus is on maximizing linear feet of advance rather than maximizing production. To accomplish this, crosscuts are spaced as far apart as ventilation conditions allow. Additionally, pillars are designed to minimize ground control problems during longwall mining, resulting in closely spaced entries. The project team was able to show that the SSP model is also effective in modeling longwall development units.

15
To do this, the project team conducted a series of time studies at Mine B, a longwall operation. Mine B produces coal three shifts per day. Time study data was collected on all three shifts to avoid having data that reflected only one set of operators. In order to accommodate longwall equipment, mining height averages 7 feet, although the coal seam is rarely greater than 6 feet and occasionally drops below 4 feet. Consequently, clean coal yield suffers tremendously. However, the mining height allows the mine to use high-profile shuttle cars. The mining section consists of three entries on 65-foot centers with crosscuts on 150-foot centers. Entry width is 16 feet. Crosscuts between the left hand entry (#1) and the center entry (#2) are staggered 15 feet ahead of crosscuts between the center entry and the right hand entry (#3). The feeder and section belt are located in #3 entry. Average cut depth is 26 feet. A high-profile continuous miner cuts the coal and two cable shuttle cars hauled it from the miner to the feeder. Since the continuous miner cable is routed up #3 entry through the last open crosscut between #3 and #2 entries, the change-out for the cuts in #2 and #3 entries is in the second to the last open cross-cut. This increases the change-out distance and associated delays substantially. However, time study data show that the capacity of larger shuttle cars partially offsets these delays. Roof control issues are a significant factor affecting section production at Mine B. Due to poor roof quality and the stresses associated with longwall mining, screen panels are installed along with the required roof bolts. This greatly increases the roof bolter cycle time. However, in the analysis done by the project team, mine production was modeled using the assumption that the roof bolter does not affect the cycle time of the miners. Time study data captured the greater tonnage of the high profile car (15 tons) as well as the associated dump times and tram speeds. The SSP model summary for Mine B’s longwall gate entry development is shown in Table 9.
Table 9: Summary - Mine B longwall gate entry development.
Expected production rate 829 RTPUS Expected mining rate 2.44 Tons/Minute Time available to mine 400 Minutes Unexpected delays 60 Minutes Shifts per cycle 5.9 Shifts
(All times in minutes) Total Average/Cut Average/Shift Load Time 665 15.1 112
Change-out Time 350 7.9 59 Wait on Car 18 0.4 3
In-Cut Delays 366 8.3 62 Tram Time 613 13.9 104 Cycle Time 2013 45.7 340
Linear advance 1196 27.2 202

16
Task 1.3: Document Attributes of Current Face Haulage Systems to Develop Alternate Face Haulage Systems
The goals of this task were to: • Evaluate the different face haulage systems currently in use in the state of Illinois • Compare the characteristics of different face haulage systems to find the best ones
suited for Illinois coal mining conditions • Document these findings and share them with equipment manufacturers to develop
alternate face haulage systems. Toward the above goals the following studies were performed: • Time studies were performed at six Illinois coal mines using several face haulage
equipment. • Characteristics of the face haulage systems were developed into a database. • Out-of-state mines demonstrating the Freedom Car (a battery shuttle car) were visited
and data collected on this prototype equipment. • All data was shared with Phillips Machine to further develop the Freedom Car. Defining parameters of underground production systems Successful application of IE techniques to underground production systems utilizing continuous miners requires accurate definition of the following input parameters: Mine planning parameters: • Section type: single miner, super section (walk between or split ventilation) • Number of mine entries • Pillar size • Cut depth • Cut sequence Haulage equipment parameters: • Number of units available • Capacity • Tram speed empty and full • Haulage routes
Loading equipment parameters • Continuous miner cutting and
loading rates • Continuous miner tram speed • Feeder capacity
Illinois operations use a variety of face haulage systems. The most common are: 1) cable shuttle car, 2) diesel ram-car, 3) battery ram-car, and 4) continuous haulage (this system is not currently in use but has been used in the past). The cable shuttle cars used in various mines have different capacities ranging from 9 tons to 16 tons. The ram-cars used have capacities in the range of 6.5 tons to 9.5 tons. A summary sheet of haulage equipment characteristics and other pertinent data is shown in Table 10.

17
The IE discipline originated as a concept for advancing organizational and management principles during the Industrial Revolution and reached its maturity after World War II. The factory environment proved to be ideal for the application of scientific methods of analysis to measuring the performance of people and machines. Industrial engineering techniques also found a place in coal mines as they became more mechanized. However, constantly changing geological conditions proved to be one input parameter that hampered the coal miner’s ability to achieve the precision of the factory. The project team found that the challenging coal mine environment often led to considerable variability in the collected data. Table 11 shows the range of values obtained for the haulage system at Mine A. The variability in time study data was continuously evaluated using standard statistical analysis techniques. Where needed and where possible, multiple time studies were conducted to reduce the degree of variability in the data.
Table 10: Characteristics of face haulage systems in Illinois.
# of
Haulage Units Capacity of Haulage
Units Loading Rate
(tpm) Tram Speed
(fpm) CO to Face CO to Feeder Mine Name
Type of
Mining Unit
Haulage Type Available Used Nominal
(tons) Actual (tons) Nominal Actual empty loaded empty loaded
Dump Time (sec)
Illinois Basin Mines
A WBSS Battery Ramcar 6 5 (DBT810)
10 9.15 (14/15) 20 13 174 320 420 419 34
B LW Gate
Shuttle Car 2 2 (Joy10SCc)
20 15.02 (12/12) 25 12.69 367 308 455 426 51
C WBSS Shuttle Car 3 3 (Joy10SCa)
10 8.98 (14/15) 20 9.92 388 305 425 345 31
C “ Battery Ramcar 4 4 (StmBH10)
10 6.5 (14/15) 20 11.3 300 350 350 350 24
C “ Battery Ramcar 4 4 (StmBH20)
12 9.5 (14/15) 20 11.3 300 300 330 330 27
D WBSS Diesel Ramcar 4 3 (Jeff4110)
14 9.34 (14/15) 20 13 115 181 183 37
E Single Miner
Shuttle Car 3 3 (Joy10SCb)
16 12.62 (Eimco) 25 21.4 255 350 410 288 49
E “ Shuttle Car 3 3 (Joy10Scaa)
8 7.53 (14/15) 20 11.31 275 447 398 281 34
Appalachian Mines
F Single Miner
Shuttle Car 3 3 (Joy10SCb)
16 12.5 (14/15) 20 13.6 225 392 440 357 36
F “ Freedom Car 1 1 (FC12)
20 13.5 (14/15) 20 15.88 229 438 381 382 36
G Single Miner
Shuttle Car 2 2 (Joy10SCaa)
8 7.4 (14/15) 20 8 400 400 400 400 43
G WBSS Shuttle Car 2 2 (Joy10SCb)
16 10.6 (Eimco) 25 15.9 300 300 300 300 45
H WBSS Shuttle Car 2 2 (Joy21SC)
6 5 (14/10aa) 12 6 375 375 375 375 27
WBSS: Walk between supersection Table 11: Typical values of tram speeds and dump times for Mine A (battery ram-cars).
Tram speeds (feet/min): Min Max Mean Std. Dev Median Feeder to CO 278 600 420 114.46 415 CO to Feeder 301 600 419 73.80 408 CO to Face 113 257 174 42.62 169 Face to CO 225 568 320 98.92 284 Load Time (min) 31 68 45 10 43 Dump Time (min) 26 46 34 05 35
CO – Change-out point

18
Tasks 1.4 and 1.5: Scrubber Tests on # 6 Seam Coal in the Dust Control Laboratory The overall goal of this task is to develop a commercial wet scrubber that is more efficient for dust control than the current scrubbers. Towards this goal a modified wet scrubber was developed and scrubber studies were conducted on coals from Mine 1 and Mine 2, which are mining # 6 seam coal. Earlier work done in the dust control laboratory showing the benefits of surfactant use (Saha, 2001) was performed on #5 seam coal from Mine 3. Requirements for an improved wet scrubber The following are the three main requirements for a modified wet scrubber design: • Maximize airflow through the scrubber by maximizing the area of the filter for
airflow and air-water mixing. • Minimize the pressure drop across the filter to maximize the quantity of airflow. • Minimize spray volume and surfactant requirements to reduce costs. Phase 1 studies - Reduced spray pressure Phase 1 scrubber studies involved the study of reduced spray pressure on dust concentration. The other variables held constant were a 20-layer filter, 0.005% surfactant concentration and a single full-cone nozzle rated at 40-psi, 5.9-gpm, and 1200 spray angle. The spray pressure was decreased from 80-psi to 30-psi. Results of Phase 1 studies are shown in Table 12. The results indicate that dust concentration at the lower spray pressure (30-psi) do not change significantly when compared to the higher spray pressure. The main advantages of lowering the spray pressure are 1) reduced spray volume that helps in lower water requirements, 2) lower surfactant costs, and 3) increased air flow through the scrubber.
Table 12: Effect of spray pressure on dust concentration.
Surfactant
Spray (gpm)
Filter Layers
(#)
Spray Pressure
(psi)
Surfactant Concentration
(%)
Dust Concentration
(mg/m3)
Standard Deviation (mg/m3)
Number of Samples
5.5 20 30 0.005 3.576 0.988 8 7.5 20 80 0.005 3.503 0.388 4
Phase 2 studies - Two-spray system The scrubber was modified to incorporate a two-spray system consisting of a pre-wet water-only spray system and a surfactant spray system. It was hypothesized that a two-spray system should be considered for a wet scrubber to improve its efficiency. The first water-only spray would wet the coarser dust, and the second water-surfactant spray would be used to wet the very fine dust non-wettable by water alone. Figure 4 shows the model of the two-spray system designed for the scrubber unit.

19
Figure 5 shows the pre-wet water only spray system on the scrubber unit. Five 1-gpm full-cone sprays were fitted to the ductwork at equal distances to obtain good interaction between the water spray and the coarser particles. Phase 2 involved scrubber tests on the modified two-spray scrubber system. The other variables that were held constant were a 20-layer screen filter, 0.005% surfactant concentration, and 40-psi spray pressure (1200 spray angle). The spray volume was varied over two levels (2- and 3-gpm) for both the sprays.
Figure 4: Two spray system.
Results of Phase 2 tests are shown in Table 13. The results indicate that using a pre-wet water-only spray system reduces dust concentrations only slightly. This is reasonable because the tests were done using only fine dust. However, in a commercial unit operating in the field, a pre-wet water spray should help significantly since a large weight percentage of dust is very coarse. The results also suggest that the spatial distribution of sprays increased the effectiveness of the spray system for dust control.
3 inch 22 inch
Air
Air 22 inch
11 inch

20
Figure 5: Pre-wet water only spray system.
Table 13: Effect of two-spray system on dust concentration.
Case Water Spray
Surfactant Spray
Filter Layers
Spray Pressure
Surfactant Concentration
Dust Concentration
(gpm) (gpm) (#) (psi) (%) (mg/m3) I 0 2 20 40 0.005 3.916 0 2 20 40 0.005 3.697 II 5 2 20 40 0.005 3.651 5 2 20 40 0.005 3.036
III 0 3 20 40 0.005 2.335 IV 4 3 20 40 0.005 2.156
Phase 3 studies - Modification of the surfactant spray system To improve the interaction between the surfactant water and the fine dust-laden air in the scrubber, the surfactant spray was modified from a single nozzle to a three-nozzle spray system. The modified surfactant spray system is shown in Figure 6. The modifications to the surfactant spray system included: • Move the spray system closer to the filter for better coverage of the filter area as
shown in Figure 7. • Reduce the quantity of water. • Increase the number of sprays with smaller spray angle.

21
• Operate sprays at 20-, 30- and 40-psi spray pressures. • Use of full-cone and hollow-cone spray nozzles.
Figure 6: Surfactant spray modification – Phase 3.
Figure 7: Filter coverage area of surfactant spray.
Phase 3 scrubber tests examined only the three-nozzle surfactant spray system. Therefore, the pre-wet water-only spray system was not used. Results of the Phase 3 scrubber studies are shown in Table 14. Table 14: Dust concentration results for the three-nozzle surfactant spray system.
Filter Spray Surfactant Spray Dust Sample Layers Pressure Concentration Volume Concentration Standard
(#) (psi) (%) (gpm) (mg/m3) Deviation 20 40 0.005 3.9 2.78 0.011 10 40 0.005 3.9 5.86 0.014 20 30 0.005 3.3 5.06 0.011 10 30 0.005 3.3 7.04 0.057 20 20 0.005 2.7 4.39 0.017 10 20 0.005 2.7 6.06 0.047
The results show that with a 20-layer filter, the three-nozzle surfactant spray system reduces dust concentrations to 2.8 mg/m3 as compared to 3.57 mg/m3 for the single nozzle surfactant spray system used in Phase I scrubber studies. The benefits of the three-nozzle surfactant spray system are 1) larger airflow through the scrubber, 2) approximately 40% reduction in water requirements, 3) reduced load on the demister, and 4) approximately 40% reduction in surfactant requirements.

22
Phase 4 studies – Two-filter, two-spray system The existing scrubber was modified to incorporate a filter screen after the pre-wet water spray system to remove the coarse particles allowing the second surfactant spray to treat the fine particles prior to the second filter. The two-filter design for a horizontal surfactant spray system is shown in Figures 8 and 9. The following terminology will be followed for the rest of the discussion.
• Pre-wet water only spray system – Spray 1 • Filter after Spray 1 – Filter 1 • Surfactant spray system after Filter 1 – Spray 2 • Filter after Spray 2 – Filter 2
Figure 8: Two-filter design model for the wet scrubber. To establish the validity of the two-filter design for the wet scrubber, a parametric study was conducted on coal from Mine 2 using Surfactant 2 while varying three operating parameters – number of filter layers for Filter 2, direction of Spray 2 and nozzles for Spray 2. A statistical experimental design consisting of eleven tests was developed using the D-Optimal method to investigate the operational effects of each parameter on the dust concentration response variable. All the operating factors were varied over two levels.
• Filter 2 – 5-layer and 10-layer filter. • Direction of Spray 2 – Horizontal-spray and vertical-spray systems. • Nozzles for Spray 2 – Full-cone and hollow-cone.
Air
Air
Front View
Top View
Spray 1 Filter 1 Spray 2 Filter 2

23
Figure 10 shows Spray 1, Filter 1 and Spray 2 in the horizontal direction. Spray 2 in the vertical direction is shown in Figure 11. The other fixed parameters are spray volume for Spray 1 and Spray 2 at 2- and 3-gpm, respectively with spray pressure of 40-psi and surfactant concentration of 0.005%. The results are shown in Table 15.
Figure 9: Two-filter design for the wet scrubber. The results show that for Spray 2, a vertical spray system is better than a horizontal spray system and use of hollow-cone nozzles give better reduction in dust concentrations than full-cone nozzles. A hollow-cone vertical spray system resulted in dust concentration of 1.9 mg/m3 compared to 2.1 mg/m3 with a full-cone vertical spray system, a statistically significant difference. For Filter 2, 10 layers gave better results than 5 layers but had the disadvantage of reducing airflow to 5300 cfm. So, the conclusion was to use two 5-layer filters in a commercial wet scrubber system.
Table 15: Scrubber test results.
Filter 1
(#) Filter 2
(#) Cone Type Direction Dust Concentration
(mg/m3) 5 10 Hollow Horizontal 2.327 5 10 Full Horizontal 2.191 5 5 Hollow Horizontal 2.017 5 5 Full Horizontal 2.307 5 10 Hollow Vertical 1.969 5 10 Full Vertical 1.645 5 5 Hollow Vertical 1.992 5 5 Full Vertical 2.130

24
Figure 10: Spray 1, Filter 1 and Spray 2 (Horizontal) in the wet scrubber.
Figure 11: Spray 2 (Vertical) on the wet scrubber.
Finally, a parametric study was conducted for Mine 1 and Mine 2 coals using Surfactant 2. The variable operating parameters were spray volume for Spray 2 (varied over two levels) and surfactant concentration (varied over three levels). A statistical experimental design consisting of nine tests was used to investigate the effects of each parameter on dust concentration.
• Spray volume for Spray 2 – 2-gpm and 3-gpm. • Surfactant concentration – 0.005%, 0.006% and 0.007%.
Test results for Mine 1 and Mine 2 coals are shown in Table 16 and Table 17, respectively. The weight gain shown is the average weight gain from four filter cassettes.
Table 16: Wet scrubber test results for Mine 1.
Run Filter 1 Filter 2 Spray Spray Surfactant Weight Dust
(#)
(#)
Volume (gpm)
Pressure (psi)
Concentration (%)
Gain (mg)
Concentration(mg/m3)
1 5 5 2 40 0.005 0.236 2.711 2 5 5 3 40 0.005 0.182 2.093 3 5 5 2 40 0.006 0.259 2.973 4 5 5 2 40 0.007 0.259 2.981 5 5 5 3 40 0.007 0.138 1.590 6 5 5 2 40 0.006 0.225 2.588 7 5 5 2 40 0.007 0.259 2.979 8 5 5 3 40 0.005 0.201 2.306 9 5 5 2 40 0.005 0.174 2.001

25
Table 17: Wet scrubber test results for Mine 2. Run Filter 1 Filter 2 Spray Spray Surfactant Weight Dust
(#)
(#)
Volume (gpm)
Pressure (psi)
Concentration(%)
Gain (mg)
Concentration(mg/m3)
1 5 5 2 40 0.007 0.165 1.895 2 5 5 3 40 0.005 0.165 1.895 3 5 5 2 40 0.007 0.303 3.487 4 5 5 2 40 0.006 0.204 2.346 5 5 5 2 40 0.005 0.373 4.290 6 5 5 3 40 0.007 0.144 1.650 7 5 5 2 40 0.006 0.215 2.473 8 5 5 2 40 0.005 0.289 3.324 9 5 5 3 40 0.005 0.167 1.915
Based on the above results, an empirical model for the dust concentration response variable was developed as a function of the two operating parameters. The test data were statistically analyzed using the Design Expert software package. a) Mine 1 Several model types were evaluated and a 2FI (two-factorial) model with no transformation was found to provide the best fit for the dust concentration response variable. Table 18 gives an analysis of variance for the 2FI model. The terms A and B refer to the surfactant concentration and spray volume parameters, respectively. The term AB signifies the parameter interaction effects. Values for “Prob > F” less than 0.0500 (95% significance level) indicate model terms are significant. Surfactant concentration was found to be statistically significant for determining the response variable while spray volume was considered a categorical factor.
Table 18: Analysis of variance for dust concentration – Mine 1.
Source Sum of Squares DF Mean Square F Value Prob > F Model 1.59 3 0.53 6.43 0.0362
A 0.00 1 0.00 0.00 0.9738 B 1.13 1 1.13 13.61 0.0142
AB 0.53 1 0.53 6.44 0.0521 R - Squared 0.7941
The developed empirical equations are given below: • Final equation for 2-gpm spray volume:
Dust Concentration = 0.833 + 312 * Surfactant Concentration

26
• Final equation for 3-gpm spray volume: Dust Concentration = 3.767 - 303.615 * Surfactant Concentration where, dust concentration is in mg/m3 and surfactant concentration as weight percent of water. These equations were used to predict the response variable values, which were then compared with the actual experimental results. This comparison, shown in Figure 12, indicates that the empirical model satisfactorily fits the actual experimental data.
Table 19: Analysis of variance for dust concentration – Mine 2.
Source Sum of Squares DF Mean Square F Value Prob > F Model 3.67 2 1.84 3.75 0.0877
A 1.03 1 1.03 2.11 0.1964 B 2.94 1 2.94 6.00 0.0498
R - Squared 0.5558 b) Mine 2 A linear model with no transformation was found to provide the best fit for Mine 2. Table 19 gives the analysis of variance for this model. Terms A and B have the same meaning as before. Parameter interaction effects were not present. As before, “Prob > F” values less than 0.0500 indicate significant model terms. Only surfactant concentration was found to be statistically significant.
1.50
1.75
2.00
2.25
2.50
2.75
3.00
3.25
3.50
3.75
4.00
1.50 1.75 2.00 2.25 2.50 2.75 3.00 3.25 3.50 3.75 4.00
Actual Values (mg/cu.m)
Pred
icte
d V
alu
es (m
g/cu
.m)
Figure 12: Predicted vs. actual values for dust concentration – Mine 1.

27
The developed empirical equations are given below: • Final equation for 2-gpm spray volume:
Dust Concentration = 5.425 – 409.378 * Surfactant Concentration • Final equation for 3-gpm spray volume:
Dust Concentration = 4.208 – 409.378 * Surfactant Concentration where, dust concentration is in mg/m3 and surfactant concentration as weight percent of water. Figure 13 provides a comparison of values predicted using these equations and actual results. It indicates that the empirical model fits the actual experimental data. The results show that surfactant concentration is statistically significant for both Mine 1 and Mine 2 coals. The modified wet scrubber with a spray volume of 2-gpm for Spray 1 and 3-gpm for Spray 2, 5-layer filters for Filter 1 and Filter 2, surfactant concentration of 0.007% and 40-psi spray pressure gave dust concentrations of 1.59 mg/m3 for Mine 1 and 1.65 mg/m3 for Mine 2. The modified wet scrubber results (1.6 mg/m3) indicate a 55.18% reduction in dust concentration compared to the original wet scrubber (3.57 mg/m3).
1.501.752.002.252.502.753.003.253.503.754.004.254.504.755.00
1.50 1.75 2.00 2.25 2.50 2.75 3.00 3.25 3.50 3.75 4.00 4.25 4.50 4.75 5.00
Actual Values (mg/cu.m)
Pred
icte
d V
alu
es (m
g/cu
.m)
Figure 13: Predicted vs. actual values for dust concentration – Mine 2.
Task 1.6: Conduct Size Analysis on Continuous Miner Outputs The goal of this task was to compare the size distribution of ROM coal from high-voltage miners and standard-voltage miners operating in Illinois coal seams. Since no mine in the state of Illinois currently uses high-voltage miners, this task has not been completed. Peabody Coal Company just introduced high-voltage miners at a new western Kentucky

28
operation. The project team has already contacted mine officials and plans to collect samples and perform size distribution analysis during the continuing project term. Task 1.7: Prepare Reports on Productivity, Size Analysis, and Dust Control The goal of this task was to investigate productivity issues at different mines by using the SSP model to identify areas for improvement. The project team prepared and submitted five reports to cooperating mines on their productivity issues and dust control. Task 1.8: Present Information to Cooperating Companies An information transfer seminar was held on March 18, 2003 at SIU. Over 25 people from various coal companies, equipment manufacturers, and state agencies attended the seminar. All three areas of the project were discussed: 1) industrial engineering studies and use of SSP, 2) improved wet scrubber design, and 3) out-of-seam dilution control Tasks 2.1 and 2.2: Review of Existing Haulage Systems and Identification of
Potential Solutions The important haulage systems presently in use in Illinois were documented in Task 1.3. The advantages and disadvantages of each system are listed in Table 20 in order of importance based on numerous sensitivity analyses conducted using the SSP Model. Mine evaluations performed by the project team have repeatedly shown that capacity is the most critical parameter. Fortunately, there are steps mine management can take to increase haulage capacity without purchasing all new equipment. These steps include installing tailgates and sideboards and training equipment operators on the importance of capacity utilization. When new equipment is being considered for purchase, capacity should be the primary selection criteria. Following capacity, the next most important parameter is haulage flexibility. Flexibility means having multiple options for number of haulage units used, haulage routes and distances traveled, and change-out methods and locations. In general, flexibility is determined by whether a power-supply cable tethers the haulage vehicle. The presence of cables requires special precautionary measures, established by law, to insure that they are not damaged. These regulations place restrictions on the number of vehicles that can be used and the routes they can travel. All of the above parameters were studied and characteristics of alternate face haulage systems developed. The project team identified those parameters that are more critical than others such as car capacity, flexibility and loading rates. Alternate haulage systems were envisioned as having the advantages of both shuttle cars and ram-cars (high capacity combined with excellent flexibility). This work was done in close consultation with Phillips Machine Service, manufacturer of a battery shuttle car called the Freedom Car. The project team has not only worked to promote the Freedom Car but also modify it for use as a surge car. The battery shuttle car and the surge car both provide potential solutions to the haulage problems that exist in today’s coal industry.

29
Table 20: Advantages and disadvantages of available batch haulage systems.
Advantages Disadvantages
Cable Shuttle Car • Capacity • Fixed haulage route, no overlap • No turn around required • Number of units is limited • Controlled dumping • Cable maintenance delays • No harmful emissions • Confined travel distance
Battery Shuttle Car • Same as cable shuttle car • Higher capital costs • Flexible haulage routes • Battery reliability and maintenance • Number of units not limited • Battery change-out delay
Diesel Ram-car • Flexible haulage routes • Risk from diesel PM undefined • More power in bad conditions • Capacity • Number of units not limited • Switch out or turning required • Uncontrolled dumping
Battery Ram-car • Flexible haulage routes • Capacity • Number of units not limited • Switch out or turning required • Unconfined travel distance • Battery change-out delay • No harmful emissions • Battery reliability and maintenance
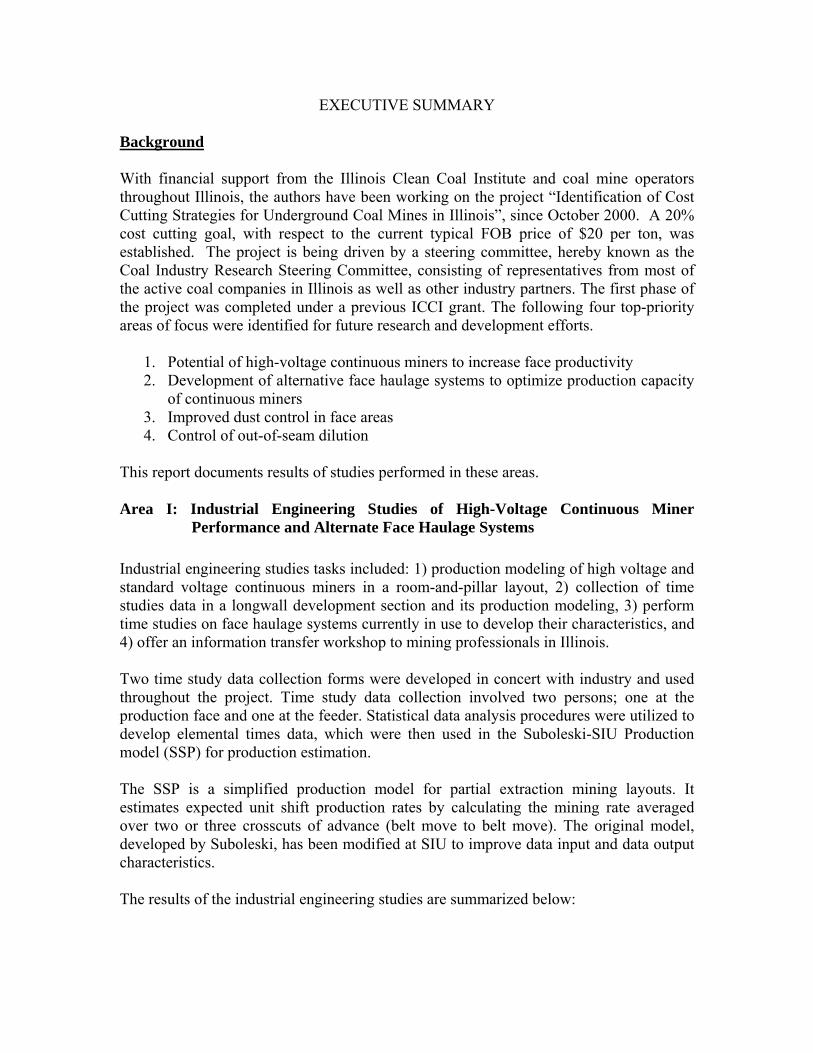
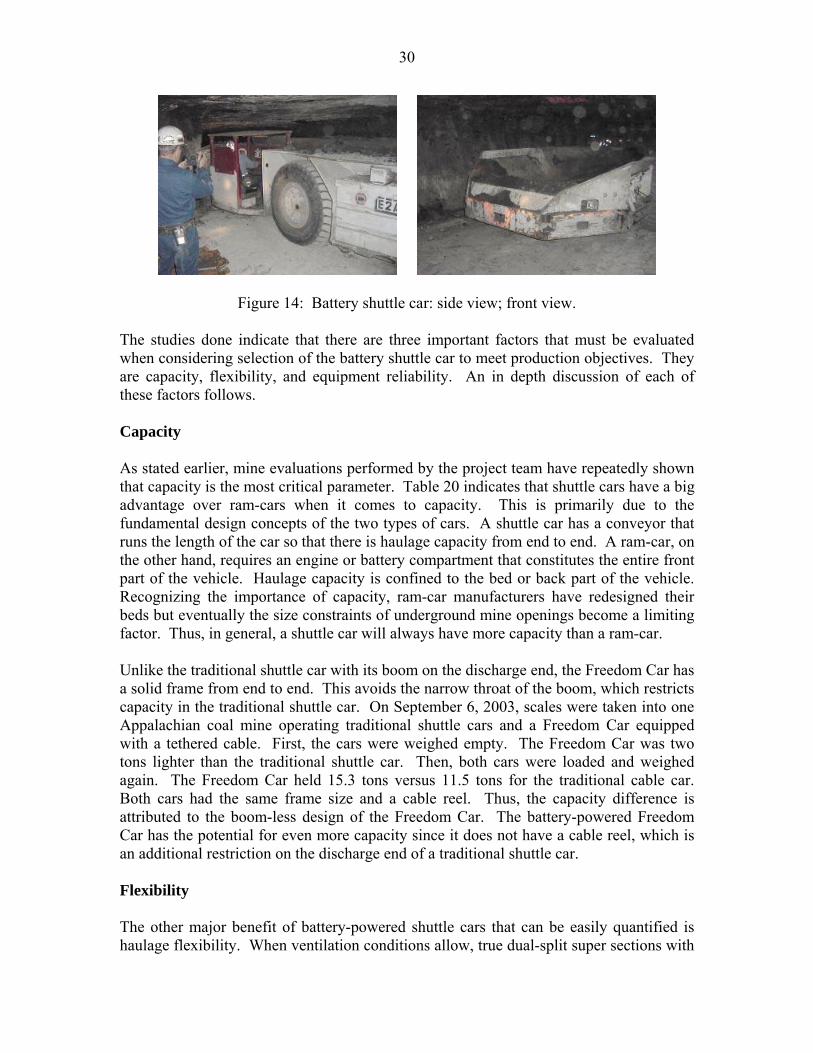
Task 2.3: Industrial Engineering Studies on a Battery Shuttle Car In conducting mine evaluations using the SSP Model, the project team has focused on helping mine management to maximize productivity with the equipment they presently have. Every operation must eventually make decisions regarding the purchase of new equipment either to replace existing worn-out equipment or to expand operations. When these decisions are faced, the project team feels that the studies done to date clearly point to the value of the battery shuttle car. Phillips Machine Service (Phillips) of Beckley, West Virginia introduced the Freedom Car at the Mine Expo in 2000. MSHA approvals were obtained in 2001 and Phillips began demonstrating the car at various Appalachian coal mines in 2002 (see Figure 14). While battery shuttle cars are not entirely new to the industry, the Freedom Car is just coming out of the prototype stage. The project team has worked closely with Phillips to promote increased understanding and use of the technology that they make available. This includes conducting time studies on the prototype unit to define its characteristics (see Table 10, Mine F) and sharing that information wherever mine evaluations are done. This alliance has resulted in some Freedom Car sales, which will increase exposure throughout the industry, including in the state of Illinois.
30
Figure 14: Battery shuttle car: side view; front view. The studies done indicate that there are three important factors that must be evaluated when considering selection of the battery shuttle car to meet production objectives. They are capacity, flexibility, and equipment reliability. An in depth discussion of each of these factors follows. Capacity As stated earlier, mine evaluations performed by the project team have repeatedly shown that capacity is the most critical parameter. Table 20 indicates that shuttle cars have a big advantage over ram-cars when it comes to capacity. This is primarily due to the fundamental design concepts of the two types of cars. A shuttle car has a conveyor that runs the length of the car so that there is haulage capacity from end to end. A ram-car, on the other hand, requires an engine or battery compartment that constitutes the entire front part of the vehicle. Haulage capacity is confined to the bed or back part of the vehicle. Recognizing the importance of capacity, ram-car manufacturers have redesigned their beds but eventually the size constraints of underground mine openings become a limiting factor. Thus, in general, a shuttle car will always have more capacity than a ram-car. Unlike the traditional shuttle car with its boom on the discharge end, the Freedom Car has a solid frame from end to end. This avoids the narrow throat of the boom, which restricts capacity in the traditional shuttle car. On September 6, 2003, scales were taken into one Appalachian coal mine operating traditional shuttle cars and a Freedom Car equipped with a tethered cable. First, the cars were weighed empty. The Freedom Car was two tons lighter than the traditional shuttle car. Then, both cars were loaded and weighed again. The Freedom Car held 15.3 tons versus 11.5 tons for the traditional cable car. Both cars had the same frame size and a cable reel. Thus, the capacity difference is attributed to the boom-less design of the Freedom Car. The battery-powered Freedom Car has the potential for even more capacity since it does not have a cable reel, which is an additional restriction on the discharge end of a traditional shuttle car. Flexibility The other major benefit of battery-powered shuttle cars that can be easily quantified is haulage flexibility. When ventilation conditions allow, true dual-split super sections with

31
two miners producing at the same time, provides the best utilization of equipment and manpower resources. However, many operations have difficulty with the complexity of this configuration and there are huge differences between anticipated and actual results. The greatest cause of this difference is inefficient face haulage. In theory, there are four haulage vehicles that operate on the same section, each with the ability to alter their haulage patterns to meet the needs of the continuous miners. Generally, two cars support each miner, but when a miner is not ready to load, one or both of its cars can relocate to the other machine. In practice, this very rarely happens when cable haulage is being used. The restrictions on the system due to cable lengths, additional cables in the roadways, and cables running down the same side of an entry, all generally cause the operators to make the decision to not haul from both miners, but to stay with the machine on their side of the section. The missed opportunities for additional productivity are significant and they prevent the value of a true super section from being realized. With cable-less haulage, or a combination of cable and battery haulage, this problem does not exist. It is an easy decision for the operator to switch machines and haul behind the other miner when their assigned machine is moving, idle or down for repairs. The value of this flexibility can be quantified using the SSP. Based on place change times and actual continuous miner availability, the value of additional haulage behind an operating machine can be determined. Eliminating the “wait on car” time in the model does this. Again, in theory, 50% to 75% of the potential gain could be realized with cable-only haulage. However, in practice, this gain is hardly ever realized because the car routes are usually restricted by cables and eventually the operators quit attempting to switch all together and devote their time to getting the miner on their side back in production. In Illinois, walk-between super sections are the norm for various reasons. On a walk-between super section, only one miner can be producing coal at any given time. A case study, developed at Mine C (see Table 10) is presented to show the value of flexibility (and capacity) that the Freedom Car offers. The mine operates three cable shuttle cars on the section. The SSP is set up for two crosscuts of advance per cycle. The capacity difference between a battery-powered shuttle car and a traditional cable shuttle car is neglected by assuming that all shuttle cars have the same capacity regardless of whether or not they have a cable. First, a base case is established for three cable-powered shuttle cars. Then the model is adjusted to reflect changing the center car to a cable-less Freedom Car. Finally, a case with three cable-less Freedom Cars is considered. The only input data change to the model is adjusting the change-out and haul distances to reflect the flexible haulage route options available to the cable-less car(s). Model output for the three cases is shown in Table 21. A 12% increase in productivity is realized by increasing the flexibility for one car; a 24% productivity increase is realized by changing all three cars to the more flexible option.

32
Table 21: Results of battery shuttle car case study.
Haulage Configuration
Raw Tons Per Unit Shift
Base Case Outside left – Cable car
1,816 Middle – Cable car Outside right – Cable car
Scenario 1 Outside left – Cable car
2,031 Middle – Freedom Car Outside right – Cable car
Scenario 2
Outside left – Freedom Car 2,244 Middle – Freedom Car
Outside Right – Freedom Car The increased flexibility of cable-less haulage has two additional benefits related to mining planning issues and non-production use haulage equipment. A significant limitation of the cable car is the length of cable that can be held on the reel. The magnitude of this limitation increases as seam height (and equipment height) decreases. It hinders management’s ability to change pillar dimensions, add entries, and get around adverse conditions. While all of these situations can be dealt with using cable cars, extra effort is required for additional power moves, back-lashing of cables, and occasional belt extensions – all of which add cost and limit productivity. Haulage vehicles must periodically be used for non-production purposes, such as constructing overcasts and grading belt entries, where out-of-seam material must be mined. Although this is not a daily routine, there are many occasions where the ability to dispose of this materials in a designated location is advantageous. At times like this, not being limited by the length of the trailing cable is a huge benefit. Equipment reliability In terms of equipment reliability, there are several positive features to operating a cable-less shuttle car that have the potential for adding additional profitability to an operation, although such profits are difficult to quantify unless a mine keeps very detailed records. Cable-less haulage eliminates the cost of cable maintenance. A typical cable shuttle car operation will use one reel, one spooling device, and three of four electrical cables per year at a cost of $25,000 per year. Cable-less haulage also eliminates cable delays. While there is still a delay associated with changing batteries on a Freedom Car, the timing of this delay can be schedule by the operator. However, most cable delays are unplanned and occur in locations that halt production, such as when the car is either behind the miner or at the feeder. Battery maintenance is preventive in nature while cable maintenance is corrective. A structure preventive maintenance program is much more efficient than a corrective maintenance plan. Finally, safety improvements result because the risks of cable-less haulage are less. A good ventilation plan handles these risks and continual spooling and un-spooling of a shuttle car cable is eliminated along with the risk of electric shock and regulatory violations from damaged cables.

33
Increased use of battery equipment has helped advance battery technology to a very dependable state. The Freedom Car has been demonstrated in mines with substantial grades and it performed well. Reports show that battery life for the Freedom Car is comparable with other battery units, with battery changes required only once per shift. With proper support equipment, the Freedom Car batteries can be changed in a short period of time causing minimal production delays. Many operators have commented that housing the batteries between the wheels on both sides makes the car run smoother in rough terrain. Task 2.4: Industrial Engineering Study of a Face Haulage System Involving a
Surge Car The goal of all haulage systems is to optimize the capacity of the continuous miner by increasing the percentage of time that the machine’s conveyor chain is running. Thus, continuous haulage provides the greatest opportunity to maximize continuous miner productivity. As such, it becomes the measuring stick by which all other systems are compared.
Inherit delays unique to batch haulage systems are those that occur when the miner is ready to load and is waiting for an empty haulage vehicle. These delays can be divided into two components – changing cars behind the miner and waiting on cars to reach the change-out point. Analyses from several coal mines indicate that these delays are at least equal to miner loading time, and in some cases can be two times the loading time. Wait-on-car delays can be overcome with higher capacity haulage units and/or additional haulage units. Most Illinois Basin mines have addressed this problem and minimized this delay through the use of additional cars. The more difficult problem is change-out delays. Increasing car capacities and decreasing pillar dimensions can reduce these delays, but batch haulage system design itself guarantees that there will be some delays. A solution being developed by the project team as a means of allowing the miner to continue to load coal while cars are changing out is the “surge car” concept. In this concept, a storage car is located behind the miner throughout the entire cut. Production from the continuous miner is stored in the surge car while haulage units are changing out. This car is capable of flash dumping its load into the haulage units when they arrive at the face, accelerating their cycle times and thereby minimizing change-out delays and improving the overall mining cycle time. Another potential advantage of the surge car concept involves the clean-up portion of the cut cycle. Since the miner is dependent on the haulage units during this cycle, there are delays both from the miner waiting on cars and the cars waiting on the miner. The surge car should eliminate the cars ever having to wait on the miner and make the cycle time a function of haulage efficiency without any inherit miner delays. The important characteristics of a surge car include: • flexibility – the surge car system must be as flexible as any batch haulage system. • flood-load ability – loading rate is the critical factor in determining surge car value.

34
• capacity – the surge car must be able to handle enough material to both flood load the haulage equipment and provide adequate storage capacity for the miner to continue to load between cars.
Batch haulage data from Mine C (see Table 10) was used to model a surge car system. A flood loading rate replaced the continuous miner loading rate in the SSP model. This provides a fairly accurate assessment of productivity potential for the surge car system since all other parameters remain the same. Table 22 provides the results for three cases. A comparison shows that the surge car has the potential to increase productivity by greater than 30%.
Table 22: Productivity comparison for surge car and continuous haulage.
Scenario Loading rate
(tons per minute) Loading time
(minutes /shift) Productivity (tons /shift)
Base case – 3 cable cars 10 182 1816 3 Freedom Cars 10 228 2244
3 Cable cars + surge car 22 (from surge car) 235 2406 3 Freedom Cars + surge car 22 (from surge car) 301 2946
Task 2.5: Data Analysis and Data Synthesis The project team has visited nearly every operating coal mine in Illinois as well as mines in Indiana and the Appalachian coal fields collecting data specific to each mine and each haulage system. With the comprehensive database that has been compiled, the project team is capable of applying the SSP in any mining scenario to assist mine operators in analyzing issues affecting productivity. Task 2.6: Information Transfer to Other Mining Operations The capabilities of battery shuttle cars and the surge car concept have been discussed in depth with three Illinois operators interested in demonstrating and using the technology at their mines. On August 22, 2002, project team members and officials from Turris Coal Company, an Illinois operation, visited an eastern Kentucky coal mine demonstrating the battery shuttle car. Equipment handling, size, capacity, and speed as well as battery change-out and maintenance were viewed and discussed in depth with Phillips representatives who were also present. Phillips officials and project team members have visited the other two mines (Arclair’s Willow Lake Mine and Old Ben’s Zeigler 11 Mine) and made presentations on the battery shuttle car. Efforts are underway to assist one of these mines with obtaining a demonstration unit that will be closely monitored during the ongoing research project. Task 2.7: Identification of Future Directions The primary focus of the project team in the near-term is to assist with a battery shuttle car demonstration in Illinois. The project team hopes to utilize the Illinois Coal

35
Development Program to assist the mine operator with purchasing the car. This also involves working closely with engineers at Phillips to insure that the car will be compatible with Illinois seam heights and other conditions. Members of the project team are also collaborating with Department of Energy (DOE) Industries of the Future (IOF) officials in an effort to secure funding to further develop the surge car concept. This is a joint effort with the West Virginia Development Office. Some of the DOE funds would go to Phillips, a West Virginia company, to design and manufacture a prototype surge car. The remaining funds would go to an Illinois company for performing development and demonstration studies on the machine. Turris Coal Company heads the list of those who have expressed interest in this project. Task 2.8: Reports All monthly reports were submitted on time to the ICCI. Reports to individual mines were also submitted as described in Task 1.7. Task 3: Identification of “Best Practices” for Reduction in Out-of-Seam Dilution This task includes “visits to mining operations” (Task 3.1) and “synthesis of data and identification of best practices” (Task 3.2). Prior to any mine visits, a questionnaire was developed and distributed to get a feel for the magnitude of the dilution problem and what is currently being done to deal with it. The questionnaire focused on 1) engineering characterization of the problem, 2) availability of technological controls, 3) use of management incentives, and 4) existence of education and training programs. Seven mines were visited and mine professionals at these mines were interviewed. Information from these interviews as well as questionnaire data were used to identify “best practices”. Elements of dilution There are four primary sources of dilution: 1) inseam dilution from partings, cleat fillings, etc., 2) out-of-seam dilution from cutting of roof and floor during normal mining and clean-up of minor roof falls at the face, 3) material loaded on the belt from mining overcasts and grading bottoms and other construction projects, and 4) clean-up of roof falls away from the face area. These sources are affected by geologic, engineering and operational factors. Geologic factors include: 1) structural topography of the coal seam, 2) coal seam thickness, 3) nature of immediate roof and floor strata, 4) sensitivity of roof and floor strata to moisture, 5) geologic anomalies such as folding, faulting, intrusions, and shear zones, 6) ground behavior during mining, and 7) presence of water in mining areas. Engineering factors include: 1) characterization of roof and floor topography, 2) selection of mining height in relation to seam height, 3) design of mining layout in relation to pre-existing stress fields, 4) depth of mining cuts, 5) coordination of mining and bolting

36
cycles or timing of support installation in the mining cycle (ground reaction characteristics), and 6) selection of appropriate equipment. Operational factors include: 1) continuous miner operator training, 2) roof bolter operator training, 3) dust control in the face area, 4) rate of face advance, 5) depth of mining cuts, 6) control of water in mining areas, and 7) cut sequence in the mining layout. Development of a simple mathematical model to study dilution impacts The impact of dilution on cost and production stems from processing costs, disposal costs, and potential coal quality penalties from the customer. To study dilution impacts, a simple mathematical model was developed. The model is depicted in Figure 15 and described by the data in Table 23 and the following assumptions and equations.
Figure 15: Simplified mathematical model for studying dilution.
Assumptions: 1) Average cutting rate for coal and dilution are the same. 2) Continuous miner cycle time is always larger than roof bolting cycle time. Therefore,
advance per shift is not limited by roof bolting cycle time. 3) Coal discharged to waste ponds by not processing fines amounts to 5% of clean coal
production. 4) Plant efficiency is 97%. In other words, 3% of clean coal production ends up as
misplaced material in the waste pile.
h
t2
t1
X
γc γd
X = linear advance/shift (ft) w = opening width (ft) h = seam height (ft) t1 = roof dilution (in) t2 = floor dilution (in) t = total dilution (in) γd = avg. unit weight of dilution of rock (pcf) γc
= unit weight of coal (pcf) Coal
Roof
Floor
w

37
Table 23: Dilution model variables and base case values.
Variable Descriptor Units Base Case Value
h = Average seam height inches 60 w = Average entry width inches 240
dγ = Rock (dilution) density lbs/ft3 (pcf) 145
cγ = Coal density lbs/ft3 (pcf) 80
sP = Unit shift production (ROM) tons/shift 2000 D = Production days per year days 300 N = Production shifts per day shifts 3 R = Recovery percent (%) 70
PC = Face production costs $/ROM ton 7.75
OC = Out bye production costs $/ROM ton 3.50
PRC = Processing costs $/ROM ton 1.40
WC = Waste disposal costs $/waste ton 2.00
AC = Administrative overhead costs $/ROM ton 0.00 S = Selling price $/clean ton 20.00
The administrative overhead cost was assumed as zero since it varies considerably from mine to mine based on accounting practices at the mine. Equations: Actual dilution (d) d = (1 – R – ponded coal – misplaced coal)*100 = (1-0.7-0.05-0.03)*100 = 22% Estimated cost of dilution (Cd)
Cd=[ *( ) * )]d C C C d C
RP O PR W+ + +
= ( )22 12.65 22 270
∗ + ∗= $4.60/clean ton
Dilution Thickness ( )t
t 1 1 c
d
hR
γγ∗⎛ ⎞= − ∗⎜ ⎟
⎝ ⎠ inches

38
Average advance feet / shift ( )A
A( ) ( )
2000 1728 12s
c d
Pw h w tγ γ
⎡ ⎤∗ ∗= ⎢ ⎥∗ ∗ + ∗ ∗⎣ ⎦
feet
Clean coal/shift ( )cC
Cc sP R= ∗ tons
Estimated clean coal / year ( )yrC
Cyr C D N= ∗ ∗ tons/year
Production cost (clean coal) / shift ( )ShiftCP
CPshift ( ) ( )1s P O PR A s CP C C C C P R C= ∗ + + + + − ∗ $/ton
Production cost / clean ton ( )CP
CP( )Shift
c
CPC
= $/ton
Net Profit / Loss per year ( )yrCP
CPyr ( )yrC S CP= − dollars
Change in profitability (%)
CPR 100NewCase Base Case
Base
CP CPCP−
= ∗
The effect or impact of several variables related to dilution on production cost and enterprise profitability were analyzed. Sensitivity to changes in annual clean coal production, production cost per ton, profitability as a function of dilution thickness, selling price of coal, and seam thickness were determined.

39
Figure 16 shows the relationship between annual clean coal production and dilution thickness for varying seam heights. Production changes are more pronounced for lower seam height as expected since dilution forms a larger percentage of seam thickness.
1000
1050
1100
1150
1200
1250
1300
1350
1400
1450
1500
-5 -4 -3 -2 -1 0 1 2 3 4 5
Change in dilution thickness (inches)
Ann
ual c
lean
coa
l pro
duct
ion
(x 1
000
tons
)
5 Feet
6 Feet
7 Feet
Seam Thicknes
s
Figure 16: Change in annual clean coal production with change in dilution thickness.
Figure 17 shows the relationship between profitability and varying dilution thickness for different seam heights. For similar reasons, profitability is more sensitive to lower seam thickness. Decreasing dilution thickness by two inches increases enterprise profitability by 60 to 90% depending upon seam thickness.
-200-150-100
-500
50100150200250
-5 -3 -1 1 3 5
Change in dilution thickness (inches)
Chn
age
in p
rofit
abili
ty (%
)
6 feet5 feet7 feet
Seam Thickness
Figure 17: Change in enterprise profitability with change in dilution thickness.

40
Figure 18 shows profitability for two different selling prices of coal rather than seam thickness. As the selling price of coal decreases, the effect of dilution on profitability increases.
-150.00
-100.00
-50.00
0.00
50.00
100.00
150.00
200.00
-6 -4 -2 0 2 4 6
Change in dilution thickness (inches)
Cha
nge
in p
rofit
abili
ty (%
)
$ 21 /ton
$ 20 / ton
Figure 18: Change in profitability with change in dilution thickness.
Figure 19 shows the relationship between production cost for a clean ton and varying dilution thickness for different seam heights. As the dilution thickness increases, the production cost per ton also increases, indicating a directly proportional relationship between production cost and dilution thickness.
0
5
10
15
20
25
-5 -4 -3 -2 -1 0 1 2 3 4 5
Change in dilution thickness (inches)
Prod
uctio
n C
ost /
Cle
an T
on
5 feet6 feet7 feet
Seam Thickness
Figure 19: Change in production cost / clean ton with change in dilution thickness.
Selling Price

41
Figure 20 relates profitability as a function of unit weight of dilution rock. As dilution rock weight decreases, profitability increases. Therefore, if immediate roof or floor strata must be cut to increase working height, the lower unit weight rock (roof or floor) should be the choice. It should be noted that profitability is highly sensitive to dilution unit weight.
-80
-60
-40
-20
0
20
40
60
80
0 20 40 60 80 100 120 140 160 180
Dilution unit weight (pcf)
Cha
nge
in p
rofit
abili
ty (%
)
Figure 20: Change in profitability with change in dilution rock weight.
Figure 21 relates production cost as a function of recovery for varying seam thickness. The production cost increases with decreasing recovery.
0
5
10
15
20
25
0.62 0.64 0.66 0.68 0.7 0.72 0.74 0.76 0.78
Clean coal recovery
Cle
an c
oal p
rodu
ctio
n co
st ($
/ to
n)
5 feet6 feet7 feet
Seam Thickness
Figure 21: Change in clean coal production cost with change in plant recovery.

42
Figure 22 shows the relationship between annual clean coal production and plant recovery plant for different seam heights. As plant recovery increases, annual production increases. Thus, as dilution thickness decreases, recovery increases, thereby increasing annual production.
1150000
1200000
1250000
1300000
1350000
1400000
0.62 0.64 0.66 0.68 0.7 0.72 0.74 0.76 0.78
Clean coal recovery
Ann
ual c
lean
coa
l pro
duct
ion
(tons
)
5 feet6 feet7 feet
Seam Thickness
Figure 22: Change in annual clean coal production with change in plant recovery.
This model will form the foundation for an education and training program to explain the impacts of OSD on profitability that will be developed during the 2003-2004 project year. Major findings from coal company interviews and questionnaire data • Dilution has not been a major priority at most mines until recently. Most managers
are starting to talk about dilution to the face workers in order to enhance dilution awareness and its financial impacts. Cost of dilution is not fully understood.
• Most managers believe equipment controls for horizon control and interface detection (both currently available) do not work and are not necessary.
• Improved dust control at the face will help control dilution by enhancing visibility. • Exploration data does not provide enough accuracy in seam thickness, and structural
behavior of roof and floor to be useful for dilution control. Immediate roof and floor strata are generally not characterized for impacts on coal quality.
• Education and training of first line supervisors, continuous miner operators, and roof bolter operators is the key to minimizing dilution. Education and training must include cost and profitability impacts of dilution.
• Partial management of dilution underground has safety concerns and must be approved by MSHA.
From these findings, the project team has identified the following “best practices” as having the most potential: 1) minimize out-of-seam mining through appropriate

43
equipment selection, education on impacts of dilution on cost, and management incentives, 2) work with MSHA to develop safer ways to manage OSD underground and then sort out and dispose of dilution underground to reduce material handling costs, processing costs, and waste disposal costs, and 3) sort out and dispose of some dilution on the surface prior to processing to reduce processing costs and waste disposal costs.
CONCLUSIONS Area I: Industrial Engineering Studies of Continuous Miner Performance and
Alternate Face Haulage Systems 1. The only significant elemental time difference between standard-voltage and high-
voltage miners is in loading rate during normal cutting. Other elemental times during normal cutting and during clean-up operations are not statistically different.
2. Higher loading rates of high-voltage miners have the potential to increase production by about 30% provided face haulage systems can haul material away from the face.
3. Numerous mine evaluations have repeatedly shown that haulage capacity is the parameter with the most significant effect on mine production.
4. Replacing existing haulage with battery shuttle cars may increase section production between 15% and 20% depending upon the mining layout (see Tables 3, 6 and 21).
5. Use of battery shuttle cars in conjunction with a surge car behind a miner may be the alternative of choice to increase face productivity without continuous haulage.
Area II: Development of a Modified Wet Scrubber for Improved Dust Control 1. Within the parameter value boundaries used in this study, an optimum dust
concentration in the range 1.6-1.8 mg/m3 was achieved for Mine 1 and Mine 2 using spray volume of 2-gpm at 40-psi for Spray 1 and 3-gpm at 40-psi for Spray 2, 5-layer scrubber filters for Filter 1 and Filter 2, and surfactant at a concentration of 0.007%.
2. Based on results obtained from the different scrubber study phases, the hypothesis that the modified wet scrubber definitely improves dust control is valid.
3. The advantages of the modified scrubber system are as follows: • The two-filter design gives more residence time for dust-laden air to interact
with the water and surfactant sprays. • The 5-layer two-filter design gives more airflow and lesser overall pressure drop
compared to a single filter design. • The multi-nozzle spray system provides a more uniform spray area with reduced
spray volume, thus reducing surfactant requirements and costs. Area III: Identification of “Best Practices” for Reduction in Out-of-seam Dilution 1. Out-of-Seam dilution cost is very high and approaches $4-$5 per ton. In addition,
dilution/waste disposal may create aesthetic and environmental problems.

44
2. Decreasing out-of-seam dilution by two inches at a typical Illinois mine can increase profitability by about 80%-100%. The effect is more pronounced for lower seam thickness and lower selling price of coal.
3. A two-inch decrease in OSD decreases the production cost by about $2/clean ton, which amounts to about 10%-12% reduction in production cost.
4. Mine operators think that technological controls (horizon control and coal-rock interface detection devices) on continuous miners will not reduce OSD.
5. Educational programs that emphasize financial impacts of OSD and management incentives should be considered to control OSD.
RECOMMENDATIONS
Area I: Industrial Engineering Studies of Continuous Miner Performance and Alternate Face Haulage Systems
1. A financial model of a typical mining layout with a standard-voltage continuous
miner, cable shuttle cars, dual-boom bolters, and other typical face equipment should be developed. The goal is to estimate base case face production costs. Alternatives can then be compared with this base case.
2. Sensitivity analyses on characteristics of existing face haulage systems should be conducted to identify the most critical variables. These variables must then be incorporated into the design of battery shuttle cars and surge car systems.
Area II: Development of a Modified Wet Scrubber for Improved Dust Control 1. Economic analyses should be performed to determine the trade-off between operating
parameters versus dust concentrations without affecting mine ventilation conditions. These analyses should include surfactant costs and power costs for operating the scrubber as well as any productivity improvements that reduced dust concentrations might make possible.
2. All tests reported here were conducted using coal from Illinois Basin #5 and #6 seams. Additional testing on coal from other coal seams is recommended.
3. Continuous monitoring of the dust in the sampling room will provide useful dust concentration data at any point of time and results can be analyzed quickly.
Area III: Identification of “Best Practices” for Reduction in Out-of-seam Dilution 1. Develop an educational program that emphasizes effects of OSD on coal production
costs and mining enterprise profitability. 2. Encourage mine operators and MSHA to develop safe approaches for underground
disposal of OSD.

45
ACKNOWLEDGEMENT In addition to the funding support by the ICCI, the principal investigator and the project staff greatly appreciate the support of cooperating mines staff for their exceptional support during this study. The project steering committee is commended for their untiring support for this project. The project investigators also express gratitude to Mr. Harold Gurley for his technical assistance.
DISCLAIMER STATEMENT
This report was prepared by Dr. Y. P. Chugh of Southern Illinois University at Carbondale with support, in part by grants made possible by the Illinois Department of Commerce and Economic Opportunity through the Office of Coal Development and the Illinois Clean Coal Institute. Neither Dr. Y. P. Chugh of Southern Illinois University at Carbondale nor any of its subcontractors nor the Illinois Department of Commerce and Economic Opportunity, Office of Coal Development, Illinois Clean Coal Institute, nor any person acting on behalf of either: (A) Makes any warranty of representation, express or implied, with respect to the
accuracy, completeness, or usefulness of the information contained in this report, or that the use of any information, apparatus, method, or process disclosed in this report may not infringe privately-owned rights; or
(B) Assumes any liabilities with respect to the use of, or for damages resulting from the
use of, any information, apparatus, method or process disclosed in this report. Reference herein to any specific commercial product, process, or service by trade name, trademark, manufacturer, or otherwise, does not necessarily constitute or imply its endorsement, recommendation, or favoring; nor do the views and opinions of authors expressed herein necessarily state or reflect those of the Illinois Department of Commerce and Economic Opportunity, Office of Coal Development, or the Illinois Clean Coal Institute. Notice to Journalists and Publishers: If you borrow information from any part of this report; you must include a statement about State of Illinois’ support of the project.

EQUIPMENT INVENTORY REPORT March 1, 2002, through September 30, 2003
Project Title: DEVELOPMENT AND DEMONSTRATION OF ADVANCED
MINING TECHNOLOGIES TO REDUCE PRODUCTION COSTS ICCI Project Number: 01-1/1.1D-5 Principal Investigator: Dr. Y. P. Chugh, Southern Illinois University Other Investigators: M. McGolden, J. Hirschi, K. Thatavarthy, A. Moharana, E. Roberts and B. Meyer Project Manager: Dr. Ronald Carty, Illinois Clean Coal Institute
LIST OF EQUIPMENT PURCHASED
No equipment was purchased from the project funds.

PROJECT MANAGEMENT REPORT March 1, 2002, through September 30, 2003
Project Title: DEVELOPMENT AND DEMONSTRATION OF ADVANCED
MINING TECHNOLOGIES TO REDUCE PRODUCTION COSTS ICCI Project Number: 01-1/1.1D-5 Principal Investigator: Dr. Y. P. Chugh, Southern Illinois University Other Investigators: M. McGolden, J. Hirschi, K. Thatavarthy, A. Moharana, E. Roberts and B. Meyer Project Manager: Dr. Ronald Carty, Illinois Clean Coal Institute COMMENTS The collaborative project team of SIU and coal industry professionals has worked diligently to perform studies far beyond the scope of the proposal. For example, modification of wet scrubber and development of a mathematical model for out-of-seam dilution were not part of the proposal. A few tasks related to field demonstration of battery shuttle car have not been completed because we could not procure a battery shuttle car for demonstration in Illinois during the project period. Similarly, the task on size distribution of coal from high-voltage miner could not be completed. Both these tasks will be performed under the umbrella of an ongoing Project 02-1/1.1A-1 “Reducing Underground Production Cost through Enhanced Face Productivity”. ICCI has agreed that funds remaining at the end of September 30, 2003 in this project will be transferred to 02-1/1.1A-1 so that these tasks can be completed. The PI believes that the objectives of the project were satisfactorily met and far exceeded expectations. The project team met at suitable intervals to maintain focus on the project tasks and commercialization of developed technologies. An information transfer seminar was successfully conducted.

PUBLICATIONS AND PRESENTATIONS REPORT March 1, 2002, through September 30, 2003
Project Title: DEVELOPMENT AND DEMONSTRATION OF ADVANCED
MINING TECHNOLOGIES TO REDUCE PRODUCTION COSTS ICCI Project Number: 01-1/1.1D-5 Principal Investigator: Dr. Y. P. Chugh, Southern Illinois University Other Investigators: M. McGolden, J. Hirschi, K. Thatavarthy, A. Moharana, E. Roberts and B. Meyer Project Manager: Dr. Ronald Carty, Illinois Clean Coal Institute
LIST OF PUBLICATIONS AND PRESENTATIONS No formal publications or presentations of the material contained in this report were completed during the contract period. NOTE: Research related to the modified wet scrubber and use of surfactants most likely will have intellectual property rights. The PI and key project team members disclosed the concept of a modified scrubber to the SIU patent committee in Spring 2003. The University has recommended holding intellectual property rights for this development and applying for a patent at an appropriate future time. An informal, closed-door, oral presentation was also made to corporate officials from Joy Mining Machinery.