Embed Size (px)
Citation preview

18. GMA/ITG-Fachtagung Sensoren und Messsysteme 2016 84
DOI 10.5162/sensoren2016/1.4.1
Development and Evaluation of a Modular Energy ManagementConstruction KitModulare Konfigurier- und Testplattform für die Untersuchung desEnergiemanagements in selbsversorgten AnwendungenJan Kokert, Tobias Beckedahl and L.M. ReindlUniversity of Freiburg, Department of Microsystems Engineering - IMTEKLaboratory for Electrical Instrumentation, Georges-Köhler-Allee 106, 79110 Freiburg, Germany
AbstractOur aim of research is to understand and to improve the power supply of energy-harvesting poweredsystems by means of finding the optimal energy management. In this paper we (1) propose a generalenergy management structure, (2) present a modular platform concept to realize various configurations ofenergy management, and (3) characterize management modules and prove the feasibility of the constructionkit. The energy management components investigated are dc-dc converters, energy-supervisors, supercapacitors and a dummy loads. The results show that all modules work properly and that interconnectionshas a negligible effect. Our tool offers a new approach to thoroughly investigate energy managements.Keywords: Energy harvesting, energy management, modular platform, dc-dc converter, super capacitor
1 IntroductionSelf-powered sensor nodes are electrical micro-systems which continuously measure physical pa-rameters of their surrounding. This might be thetemperature, pressure, humidity [1], light intensity[2],vibration [3] or soil properties [4]. The wireless sen-sor nodes (WSN) send the data to the next node orto a central data collection unit for monitoring.Batteries or energy harvesting (EH) are used tosupply power to the devices [5]. A battery has alimited lifetime and therefore needs to be replacedafter a while which can cost more then the batteryitself. EH utilizes the energy of the surrounding (nomatter in which form) and converts it into electricalenergy.Micro-energy management (MEM) is essential toextract, transfer and regulate power from an energyharvester to a load, as shown in Fig. 1. It is a keycomponent for self-powered sensor nodes and isthoroughly discussed in this article.The remainder of the paper is organized as follows:in the state-of-the-art section we present energymanagements of wireless sensor nodes and test
Fig. 1 General scenario in with a micro-energy man-agement (MEM) supplies regulated power to a loadfrom energy harvesting
kits. After that wee will motivate our research ap-proach in 3. We present a general structure ofMEMs in 4 and our modular construction kit in 5. Insection 6 we show the evaluation of the kit compo-nents (modules and main board).
2 State-of-the-art
2.1 WSNs which use Energy Management
Below, we will present a couple of wireless sensornodes (WSN) which implement a rather advancedenergy management. All approaches make use ofpower converters (dc-dc) to increase the systemefficiency and use intermediate storages to bufferpower fluctuations. To give a better overview, wehave summarized the issues and drawbacks first:
• The hardware of all systems presented is fixedon one printed circuit board (PCB), which makesvarying different hardware components very im-practical.
• Another issue in the presented work is that theleakage of super capacitors is measured and un-derstood incorrectly. As [6] and [7] show, thevoltage drop after charging is due to an internalcharge redistribution, which we however, considerin our measurements.
• The structure of the energy managements pre-sented so far is application specific and not gen-eralized to cover all management configurations.

18. GMA/ITG-Fachtagung Sensoren und Messsysteme 2016 85
DOI 10.5162/sensoren2016/1.4.1
The authors in [8] present a WSN prototype boardpowered by ten miniature PV cells and the bq25504dc-dc converter. They realize a hybrid storage witha 5 F super capacitor and a 350 mAh Li-Ion Battery.The power management (decision making) is im-plemented in an CPLD. The board is comparablylarge (18.8 cm × 12.5 cm) with a fixed managementstructure. Only jumpers offers to set different config-urations. The power consumption of the CPLD andthe involved analog-to-digital converters (ADCs) arenot discussed.In [9] the authors present an energy managementwith hybrid storage (super capacitor and Li-Ion bat-tery), bidirectional dc-dc converters and a 3.3 Vdc-bus. The dc-dc converters are built using theTPS43000 dc-dc controller and external MOSFETtransistors which makes it very versatile. The majordrawback though, is the lack of configurations pos-sible. Furthermore, it is not clear why the dc-bus isbeneficial for the system.The authors of [10] present an impedance match-ing for a thermoelectric generator (TEG) with a twostage concept, utilizing a Seiko chargepump andthe TPS61020 boost converter. Again, the wholeenergy management structure is fixed which makesoptimization very hard. Additionally, the supercapleakage current is misunderstood.In [11] the author mentions a modular platform toevaluate different dc-dc converters and loads. Allmodules are connected in one string and the 32 I/Olines offers a very flexible usage. A drawback isthe size of the modules (16 cm × 10 cm) which areconnected by huge 2×32 pin connectors.
2.2 Test kits for Energy Management
2.2.1 Energy Harvesting Solution to go (WE)The German company Würth-Elektronik offers acommercial energy harvesting kit, which is shown
Fig. 2 Energy Harvesting Solution To Go which allowsmulti-source harvesting [www.we-online.de]
in Fig. 2. The kit combines the EFM32 Giant GeckoStarter Kit from Silicon Labs with the Multi-SourceEnergy Harvester from Linear Technology and pas-sive components, like coils, from Würth-Elektronik.Different dc-dc converters can be chosen by thejumpers, which only gives a little freedom of configu-ration. Multi-source harvesting is possible by usinga combination of solar cell, thermoelectric generator(TEG) and the piezo harvester (for vibration). Thekit provides no monitoring capability, except for thecurrent measurement of the microcontroller.
2.2.2 Energy Harvesting Platform (FE)
A more versatile solution is the Energy Harvest-ing Platform from Future Electronics. Different har-vesters, dc-dc converters, storages and sensors(loads) can be connected via a uniform interface toa main board. The structure however is rather fixed,including one harvester, two dc-dc converters, onestorage and one load module. Further enhancedconcepts like multi-source harvesting or a hybridstorage can not be realized. Furthermore, the mainboard includes fixed components: power paths areswitched by bistable relays and the current is mea-sured by fixed shunt resistors (50 mΩ).
2.2.3 Vendor-specific EH demo boards
Besides dc-dc IC evaluation boards some vendorsalso offer EH-demo boards which provide connectiv-ity of different harvesters and loads and offer certainself monitoring capabilities. Worth to mention arethe Analog Devices ADP5091 demo board, MaximIntegrated MAX17710 evaluation board, the enO-cean EVA320-2 board and the IPS-EVAL-EH-01evaluation board from Infinite Power Solutions.
Fig. 3 The EH Platform from FutureElectronics. Dif-ferent modules like dc-dc converters and storages areconnected on fixed positions to the main board (shownin green) [www.futureelectronics.com]

18. GMA/ITG-Fachtagung Sensoren und Messsysteme 2016 86
DOI 10.5162/sensoren2016/1.4.1
3 Motivation and Approach3.1 Power forming and reliability
Continuous power supply is essential for most ap-plications, like sensor nodes, because they haveto measure and transfer data periodically. It is achallenging task to design such a continuous powersupply based on energy harvesting. Keep in mindthat the output power PEH of an energy harvesterfluctuates, whereas the load shows a well-knownpower profile Pload . Only a micro energy manage-ment with an intermediate storage can accomplishthis task [12]. A further issue is the voltage level ofthe harvester VEH which doesn’t match the voltageof a typical load Vload . Consequently, the followingequations hold true:
PEH = Pload (1)VEH =Vload (2)
The reliability ρ of a self-powered system can bedefined as the ratio between the number of jobsdone (# jobsdone) and the number of jobs scheduled(# jobsscheduled), as shown in the following equation:
reliability: ρ =# jobsdone
# jobsscheduled(3)
3.2 Aim and Approach
The aim of our research is to understand and toimprove the reliability (as defined in Eq. 3) of self-powered systems by means of finding the optimalenergy management. Our approach presented inthis paper is to develop and evaluate a constructionkit to freely configure and test various managementsstructures. Further research will focus on the dimen-sioning and benchmarking of different structures.Our approach is detailed into three steps
1. Propose a general management structure andsystematically identify building blocks
2. Develop hardware modules for each buildingblock and interconnect them with a base board
3. Prove the feasibility of the kit with measurementsof the individual modules and the parasitic effects.
4 General structure of micro energymanagements
In figure 4, we propose a general energy manage-ment structure. For the sake of simplicity, we showonly one harvester, one storage and one load. Theconcept can be extended by multiplying the adja-cent blocks of the Energy Supervisor or omitting
some blocks. Thus the structure can be applied toevery energy management the authors can think of.It is possible that a commercial solution could covermore than one building block, e.g. energy extractionand energy supervision.
4.1 Identify building blocks
The Energy Generator is responsible for collectingenergy (no matter in which form) and to convertit into electrical power. Energy Extraction is es-sential to extract the unregulated power providedby the energy generator in the most efficient way.Impedance matching realized by Maximum powerpoint tracking (MPPT) can be realized here. The En-ergy Supervisor then controls the energy flow to aload or a storage. It monitors voltage levels at differ-ent nodes in the system and activates certain powerpaths. To supply power with a constant regulatedvoltage, the Energy Supply is needed. ChargeControl is mandatory to access an energy storage.It monitors the charge procedure and keeps track ofovervoltage and undervoltage conditions. The Loadrepresents the power consumer, e.g., a sensor, amicrocontroller and a radio transceiver.
EnergyGenerator
EnergyExtraction
EnergySupply
ChargeControl
EnergyStorage
LoadEnergy
Supervisor
Fig. 4 General structure of energy managements
4.2 Realizing the building blocks
The yellow building blocks are usually realized bydc-dc converters or low drop-out regulators (LDOs).No matter if switched mode (dc-dc) or linear (LDO),every converter features a kind of regulation (in-put/output and current/voltage) which is presentednext:Energy Extraction requires converters which reg-ulate the input voltage. The input voltage is well-suited to be controlled by MPP tracking according tothe fractional open-circuit voltage method (FOCV)or the perturb and observe (P&O) method [13].Energy Supply requires power converters whichregulate the output voltage to provide e.g. 3.3 V.For Charge Control, power converters are usedwhich regulate the input or output current. To real-ize a full CCCV-charging scheme (constant currentconstant voltage), a voltage limiting feature is imple-mented as well [14].

18. GMA/ITG-Fachtagung Sensoren und Messsysteme 2016 87
DOI 10.5162/sensoren2016/1.4.1
5 The construction kit:From building blocks to Modules
5.1 Standard module
There are roughly about 100 integrated circuits (ICs)commercially available, which can be used in a mi-cro energy management circuit. It is difficult to elab-orate on these ICs thoroughly, because the evalu-ation boards of the ICs are not standardized. Toovercome this issue, we have defined our own stan-dard layout as shown in Fig. 5. One module holdsall necessary components, which are (besides theIC) all necessary passive components like resistors,capacitors and inductors. This approach allows usto think in a more structured way (in building blocks)without struggling with the specific layout considera-tions of each IC. So far, we have managed to fit anyenergy management component on such a smallmodule, like a dc-dc converter, a power switch or anenergy storage.
Fig. 5 Standardized module layout to hold one energymanagement sub-circuitry, measuring only 1.6" × 1.2"
5.1.1 Power pathEven though commercial ICs offer a lot of features,inputs and outputs for power can be identified andhave fixed positions on every module (IN1, IN2,OUT1, OUT2, GND). Theses power ports are con-nected through the main board (see next section) tobuild up the whole power management circuitry. Afour-pin connection reduces the series resistanceand gives the system a mechanically reliable con-nection, which is necessary for long-term experi-ments.
5.1.2 Control signals and further develop-ments
Additional control inputs and outputs (analog as wellas digital) are routed to the sides of the modules.They allow access to features like chip enable andunder-voltage lockout (UVLO) by use of 0.1" jumperwires. Different modes of operation of the individual
chips are realized with jumpers on the module. Forfurther developments, there is a power supply (5 V,3.3 V and -1.5 V) and a serial interface available.
5.2 Main board
Figure 6 shows the main board. It is designed tohold up to 8 modules in two rows and thus allowsfor multi-energy harvesting and multi-load supply.
We installed banana plugs on the edges of the boardto easily connect various harvesters and loads. Inthe figure, a basic setup of the bq25570 dc-dc con-verter, a supercap and a dummy load is shown.
The main board has conducting paths which con-nect the modules to each other. Figure 7 (left) il-lustrates how the first power rail is connected fromone module to the next one (IN1, OUT1, shown inred) and furthermore, that the second power rail isseparated (IN1, OUT1, shown in blue and yellow).To realize even more complicated connection struc-tures, we have also built a power jumper wire, asshown in Fig. 7 (right).
Fig. 6 Two rows of four modules each can be pluggedinto the main board. The inputs and outputs are acces-sible by the white banana plugs.
Fig. 7 left: module interconnection with two power rails;right: power jumper wire with very low contact resis-tance (11±0.2mΩ, including female headers)

18. GMA/ITG-Fachtagung Sensoren und Messsysteme 2016 88
DOI 10.5162/sensoren2016/1.4.1
5.3 Realized modules
Table 1 summarizes all modules built so far. Thefirst section shows all power converter modules, thesecond section energy supervisors, and the lastsection shows energy storages and a dummy load.
Table 1 Overview of all modules currently available inthe construction kit
module dedicated function
ADP5090 dc-dc, Vin regulated, MPPT by FOCVBQ25570 dc-dc, Vin regulated, MPPT by FOCVSPV1040 dc-dc, Vin regulated, MPPT by P&OLTC3125 dc-dc, Iin regulated, 0.2 A to 1 ALT3109 ac-dc, Vstartup = 20 mV, for TEGs
TPS3839x two voltage supervisors 2.6 V and 3.1 VADG888 analog switch matrix (5.5 V, 0.8 A)TPS2421 load switch (20 V, 5 A)LT6656 + voltage reference and comparatorTLV3691 on one module (Iq = 850 nA and 75 nA)
SuperCap C = 0.18, 0.3 and 0.8 F from Cap-XXDummyLoad prog. resistor array 12.5 mΩ to 1 MΩ
In the following, we will give more details about cer-tain modules: figure 8 shows the ADP5090 and theBQ25570 module. Both converters feature two out-puts: the first is meant to connect a super capacitor,where the second one is a voltage controlled out-put. The pin AI1 is the fractional open-circuit voltagewhich is acquired by the dc-dc controller. With thejumpers (J1 ... J3) or the digital inputs (DI1 and DI2)the FOCV ratio can be chosen and an undervoltagefeature can be enabled.The switch matrix shown in Fig. 9 is built by twoADG888 from Analog Devices. The module fea-tures two inputs and two outputs. By means of the
DC/DCADP5090
IN2
AI1
DI1
J1 J2 J3
DO1
OUT2
DC/DCBQ25570
AI1
DI1DI2
J1 J2 J3
DO1AO2AO1
OUT2
Fig. 8 left: ADP5090 module; right: BQ25570 module
AI1AI2DI1DI2
OUT1 DC/DCDummyLoad
SI
DI1DI2
OUT1
Fig. 9 left: Switch matrix; right: dummy load module
four bidirectional switches, every input can eitherbe connected to every output or left floating. Onthe right of Fig. 9 the dummy load is depicted. Itcontains a 16-Bit shift register to address 16 preci-sion resistors (0.1%) via MOSFET transistors. Thevalues are 12.5 Ω, 25 Ω, 50 Ω, 100 Ω, 220 Ω, 470 Ω,1 kΩ, 2.2 kΩ, ... 470 kΩ and 1 MΩ.
6 Experimental resultsIt is important that implementing the power man-agement ICs on our modules has no effect on theperformance and the behavior in any manner. Thisis why be thoroughly tested each module and com-pared the results to the reference data (datasheet).
6.1 Validation of the power converter modules
The main parameters of interest of power convert-ers are the start-up voltage and the efficiency. Weuse the Keithley SourceMeter 2400 as a currentsource and the B&K Precision 8600 as a currentsink. The current and voltage at the input and out-put were measured with four Agilent 43301A. Wecarried out an automated measurement using Lab-VIEW by sweeping current and voltage for all powermodules. Exemplary, we show the results for theADP5090 and BQ25570 in Fig.10 to 13. The ref-erence data is always given as a blue line and thedeviation is shown in a separate chart on the right.
0.01 0.1 1 10
Input current in mA
55
60
65
70
75
80
85
90
Eff
icie
ncy in
%
Module 1
Module 2
Module 3
Datasheet
0.01 0.1 1 10
Input current in mA
-35
-30
-25
-20
-15
-10
-5
0
5
Re
l. d
evia
tio
n f
rom
da
tash
ee
t in
%
Module 1
Module 2
Module 3
Fig. 10 ADP5090 efficiency measurement in depen-dence of input current (left) and relative deviation (right)
0 0.4 0.8 1.2 1.6 2 2.4 2.8
Input Voltage in V
0
10
20
30
40
50
60
70
80
90
100
Effic
iency in %
Module 1
Module 2
Module 3
Datasheet
0 0.4 0.8 1.2 1.6 2 2.4 2.8
Input Voltage in V
-10
-5
0
5
10
15
20
25
30
Rel. d
evia
tion fro
m d
ata
-sheet in
%
Module 1
Module 2
Module 3
Fig. 11 ADP5090 efficiency measurement in depen-dence of input voltage (left) and relative deviation (right)
18. GMA/ITG-Fachtagung Sensoren und Messsysteme 2016 89
DOI 10.5162/sensoren2016/1.4.1
0.01 0.1 1 10 100
Input current in mA
50
55
60
65
70
75
80
85
90E
ffic
iency in %
Module 1
Module 2
Module 3
Module 4
Datasheet
0.01 0.1 1 10 100
Input current in mA
-24
-20
-16
-12
-8
-4
0
4
Rel. d
evia
tion fro
m d
ata
sheet in
%
Module 1
Module 2
Module 3
Module 4
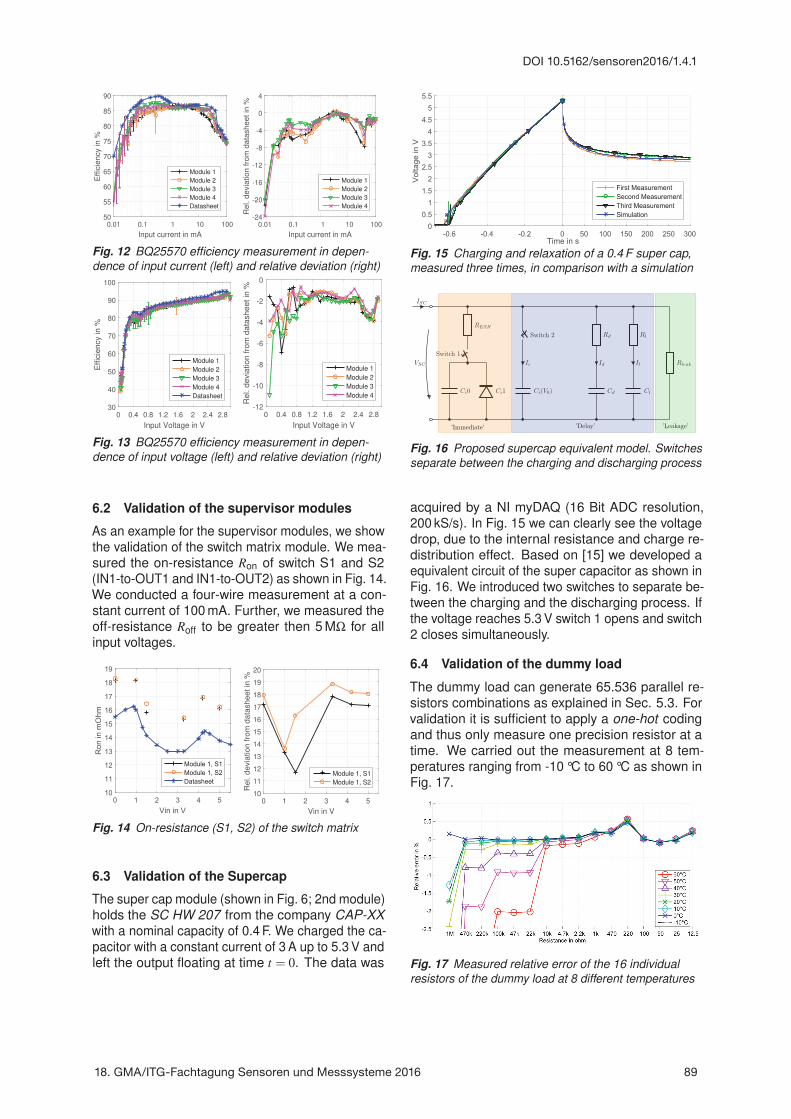
Fig. 12 BQ25570 efficiency measurement in depen-dence of input current (left) and relative deviation (right)
0 0.4 0.8 1.2 1.6 2 2.4 2.8
Input Voltage in V
30
40
50
60
70
80
90
100
Eff
icie
ncy in
%
Module 1
Module 2
Module 3
Module 4
Datasheet
0 0.4 0.8 1.2 1.6 2 2.4 2.8
Input Voltage in V
-12
-10
-8
-6
-4
-2
0
Rel. d
evia
tion fro
m d
ata
sheet in
%
Module 1
Module 2
Module 3
Module 4
Fig. 13 BQ25570 efficiency measurement in depen-dence of input voltage (left) and relative deviation (right)
6.2 Validation of the supervisor modules
As an example for the supervisor modules, we showthe validation of the switch matrix module. We mea-sured the on-resistance Ron of switch S1 and S2(IN1-to-OUT1 and IN1-to-OUT2) as shown in Fig. 14.We conducted a four-wire measurement at a con-stant current of 100 mA. Further, we measured theoff-resistance Roff to be greater then 5 MΩ for allinput voltages.
0 1 2 3 4 5Vin in V
10
11
12
13
14
15
16
17
18
19
Ron
in m
Ohm
Module 1, S1Module 1, S2Datasheet
0 1 2 3 4 5
Vin in V
10
11
12
13
14
15
16
17
18
19
20
Rel. d
evia
tion fro
m d
ata
sheet in
%
Module 1, S1
Module 1, S2
Fig. 14 On-resistance (S1, S2) of the switch matrix
6.3 Validation of the Supercap
The super cap module (shown in Fig. 6; 2nd module)holds the SC HW 207 from the company CAP-XXwith a nominal capacity of 0.4 F. We charged the ca-pacitor with a constant current of 3 A up to 5.3 V andleft the output floating at time t = 0. The data was
50 100 150 200 250 300Time in s
First MeasurementSecond MeasurementThird MeasurementSimulation
-0.6 -0.4 -0.2 00
0.51
1.52
2.53
3.54
4.55
5.5
Vol
tage
in V
Fig. 15 Charging and relaxation of a 0.4 F super cap,measured three times, in comparison with a simulation
VSC
RESR
Ci0 Ci1
ISC
Switch 1
Switch 2
Ci(V0)
Rd
Cd
Rl
Cl
Ii Id Il Rleak
’Immediate’ ’Delay’ ’Leakage’
Fig. 16 Proposed supercap equivalent model. Switchesseparate between the charging and discharging process
acquired by a NI myDAQ (16 Bit ADC resolution,200 kS/s). In Fig. 15 we can clearly see the voltagedrop, due to the internal resistance and charge re-distribution effect. Based on [15] we developed aequivalent circuit of the super capacitor as shown inFig. 16. We introduced two switches to separate be-tween the charging and the discharging process. Ifthe voltage reaches 5.3 V switch 1 opens and switch2 closes simultaneously.
6.4 Validation of the dummy load
The dummy load can generate 65.536 parallel re-sistors combinations as explained in Sec. 5.3. Forvalidation it is sufficient to apply a one-hot codingand thus only measure one precision resistor at atime. We carried out the measurement at 8 tem-peratures ranging from -10 °C to 60 °C as shown inFig. 17.
Fig. 17 Measured relative error of the 16 individualresistors of the dummy load at 8 different temperatures
18. GMA/ITG-Fachtagung Sensoren und Messsysteme 2016 90
DOI 10.5162/sensoren2016/1.4.1
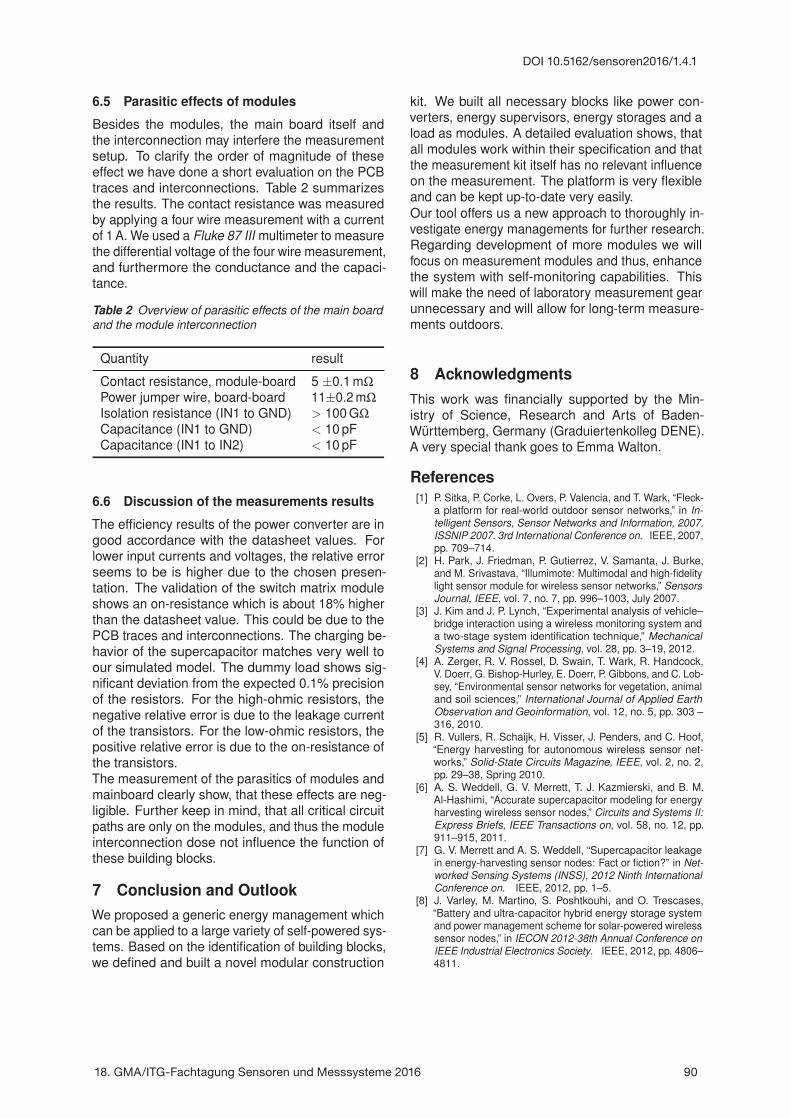
6.5 Parasitic effects of modules
Besides the modules, the main board itself andthe interconnection may interfere the measurementsetup. To clarify the order of magnitude of theseeffect we have done a short evaluation on the PCBtraces and interconnections. Table 2 summarizesthe results. The contact resistance was measuredby applying a four wire measurement with a currentof 1 A. We used a Fluke 87 III multimeter to measurethe differential voltage of the four wire measurement,and furthermore the conductance and the capaci-tance.
Table 2 Overview of parasitic effects of the main boardand the module interconnection
Quantity result
Contact resistance, module-board 5 ±0.1 mΩPower jumper wire, board-board 11±0.2 mΩIsolation resistance (IN1 to GND) > 100 GΩCapacitance (IN1 to GND) < 10 pFCapacitance (IN1 to IN2) < 10 pF
6.6 Discussion of the measurements results
The efficiency results of the power converter are ingood accordance with the datasheet values. Forlower input currents and voltages, the relative errorseems to be is higher due to the chosen presen-tation. The validation of the switch matrix moduleshows an on-resistance which is about 18% higherthan the datasheet value. This could be due to thePCB traces and interconnections. The charging be-havior of the supercapacitor matches very well toour simulated model. The dummy load shows sig-nificant deviation from the expected 0.1% precisionof the resistors. For the high-ohmic resistors, thenegative relative error is due to the leakage currentof the transistors. For the low-ohmic resistors, thepositive relative error is due to the on-resistance ofthe transistors.The measurement of the parasitics of modules andmainboard clearly show, that these effects are neg-ligible. Further keep in mind, that all critical circuitpaths are only on the modules, and thus the moduleinterconnection dose not influence the function ofthese building blocks.
7 Conclusion and OutlookWe proposed a generic energy management whichcan be applied to a large variety of self-powered sys-tems. Based on the identification of building blocks,we defined and built a novel modular construction
kit. We built all necessary blocks like power con-verters, energy supervisors, energy storages and aload as modules. A detailed evaluation shows, thatall modules work within their specification and thatthe measurement kit itself has no relevant influenceon the measurement. The platform is very flexibleand can be kept up-to-date very easily.Our tool offers us a new approach to thoroughly in-vestigate energy managements for further research.Regarding development of more modules we willfocus on measurement modules and thus, enhancethe system with self-monitoring capabilities. Thiswill make the need of laboratory measurement gearunnecessary and will allow for long-term measure-ments outdoors.
8 AcknowledgmentsThis work was financially supported by the Min-istry of Science, Research and Arts of Baden-Württemberg, Germany (Graduiertenkolleg DENE).A very special thank goes to Emma Walton.
References[1] P. Sitka, P. Corke, L. Overs, P. Valencia, and T. Wark, “Fleck-
a platform for real-world outdoor sensor networks,” in In-telligent Sensors, Sensor Networks and Information, 2007.ISSNIP 2007. 3rd International Conference on. IEEE, 2007,pp. 709–714.
[2] H. Park, J. Friedman, P. Gutierrez, V. Samanta, J. Burke,and M. Srivastava, “Illumimote: Multimodal and high-fidelitylight sensor module for wireless sensor networks,” SensorsJournal, IEEE, vol. 7, no. 7, pp. 996–1003, July 2007.
[3] J. Kim and J. P. Lynch, “Experimental analysis of vehicle–bridge interaction using a wireless monitoring system anda two-stage system identification technique,” MechanicalSystems and Signal Processing, vol. 28, pp. 3–19, 2012.
[4] A. Zerger, R. V. Rossel, D. Swain, T. Wark, R. Handcock,V. Doerr, G. Bishop-Hurley, E. Doerr, P. Gibbons, and C. Lob-sey, “Environmental sensor networks for vegetation, animaland soil sciences,” International Journal of Applied EarthObservation and Geoinformation, vol. 12, no. 5, pp. 303 –316, 2010.
[5] R. Vullers, R. Schaijk, H. Visser, J. Penders, and C. Hoof,“Energy harvesting for autonomous wireless sensor net-works,” Solid-State Circuits Magazine, IEEE, vol. 2, no. 2,pp. 29–38, Spring 2010.
[6] A. S. Weddell, G. V. Merrett, T. J. Kazmierski, and B. M.Al-Hashimi, “Accurate supercapacitor modeling for energyharvesting wireless sensor nodes,” Circuits and Systems II:Express Briefs, IEEE Transactions on, vol. 58, no. 12, pp.911–915, 2011.
[7] G. V. Merrett and A. S. Weddell, “Supercapacitor leakagein energy-harvesting sensor nodes: Fact or fiction?” in Net-worked Sensing Systems (INSS), 2012 Ninth InternationalConference on. IEEE, 2012, pp. 1–5.
[8] J. Varley, M. Martino, S. Poshtkouhi, and O. Trescases,“Battery and ultra-capacitor hybrid energy storage systemand power management scheme for solar-powered wirelesssensor nodes,” in IECON 2012-38th Annual Conference onIEEE Industrial Electronics Society. IEEE, 2012, pp. 4806–4811.

18. GMA/ITG-Fachtagung Sensoren und Messsysteme 2016 91
DOI 10.5162/sensoren2016/1.4.1
[9] F. Ongaro, S. Saggini, and P. Mattavelli, “Li-ion battery-supercapacitor hybrid storage system for a long lifetime,photovoltaic-based wireless sensor network,” IEEE Trans-actions on Power Electronics, vol. 27, no. 9, pp. 3944–3952,Sept 2012.
[10] W. Wang, V. Cionca, N. Wang, M. Hayes, B. O’Flynn, andC. O’Mathuna, “Thermoelectric energy harvesting for build-ing energy management wireless sensor networks,” Inter-national Journal of Distributed Sensor Networks, 2013.
[11] J. Nagel, Neues Konzept für die bedarfsgerechte Energiev-ersorgung des Künstlichen Akkommodationssystems, ser.Schriftenreihe des Instituts für Angewandte Informatik, Au-tomatisierungstechnik am Karlsruher Institut für Technolo-gie. KIT Scientific Publishing, Karlsruhe, 2012.
[12] V. Raghunathan, A. Kansal, J. Hsu, J. Friedman, and M. Sri-vastava, “Design considerations for solar energy harvesting
wireless embedded systems,” in Proceedings of the 4th in-ternational symposium on Information processing in sensornetworks. IEEE Press, 2005, p. 64.
[13] D. Dondi, A. Bertacchini, D. Brunelli, L. Larcher, andL. Benini, “Modeling and optimization of a solar energy har-vester system for self-powered wireless sensor networks,”Industrial Electronics, IEEE Transactions on, vol. 55, no. 7,pp. 2759–2766, 2008.
[14] M. Einhorn, F. Conte, C. Kral, C. Niklas, H. Popp, andJ. Fleig, “A modelica library for simulation of elecric energystorages,” in Proceedings of the 8th International ModelicaConference, 2011.
[15] J. Lindenmaier, “Untersuchung eines von Doppelschichtkon-densatoren unterstuetzten Zweispannungsbordnetzes fürMikro-Hybrid-Fahrzeuge,” Ph.D. dissertation, UniversityUlm, 2010.