Embed Size (px)
Citation preview
1
Development and field testing of heavy metal monitor prototype
for pollution detection in untreated waste water
T. Cserfalvi , F. Hajdu Aqua-Concorde Kft, Budapest, H
O. Korda, A. Wootsch MFKK Kft, Budapest, H
P. Silhan Purity Control, spol s.r.o. , Ostrava, CZ
Abstract
Wastewaters in municipal sewerage systems are frequently polluted by heavy metals from
industrial discharge violations. To discover these pollution peaks lasting only 0.5-2 hours
mostly in night times and weekends, a new analytical monitor principle is required. Due to the
high organic (FOG: fat, oil, grease) and inorganic suspended matter contents of these water
streams the well known and sensitive analytical sensors and methods are not fit for the 24
hours/day and 7 days/week operation. Based on a new analytical measuring principle (the
electrolyte-cathode-atmospheric-glow-discharge-emission-spectroscopy) the development of a
metal monitor was possible for direct analysis of the untreated wastewater for heavy metal
pollution level. Its characteristics are : no sensor surface or optical window in contact with the
sample, measures all free ionic, complexed and hydrolysed metal forms without strong
mineralization process, measuring ranges are approximately 0.1/0.2/0.3 - 10 - 100 mg/L,
multi-metal measurement without special reagents, no fine filtering required (below 0.2-0.3
mm), accepts fat emulsion loaded sample, low power consumption, 1-5 measurements/hour.
The long term monitor operation required one more innovation in the self-cleaning raw
sample filtering unit which allows the assay of the total metal content (dissolved + colloidal +
fine suspended components). Field testing of the constructed metal monitor was conducted
with the inflow stream at a wastewater treatment plant and the 4 days monitor operation
successfully proved the pollution peak observation power of the instrument in the 0-5 mg/dm3
total concentration range.
Keywords: wastewater, monitoring, heavy metal

2
Introduction
Western Europe is one of the most highly industrialized regions of the world and in North-
West Europe alone industry is the largest water consumer, with a share of around 45%. Significant
water and soil pollution by nitrates, pesticides, hydrocarbons and heavy metals has been reported from
many EU countries 1, 2.
Heavy metals are elements that have a high density and are toxic or poisonous even at low
concentrations 3. Industrial wastewater is a recognizable source of European pollution and untreated
wastewater containing chemicals and elements such as heavy metals are extremely dangerous, as these
toxic substances accumulate in living organisms and contaminate aquatic ecosystems. The heavy
metals commonly implicated in pollution and human poisoning includes lead, mercury, arsenic and
cadmium. Industrial sources of heavy metal pollution in water include the mining and processing of
metal ores and the finishing and plating of metals. Metallic compounds widely used in other industries
include pigments in paints and dye manufacturing and the manufacturing of leather, among others.
The contamination through the feeding cycle involves pollution of agricultural soils with
heavy metals absorbed by plants and animals which are in turn consumed by humans. Heavy metals
are dangerous because they bio-accumulate, that is, they increase their concentrations in biological
organisms over time and are stored in living organisms faster than they are metabolized or excreted.
Epidemiological studies on the effects of lead on human health suggest that exposure to heavy metals
can be carcinogenic. Low level exposure to lead, for example, by the foetus or developing child may
lead to reprotoxic [substances that interfere with the reproductive process] effects which include
damage to the learning capacity and to neuropsychological development. Lead has also been shown to
have effects on haemoglobin synthesis and anaemia has been observed in children with lead blood
levels above 40 μg/dl 4.
In addition to wastewater, the sewer sludge produced by the municipal and
industrial wastewater treatment processes, also contains high levels of heavy metals. The amount of
sewage sludge has been increasing enormously. In 1992 5.5 million tons of dry matter was the
annual EU production while in 2005 it was approximately 9 million tons. Control of such polluting
substances at the stage of industrial wastewater is vital since sewer sludge is used in agriculture, as it
also contains valuable agronomic properties. The EU has instituted significant regulations for
treatment of sludge including the Sewage Sludge Directive 86/278/EEC which requires very close
monitoring of the concentration of heavy metals in sludge. Since December 2000, EU Member States
have been obliged to implement one of Europe's most complex and demanding laws - the EU Water
Framework Directive (WFD) that effectively reorganizes, under the same legal system, over 30
regulations and previous legal instruments regarding water, thereby forming the basis for EU water
policy in the use and the management of water resources 5,6
.
The heavy metal pollutions reaching the sewer systems are, fortunately, accumulating in the
sludge of the municipal wastewater treatment processes. Control of such polluting substances at the
stage of industrial wastewater treatment units is vital since unpolluted urban sewer sludge can be used
in agriculture. On the other side a havaria situation can happen when a high pollution peak in
the incoming wastewater stream inhibits the biological treatment process to such extent that
untreated water goes into the receiver water body for a 1-3 days period of the operation recovery.
Analysis data of the sludge of municipal waste water treatment plants clearly indicate the
presence or absence of industrial metal releases in a collecting area. At many areas having plating
shops, pharmaceutical factories, tanneries and other chemical activities, Zn, Cd, Cu, Cr, Pb, Ni, etc.
concentrations are well above the relevant sludge background values, while the standard daily analysis
data show that the inflow waste water concentrations are always below the limits. The general

3
checking practice of sampling the sewerage system at every weekday morning is absolutely useless for
discovering the sporadic pollution events which most probably happen through periods of 0.5-2 hours
during night times, weekends or holidays, but only 10-20 times in a year. Due to this characteristics
even a concentrated survey with automatic sampler operated through 24-72 hours fails to discover the
pollution peaks.
The problem of industrial violations and incidental spillouts have been recognized in the last
few decades all over the world. The wastewater quality monitoring technique, however, has had a
giant lack of proper analytical technique applicable directly to the mixed industrial and domestic
wastewater streams due to the very high organic and suspended matter content blocking the
continuous operation of the commonly used analytical sensors. The first successfull approach was
based on a new analytical principle, the so called electrolyte-cathode-atmospheric-glow-discharge-
emission-spectroscopy (discovered in 1993)7, which method proved its performance by revealing the
real characteristics of the urban sewer system pollutions caused by industrial violations 8.
The innovative measurement technology required an extensive development to construct a
monitor device with proper stability for long term operation. The wastewater metal monitor is the
product of a 3 year R&D project 9.
It is the first wastewater monitoring technology that can directly detect heavy metal pollution
peaks in fat-emulsion loaded wastewater streams entering the treatment technnology.
The measuring process runs with air as discharge gas, no mineralization or other special
reagents used except acidification by HCl to pH 1.6-1.7, requires 5-10 mL/min sample flow during
measurement.
The main features of include:
- accepts untreated wastewater compositions
- applies an innovative self cleaning rotating slit filter for particle size cutting at 200-300 m10
- work with open surface flow through measuring cell
- measures Cd (range of 0.1 - 10 mg/dm3), Zn, Cu, Ni and Pb (range of 1 - 100 mg/dm3)
- optional metal channels: Fe, Mn, Co, Pd, Ag, Ca, Mg, Na, K
- measurement ranges cover the values from the permitted discharge concentration to 10-20x
of that value (pollution peak detection)
- measurement frequency is automatically adapting to the pollution event detection: the higher
the observed concentration the higher the sampling frequency ranging from 2 to 6
sampling/hour
A metal monitor is highly relevant to decrease the risk of contamination from wastewater to
sludge as wastewater management companies focus much of their business on sludge recycling. Costs
for regulatory compliance for industrial sludge EU-wide ranges from 0.1 billion euros/year to 0.2
billion euros per year 11
. On first place the reduction of such costs could be facilitated by the proper
detection of contamination at the industrial source, reducing the possibilities of heavy metals entering
the sewerage system. On the second place the detecting of the heavy metal pollution peak in the
incoming water stream at the municipal treatment plant with metal monitor, different treatment route
can be applied to the polluted wastewater body of 100-1000 m3 volume.
4
The core development
The most widespread method for determination of metal concentrations in wastewater
is grab sampling and subsequent laboratory analysis. This method is both costly, which limits
its frequent application, and slow as typically involves a 24 hour turnaround time, which
means that pollution events can be missed, or detected too late. In the face of increasing levels
of sludge production, the expected application of more stringent limits on heavy metal
concentrations in sludge, and the need to identify, survey and control the sources of input of
toxic elements, there is a need for an on-line instrument to detect heavy metal pollution events
in wastewater in real-time: both at the inlet flow to wastewater treatment plants, and at the
source of potential discharges.
Laboratory multi-metal analytical methods based on a 24-48 hour automatic sampler
are not applicable at the 1,500 sample / month throughput (min 50 sample / day) required for
the effective monitoring of the municipal sewer stream at the inlet of the treatment plant. This
problem can only be solved by a proper analytical monitoring technique with analysis
performed at every 30 minutes. However, no such metal monitor is available for the analysis
of mixed domestic and industrial wastewaters. Due to the high load of FOG emulsion (FOG =
Fat, Oil & Grease) and suspended solids, in the range of 100-1000 mg/L, these waters can not
be analyzed directly by the well known and high performance laboratory methods (ICP,
electrochemical methods).
It must be emphasized that at the usual 7-8 pH value of domestic wastewaters, heavy
metals are mostly in the suspended solid fraction as hydroxides, sulfides and carbonates, or
partly complexed and bonded to the suspended organic particles. Since the well known and
widely used water quality monitoring methods like electrochemical sensors and colorimetric
cells can accept only FOG-free samples with ionic metal forms, sophisticated and expensive
sample treatment (including mineralization) procedures are required to achieve reliable
operation over 1-5 consecutive measurements.
The historical starting point in the field of electroanalytic methods is polarography
(Heyrovsky 1953, Nobel-prize), with the subsequent arrival of derived solid-electrode
methods (voltammetry). In favourable cases the selectivity of these methods may make it
possible to detect 4-5 metal components simultaneously present in the sample. With the so-
called anodic stripping method 12
, an electrochemical pre-concentration is introduced into the
measurement process, and for certain metals the limit of detection reaches the absolute value
of one microgram. However, in spite of the advantage of high sensitivity, this method has
serious drawbacks. One of these is that complexing agents can disturb, or in certain cases
even block measurements. Thus, organic materials of natural origin and organics introduced
with communal-industrial effluents cause strong interferences.
The technology of ion-selective electrode sensors [Di Natale et al., "Multicomponent
analysis of heavy metal cations and inorganic anions in liquids by a non-selective
chalcogenide glass sensor array", Sensors and actuators. B, Chemical (Sens. actuators, B
Chem.) ISSN 0925-4005], introduced in the 1960's, is also a part of the group of
electroanalytical methods. This technology is based on measuring the interfacial potential,
which requires a very simple sensor system with a small-sized measurement cell and low
energy demand. However, market success of the technology is seriously hampered by the

5
narrow range of available sensors. Stable and sensitive sensors have been developed only for
a few simple anions and a few cations. It is also of note that electrodes can only
detect non-complexed or aqua-complex ions, which usually represent a tiny fraction in
practical samples. Only pH, pCN, pCl and pNH3 measurements have industrial and
environmental-monitor applications. The development of sensors based on this technology
has come to a standstill, because, although the range of measurable ions widened with the
introduction of the latest innovation (liquid ion exchange membranes), the interferences
caused by organic materials contained in the samples increased by multiple orders of
magnitude. The latter effect may reduce sensor life to 1-5 days, after which the sensor
membrane and the internal electrolyte system has to be replaced. Development possibilities
are limited by the fact that a different sensor and different sample conditioning techniques
must be used for the measurement of practically every ion type. Thus, the application of
ion-selective sensors for the purposes of wastewater analytics remains limited.
Measurement technologies based on atomic emission and absorption are characterised
by the extremely high selectivity of spectrometry, with capability of the simultaneous
detection of 10-50 elements. High-sensitivity laboratory methods (AAS, ICP) [Kathryn L.
Linge, "Trace Element Determination by ICP-AES and ICP-MS: Developments and
Applications Reported During 2004 and 2005", Geostandards and Geoanalytical Research 30
(3), 157-174] can be successfully applied for measuring concentration values below ppm
level, but they require thorough sample preparation. In most cases, the sample has to be
colloid-filtered and heavily acidified. It has to be underlined that the sample solution can only
be introduced into the measurement cell by utilizing some type of liquid nebulization
technology (pneumatic, electrospray, ultrasonic, etc.) In addition, these instruments require
bottled gases (AAS: acetylene and occasionally oxygen) or inert gas supply (ICP: argon, 10
l/min!) for their operation. Due to the applied 1-3 kW high-frequency excitation unit, ICP has
very significant power demand. Graphite furnace atomic absorption spectroscopy (GF-AAS)
is a powerful technique suitable for trace analysis. The technique has high sensitivity (analyte
amounts 10-8-10-11 g absolute), the ability to handle micro samples (5-100 #l), and a low
noise level from the furnace. Matrix effects from components in the sample other than the
analyte are more severe in this technique compared to flame-AAS. The precision is typically
(5-10) % using GF-AAS. The technique is prone to some interferences such as background
absorption and non-spectral interference.
These sophiticated instrumental analytical methods require thorough sample treatment, which
means that the sample has to be measured in a (usually strongly acidic) solution, with high
buffer capacity and high supporting electrolyte concentration. The need for the above-
mentioned techniques makes it impossible to utilize the method for monitoring purposes, due
to its high complexity and high reagent consumption.
However outstanding the sensitivity and selectivity values are, these advantages are eclipsed
by the complex construction and the complicatedness of sample insertion. High energy
consumption and the instrument's dimensions are common disadvantages in a monitoring
application.
Requirements for a new measurement technique
Effective checking of heavy metal pollution transmission and emission in the municipal
sewerage system required fundamental research work to be done to develop new analytical
method which is able to accept such heavily polluted samples, with as little pre-treatment as
possible. Also it is advisable to construct a detecting method which is capable of monitoring

6
around and above the limit values - when it detects a pollution peak of value of 2-50 times the
limit; it can trigger a regular sampler device for the standard laboratory measurement.
Furthermore, a device with flow-through system and continuous sampling is required.
Therefore the basic features of the new analytical method in the project have been set at:
Voltammetric methods
- electrodes are in contact with the sample
- measures only certain metal forms
- detection limit from 1 μg/L
- multi-metal measurement without special reagents
- fine filtering required
- does not accept fat emulsion loaded sample
- low power consumption
- approx. 2 measurements/ hour
ICP-AES
- no sensor surface in contact with the sample
- measures all metal forms
- detection from 1 mg /L
- multi-metal measurement
- fine filtering required
- does not accept fat emulsion loaded sample
- significant power consumption
- approx. 10 measurements/ hour
METAL MONITOR
- no sensor surface or optical window in contact with the sample
- measures all ionic and complexed metal forms without mineralization
- measuring ranges approximately 0.1/0.2/0.3 - 10 - 100 mg/L
- multi-metal measurement without special reagents
- no fine filtering required (below 0.2-0.3 mm)
- wide bore measuring cell against clogging
- accepts fat emulsion loaded sample
- low power consumption
- 1-5 measurements/hour

7
The new measuring principle of waste water monitoring for heavy metals
The revolutionary new approach in the direct wastewater analysis has been the application of
the cathode sputtering effect and optical emission analysis through a direct current
atmospheric glow discharge running directly on the electrolyte sample as cathode (Fig.1).
Fig.1 The scheme of the electrolyte cathode discharge
Electrolyte = sample solution
Glow discharge is the electrical discharge with no thermal electron emission from the cathode
(cold cathode discharge). Cathode sputtering is a phenomenon whereby energetic positive
ions hit the cathode surface with 50-500 eV kinetic energy, destroy the surface structure and
produce atoms, ions, clusters and electrons leaving the solution surface.
The cathode sputtering process is the base of the widely used low pressure glow discharge
optical spectrometry for surface layer analysis of solid samples. It works in 1-3 kPa of rare
gas atmosphere that is not applicable to liquid analysis.
The discovery of the proper conditions for the atomic emission of the dissolved and sputtered
GD plasma
electrolyte
Metal anode
Glow discharge
with
metal anode +
electrolyte cathode
Metal cathode

8
components of the aqueous solution cathode has led to a new direct water analytical method
based on the atom-spectrometry of the emitted light of the atmospheric glow plasma (ELCAD
plasma = Electrolyte Cathode Atmospheric Discharge plasma). Given that, in electrolyte
solutions, the average matrix bonding energy for dissolved components is much lower than in
solid phases, the sputtering energy can be set to a low level, that is, the discharge pressure can
be atmospheric, which is also very preferable for the water sample.
As a consequence of the above conditions, all the dissolved components (including any
complexes) are sputtered while the suspended components are not. The sputtered components
are destroyed down to the atomic level and the metal ions are partly neutralized in the
discharge plasma by free electrons at thermal energy level; these then receive excitation
energies from the high energy electrons near to the cathode. Some relatively stable molecular
components like OH, N2, NH, are also excited and produce molecular band emissions. The
resulted optical emission spectrum is very simple and contains only the basic atomic lines of
the metals and background molecular emissions from the water matrix and the air atmosphere.
The plasma forms a 3-5 mm high conical shaped discharge at 60-100 mA DC current, and sits
on the electrolyte sample surface if a W anode is placed above the surface at 3-5 mm distance
and 1000 V is applied between the anode and the water sample grounded by an auxiliary
electrode (Fig.2). The actual burning voltage is 700-900 V, therefore the plasma dissipates
only 70-80 Watts.
Fig. 2 Internal structure of the electrolyte cathode glow discharge
(inverted black&white picture)

9
Due to the unique arrangement, the plasma receives only the cathode-sputtered components;
therefore it is virtually not disturbed by the non-sputtered components, such as suspended
solids and emulsions. To maintain the discharge, a certain electrical conductivity level is
required in the solution. The best way to set it is the acidification of the sample by HCl (or
any other strong acid) which produces a further advantageous effect by dissolving the metals
from the suspended particles. Optimal pH for the plasma is around 1.6.
The atmospheric electrolyte cathode discharge plasma has a 5-7000 Kº electron temperature
(electron impact excitations) and a 3-7000 Kº gas temperature, so the water sample has to
flow through the cell with approximately 5-10 ml/min to avoid boiling. The basic structure of
the electrolyte cathode system having open electrolyte surface for the discharge is shown in
Fig.3.
Fig.3 Scheme of the overflow system of the electrolyte cathode

10
Even the best hydraulic arrangement of the electrolyte cathode system requires further effort
to decrease the surface instabilities beneath the plasma cone. Also, experiments with real
municipal sewerage water samples having composition dominated by domestic waste waters
show that the acidification required by the discharge process, in turn it breaks the stability of
the FOG emulsions in the sample. This process causes fast buil-up of deposits within the
tubings and in the sensitive area of the cathode flowing system.
We found that applying a certain level of detergent addition ensures smooth flow and stable
water surface in the cathode vessel. Also this detergent level keeps the emulsions in colloidal
form. Excess level of the added detergent, however, causes foaming in the cathode
compartment, therefore an upper dosing limit should be set.
As the analytical (= treated) sample is already acidified, the most convenient way of the
detergent addition is to combine it with the acid solution in the pH controller unit. It simple
means that the strong acid and the detergent is prepared into the single mixture solution dosed
to the sample stream (Fig.4).
Fig.4 Scheme of the treatment process to produce analytical sample stream
from the raw water sample

11
Fig.5 The scheme of the internal arrangement of the monitor

12
Field test at Bohumin Steel Works
The field test was carried out between 13 and 16 July 2010 at the Wastewater Treatment
Plant at Bohumin Steel Works (ZDB), Bohumin, Czech Republic.
Fig. 6 The location and environment of the ZDB Plant at Bohumin (Czech Republic)
Fig. 7 Scheme of the ZDB Wastewater treatment technology and the location of the
metal monitor
pH
controller
NaOH
HCl
A D C B
Metal
monitor
sludge
to
press
filtering
flocculant
dosing
Q

13
where A: inlet pumping basin with screen filter (dmax ~ 20 mm) and oil
detector
B: inlet head-press basin
C: flocculation & aeration basin
D: settling basin
Q: flow rate 4-6 m3/min
The pH controller keeps an approximately neutral water in the B basin, at which position the
metal monitor is operating.
RAW WATER SAMPLING UNIT
The wastewaster monitors have to determinate the total amount of the polluting
component concentration carried by the dissolved fraction and by the fine suspended matter in
the fluid sample. To achieve this goal these instruments require such sample which contains
only the size fraction of <0.3 mm of the suspended matter. The chemical reason is that the
heavy metals are mostly precipitated into the fine fraction of the suspended matter in
wastewaters, therefore the total filtration of the sample must be avoided to perform reliable
analysis.
The undissolved components of a raw wastewater sample can be sorted into the
following 3 fractions: a colloids, b fine suspended matter with particle size below 0.3 mm,
c coarse supended and fibrous matters.
In order to avoid the clogging of the tubings and the measuring cell itself, the entering
of the fraction c into the measuring system has to be blocked. At the same time the fractions
a and b which contain the polluting components (for example Zn, Cd, Cu, Ni, Pb ) have to
reach the measuring system. The fundamental points of long-term and reliable operation of
the water analyzer monitors are that the sample treating process should not remove the fine
fraction of the suspended matter and the sample components should not damage the
measuring system.
The fraction b usually contains inorganic particles, in wastewaters these are mostly
fine quarz crystal particles. These generate abrasive effects and in long-term operation they
damage certain parts of the measuring system, like pumps, valves, stirrers and the optical
windows contacting the sample stream. To avoid the excessive wearing in the analysers (to
ensure the long-term reliability of the monitor operation) these abrasive particles should be
removed from the fraction b during the sampling or sample treating steps.
The characteristic sample amount required by the analytical processes for a
measurement are relatively small, 1-50 cm3 volume or 1-50 cm
3/min flow rate.
In case of fluids the removal of the suspended matter is based on one of the following
methods:
1. sedimentation aided by coagulation and flocculation, for example surface water
clarification, economic only for technologies of high production rate, removes 90-
95% of the fraction b
2. filtration (deep filtration in thick filter bed, surface filtration on filter layer)

14
3. centrifugation (economically applicable only at high concentrations and in case of
particles of higher specific densities)
Due to economic and maintenance requirement consideration, the filtration is the
generally used method in the sample treating units of the analytical monitors as this method
can apply cheap and dispensable filter matters.
The surface-filtration is possible on filtering layers with definit porus geometry which
excludes the filtered materials from entering the particles into the bulk filter material. Since
the filtered particles are collected on the surface of the filter layer, these can be removed by
some physical/mechanical method to clean the filter. For example the surface filters can be
continuously self-cleaned by a strong tangential flow of the fluid along the active side of the
filter layer (so called tangential flow filtration or crossflow filtration).
One of the most widely used filtration technique in monitors is the filter head with
moving filter strip (for example PROTOC WEB, PPM Ltd, GB). A filter paper strip of 25 mm
width from a feeding roller is stepped through upon the underwater smooth filter manifold
surface which has a suction hole connected to the filter pump. One position of the filter paper
strip can be used to produce 1-10 cm3 filtrate then the strip is stepped to replace the used
section with a new section at the filtrating position. The advantage of this technique is its
simple mechanical structure and the high and reliable filtration efficiency. Considering the
analysis of the fine fraction of the suspended matter in water sample, the method removes
most of the fraction b.
The SKALAR On-line Filtration System (Skalar Analytical B.V., Breda, The
Netherlands) is an aggregated filtermembrane tube system with strong tangential flow.
Additional cleaning is applied by a backflow stream chemical washing in the dual channel
equipment (one channel is operating while the other is under regeneration). Production rate is
1 dm3/min at 2.5 bar pressure difference on the filter membrane. This filter system removes
all suspended and colloidal components from the water sample.
The WTW PurCon ( WTW Wissenschaftlich-Technische Werkstätten GmbH,
Weilheim, D) also removes all particles (including bacteria) by a membrane filter and
produces 3,6 dm3/h clear filtrate for monitors.
The fine filtering unit developed by the Endress+Hauser (Endress+Hauser Instruments
International AG, Reinach, Switzerland) for the TOCII CA72TOC total organic carbon
monitor is a rotating slit filter system and belongs to the surface filtration method. The
rotating slit is between a vertically positioned stainless steel cylinder rotor (d= 5 mm) and a
stainless steel sleeve in the stator body. The slit of cylindrical shape is 100 micrometer wide
and performs a good particle size separation which allows the organic fine suspendede matter
to reach the measuring cell. The rotor with 50-60 rev/min helps the continuous removal of the
exluded particles by the sample flow. A great disadvantage of this system is that the abrasive
particles of less than 100 micrometer reach the toe bearing of the axial shaft rotor. Because
this part can not be protected in this system, the lifetime of the filtration unit is seriously
limited and requires frequent replacement to keep the monitor performance.

15
In general the surface filters can not separate the quartz particles within the fraction b
particles, furthermore, this fraction is usually removed from the water sample (membrane
filters).
The invention applied here is an apparatus for fluid filtration which overcomes the
disadvantages of the known techniques regarding no separation performance on the fine
fraction of the suspended matter against the quartz or other (heavy) abrasive particles, by
offering an extra separation effect for the abrasive (heavy) particles from the <0.3 mm particle
fraction required by the wastewater monitors for total organic carbon or heavy metal
pollution.
The overall scheme is shown in Fig.8. A vessel of PE (25 dm3) equipped with PVC
inlet-outlet ports, and a sampling port which accepts the so called Continuous Slit Filter
(CSF) unit on the top. It is designed for representative sampling of the raw wastewater by
removing all suspended matters above 0.2-0.3 mm and most of the abrasive sand particles
below 0.3 mm size. A further important factor of the design is the high chemical resistance of
the applied materials against the corrosive and abrasive components coming with the raw
water (acids, oil, suspended matters). The proprietary filter unit operates with a new cross-
flow filtration principle which provides a simple and effective self-cleaning of the filtering
surface10
.
Fig. 8 Scheme of the arrangement of the raw water sampling of the metal monitor
CSF : proprietary slit filter unit
V: valve for stopping the raw sampling line without draining the vessel (checking
procedure wiht standard addition)
V
Slit-
filtered
sample
sucked
by the
monitor
pump
~ 10
ml/min
Submerged
pump in
raw water
inlet basin
(continuous
operation)
~20-50
L/min
SV1
SV2
CSF

16
SV1: solenoid valve for air inlet (cleaning procedure at the end of the measurement
cycle)
SV2: solenoid valve for auxiliary sampling (control samples for laboratory)
The combined operation timing of the monitor and the sampling unit can be seen in Fig.9.
Fig. 9 Timing control of the operation of the sampling unit
The measurement cycle starts both the monitor and the sampler unit. To replenish the water
content in the sampling lines and the fluid system of the monitor 4 minutes of flushing time is
set. After this step the glow discharge plasma is ignited and 3 minutes is set to allow the
discharge cell to reach the operation temperature then the spectrometric measurement is
running for 3 munites. While the monitor operation is stopped, the CSF is running for one
minute with applying the purging air to the filter head.
Details of the experimental setup of the sampling system of the metal pollution monitor are
shown in the following pictures.
Monitor operation
SV1 operation
(air purging of filter)
CSF operation

17
a
b
Fig. 10 Installation of the sampling unit at the basin B shown in
Fig.7
a: tubings between the submerged sampling pump and the raw
sample vessel
b: tubings connected to the raw sample vessel
pH
sensor
basin
overflow
edge
pumping
tubes for
metal
monitor
V
manual
control valve
raw
sample
vessel

18
Fig. 11 The sampling vessel at the basin B room
Fig. 12 The metal monitor at the basin B room
CSF unit
raw
sample
inlet
raw
sample
outflow
sampling
valve
SV2
sample
line
raw
sample
vessel
raw
sampling
controller
Metal
Monitor
sample
line

19
Total record of field testing procedure
Measuring frequency: ~ 3.5 measurements / hour
Metals investigated: Zn this metal is always present in tap water systems as a product of
dissolution of corrosion protecting layer applied for carbon steel
pipes
the Zn measurement is a practical tool for validation of the
operation of the instrument: when the measured Zn content is
substantially lower than the average background value (usually
0.5 – 2 ppm) or even zero, then there are measurement
problems
Cd (this metal has zero background concentration in tap water based
technology waters)
Testing Bohumin / OSTRAVA 1
0
100
200
300
400
500
600
700
10-06-13
12:00
10-06-14
00:00
10-06-14
12:00
10-06-15
00:00
10-06-15
12:00
10-06-16
00:00
10-06-16
12:00
10-06-17
00:00
Time, yy-mm-dd hh:mm
100 x
c, m
g/L
Fig. 13 The metal monitor record for Zn and Cd
Zn
Cd
~ 5 mg / L
standard
addition to
raw sample
vessel
20
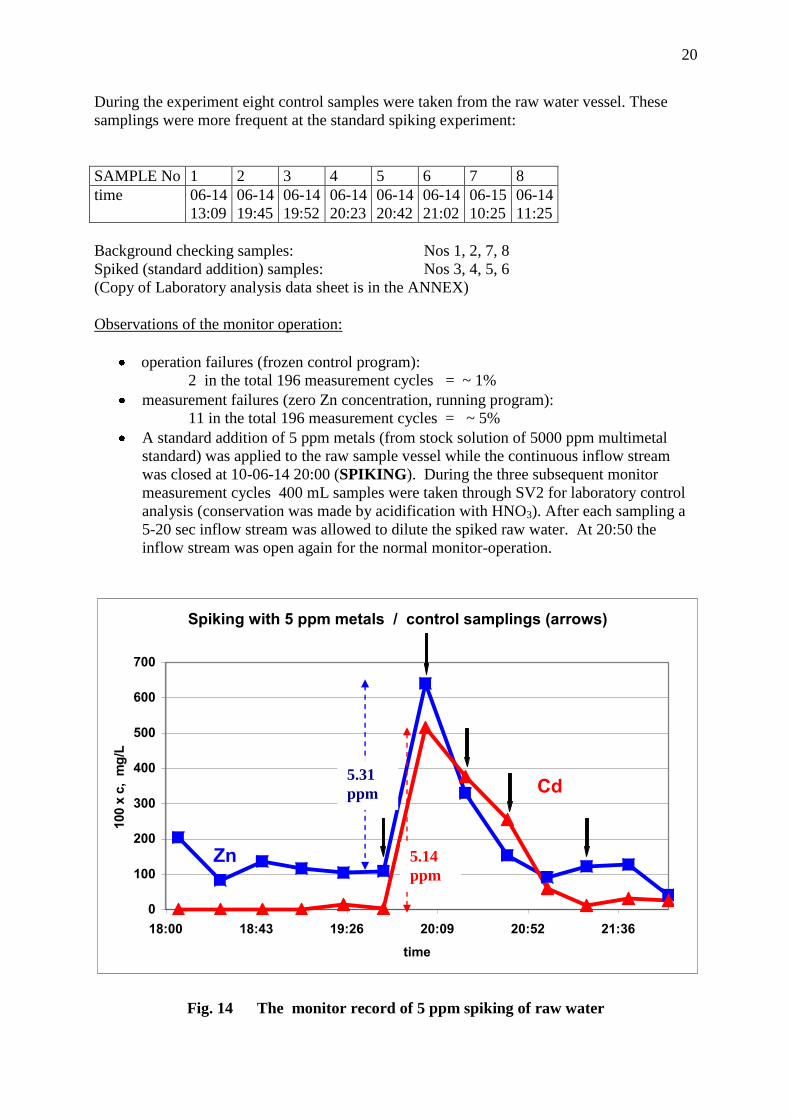
During the experiment eight control samples were taken from the raw water vessel. These
samplings were more frequent at the standard spiking experiment:
SAMPLE No 1 2 3 4 5 6 7 8
time 06-14
13:09
06-14
19:45
06-14
19:52
06-14
20:23
06-14
20:42
06-14
21:02
06-15
10:25
06-14
11:25
Background checking samples: Nos 1, 2, 7, 8
Spiked (standard addition) samples: Nos 3, 4, 5, 6
(Copy of Laboratory analysis data sheet is in the ANNEX)
Observations of the monitor operation:
operation failures (frozen control program):
2 in the total 196 measurement cycles = ~ 1%
measurement failures (zero Zn concentration, running program):
11 in the total 196 measurement cycles = ~ 5%
A standard addition of 5 ppm metals (from stock solution of 5000 ppm multimetal
standard) was applied to the raw sample vessel while the continuous inflow stream
was closed at 10-06-14 20:00 (SPIKING). During the three subsequent monitor
measurement cycles 400 mL samples were taken through SV2 for laboratory control
analysis (conservation was made by acidification with HNO3). After each sampling a
5-20 sec inflow stream was allowed to dilute the spiked raw water. At 20:50 the
inflow stream was open again for the normal monitor-operation.
Fig. 14 The monitor record of 5 ppm spiking of raw water
Spiking with 5 ppm metals / control samplings (arrows)
0
100
200
300
400
500
600
700
18:00 18:43 19:26 20:09 20:52 21:36
time
100 x
c, m
g/L
Zn
Cd5.31
ppm
5.14
ppm

21
This internal calibration by the standard addition step returned the following recovery ratios
calculated from the monitor readings:
Zn 5.31 ppm / 5 ppm => 106 %
Cd 5.14 ppm / 5 ppm = > 103 %
The laboratory analysis results of the indicated control samples gave the following functions:
Fig. 15 The correlation diagram for Zn
Fig. 16 The correlation diagram for Cd
y = 1,5524x - 30,38R² = 0,9743
-200
-100
0
100
200
300
400
500
600
700
-100 0 100 200 300 400 500
Mo
nit
or
read
ing
s,
100xp
pm
Lab analysis, 100xppm
OSTRAVA TEST1 Zn

22
The linear correlation factor between the laboratory data and the monitor data is over 95% in
both case, while the tangent alpha results higher recovery values than the values received with
the standard addition calibration:
Zn tg alpha = 1.55 => 155%
Cd tg alpha = 1.17 => 117 %
The difference is coming from the fact that for standard addition spiked samples the
laboratory analysis gave lower contentration than the calculated ones from the standard
addition.
The disassembled CSF unit at the end of the testing period shows no external and internal
defects (Fig. 17).
y = 1,1671x - 10,463R² = 0,9765
-100
0
100
200
300
400
500
600
0 100 200 300 400 500
mo
nit
or
re
ad
ing
s, 1
00
x p
pm
Lab analysis, 100 x ppm
OSTRAVA TEST1 Cd

23
a
b
Fig. 17 Inspection pictures of the CSF unit after the experiment
a: CSF unit as pulled out from the raw water vessel
b: a close-up picture of the filter head showing no sludge deposition
on the surface of the filter
EVALUATION
The overall pollution peak detection is excellent
Calibration is good against standard addition, fair against lab analysis, computation
factor should be adjusted
Acknowledgement
This work was supported under the DERI-EUROSTARS-07-1-2008-0017 Grant
(GreenWWater).
rotating
filter sheets
rotor

24
ANNEX
Laboratory data sheet of analytical results from the Accredited Analytical Laboratory of ZDB,
(Ostrava,CZ).
Method abbreviations: AAS-ETA = Atomic Absorption Spectrometry with
Electrothermal Atomization, OES-ICP = Optical Emission Spectrometry with Inductively
Coupled Plasma

25
References
1 Water Technologies Press Release.
Siemens: Water as a raw material is a location factor in Europe: Water reclamation and water cycle
management strengthen competitive edge. 3rd Press Conference Infrastructure Water Technology
Europe. Berlin 2006-05-09 2 Freshwater. GEO-2000. Global Environment Outlook.
United Nations Environment Programme
3 Heavy metal pollution and human biotoxic effects by Duruibe, J. O., et.al.,
International Journal of Physical Sciences Vol. 2 (5), pp. 112-118, May, 2007
4 Heavy Metals in Waste. Final Report. European Commission DG ENV. E3 Project
ENV.E.3/ETU/2000/0058. February 2002 5 Europe's water law: stronghold against commercialisation.
European Public Health Alliance. Update 67 (2003) 6 WISE Newsletter. The Bulletin of the Water Information System for Europe, Issue No. 5,
June 2007
7 T. Cserfalvi, P. Mezei, P. Apai, J. Phys. D, 26, 2184 (1993)
8T. Cserfalvi, Magyar Kemikusok Lapja, 52, 502-507 (1997) (in Hung)
9 Development of a Cost Effective, Low-Maintenance, On-Line Instrument to Detect
Heavy Metal Concentrations in Wastewaters DERI-EUROSTARS-07-1-2008-0017
10 Equipment for filtering of liquid sample, Hung. Patent application Nr. P 1100411,
(PCT application is pending) 11
Disposal and Recycling Routes for Sewage Sludge
Synthesis Report (2002), European Commission 12
S.Daniele, I. Ciani, C. Bragato and M.A. Baldo, "Detection of heavy metals released at the
sediment/water interface by combining Anodic Stripping Voltammetry (ASV) and
Scanning Electrochemical Microscopy (SECM) measurements" J. Phys. IV France,
107 (2003) 353


![Gruiz Katalin [Kompatibilit si m d]enfo.agt.bme.hu/drupal/sites/default/files/Gruiz KORINFO bemutatas… · Feln ıtt anya (1.8 mm) Feln ıtt anya (2.0 mm). tojásokkal Feln ıtt](https://img.pdfslide.net/doc/110x75/5f103d9c7e708231d4482248/gruiz-katalin-kompatibilit-si-m-denfoagtbmehudrupalsitesdefaultfilesgruiz.jpg)