Embed Size (px)
Citation preview
DEVELOPMENT AND IMPLEMENTATION OF A PGE MINERAL ASSET VALUATION CURVE 353
IntroductionCommodity prices are cyclical. When commodity prices, inreal terms, follow a prolonged rising trend for close to adecade or more, that trend is called a commodity pricesuper cycle. The trend is generally driven by theurbanization and industrialization of a major economy.Heap (2005) noted that there have been two commodityprice super cycles in the last 150 years and a third has beenunderway post-2000. The first was in the late 1800s to early1900s, driven by the economic growth in the USA; thesecond was in the period 1945 to 1975, prompted by post-war reconstruction in Europe and later by Japan’s massiveeconomic renaissance; and the third is being driven bymaterials intensive economic growth in China. The globaleconomic recession, however, that started in 2008 forcedcommodity prices to fall drastically, temporarily retardingthe super cycle. Platinum, for example, as reported byJohnson and Matthey (2009), which had risen from a low ofabout USD840/oz in 2005 to an all time high ofUSD2276/oz in March 2008 (equivalent to USD1987/oz in2005 real terms) declined to below USD800/oz in
December 2008 (equivalent to USD698/oz in 2005 realterms). It has been gradually picking up since then to thecurrent levels of about USD1 500/oz.
These changes indicate periods of ‘boom’ or ‘bust’ in theminerals industry. During boom periods many mineralprojects are brought on stream and amalgamations areinitiated because of the feeling that the boom will last. In‘bust’ periods most companies will downsize to cut back oncosts and those that fail to contain costs become possibletargets of takeovers. In boom periods mineral assets arevalued for board approval of funding or possibleamalgamation, whereas in bust periods mineral assets arevalued for possible takeovers. In both circumstances MAVsare required whether it is from the buying side or sellingside and hence valuation tools, such as the PGE valuationcurve, become vital for benchmarking and project valuecomparison.
There are three broad categories of generally acceptedapproaches to MAV namely, income, market and costapproaches. It is acknowledged that mineral assetsincorporate more uniquely distinguishable factors such as
NJOWA, G., MUSINGWINI, C. and CLAY, A. Development and implementation of a PGE mineral asset valuation curve. The 4th International PlatinumConference, Platinum in transition ‘Boom or Bust’, The Southern African Institute of Mining and Metallurgy, 2010.
Development and implementation of a PGE mineral assetvaluation curve
G. NJOWA*, C. MUSINGWINI†, and A. CLAY**Venmyn Rand
†School of Mining Engineering, University of Witwatersrand
Mineral assets are valued for transactional, insurance or funding purposes during ‘boom’ or ‘bust’transition periods. There are three broad categories of generally accepted approaches to mineralasset valuations (MAVs) namely: income, market and cost approaches.
In this paper, we focus on the market approach, in which the competent valuator (CV) estimatesthe value of a mineral asset by reference to market data on transactions involving similar orcomparable mineral assets. In the platinum group elements (PGE) industry, Venmyn has overrecent years developed a PGE mineral asset valuation curve (valuation curve) for use as a toolwhen conducting MAVs of PGE mineral assets, which takes into account the general individualcharacteristics of each mineral asset.
The PGE mineral asset valuation curve (PGE valuation curve) was developed based upon thecomparative value per unit of attributable PGE ounces. It largely uses transaction-based monetaryvalues and market capitalization per ounce established on the principle of ‘willing buyer, willingseller’ which requires that the amount obtainable from the sale of an asset should be determined asif the transaction was an arm’s length transaction. The curve is compiled and regularly updatedfrom a comprehensive database of relatively recent transactions of PGE mineral assets and currentmarket capitalization of PGE projects. The PGE mineral assets are valued in monetary value perunit of resource ounce (USD/oz) and sorted according to the development stage of the project,linked to the mineral resource and mineral reserve categories, as defined by the SAMREC Code.
This valuation curve has been successfully used over the past few years to value PGE mineralassets on a directly comparable basis. Importantly, the curve can be used to plot comparativeresults for the income and cost approaches to assess how those values relate to each other. This isparticularly important as it can be used to void a method that appears to generate very low or highvalues that seem to be outliers.
Keywords: market approach; PGE mineral asset valuation curve; monetary value per unit ofresource ounce; SAMREC Code; commodity price super cycle.
PLATINUM IN TRANSITION ‘BOOM OR BUST’354
location, geology, mineralization, reef type, stage ofdevelopment, infrastructure already in place andexploration costs incurred. However, the global mineralsindustry has worked hard in the past 10 years to develop acommon set of compliance and mineral asset reportingcodes to ensure that all mineral assets are reported on aseemingly consistent basis. To this end, the Committee forMineral Reserves and International Reporting Standards(CRIRSCO), as the global mining standards umbrella bodyhas worked under the United Nations to align the reportingstandards with the oil and gas industries, mainlyrepresented by the Society for Petroleum Engineers (SPE).The International Accounting Standards Board (IASB) hasinitiated a project aimed at having a common and consistentmineral asset reporting process through an accountingstandard for the extractive industries so that valuations canbe used as a ‘reliable measure’ for accounting purposes.The CRIRSCO codes should facilitate the basis for thisproject. However, because of the idiosyncrasies ofindividual mineral assets, some levels of uncertainty willcontinue to exist in the value estimations of mineral assets.
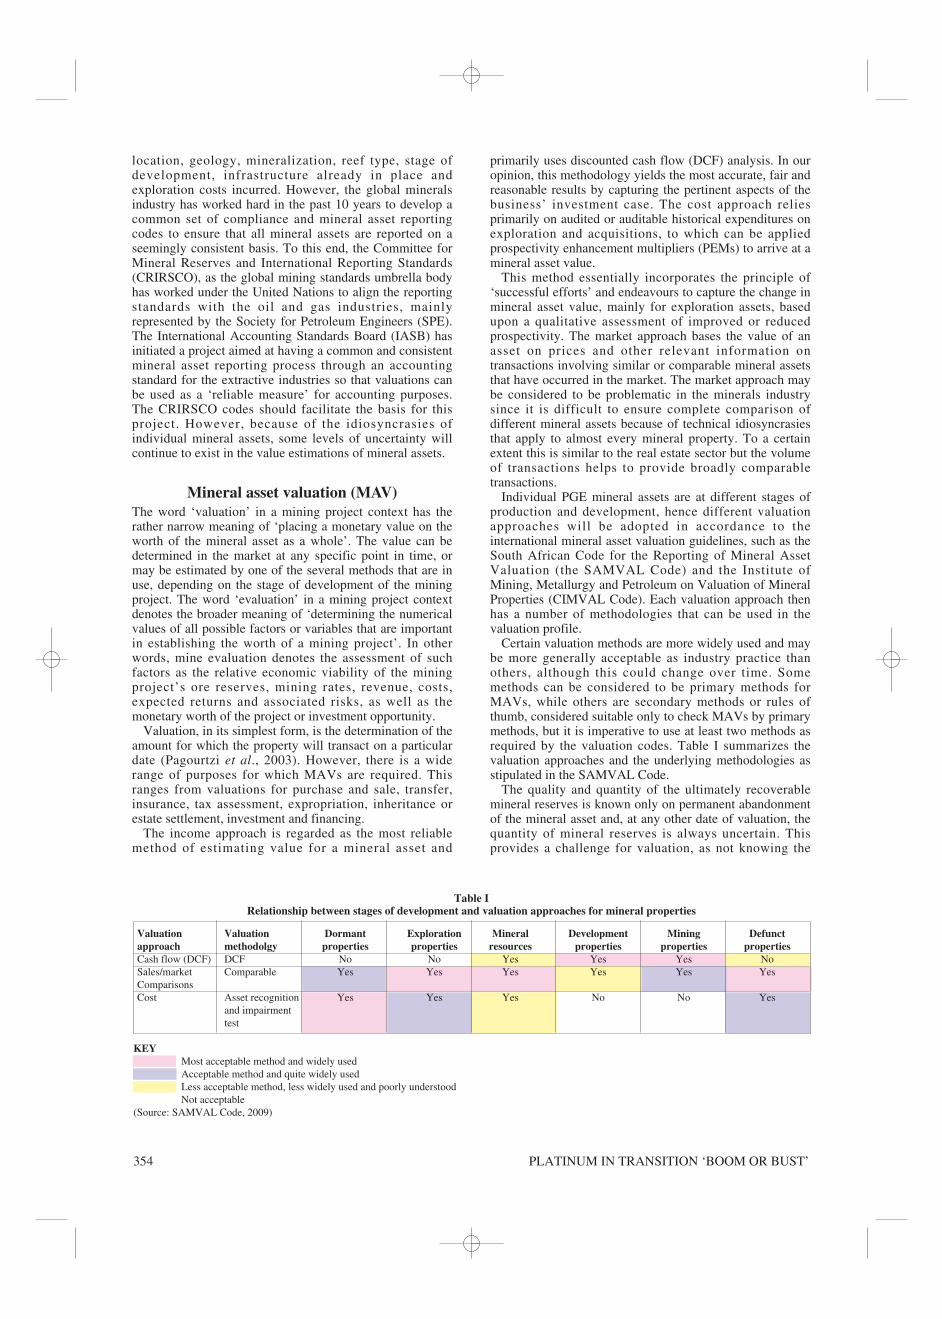
Mineral asset valuation (MAV)The word ‘valuation’ in a mining project context has therather narrow meaning of ‘placing a monetary value on theworth of the mineral asset as a whole’. The value can bedetermined in the market at any specific point in time, ormay be estimated by one of the several methods that are inuse, depending on the stage of development of the miningproject. The word ‘evaluation’ in a mining project contextdenotes the broader meaning of ‘determining the numericalvalues of all possible factors or variables that are importantin establishing the worth of a mining project’. In otherwords, mine evaluation denotes the assessment of suchfactors as the relative economic viability of the miningproject’s ore reserves, mining rates, revenue, costs,expected returns and associated risks, as well as themonetary worth of the project or investment opportunity.
Valuation, in its simplest form, is the determination of theamount for which the property will transact on a particulardate (Pagourtzi et al., 2003). However, there is a widerange of purposes for which MAVs are required. Thisranges from valuations for purchase and sale, transfer,insurance, tax assessment, expropriation, inheritance orestate settlement, investment and financing.
The income approach is regarded as the most reliablemethod of estimating value for a mineral asset and
primarily uses discounted cash flow (DCF) analysis. In ouropinion, this methodology yields the most accurate, fair andreasonable results by capturing the pertinent aspects of thebusiness’ investment case. The cost approach reliesprimarily on audited or auditable historical expenditures onexploration and acquisitions, to which can be appliedprospectivity enhancement multipliers (PEMs) to arrive at amineral asset value.
This method essentially incorporates the principle of‘successful efforts’ and endeavours to capture the change inmineral asset value, mainly for exploration assets, basedupon a qualitative assessment of improved or reducedprospectivity. The market approach bases the value of anasset on prices and other relevant information ontransactions involving similar or comparable mineral assetsthat have occurred in the market. The market approach maybe considered to be problematic in the minerals industrysince it is difficult to ensure complete comparison ofdifferent mineral assets because of technical idiosyncrasiesthat apply to almost every mineral property. To a certainextent this is similar to the real estate sector but the volumeof transactions helps to provide broadly comparabletransactions.
Individual PGE mineral assets are at different stages ofproduction and development, hence different valuationapproaches will be adopted in accordance to theinternational mineral asset valuation guidelines, such as theSouth African Code for the Reporting of Mineral AssetValuation (the SAMVAL Code) and the Institute ofMining, Metallurgy and Petroleum on Valuation of MineralProperties (CIMVAL Code). Each valuation approach thenhas a number of methodologies that can be used in thevaluation profile.
Certain valuation methods are more widely used and maybe more generally acceptable as industry practice thanothers, although this could change over time. Somemethods can be considered to be primary methods forMAVs, while others are secondary methods or rules ofthumb, considered suitable only to check MAVs by primarymethods, but it is imperative to use at least two methods asrequired by the valuation codes. Table I summarizes thevaluation approaches and the underlying methodologies asstipulated in the SAMVAL Code.
The quality and quantity of the ultimately recoverablemineral reserves is known only on permanent abandonmentof the mineral asset and, at any other date of valuation, thequantity of mineral reserves is always uncertain. Thisprovides a challenge for valuation, as not knowing the
Table I Relationship between stages of development and valuation approaches for mineral properties
Valuation Valuation Dormant Exploration Mineral Development Mining Defunct approach methodolgy properties properties resources properties properties propertiesCash flow (DCF) DCF No No Yes Yes Yes NoSales/market Comparable Yes Yes Yes Yes Yes YesComparisonsCost Asset recognition Yes Yes Yes No No Yes
and impairment test
KEYMost acceptable method and widely usedAcceptable method and quite widely usedLess acceptable method, less widely used and poorly understoodNot acceptable
(Source: SAMVAL Code, 2009)

DEVELOPMENT AND IMPLEMENTATION OF A PGE MINERAL ASSET VALUATION CURVE 355
quantity of mineral reserves means that the productive lifeof the asset must be estimated with some degree ofuncertainty. The value of a mineral asset is, therefore,highly dependent on certainty in mineral resource andmineral reserve estimation. The uncertainty surrounding theestimate of extractable reserves is called reserve risk. Themining and petroleum industries each has its own reserveuncertainty classification systems. The mining industryclassifies the mineralized material into two broadcategories, namely mineral resources and mineral reserves,together with the subcategories, as shown in Figure 1.
Overview of the market approach in mineralasset valuation
Market value is defined by the International ValuationStandards Committee (IVSC) (2005) as ‘the estimatedamount for which a property should exchange on the dateof valuation between a willing buyer and willing seller inan arm’s length transaction after proper marketing whereinthe parties had each acted knowledgeably, prudently, andwithout compulsion’. The market approach was defined byIVSC (2003 p 420) as, ‘any approach to value based uponthe use of data that reflect market transactions andreasoning that corresponds to the thinking of marketparticipants. A general way of estimating a value indicationfor an asset using one or more methods that compare thesubject to similar assets that have been sold.’
The market approach in MAV encompasses all of themethodologies that rely on databases of historical mineralassets transactions (Lilford and Minnitt, 2005). Thesedatabases tabulate the prices at which all previous mineralasset transactions occurred. Such data provide a benchmarkagainst which current mineral asset information and pricescan be compared in order to estimate the value of themineral asset under question. The transactions includeacquisitions, disposals and mergers, in addition to themarket capitalization per ounce. This analysis has beenadjusted for cash and debt in the calculation of marketcapitalization per ounce in the form of enterprise value(EV). These transactions are assumed to have been ideallycompleted at arm’s length with the transacting parties beingunder no compulsion to transact.
The market approach may be considered to be fairlysubjective due to professional judgement that has to appliedwhen comparing the mineral asset to be valued and the pool
of mineral assets that have implied value from previoustransactions. In applying the market approach, CVs developan indication of value for the mineral asset that is beingvalued by comparing similar mineral assets and makingadjustments for the differences in the characteristics ofmineral assets that have been sold. It is difficult to ensuredirect comparisons of different mineral assets because oftechnical idiosyncrasies that apply to almost every mineralasset. The most appropriate approach to a valuationproblem would be the income approach. However, if thereare sufficient mineral asset transactions, these should beanalysed and included in the MAV report to establish areasonable range within which the value of the mineralasset should fall. However, some sales should not beconsidered because the transaction price may not beindicative of market value (MacCrate, 2010).
Comparative valuation of mineral projectsThe market approach is indispensable in valuingexploration projects, where there is limited information toperform a DCF analysis. Accordingly, Lilford and Minnitt(2005) argued that in the event that insufficient geologicaland techno-economic information is available on a mineralasset to perform a DCF analysis, the USD/ha or USD/ozmethod of valuation or equivalent can be considered. Fordevelopment and producing mineral assets, this method canprovide a benchmark when calculating the fundamentalvalue of the asset. Therefore, while comparable valuationneed not necessarily reveal an asset’s fundamental value, itintroduces discipline into the valuation process. Whereasthese values are indicative, they do provide a guideline as tothe magnitude of comparable values that have been paid, orare likely to be paid, for the exchange of in situ mineralresources and mineral reserves for PGE projects.
The PGE mineral asset valuation curvedevelopment process
In the PGE industry, Venmyn has over the years developeda PGE valuation curve for use when valuing PGE mineralassets, which takes into account the individualcharacteristics of each mineral asset. The valuation curve isused to determine the USD/oz value for mineral resourceand mineral reserve taking into account the PGE grade,depth of mining, infrastructure, other technical parametersand mineral resource classification confidence.
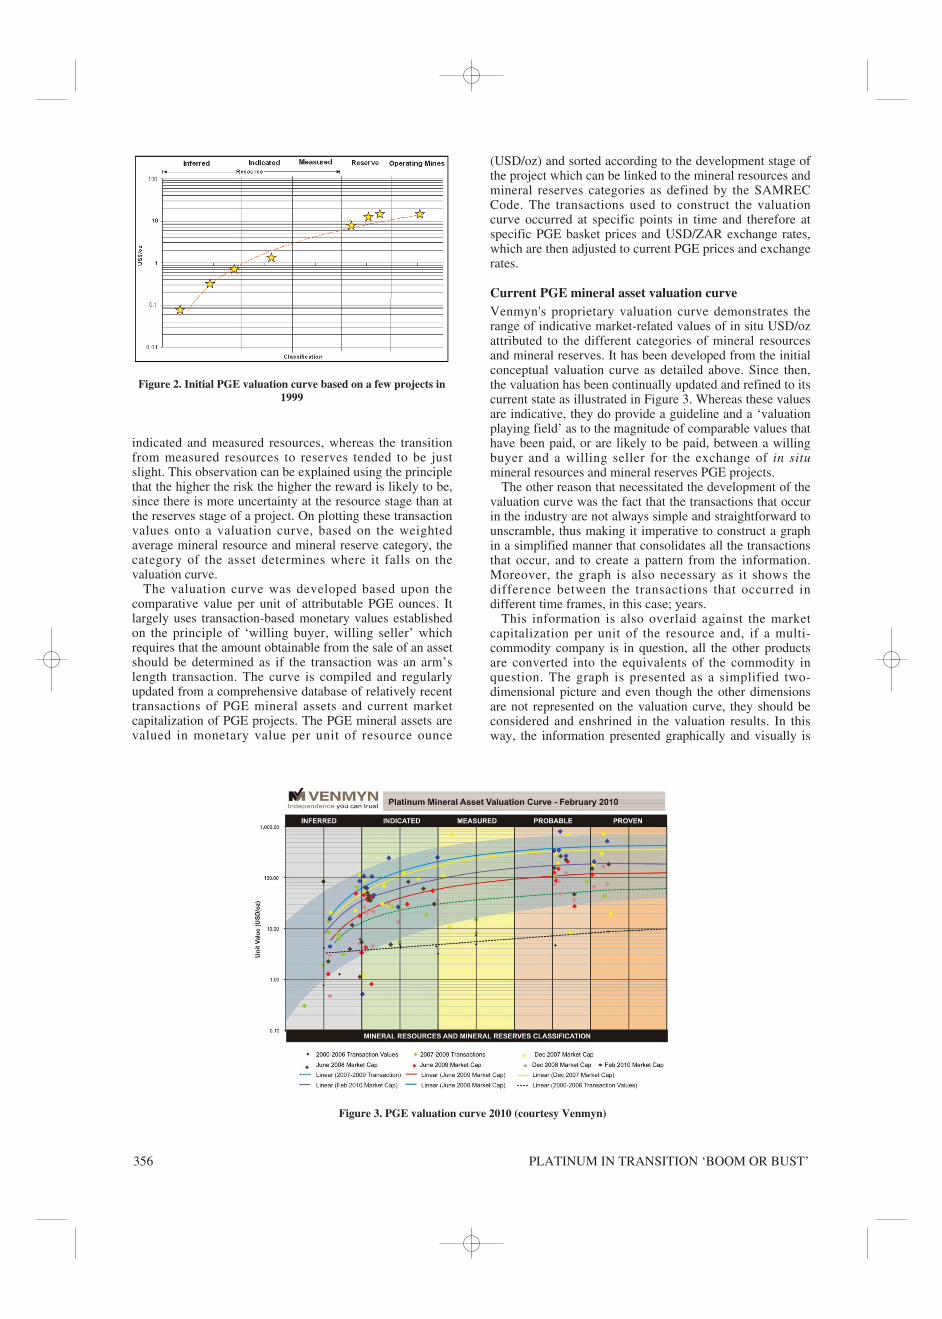
The valuation curve for PGE projects at different phasesof development in South Africa, in the early days ofdevelopment was as illustrated in Figure 2. This wasextended to PGE projects in relevant surrounding Africancountries as well as the rest of the world. The projects wereseparated on the basis of the stage of development as wellas the style of mineralization.
On ordinary graph paper, no meaningful relationshipcould be established between the USD/oz and stage ofdevelopment. However, on assessing the data and plottingthe project value (in USD/oz) versus the stage ofdevelopment on log paper, it was noted that projects in themineral resource category tended to plot towards the baseof the curve and most advanced projects in the mineralreserve category tended to plot at the top of the curve withthe rest filling the space in between by order ofdevelopment. It was, therefore concluded that PGE projectsin a similar development stage tend to have similar USD/ozvalues. Another observation was that significant change invalue tends to occur in the transition from inferred, to
Figure 1. Relationship between exploration results, mineralresources and mineral reserves (Source: SAMREC Code, 2009)
PLATINUM IN TRANSITION ‘BOOM OR BUST’356
indicated and measured resources, whereas the transitionfrom measured resources to reserves tended to be justslight. This observation can be explained using the principlethat the higher the risk the higher the reward is likely to be,since there is more uncertainty at the resource stage than atthe reserves stage of a project. On plotting these transactionvalues onto a valuation curve, based on the weightedaverage mineral resource and mineral reserve category, thecategory of the asset determines where it falls on thevaluation curve.
The valuation curve was developed based upon thecomparative value per unit of attributable PGE ounces. Itlargely uses transaction-based monetary values establishedon the principle of ‘willing buyer, willing seller’ whichrequires that the amount obtainable from the sale of an assetshould be determined as if the transaction was an arm’slength transaction. The curve is compiled and regularlyupdated from a comprehensive database of relatively recenttransactions of PGE mineral assets and current marketcapitalization of PGE projects. The PGE mineral assets arevalued in monetary value per unit of resource ounce
(USD/oz) and sorted according to the development stage ofthe project which can be linked to the mineral resources andmineral reserves categories as defined by the SAMRECCode. The transactions used to construct the valuationcurve occurred at specific points in time and therefore atspecific PGE basket prices and USD/ZAR exchange rates,which are then adjusted to current PGE prices and exchangerates.
Current PGE mineral asset valuation curve Venmyn's proprietary valuation curve demonstrates therange of indicative market-related values of in situ USD/ozattributed to the different categories of mineral resourcesand mineral reserves. It has been developed from the initialconceptual valuation curve as detailed above. Since then,the valuation has been continually updated and refined to itscurrent state as illustrated in Figure 3. Whereas these valuesare indicative, they do provide a guideline and a ‘valuationplaying field’ as to the magnitude of comparable values thathave been paid, or are likely to be paid, between a willingbuyer and a willing seller for the exchange of in situmineral resources and mineral reserves PGE projects.
The other reason that necessitated the development of thevaluation curve was the fact that the transactions that occurin the industry are not always simple and straightforward tounscramble, thus making it imperative to construct a graphin a simplified manner that consolidates all the transactionsthat occur, and to create a pattern from the information.Moreover, the graph is also necessary as it shows thedifference between the transactions that occurred indifferent time frames, in this case; years.
This information is also overlaid against the marketcapitalization per unit of the resource and, if a multi-commodity company is in question, all the other productsare converted into the equivalents of the commodity inquestion. The graph is presented as a simplified two-dimensional picture and even though the other dimensionsare not represented on the valuation curve, they should beconsidered and enshrined in the valuation results. In thisway, the information presented graphically and visually is
Figure 2. Initial PGE valuation curve based on a few projects in1999
Figure 3. PGE valuation curve 2010 (courtesy Venmyn)
DEVELOPMENT AND IMPLEMENTATION OF A PGE MINERAL ASSET VALUATION CURVE 357
easy to compare. On average, mineral projects tend to bevalued in a specific pattern with a nearly constant rangebetween low and high. By considering the transactions thathave occurred in recent years, one may unscramble these toestimate the USD/oz values.
The concept of comparative valuation as one of themarket approach methodologies has been extended toestablish a PGE valuation curve for use in valuing PGEprojects. Since it is also time based, the curve is a reflectionof sentiments on the value of PGE mineral assets withmarket conditions at the time as illustrated by the differenttrend lines. For example, the general sentiment in June2009 was significantly lower than the sentiment in June2008. As a generalization, investors were willing to paymore per unit of PGE ounce in June 2008 compared to June2009, mainly driven by the buoyant platinum prices.
The transactions that are cash based tend to fall towardsthe bottom of the curve as these are significantly discountedas illustrated by the trend line in Figure 3. The share-basedtransactions, however, tend to lie towards the top of thecurve, and any other combination lies in the middle.
The transactions used to construct the valuation curveoccurred at specific points in time and, therefore, at specificPGE basket prices and USD/ZAR exchange rates, whichare then adjusted to current PGE prices and exchange rates.The curve is compiled and regularly updated from acomprehensive database of relatively recent transactions ofPGE mineral assets and current market capitalization ofPGE projects. The PGE mineral assets are valued inmonetary value per unit of resource ounce and sortedaccording to the development stage of the project, whichcan be linked to the mineral resource and mineral reservecategories.
This valuation curve has been successfully used over thepast few years to value PGE mineral assets on a directlycomparable basis. Importantly, the curves can be used toplot comparative results for the income approach, costapproach and the market approach and assess how thosevalues relate to one other. This is particularly important asit can be used to void a method that appears to generatevery low or high values that seem to be outliers.
Research and development has continued to add moredata to the initial set of data and currently maintains acomprehensive database of recent transactions involvingPGE mineral assets in the world as a means of establishing
the valuation playing field. An updated PGE valuationcurve is illustrated in Figure 3. The graph also shows that,for values within any category of mineral resource ormineral reserve classification, there is a band of values amineral asset is expected to assume. The curve also exhibitsthe logarithmic relationship that was observed earlier. If,during a valuation process, a PGE project plots outside ofthis generalized curve, the project valuation process rendersfurther investigations to justify the abnormality.
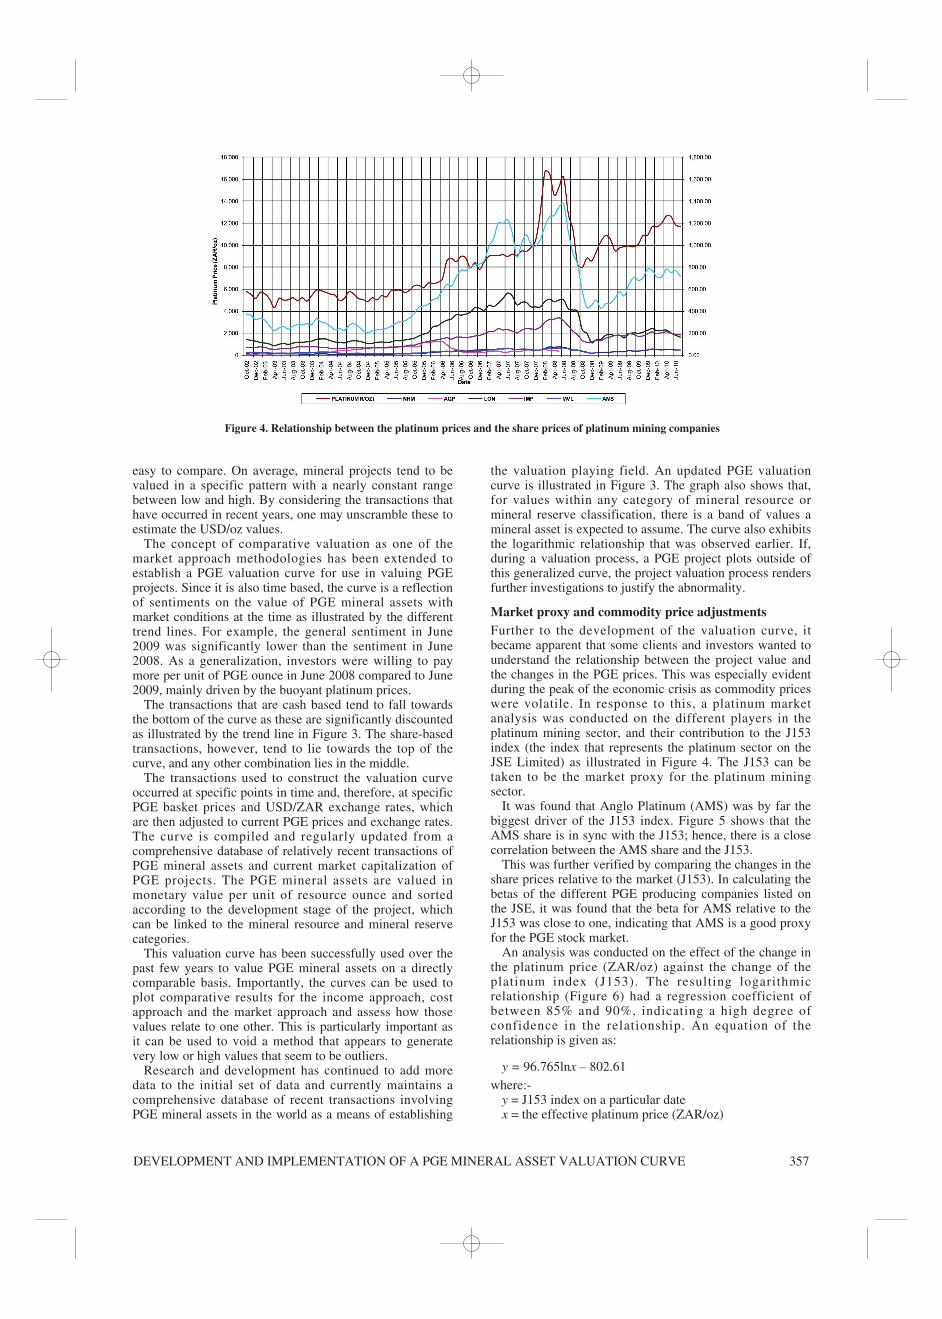
Market proxy and commodity price adjustmentsFurther to the development of the valuation curve, itbecame apparent that some clients and investors wanted tounderstand the relationship between the project value andthe changes in the PGE prices. This was especially evidentduring the peak of the economic crisis as commodity priceswere volatile. In response to this, a platinum marketanalysis was conducted on the different players in theplatinum mining sector, and their contribution to the J153index (the index that represents the platinum sector on theJSE Limited) as illustrated in Figure 4. The J153 can betaken to be the market proxy for the platinum miningsector.
It was found that Anglo Platinum (AMS) was by far thebiggest driver of the J153 index. Figure 5 shows that theAMS share is in sync with the J153; hence, there is a closecorrelation between the AMS share and the J153.
This was further verified by comparing the changes in theshare prices relative to the market (J153). In calculating thebetas of the different PGE producing companies listed onthe JSE, it was found that the beta for AMS relative to theJ153 was close to one, indicating that AMS is a good proxyfor the PGE stock market.
An analysis was conducted on the effect of the change inthe platinum price (ZAR/oz) against the change of theplatinum index (J153). The resulting logarithmicrelationship (Figure 6) had a regression coefficient ofbetween 85% and 90%, indicating a high degree ofconfidence in the relationship. An equation of therelationship is given as:
y = 96.765lnx – 802.61where:-
y = J153 index on a particular datex = the effective platinum price (ZAR/oz)
Figure 4. Relationship between the platinum prices and the share prices of platinum mining companies

PLATINUM IN TRANSITION ‘BOOM OR BUST’358
The resulting relationship was tested on historical data topredict the share price for AMS relative to the market(J153), and it was found to be a fairly reliable estimate forvaluation purposes. This relationship is then used to adjustvaluation results to any changes in the PGE commodityprices. The PGE valuation curve, since it represents thisvery platinum market, can be adjusted accordingly to thechanges in the commodity prices at any given time.
ConclusionsThe concept of comparative valuation as one of the marketapproach methodologies has been extended to establish aPGE valuation curve for use in valuing PGE projects. Sinceit is also time based, the curve is a reflection of sentimentson the value of PGE mineral assets with market conditionsat given times. This methodology, when applied to PGEtransactions, provides general guidance in terms of a rangeof transaction values for the PGE mineral assets.
Venmyn’s PGE mineral asset valuation curve provides agraphic illustration of the historical PGE transactions thathave taken place. The graph also plots the estimated unitvalues per mineral resource or mineral reserve of all themajor mining companies listed on the various securitiesexchanges. This commodity valuation curve clearly shows,in a graphic form, the range of values for mineral assets,depending on the mineral resource classification, access,geology, and commodity price, just to mention a fewfactors. Value ranges are applicable whether buying or
selling a mineral asset. The commodity valuation curvesalso serve as a good tool for cross-checking valuationresults, using either the cost approach or the cash flowapproach.
Venmyn records similar information and valuationprofiles for a number of the mineral commodities and, thefact that many transaction values have been reported in asimilar quantitative and qualitative manner, providesassurance that this is a reasonable and reliable method ofestimating value for PGE mineral assets.
ReferencesHEAP, A. China—The Engine of a Commodities Super
Cycle, The Mineral Economics and ManagementSociety Annual Conference, Washington, April 2005.
INTERNATIONAL VALUATION STANDARDSCOMMITTEE (IVSC). International ValuationStandards Committee, Sixth Edition, London UnitedKingdom, 2003. pp. i–496.
INTERNATIONAL VALUATION STANDARDSCOMMITTEE (IVSC). International ValuationStandards Committee, Seventh Edition, LondonUnited Kingdom, 2005. pp. i–458.
JOHNSON AND MATTHEY. Platinum 2009, available onINTERNET http://www.platinum.matthey.com/uploaded_files/Pt2009/09completepublication.pdf.
Figure 5. Relationship between the market (J153) and the Anglo Platinum (AMS) and Impala Platinum (IMP)
Figure 6. Relationship between the platinum prices and the market (J153)

DEVELOPMENT AND IMPLEMENTATION OF A PGE MINERAL ASSET VALUATION CURVE 359
LILFORD, E.V. and MINNITT, R.C.A. A comparablestudy of valuation methodologies for mineraldevelopments. The Journal of the South AfricanInstitute of Mining and Metallurgy, JohannesburgJanuary 2005. pp. 29–41.
MACCRATE, J.R. Uniform Appraisal Standards forFederal Land Acquisitions—Sales ComparisonApproach—Comparable Sales Retrieved 07th July2010 from http://realestatevaluation.wordpress.com/2010/03/12/uniform-appraisal-standards-for-federal-land-acquisitions-%E2%80%93-sales-comparison-approach-%E2%80%93-comparable-sales/.
PAGOURTZI, E., ASSIMAKOPOULOS, V.,HATZICHRISTOS, T., and FRENCH, N. Real estateappraisal: a review of valuation methods, Journal of
Property Investment & Finance, vol. 21, no. 4, 2003pp. 383–401.
SOUTH AFRICAN MINERAL ASSET VALUATION(SAMVAL) WORKING GROUP, South AfricanCode for the Reporting of Mineral Asset Valuation(The SAMVAL Code), July 2009.
SOUTH AFRICAN MINERAL RESOURCECOMMITTEE (SAMREC), South African Code forthe Reporting of Exploration Results, MineralResources and Mineral Reserves (The SAMRECCode), July 2009.
SPECIAL COMMITTEE ON VALUATION OFMINERAL PROPERTIES (CIMVal), Standards andGuidelines for Valuation of Mineral Properties,February 2003.
Godknows NjowaMineral Industry Advisor, Venmyn Rand
Godknows has eight years experience in the minerals industry gained in mine production andconsulting. His mining career started in 2000, at Rio Tinto Zimbabwe’s gold mines and has beenworking as a Mineral Industry Advisor for Venmyn since 2006. Godknows currently serves onSAMREC/SAMVAL sub-committees. His key areas of expertise lie in technical and financialanalysis, management accounting, and corporate governance. Mineral asset valuation, complianceand public reporting of mineral assets for the various stock exchange jurisdictions are his corefocus areas. Godknows is currently studying for a PhD in mineral asset valuation at the Universityof Witwatersrand.

PLATINUM IN TRANSITION ‘BOOM OR BUST’360