Embed Size (px)
Citation preview

INL/EXT-16-39857
Development and Implementation of Mechanistic Terry Turbine Models in RELAP-7 to Simulate
RCIC Normal Operation Conditions
Haihua Zhao
Ling Zou Hongbin Zhang James O'Brien
September 2016
U.S. Department of Energy Office of Nuclear Energy

DISCLAIMER This information was prepared as an account of work sponsored by
an agency of the U.S. Government. Neither the U.S. Government nor any agency thereof, nor any of their employees, makes any warranty, expressed or implied, or assumes any legal liability or responsibility for the accuracy, completeness, or usefulness, of any information, apparatus, product, or process disclosed, or represents that its use would not infringe privately owned rights. References herein to any specific commercial product, process, or service by trade name, trade mark, manufacturer, or otherwise, does not necessarily constitute or imply its endorsement, recommendation, or favoring by the U.S. Government or any agency thereof. The views and opinions of authors expressed herein do not necessarily state or reflect those of the U.S. Government or any agency thereof.

INL/EXT-16-39857
Development and Implementation of Mechanistic Terry Turbine Models in RELAP-7 to Simulate RCIC Normal Operation Conditions
Haihua Zhao, Ling Zou, Hongbin Zhang, James O'Brien
September 2016 Revised in December 2016
Idaho National Laboratory Idaho Falls, Idaho 83415
http://www.inl.gov
Prepared for the U.S. Department of Energy Office of Nuclear Energy
Under DOE Idaho Operations Office Contract DE-AC07-05ID14517

ii
EXECUTIVE SUMMARY
As part of the efforts to understand the unexpected “self-regulating” mode of the RCIC (Reactor Core Isolation Cooling) systems in Fukushima accidents and extend BWR RCIC and PWR AFW (Auxiliary Feed Water) operational range and flexibility, mechanistic models for the Terry turbine, based on Sandia’s original work [1], have been developed and implemented in the RELAP-7 code to simulate the RCIC system. In 2016, this effort has been focused on normal working conditions of the RCIC system. More complex off-design conditions will be pursued in later years when more data are available.
In the Sandia model, the turbine stator inlet velocity is provided according to a reduced-order model which was obtained from a large number of CFD (computational fluid dynamics) simulations. In this work, we propose an alternative method, using an under-expanded jet model to obtain the velocity and thermodynamic conditions for the turbine stator inlet. The models include both an adiabatic expansion process inside the nozzle and a free expansion process outside of the nozzle to ambient pressure. The combined models are able to predict the steam mass flow rate and supersonic velocity to the Terry turbine bucket entrance, which are the necessary input information for the Terry turbine rotor model. The analytical models for the nozzle were validated with experimental data and benchmarked with CFD simulations. The analytical models generally agree well with the experimental data and CFD simulations. The analytical models are suitable for implementation into a reactor system analysis code or severe accident code as part of mechanistic and dynamical models to understand the RCIC behaviors.
The newly developed nozzle models and modified turbine rotor model according to the Sandia’s original work have been implemented into RELAP-7, along with the original Sandia Terry turbine model. A new pump model has also been developed and implemented to couple with the Terry turbine model. An input model was developed to test the Terry turbine RCIC system, which generates reasonable results. Both the INL RCIC model and the Sandia RCIC model produce results matching major rated parameters such as the rotational speed, pump torque, and the turbine shaft work for the normal operation condition. The Sandia model is more sensitive to the turbine outlet pressure than the INL model.
The next step will be further refinement of the Terry turbine models by including two-phase flow cases so that off-design conditions can be simulated. The pump model could also be enhanced with the use of the homologous curves.

iii
ACKNOWLEDGEMENTS
The funding for this project is provided by the Reactor Safety Technology Pathway of the Light Water Sustainability Program, U.S. Department of Energy.

iv
CONTENTS

v
FIGURES
Figure 1. Terry turbine bucket flow (left) and interior view of turbine case (right) [1] ................................ 1
Figure 2. Schematic of high pressure gas flow through a nozzle. ................................................................ 4
Figure 3. Test nozzle geometry [1]. ............................................................................................................... 7
Figure 4. Velocities near test nozzle exit. ...................................................................................................... 7
Figure 5. Nozzle mass flow rate, kg/s. ........................................................................................................... 9
Figure 6. Virtual nozzle length (from the nozzle exit to the end of virtual nozzle). ..................................... 9
Figure 7. Turbine bucket inlet velocity for the high outlet pressure case (3.0E5 Pa). ................................. 10
Figure 8. Turbine bucket inlet velocity for the low outlet pressure case (1.93E5 Pa). ................................ 11
Figure 9. RELAP-7 Terry turbine RCIC system test model. ....................................................................... 16
Figure 10. Pump head calculated by the RELAP-7 Terry turbine RCIC system test model for turbine outlet pressure at 1.93E5 Pa. ............................................................................................................. 18
Figure 11. The shaft work calculated by the RELAP-7 Terry turbine RCIC system test model for turbine outlet pressure at 1.93E5 Pa. ............................................................................................................. 19
Figure 12. The rotational speed calculated by the RELAP-7 Terry turbine RCIC system test model for turbine outlet pressure at 1.93E5 Pa. ................................................................................................. 19
Figure 13. The pump torque calculated by the RELAP-7 Terry turbine RCIC system test model for turbine outlet pressure at 1.93E5 Pa. ................................................................................................. 20
Figure 14. The mass flow rates through the turbine and pump calculated by the RELAP-7 Terry turbine RCIC system test model for turbine outlet pressure at 1.93E5 Pa. ................................................... 20

vi
TABLES
Table 1 Terry turbine geometry [1] ............................................................................................................... 8
Table 2 Terry turbine and pump parameters ................................................................................................ 17
Table 3 Important Terry turbine nozzle RELAP-7 calculation results for turbine outlet pressure at 1.93E5 Pa ....................................................................................................................................................... 18
Table 4 Important Terry turbine and pump calculated parameters at steady state for outlet pressure at 1.93E5 Pa .......................................................................................................................................... 22
Table 5 Important Terry turbine and pump calculated parameters at steady state for outlet pressure at 3E5 Pa ....................................................................................................................................................... 23

vii
ACRONYMS
0-D zero-dimensional
BC Boundary Condition
BWR Boiling Water Reactor
FY Fiscal Year
INL Idaho National Laboratory
LWRS Light Water Reactor Sustainability
RCIC Reactor Core Isolation Cooling
RELAP-7 Reactor Excursion and Leak Analysis Program 7
PWR Pressurized Water Reactor
SBO Station Blackout
SRV Safety Relief Valve

1
1. INTRODUCTION
As part of the efforts to understand the unexpected “self-regulating” mode of the RCIC (Reactor Core Isolation Cooling) systems in Fukushima accidents and extend BWR RCIC and PWR AFW (Auxiliary Feed Water) operational range and flexibility, mechanistic models for the Terry turbine, based on Sandia’s original work [1], have been developed and implemented in the RELAP-7 code to simulate the RCIC system. RELAP-7 is a new reactor system safety analysis code currently under development at Idaho National Laboratory (INL) [2, 3]. A fully implicit and strongly coupled RCIC system model had been developed in the RELAP-7 code and used for simplified BWR SBO simulations in the past [4-7]. In that simulation, a generic turbine model was used to conserve mass and energy while the turbine operation characteristic curves were used to obtain the non-dimensional mass flow rate and thermal efficiency. This model could be used for simulating RCIC off-design behavior if off-design operation characteristic curves were available. However, no such curves currently exist for the Terry turbine system due to its unique pure impulse design. Sandia National Labs recently developed a set of mechanistic Terry turbine models suitable for system code implementation [1]. According to the review in the report, the Terry turbine is essentially a solid cylindrical wheel with several machined semi-circular ‘buckets’ that are shaped into the body of the wheel. All Terry RCIC applications in the US use a “G turbine frame size” that denotes a 24-inch (0.61 m) diameter turbine wheel. Fixed nozzles and reversing chambers surround the wheel inside the turbine casing. Figure 1 illustrates the geometry and flow path of steam through the nozzle, turbine buckets, and reversing chambers. The Sandia Terry turbine model is based on the following assumptions that are based on literature review of design, operation, and maintenance of Terry turbines:
• RCIC uses a single-stage Terry impulse turbine that functions according to the exchange of momentum and kinetic energy.
• Steam enters semi-circular buckets and reverses direction (~180 ). • The reversing chambers are only important for low speed operation, such as during the initial
startup. • The expansion of steam after the nozzles is total; the expansion process converts the static
pressure (enthalpy energy) of the steam into kinetic energy to be imparted into the turbine buckets. No meaningful reaction force is developed by the Terry turbine.
Figure 1. Terry turbine bucket flow (left) and interior view of turbine case (right) [1]
( ) (

2
In this work, we modify the Sandia Terry turbine model and implement those models into the RELAP-7 code. For FY16, our effort has been focused on normal working conditions. More complex off-design conditions will be pursued in later years when more data are available. In the Sandia model, the turbine stator inlet velocity is provided according to a reduced-order model which was obtained from a large number of CFD simulations. In this work, we adopt an alternative method, using an under-expanded jet model to obtain the velocity and thermodynamic conditions for the turbine stator inlet, which is simple and generic, and suitable for use in system analysis codes. The RELAP-7 Terry turbine will be composed of two parts:
• Nozzle model which predicts mass flow rate through the turbine and inlet conditions for the rotor (semi-circular buckets),
• Turbine rotor model which describes the balance of angular momentum of the wheel. Section 2 presents the analytical nozzle model and benchmark results against experimental data and Sandia’s CFD results. Section 3 describes the turbine rotor model and coupled pump model. Section 4 presents a RCIC system test and Section 5 summarizes the work.

3
2. ANALYTICAL NOZZLE MODEL AND COMPARISON WITH THE
SANDIA CFD SIMULATION RESULTS
2.1 New Analytical Nozzle Model
In the Sandia work [1], CFD analyses of a Terry turbine model were performed to complement the system-level modeling using MELCOR and RELAP5. The efforts for this report concentrated on quantifying the two-phase mixture composition and exit velocity through the nozzles and into the buckets [1]. The mass flow rate can be accurately determined by two-phase critical flow models in MELCOR and RELAP5, but the codes cannot predict the supersonic velocities developed by the nozzles. The report proposed three ways to obtain the velocity information:
1. Developing a sub-model for the system analysis, based on an abstraction of the full pertinent physics, that can calculate the nozzle velocities based on other plant-level predictions;
2. Table lookup of CFD results as a function of various plant variables; or 3. Analytic formula fit of CFD results as a function of various plant variables.
The third option was used for the initial application of the CFD insights into the system models in the Sandia report. In this work, we take the first option to develop a simple analytical model for calculating the entrance velocity to the rotor bucket. As noted in the Sandia report, even relationships for ideal gases yield good estimates for the choking mass flow rate for saturated steam, which is not an ideal gas. For the RCIC turbine operating near its design operation condition (saturated steam at high pressure), we postulate that treating saturated steam as an ideal gas will result in sufficiently accurate results for the RCIC turbine simulation in a system code. Further extending the idea, the under-expanded or over-expanded jet out of the nozzle can also be treated with the ideal gas assumption. For off-design working conditions, a simple two-phase model such as homogenous equilibrium model (HEM) can be used to replace the ideal gas model, which will be pursued in future work. Figure 2 shows that the jet flow through a converging-diverging nozzle can be characterized with four distinct stages: (1) adiabatic expansion to sonic condition at the throat from the source and adiabatic expansion to supersonic condition in the diverging part of the nozzle; (2) adiabatic free expansion and reaching the ambient pressure (virtual nozzle); (3) zone of flow establishment (ZOFE); (4) free jet. Different models are used for analyzing each stage. As discussed in the Sandia report, the jet enters the bucket near the maximum speed, where the jet static pressure is equal to the turbine pressure. The jet should be at the stage of the zone of flow establishment or near the end of the virtual nozzle. Therefore, the free jet model is irrelevant in the simulation and is skipped in this report. The models for stage 1 to 3 will be discussed here. For the adiabatic expansion process from the source to the nozzle throat, an isentropic process is assumed and the choking is assumed to happen at the throat point. When the ideal gas law is assumed, the choking mass flow rate, pressure, and temperature can be calculated according to the source conditions [8]:
where is the cross-section area at the nozzle throat. The critical pressure and the critical density are calculated by

4
(2)
(3)
where the subscript 10 indicates the stagnation condition for the inlet. To derive stagnation states, we first have
(4)
where u is the velocity. Assuming an isentropic process, from the static state, say, (h1, p1), we can find the stagnation state (h01, p01). For an ideal gas, the following equations hold [9]
(5)
(6)
(7)
where R is the gas constant.
Figure 2. Schematic of high pressure gas flow through a nozzle.

5
From the nozzle throat to the nozzle exit, an adiabatic supersonic expansion process is assumed. According to the model summarized by NASA [10], the Mach number (M) at the nozzle exit can be calculated by the following equation:
Where A is the cross-section area at any location of the nozzle. When Mach number is available, the pressure, temperature and density can be calculated according to the following equations, respectively:
The sound speed is calculated as:
and velocity is calculated from:
With Eqs. (8) to (13), the flow conditions at the nozzle exit can be calculated. For the non-isentropic adiabatic free expansion process from the nozzle exit to the pressure at ambient value, pressure, temperature, velocity, and density vary rapidly while the jet diameter expands significantly over a short distance from the nozzle exit [11]. This process is called virtual nozzle in literature. The mass entrained by the jet during this expansion process is insignificant compared to the jet mass flow rate from the nozzle exit. Therefore, it is assumed that there is no mass flux through the jet boundary at this stage. According to mass, momentum, energy balances and the ideal gas law, four equations can be formulated to calculate jet velocity, temperature, density, and diameter at the end of this stage. This method has been used by Xiao et al. [12] and Bulent Yuceil [11]. The following summarizes the model:

6
Where subscript v represents the location at the end of the virtual nozzle and e represents the location at the nozzle exit, and d is the diameter. In order to estimate the length of this stage, the distance for the Mach disk, where the shock occurs, is assumed to approximate this expansion length. The model developed by Velikorodny and Kudriakov [13] is used in this report to calculate the distance for the Mach disk:
The zone of flow establishment describes the process where unsheared jet profiles undergo changes into profiles with similarity. The transition is complex and the transition length has large uncertainty. For low speed flow, the distance extends up to 5-10 times the orifice diameter [14]. For sonic or supersonic flow, the length is even larger. According to the experimental results presented by Bulent Yuceil [11], the temperature profiles became self-preserving at about 18 jet diameters at the end of the virtual nozzle for the cases studied. Given upstream conditions, this set of models calculates the Terry turbine bucket inlet conditions such as velocity and mass flow rate. These inputs are used to close the angular momentum equation for the turbine rotor. 2.2 Benchmark with Steam Nozzle Experiments
The same steam nozzle experiment used for benchmark in the Sandia research [1] is used for validating the proposed analytical model and comparing with Sandia CFD results. Figure 3 shows the test nozzle geometry. This nozzle test only covers in-nozzle data. The analytical model assumes dry saturated steam at the nozzle inlet. The steam temperature is at saturation for the inlet pressure. The constants in the model including and are evaluated from realistic steam properties and are kept constant through the expansion process. Figure 4 compares the velocity values calculated with the analytical model against the CFD results from the Sandia team and test data. Note that the nozzle test data reflects conditions just before the exit (near 90% nozzle length) while all the calculation results are at the nozzle exit. It can be seen that the simple analytical model results match the CFD results very well and both analytical model results and CFD results reasonably agree well with the test data except for the low pressure steam jet test point. The reason for this discrepancy is due to the fact that shocks develop in the diverging section of the nozzle for the lower inlet pressure cases as revealed by the test data and CFD simulations. The simple analytical model cannot account for the situation with which shocks appear inside the nozzle. Shocks in the diverging section are indicative of over-expanded nozzle flow, which results from too low of a pressure drop over the nozzle geometry. However, over-expanded flow is not anticipated for the Terry turbine nozzles, given the high reactor vessel (or steam generator) pressures for such applications. Higher inlet pressures will

7
push shocks out the nozzle and result in under-expanded flow [1]. From the test nozzle benchmark, we conclude that the simple analytical model can predict similarly accurate nozzle exit velocity as complex CFD models do.
Figure 3. Test nozzle geometry [1].
Figure 4. Velocities near test nozzle exit.

8
2.3 Terry Turbine Nozzle Results and Comparison with CFD Results
The Terry turbine geometry specified by the Sandia study [1], as shown in Table 1, is used for the Terry turbine benchmark study. In this section, the Sandia CFD results will be used for benchmarking the analytical model. From Table 1 it is noted that the nozzle length is very short and there is only a 1.5 cm gap between the nozzle exit and the bucket entrance. Therefore this case is not only good for verifying the nozzle expansion model, but also useful for checking the virtual nozzle model for either under-expanded or over-expanded jets.
Table 1 Terry turbine geometry [1]
Model variable Quantity
Turbine wheel diameter 61 cm (24 inches)
Turbine wheel and bucket width 7 cm
Number of nozzles and reversing chamber sets 5
Number of reversing chambers per nozzle set 4
Number of buckets on wheel 84
Nozzle length 1.7 cm
Nozzle circular throat diameter 0.56 cm
Nozzle square exit side length 0.64 cm
Distance from nozzle exit to bucket entrance ≈1.5 cm
Figure 5 shows the mass flow rates through the nozzle under different upstream pressures. The analytical model results agree well with the Sandia CFD results. The relative errors are about 10%. This error range should be within the uncertainty range for either CFD methods or the analytical method. Figure 6 shows the virtual nozzle lengths for two different outlet pressures under different inlet pressures. The RCIC turbine typically operates under high inlet pressure (i.e. between 6 to 8 MPa). For those situations, the virtual nozzle lengths are typically slightly larger than the gap distance between the nozzle exit and the entrance to the bucket (1.5 cm). Therefore, the jet velocity at the end of the virtual nozzle is a good approximation for the bucket entrance velocity.

9
Figure 5. Nozzle mass flow rate, kg/s.
Figure 6. Virtual nozzle length (from the nozzle exit to the end of virtual nozzle).

10
Figure 7 and Figure 8 show the bucket entrance velocities for two outlet pressures. The analytical model generally predicts higher entrance velocities than the Sandia CFD model. The CFD simulations show condensation near the bucket entrance, which results in lower velocities. The analytical model cannot account for this effect therefore results in higher velocities. For the high inlet pressure operation range typical for RCIC turbine (6 – 8 MPa), the analytical model and CFD results are close: less than 15% difference for the high outlet pressure case and less than 3% for the low outlet pressure case. When the inlet pressure is lower than 5 MPa, the difference between the analytical model and the Sandia CFD model predictions become larger. However, both models predict similar trends. The RCIC system typically only experiences low inlet pressure during the short period of the primary system depressurization process. The RCIC system behavior is not important to the system response during depressurization due to large amount of steam release through SRVs (Safety/Relief Valve). Considering these facts, the larger difference in the bucket entrance velocity for lower inlet pressure cases should not be a big concern in term of the overall RCIC simulation uncertainty. When DC power for controlling the RCIC system is lost, the RCIC turbine would operate either in two-phase mode or periodically experiencing liquid water or two-phase mode. An effective two-phase analytical model is necessary to capture the major physics for this off-design mode, which can only be developed after enough experimental data become available in the near future.
Figure 7. Turbine bucket inlet velocity for the high outlet pressure case (300 kPa).

11
Figure 8. Turbine bucket inlet velocity for the low outlet pressure case (193 kPa).

12
3. TERRY TURBINE AND PUMP SYSTEM MODELS
The RCIC system model is composed of coupled Terry turbine and pump systems. The Terry turbine model is composed of the nozzle model and Terry turbine rotor model. The nozzle model is described in section 2. The Terry turbine rotor model and the pump model will be described in this section. For brevity, we refer to these sets of Terry turbine models as the INL model in the report. We also summarize the original Sandia Terry turbine model in this section.
3.1 INL Terry Turbine Model
3.1.1 INL Terry Turbine Rotor Model
The Terry turbine rotor model developed by Sandia [1] will be adopted here with only one modification for consideration of the angular momentum conversion efficiency. The angular momentum relationship on the turbine wheel control volume is used for the turbine rotational speed. A general angular momentum equation has the following form:
In Eq. (19), is the radius of the turbine wheel, is a force function over the surface of the control volume (with area and volume ), is a body force such as gravity, is the velocity vector, is the tangential component of the outlet velocity of the fluid leaving the bucket, and is the fluid density. In this equation, the first term on the left hand side is the shaft torque. The second term on the left hand side can be ignored for high-speed gas flow. The first term on the right hand side represents the driving moment of the fluid flow in the buckets. The last term represents the initial force. Following the Sandia’s derivation using the turbine velocity triangle relationship, Eq. (19) can be further simplified to an angular speed ( ) equation:
In Eq. (20), I is the turbine moment of inertia. Tpump is pump torque, which will be coupled from a pump model. is the inlet/exit angle between the fluid velocity vectors and the horizontal/tangential direction of the turbine motion. is an impulse conversion coefficient for accounting for the efficiency to convert the fluid kinetic energy to the driving moment for the angular momentum. This is a new concept added to the original Sandia model. A coefficient model should be developed according to experimental results. is the mass flow rate as calculated by Eq. (1). Vj is the nozzle jet velocity as calculated by virtual nozzle exit velocity model (Eq. (14)). The turbine shaft work supplied to the pump is calculated as

13
3.1.2 INL Pump Model
The pump model for the RCIC system is based on two assumptions: • quasi-steady state, • incompressible flow, We designed the pump as one 0-D junction component which provides: • one BC for upstream pipe: pressure • two BCs for downstream pipe: pressure and total energy. Four scalar variables: pump pressure pJ, pump temperature TJ, pump head H, and pump torque Tpump are defined as the unknowns for the pump model.
The pump pressure unknown corresponds to the mass balance Eq. as the nonlinear equation:
(22)
Where subscript 1 and 2 indicate inlet and outlet conditions. The pump temperature corresponds to the pump energy conservation equation:
(23)
Where the total energy is defined as
(24)
where e is the specific internal energy. In Eq. (23), is the pump efficiency. The pump head H is calculated as
(25)
where is the pump efficiency and g is the gravitational constant. The pump torque is calculated according to a scaling law as used in the Sandia model:
(26)
where and are the rated pump torque and speed, respectively. Comparing with the Sandia model, the pump efficiency is removed from the formula.

14
Pressures at the inlet and outlet pipe ends are calculated with the incompressible flow Bernoulli equation. We assume that the pump work is added to the fluid only in the entrance segment and the loss in the exit segment is ignored. For normal flow
(27) (28)
where
(29) (30)
where AJ is the pump reference cross section area.
Downstream total energy is calculated by
(31)
3.2 Sandia Terry Turbine Model
The Sandia Terry turbine model implemented into the RELAP-7 code is summarized here.
3.2.1 Nozzle Model
The mass flow rate through the nozzle is calculated by Eq. (1):
The turbine bucket inlet velocity is calculated by the reduced-order model:
3.2.2 Rotor Model
The rotor model as originally reported in the Sandia report is

15
3.2.3 Pump Model
The only difference in the pump model used by the Sandia model versus the pump model used in the INL model is for the torque formula (as shown in Eq. (26)):
Where the pump efficiency is added back. This equation may be questionable. For the rated condition, must be equal to 1. However, the real pump efficiency (for the head) is certainly not equal to 1 at the
rated condition. We will show the effect of the pump efficiency on the overall RCIC performance in the next section.

16
4. RCIC SYSTEM TESTS
4.1 INL Terry Turbine Model Tests
A RELAP-7 input model as shown in Figure 9 has been developed to test the Terry turbine system. The input model is composed of a Terry turbine model, coupled pump, a check valve on the water line, and connecting pipes and time dependent volumes at the boundary. The check valve is needed to prevent reverse flow through the pump line when the system just starts. The boundary conditions are also shown in the figure. Two different turbine outlet pressures at 193 kPa and 300 kPa are used for the Terry turbine nozzle test are used in the simulations.
Figure 9. RELAP-7 Terry turbine RCIC system test model.
Table 2 shows the major parameters for the turbine and pump. These values are taken from the Sandia MELCOR test case which is based on a RCIC system for a generic 2000 MWt BWR. Note that the rated pump head is not an input parameter. Since both the impulse conversion coefficient and the pump efficiency are not known, we use two known conditions to find out their best fits for the model at the turbine outlet pressure 193 kPa:
• The rated turbine speed and torque; • The water mass flow rate through the pump is about 10 times the steam mass flow rate through
the turbine. The two parameters are then fixed for the other turbine outlet condition. The simulation was run for 100 s to reach steady state. The time step in the beginning is 0.001 s, and gradually increases to 0.01 s at the time of 10 s and maintains at this value. The nozzle parameters rapidly

17
reach the steady state values shown in Table 3. It takes about 1 s for the pump head to reach steady state as shown in Figure 10. The calculated steady state pump head is 755 m which is very close to the rated value. Note that we do not know the exact nominal operation condition for the RCIC system in this case. Therefore, it is difficult to obtain exact rated pump head value with just approximate operation parameters. Other major parameters of interest such as the shaft work, rotational speed, and pump torque take more than 1 minute to reach steady state, as shown in Figure 11 to Figure 13. The calculated RCIC rotational speed at steady state is 446 radians/s, which is very close to the rated speed of 450 radians/s shown in Table 2. The calculated pump torque at steady state is 441 N-m, again very close to the rated value of 449 N-m. The calculated steady state shaft work is very close to the rated value: 197 kW versus 202 kW (450 radians/s Figure 14
Table 2 Terry turbine and pump parameters
Model Parameters Value
Turbine wheel radius (r) 0.3 m
Turbine inlet/outlet angle (β) π/4 radians
Number of nozzles 5
Total nozzle throat area 1.2315e-4 m2
Total nozzle exit area 2.048e-4 m2
Turbine moment of inertia (I) 10 kg-m2
Impulse conversion coefficient (cIC) 0.98
Rated RCIC speed ( ) 450.295 radians/s (4300 rpm)
Rated pump torque ( ) 449 N-m
Pump efficiency ( ) 0.52
Rated pump head 766 m (7.52 MPa)

18
Table 3 Important Terry turbine nozzle RELAP-7 calculation results for turbine outlet pressure at 193 kPa
Parameters Value
Pressure at nozzle inlet 7.500028e+06 Pa
Pressure at nozzle exit 5.713117e+05 Pa
Mach number at nozzle exit 2.295
Velocity at the nozzle exit 872 m/s
Velocity at the end of virtual nozzle 928 m/s
Figure 10. Pump head calculated by the RELAP-7 Terry turbine RCIC system test model for turbine outlet pressure at 193 kPa.

19
Figure 11. The shaft work calculated by the RELAP-7 Terry turbine RCIC system test model for turbine outlet pressure at 193 kPa.
Figure 12. The rotational speed calculated by the RELAP-7 Terry turbine RCIC system test model for turbine outlet pressure at 193 kPa.

20
Figure 13. The pump torque calculated by the RELAP-7 Terry turbine RCIC system test model for turbine outlet pressure at 193 kPa.
Figure 14. The mass flow rates through the turbine and pump calculated by the RELAP-7 Terry turbine RCIC system test model for turbine outlet pressure at 193 kPa.

21
4.2 Sandia Terry Turbine Model Tests
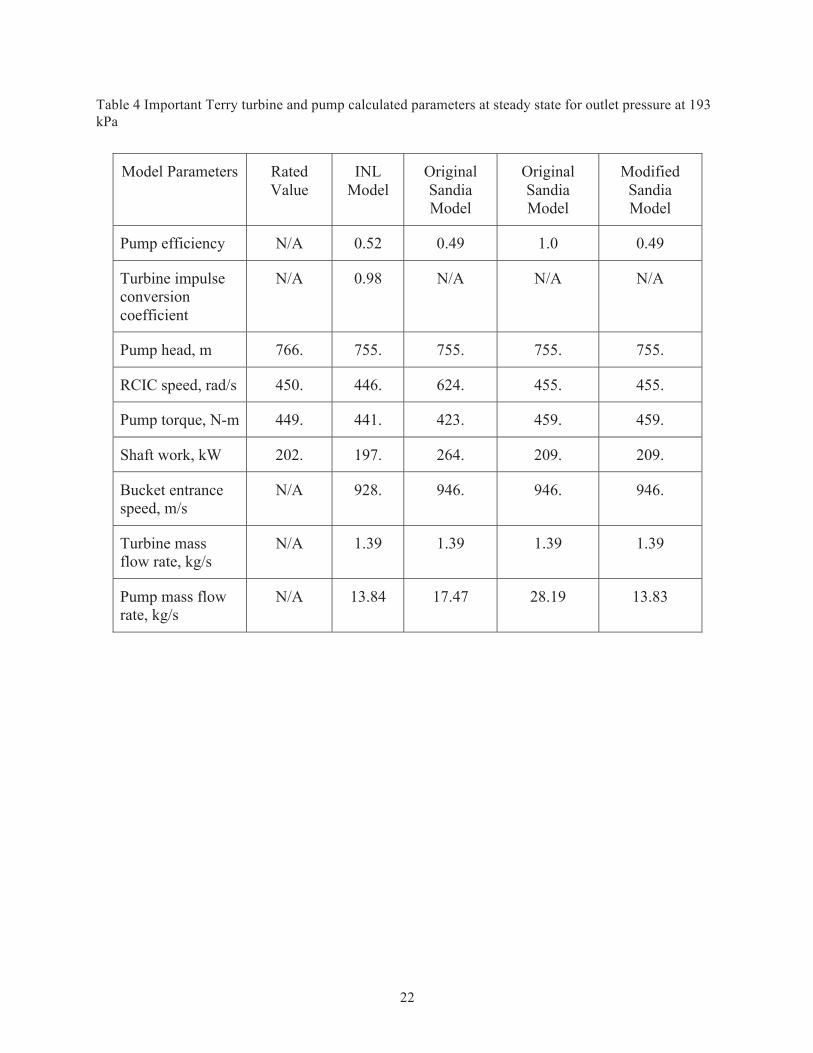
The Sandia Terry turbine model as implemented into MELCOR has been implemented into RELAP-7. The same test as discussed in section 4.1 is used for testing the original Sandia RCIC model. The pump efficiency in the Sandia report is unknown. From the previous RELAP-7 simulation results, we assume the pump efficiency is around 0.5. The best fitting for the two conditions listed in Section 4.1 would result in a pump efficiency of 0.49 as explained shortly. With this parameter determined, the major parameters from the simulation at steady state (column 4) are shown in Table 4, along with rated values, and results from the INL model. The pump head for the original Sandia Model is the same as that for the INL model since the pump head is mainly determined by the pressure difference between the pump side upstream and downstream. However, both the calculated RCIC speed (624. rad/s) and the turbine shaft work (264. kW) from the original Sandia model are much higher than the corresponding rated values. The mass flow rate ratio between the pump and turbine side is also significantly higher than 10. It is noted that the bucket entrance velocity by the ROM model is very close to the value calculated by the analytical model. The transient trends for all the major parameters in the simulation are very close to the trends shown in Figure 11 to Figure 14 and will not be shown again. In order to match the rotational speed at steady state, we tried to adjust the pump efficiency value and found out that setting the pump efficiency at 1 yields the best result as shown in the table (column 5). However, this results in a mass flow rate through the pump which is too high. It also does not make sense to assume a perfect efficiency even at the rated condition. In order to improve the simulation results, we drop the pump efficiency from Eq. . In the code, this means that we use the exact same pump model as described in Section 3.1.2. We call this model as the modified Sandia model. The simulation results are shown in the last column in table 4. We can see that the pump mass flow rate is the only parameter changed from the original Sandia model. The new pump mass flow rate value is now very close to the result from the INL model. The modified Sandia model also generates results matching all the rated conditions very well, such as rotational speed, torque, and the shaft work. In an extended BWR SBO accident, the wet well pressure will rise up with time due to injection of hot fluid from the primary system through RCIC and SRVs. Therefore it is important to check the effects of RCIC turbine downstream pressure. All the models are tested again with 300 kPa turbine outlet pressure. These results are shown in Table 5. Comparing results between two different outlet pressure conditions, a higher outlet pressure results in a slower shaft speed, less torque, less shaft work, and a smaller pump mass flow rate. The modified Sandia model is more sensitive to the turbine outlet pressure than the INL model.
22
Table 4 Important Terry turbine and pump calculated parameters at steady state for outlet pressure at 193 kPa
Model Parameters Rated Value
INL Model
Original Sandia Model
Original Sandia Model
Modified Sandia Model
Pump efficiency N/A 0.52 0.49 1.0 0.49
Turbine impulse conversion coefficient
N/A 0.98 N/A N/A N/A
Pump head, m 766. 755. 755. 755. 755.
RCIC speed, rad/s 450. 446. 624. 455. 455.
Pump torque, N-m 449. 441. 423. 459. 459.
Shaft work, kW 202. 197. 264. 209. 209.
Bucket entrance speed, m/s
N/A 928. 946. 946. 946.
Turbine mass flow rate, kg/s
N/A 1.39 1.39 1.39 1.39
Pump mass flow rate, kg/s
N/A 13.84 17.47 28.19 13.83

23
Table 5 Important Terry turbine and pump calculated parameters at steady state for outlet pressure at 300 kPa
Model Parameters Rated Value
INL Model
Original Sandia Model
Original Sandia Model
Modified Sandia Model
Pump efficiency N/A 0.52 0.49 1.0 0.49
Turbine efficiency N/A 0.98 N/A N/A N/A
Pump head, m 766. 755. 755. 755. 755.
RCIC speed, rad/s 450. 442. 584. 427. 427.
Pump torque, N-m 449. 433. 370. 403. 403.
Shaft work, kW 202. 192. 216. 172. 172.
Bucket entrance speed, m/s
N/A 913. 841. 841. 841.
Turbine mass flow rate, kg/s
N/A 1.39 1.39 1.39 1.39
Pump mass flow rate, kg/s
N/A 13.47 14.28 23.23 11.39

24
5. SUMMARY
In this work, we have developed a set of analytical models for the Terry turbine nozzle. The models include both an adiabatic expansion process inside the nozzle and a free expansion process outside of the nozzle to reach the ambient pressure. The combined models are able to predict the steam mass flow rate and supersonic velocity to the Terry turbine bucket entrance, which are the necessary input information for the Terry turbine rotor model. The nozzle analytical models were validated with experimental data and benchmarked with CFD simulations. The analytical models generally agree well with the experimental data and CFD simulations. The analytical models are suitable for implementation into a reactor system analysis code or severe accident code as part of a set of mechanistic dynamical models needed to understand the RCIC behaviors. The newly developed nozzle models and modified turbine rotor model according to the Sandia’s original work have been implemented into RELAP-7, along with the original Sandia Terry turbine model. A new pump model has also been developed and implemented to couple with the Terry turbine model. An input model was developed to test the Terry turbine RCIC system, which generates reasonable results. Both the INL RCIC model and the Sandia RCIC model produce results matching major rated parameters such as rotational speed, pump torque, and turbine shaft work for the normal operation condition. The Sandia model is more sensitive to the turbine outlet pressure than the INL model. The next step will be to further refine the Terry turbine models by including two-phase cases so that off-design conditions can be simulated. The pump model can also be enhanced with the use of the homologous curves.

25
6. REFERENCES
1. K. Ross, et. al., Modeling of the Reactor Core Isolation Cooling Response to Beyond Design Basis Operations – Phase 1, SAND2015-10662, December, 2015.
2. D. Andrs, et. al., RELAP-7 Level 2 Milestone Report: Demonstration of a Steady State Single Phase PWR Simulation with RELAP-7, INL/EXT-12-25924, May, 2012.
3. H. Zhang, et. al., RELAP-7 Development Updates, INL/EXT-15-36763, September, 2015. 4. H. Zhao, et. al., “Developing Fully Coupled Dynamical Reactor Core Isolation System Models in
RELAP-7 for Extended Station Black-Out Analysis,” Proceedings of 2014 International Congress on Advances in Nuclear Power Plants, Charlotte, North Carolina, USA, April 6-9, 2014.
5. H. Zhao, et. al., Refined Boiling Water Reactor Station Blackout Simulation with RELAP-7, INL/EXT-14-33162, September, 2014.
6. H. Zhao, et. al., “Demonstration of Fully Coupled Simplified Extended Station Black-Out Accident Simulation with RELAP-7,” Proceedings of PHYSOR 2014 – The Role of Reactor Physics Toward a Sustainable Future, Kyoto, Japan, September 28 – October 3, 2014.
7. H. Zhao, et. al., “A Strongly Coupled Reactor Core Isolation Cooling System Model for Extended Station Black-Out Analyses,” Proceedings of the 16th International Topical Meeting on Nuclear Reactor Thermal Hydraulics (NURETH-16), Hyatt Regency Chicago, USA, August 30-September 4, 2015.
8. S. Levy, Two-phase flow in complex systems. John Wiley & Sons, page 303 to 305, 1999. 9. HIH. SARAVANAMUTTOO, et. al., Gas Turbine Theory, 5th edition, pp. 54-56, Pearson
Education Limited, (2001). 10. Benson, Tom, "Isenotropic Flow". http://www.grc.nasa.gov/WWW/k-12/airplane/isentrop.html.
National Aeronautics and Space Administration. 21 June 2014. Accessed March 24, 2016. 11. K. Bulent Yuceil and M. Volkan Otugen, “Scaling Parameters for Underexpanded Supersonic
Jets,” Physics of Fluids, 14, 4206, 2002. 12. J. Xiao, J. R. Travis, W. Breitung, “Hydrogen release from a high pressure gaseous hydrogen
reservoir in case of a small leak,” International Journal of Hydrogen Energy, 36, 2545-2554, 2011.
13. A. Velikorodny and S. Kudriakov, “Numerical Study of the Near-Field of Highly Under-Expanded Turbulent Gas Jets”, Proc. of ICHS 2011, 2011.
14. GH. Jirka, “Integral model for turbulent buoyant jets in unbounded stratified flows. Part I single round jet.” Environmental Fluid Mechanics, 4, pg 1-56, 2004.
15. H. Lopez, et al., “RELAP RCIC Pump Homologous Curves Generation and Verification for Fukushima Unit 2,” Transactions of the American Nuclear Society, Vol. 111 (2014).