Embed Size (px)
Citation preview
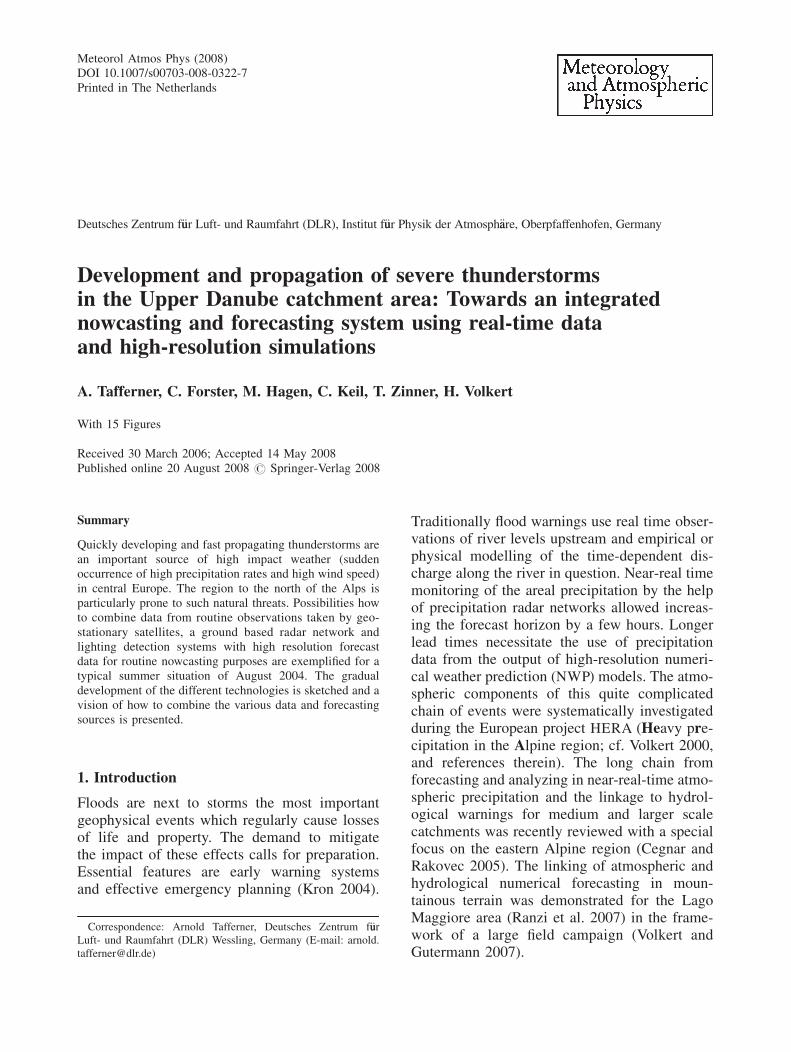
Meteorol Atmos Phys (2008)DOI 10.1007/s00703-008-0322-7Printed in The Netherlands
Deutsches Zentrum f€uur Luft- und Raumfahrt (DLR), Institut f€uur Physik der Atmosph€aare, Oberpfaffenhofen, Germany
Development and propagation of severe thunderstormsin the Upper Danube catchment area: Towards an integratednowcasting and forecasting system using real-time dataand high-resolution simulations
A. Tafferner, C. Forster, M. Hagen, C. Keil, T. Zinner, H. Volkert
With 15 Figures
Received 30 March 2006; Accepted 14 May 2008Published online 20 August 2008 # Springer-Verlag 2008
Summary
Quickly developing and fast propagating thunderstorms arean important source of high impact weather (suddenoccurrence of high precipitation rates and high wind speed)in central Europe. The region to the north of the Alps isparticularly prone to such natural threats. Possibilities howto combine data from routine observations taken by geo-stationary satellites, a ground based radar network andlighting detection systems with high resolution forecastdata for routine nowcasting purposes are exemplified for atypical summer situation of August 2004. The gradualdevelopment of the different technologies is sketched and avision of how to combine the various data and forecastingsources is presented.
1. Introduction
Floods are next to storms the most importantgeophysical events which regularly cause lossesof life and property. The demand to mitigatethe impact of these effects calls for preparation.Essential features are early warning systemsand effective emergency planning (Kron 2004).
Traditionally flood warnings use real time obser-vations of river levels upstream and empirical orphysical modelling of the time-dependent dis-charge along the river in question. Near-real timemonitoring of the areal precipitation by the helpof precipitation radar networks allowed increas-ing the forecast horizon by a few hours. Longerlead times necessitate the use of precipitationdata from the output of high-resolution numeri-cal weather prediction (NWP) models. The atmo-spheric components of this quite complicatedchain of events were systematically investigatedduring the European project HERA (Heavy pre-cipitation in the Alpine region; cf. Volkert 2000,and references therein). The long chain fromforecasting and analyzing in near-real-time atmo-spheric precipitation and the linkage to hydrol-ogical warnings for medium and larger scalecatchments was recently reviewed with a specialfocus on the eastern Alpine region (Cegnar andRakovec 2005). The linking of atmospheric andhydrological numerical forecasting in moun-tainous terrain was demonstrated for the LagoMaggiore area (Ranzi et al. 2007) in the frame-work of a large field campaign (Volkert andGutermann 2007).
Correspondence: Arnold Tafferner, Deutsches Zentrum f€uurLuft- und Raumfahrt (DLR) Wessling, Germany (E-mail: arnold.
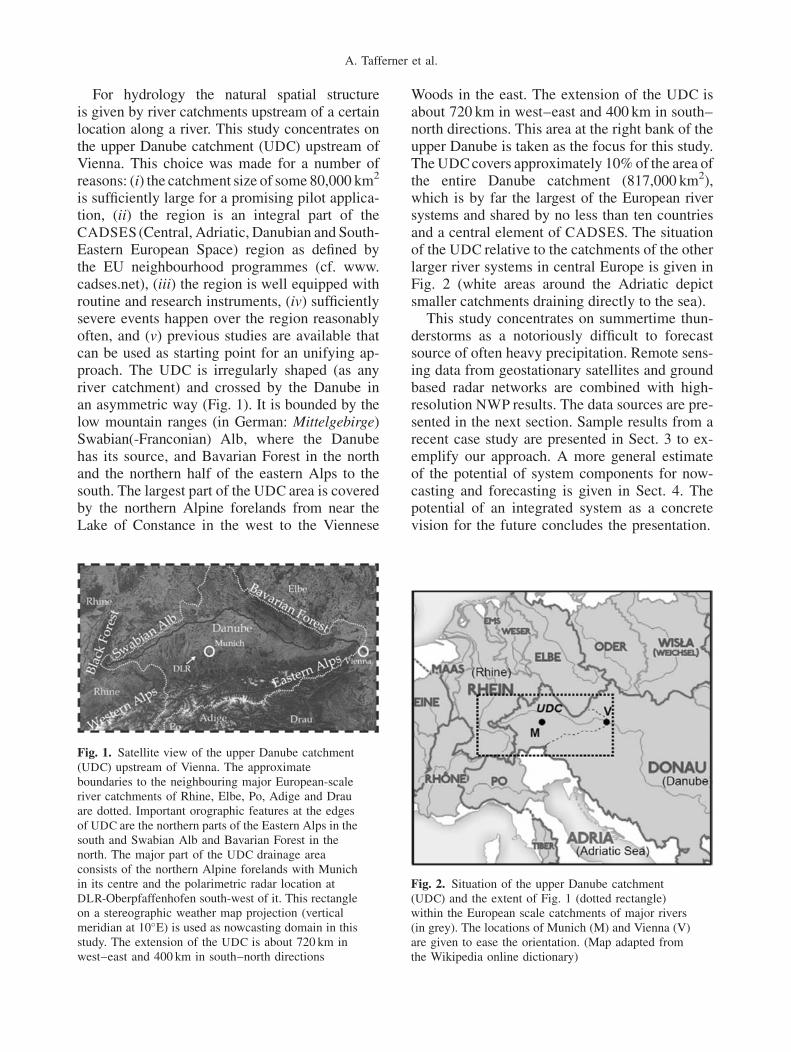
For hydrology the natural spatial structureis given by river catchments upstream of a certainlocation along a river. This study concentrates onthe upper Danube catchment (UDC) upstream ofVienna. This choice was made for a number ofreasons: (i) the catchment size of some 80,000 km2
is sufficiently large for a promising pilot applica-tion, (ii) the region is an integral part of theCADSES (Central, Adriatic, Danubian and South-Eastern European Space) region as defined bythe EU neighbourhood programmes (cf. www.cadses.net), (iii) the region is well equipped withroutine and research instruments, (iv) sufficientlysevere events happen over the region reasonablyoften, and (v) previous studies are available thatcan be used as starting point for an unifying ap-proach. The UDC is irregularly shaped (as anyriver catchment) and crossed by the Danube inan asymmetric way (Fig. 1). It is bounded by thelow mountain ranges (in German: Mittelgebirge)Swabian(-Franconian) Alb, where the Danubehas its source, and Bavarian Forest in the northand the northern half of the eastern Alps to thesouth. The largest part of the UDC area is coveredby the northern Alpine forelands from near theLake of Constance in the west to the Viennese
Woods in the east. The extension of the UDC isabout 720 km in west–east and 400 km in south–north directions. This area at the right bank of theupper Danube is taken as the focus for this study.The UDCcovers approximately 10% of the area ofthe entire Danube catchment (817,000 km2),which is by far the largest of the European riversystems and shared by no less than ten countriesand a central element of CADSES. The situationof the UDC relative to the catchments of the otherlarger river systems in central Europe is given inFig. 2 (white areas around the Adriatic depictsmaller catchments draining directly to the sea).
This study concentrates on summertime thun-derstorms as a notoriously difficult to forecastsource of often heavy precipitation. Remote sens-ing data from geostationary satellites and groundbased radar networks are combined with high-resolution NWP results. The data sources are pre-sented in the next section. Sample results from arecent case study are presented in Sect. 3 to ex-emplify our approach. A more general estimateof the potential of system components for now-casting and forecasting is given in Sect. 4. Thepotential of an integrated system as a concretevision for the future concludes the presentation.
Fig. 2. Situation of the upper Danube catchment(UDC) and the extent of Fig. 1 (dotted rectangle)within the European scale catchments of major rivers(in grey). The locations of Munich (M) and Vienna (V)are given to ease the orientation. (Map adapted fromthe Wikipedia online dictionary)
Fig. 1. Satellite view of the upper Danube catchment(UDC) upstream of Vienna. The approximateboundaries to the neighbouring major European-scaleriver catchments of Rhine, Elbe, Po, Adige and Drauare dotted. Important orographic features at the edgesof UDC are the northern parts of the Eastern Alps in thesouth and Swabian Alb and Bavarian Forest in thenorth. The major part of the UDC drainage areaconsists of the northern Alpine forelands with Munichin its centre and the polarimetric radar location atDLR-Oberpfaffenhofen south-west of it. This rectangleon a stereographic weather map projection (verticalmeridian at 10�E) is used as nowcasting domain in thisstudy. The extension of the UDC is about 720 km inwest–east and 400 km in south–north directions
A. Tafferner et al.
2. Data sources
The synoptic view on and the linkage of differentdata sources is at the heart of meteorologicalanalysis and prognosis since more than 80 years.Bergeron (1928) assembles a variety of older ex-plorative studies (loc. Cit., pp. 11–15), stressesthe necessity of daily routine applications andshows how the wealth of different measurementsand qualitative observations can be blended to-gether to obtain a consistent picture of the cur-rent weather and its development during thefollowing hours. This study makes use of routinesurface observations combined with remote sens-ing data from geostationary satellites, light-ning detection systems and precipitation radarnetworks.Surface data are used in two ways. Time series
of precipitation rates give an indication aboutintensity and duration of precipitation at singlestations. A novel technique of objectively ana-lyzing data from dense observational networksin complex terrain (VERA: Vienna EnhancedResolution Analysis; Steinacker et al. 2000b) isnowadays regularly applied for the Alpine re-gion. In the three hourly analyses of synopticobservations (00, 03,. . ., 21 UTC) the UDC iscompletely contained (cf. http:==www.univie.ac.at=IMG-Wien=vera), while special analysesat the intermediate asynoptic hours are carriedout for sub-regions according to the availabilityof observations.After the launch of Meteosat-8 in 2002, the
first of the Meteosat Second Generation satel-lites, images from a fixed, e.g., geostationaryposition are available at 15min intervals at reso-lutions between 3 and 1 km. The distinct increasein spatial and temporal resolution opens the wayfor automatic tracking procedures of regionaland small scale cloud systems, e.g., in the contextof mesoscale convective complexes (Zinner et al.2008).In a similar fashion data from routine networks
of precipitation radars can be used to assess theextent of precipitation systems and rain bands aswell as for automatic tracking of precipitationcores (Kober and Tafferner 2008). Explorativestudies in the northern Alpine foreland wereundertaken within project HERA (Hagen et al.2000). Blending this information with data froma lightning detection systems helps to identify
the convectively most active cells (Steinackeret al. 2000a). Data for the LPATS=BLIDS sys-tems are used here.
3. The case of 12 August 2004 put in context
Detailed case studies help to shed light on thescales involved in the formation and develop-ment phases of strong precipitating systems aswell as on the data types which were availableat the time of the analyses. The inspection ofprominent cases helps to sharpen the eye ofdevelopers for automatic procedures regardingscale interactions and possible complications.
The combination of an orographically acceler-ated front with strong embedded convection andthe technological state of the late 1980ies can beseen from the analyses of the papal front whichrushed across the north Alpine forelands on 3May 1987 (Volkert et al. 1991 and referencestherein). Mesoscale surface data analyses of windand precipitation rates provided the backbone;reflectivity data from a single radar on film indi-cated the size of the mesoscale convective com-plex; European scale numerical model analysesgave the large scale forcing; high resolutionmodelling including a realistic simulation of pre-cipitation processes was still in its infancy.
The four day precipitation event of 5–8 July1996 was investigated in detail during projectHERA, including hindcast simulations with theDeutschland-Modell, the then operational fore-casting tool of Deutscher Wetterdienst (Keiland Volkert 2000). A comparison concerning24 h precipitation amounts at single stations andthe areal extent of precipitation regions (fromradar imagery) showed promising skill, althoughthe model’s horizontal mesh-size of 14 km wasstill very coarse. Nevertheless a special investi-gation concerned the Isar-Amper watershed up-stream of Freising, a third order catchment in thesouthern part of UDC.
Now we apply current observational and sim-ulation tools for a case of August 2004 when alarge thunderstorm complex was generated oversouthwest Germany ahead of an advancing coldfront. This mesoscale convective complex hada lifetime of some 6 h (1500–2100 UTC). At15 UTC a zone of strong decrease in surfacepressure (�2.5 hPa=3 h) was followed within250 km by a belt of equally fast pressure rise
Development and propagation of severe thunderstorms in the Upper Danube catchment area

(2.5 hPa=3 h). During the rapid movement to-wards the northeast strong wind gusts (up to30m=s) occurred accompanied by an abruptonset of short duration downpours exceeding pre-cipitation rates of 50mm=h (Fig. 3; the zero-val-
ue for Oberpfaffenhofen at 18:00 is likely to be asingle erroneous data-point). The short scalepressure gradient between Munich city andMunich international airport (5.6 hPa=28.6 km�20 hPa=100 km) is a further indicator of thevigour of the system.
When routine surface observations of windand humidity are interpolated on a regular gridby taking into account structure functions thatdepends on the regional topography (Steinackeret al. 2000b), lines of strong convergence of bothmass and moisture can be objectively determined(Fig. 4). The red area to the east of 10�E desig-nates convergence values equivalent to a trans-port of 20 g=kg moisture with 10m=s over100 km. Such zones are prone to fast develop-ment of strong convection and eventually alsoheavy precipitation. Although the absolute pre-cipitation amount was not very significant, thiscase allows well to exemplify the potential of re-mote sensing tools for the detection of potentially
Fig. 3. Quasi-synchronous onset of short durationdownpours at three stations to the southwest of Munichon 12 August 2004
Fig. 4. Objective gridded analysis of surface data (VERA technique) for 17 UTC on 12 August 2004: moisture fluxdivergence in colour in units of 10�7 kg=(kg s), or 10�4 g=(kg s), and surface winds (the vector below the figure indicates10m=s). The white line marks the squall line where winds are converging from opposite directions and likely to triggerstrong vertical motion; the black line designates the boundary of the convective complex (cf. Fig. 5); Munich and Viennaare marked by M and W; the names of rivers in the northern pre-Alpine forelands are given in German
1
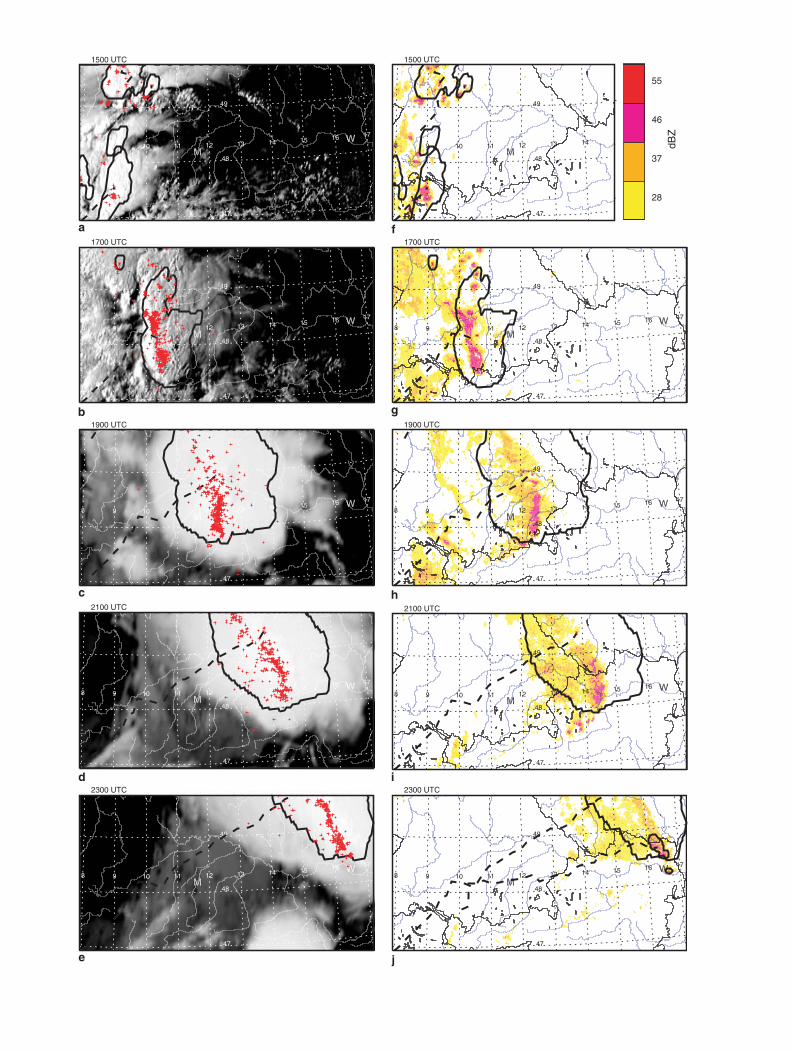
Fig. 5. Development and progression of a precipitating mesoscale convective complex across the upper Danubecatchment during the afternoon of 12 August 2004 as observed by three different observational systems. Left column:cloud structures in the high resolution visible channel (a, b) and water vapour channel (6.2 mm) of Meteosat-8 (c–e; scalesof white) and total lightning within 5 minutes before observation time (crosses). Right column: radar reflectivies ofprecipitation cores (>28 dBZ, scale in f) adapted from the European radar composite of Deutscher Wetterdienst). In allframes thick black lines mark boundaries of convective cells objectively determined from satellite data by Cb-TRAM
at the given time and dashed black lines indicate the paths of the centre of major convective complexes during theprevious hours. In figure j, the boundary of a major precipitation cell as detected by the Rad-TRAM together with thepath during the previous hours is indicated by black lines, too. Rivers and the dotted 1� � 1� grid on a stereographicweather chart projection aid the orientation; M: Munich; W: Wien (Vienna)
A. Tafferner et al.: Development and propagation of severe thunderstorms in the Upper Danube catchment area
dangerous situations. Let us now turn to differentremote sensing systems and their superpositionin a common regional weather chart projection.The development and progression of the top of
cloud systems is routinely monitored through theuse of satellite imagery from the Meteosat sec-ond generation family. Active thunderstorms canbe traced by areal plots of lightning locations,while the extent of precipitation areas is regularlydetermined from reflectivity composites obtainedby precipitation radar networks. Figure 5 com-poses all three kinds of remote sensing data inparallel columns for the eight hour period 15 to23 UTC on 12 August 2004. Black solid linesin all sub-figures a–j mark the boundary of ma-ture convective cells as detected by the cloudtracker Cb-TRAM (Zinner et al. 2008). The de-tection algorithm uses a combination of the in-frared 10.8, the 6.2 mm (water vapour) and thehigh resolution visible channel (HRV) in orderto discriminate three phases of convective cells:initiation, rapid cooling and mature (only theseare shown in Fig. 5). The cloud cells are trackedby using a displacement vector field derived froman image matching procedure (for details thereader is referred to Zinner et al. 2008). The corre-sponding tracks of the cloud centres are markedin Fig. 5 by dashed lines for cells which existlonger than one time step, i.e. 15min. Total light-ning is plotted for all occurrences during the past5min before observation time; e.g. 900 flashesduring the 1655–1700 interval. The superposi-tion of the various data reveals: (i) the convectivecomplexes progressed from south-west to north-east with an average speed of about 65 km=h, (ii)during the first two hours (Fig. 5a, b, f, g) severalsmaller cells merged into one major systemwhich increased in intensity and reached its max-imum at 17 UTC as indicated by the lightningobservation density and radar reflectivity values,(iii) after 17 UTC the system continued to existwith decreased but unchanged intensity until latein the evening (Fig. 5e, j), (iv) the severe precipi-tation only covered small portions of the overallconvective complex, and (v) lightning observa-tions were concentrated in the regions of maxi-mum radar reflectivity, however, single flashesalso occured within the region of the thunder-storm cloud anvil and well within the contourof the Cb-TRAM cell. These observations aremost likely attributable to intra-cloud discharges.
Note that Fig. 5a and b contain as backgroundthe HRV Meteosat-8 image which is also used inCb-TRAM at these times in order to better con-fine the thunderstorm cloud within the convectiveupdraft region (cloud ‘‘roughness’’ in the HRV).At later times, i.e. after sunset within the domaintreated by Cb-TRAM, the HRV channel cannotbe used and, thus, the detected cloud region getsenlarged. High precipitation cores with reflectiv-ity greater than 37 dBZ are almost always foundwell within the convective clouds as detected byCb-TRAM. There are some areas with reflectiv-ity exceeding 37 dBZ which are not covered byCb-TRAM clouds. Those are, however, also lack-ing lighting observations. Remarkably, the con-vective features can be tracked for long timeintervals. Figure 5j shows the combined resultfrom cloud and radar trackers, the latter appliedwith a threshold of 37 dBZ. Apparently, bothtrackers were able to trace the cloud complexand the precipitation cell in parallel for morethan 6 h during their propagation through theUDC. Rad-TRAM uses the same tracking algo-rithm as the cloud tracker, with the Europeanradar composite as data base (details in Sect. 4.2and in Kober and Tafferner 2008).
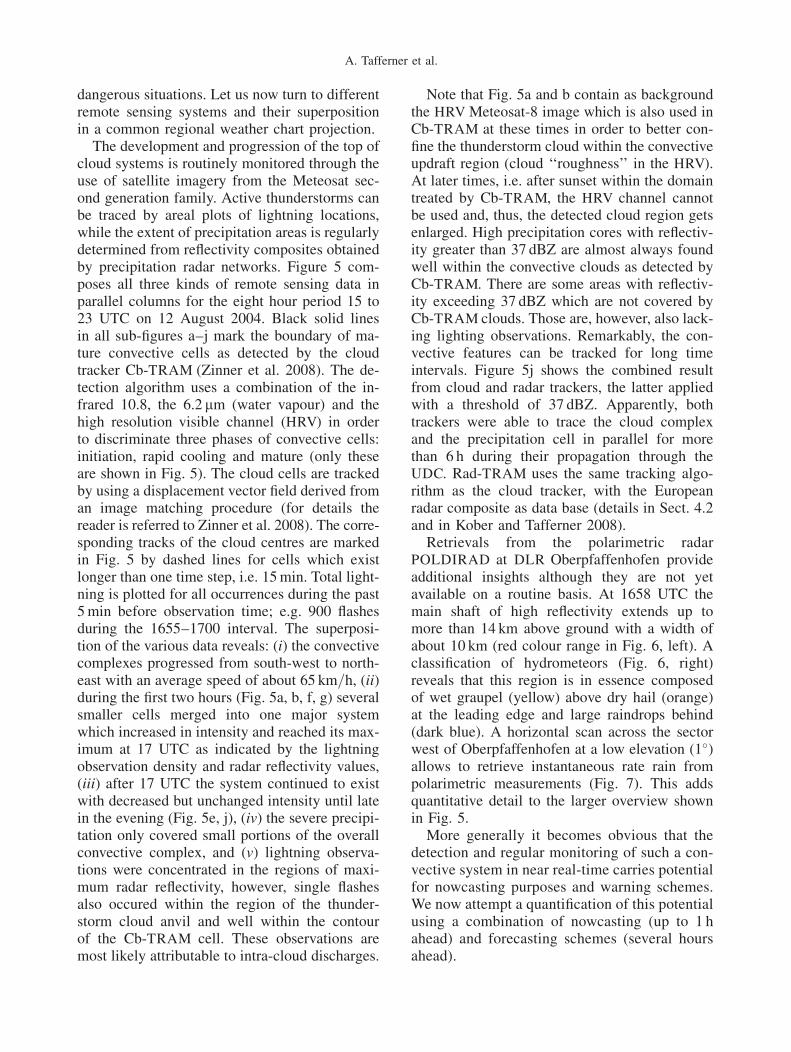
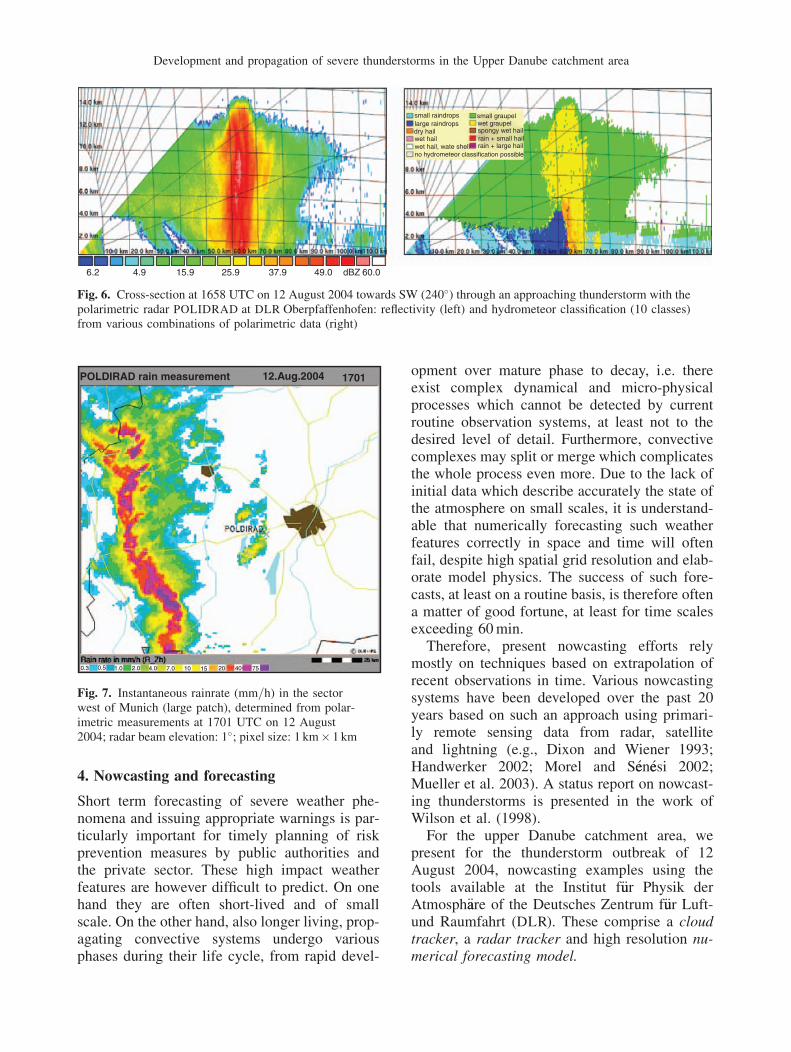
Retrievals from the polarimetric radarPOLDIRAD at DLR Oberpfaffenhofen provideadditional insights although they are not yetavailable on a routine basis. At 1658 UTC themain shaft of high reflectivity extends up tomore than 14 km above ground with a width ofabout 10 km (red colour range in Fig. 6, left). Aclassification of hydrometeors (Fig. 6, right)reveals that this region is in essence composedof wet graupel (yellow) above dry hail (orange)at the leading edge and large raindrops behind(dark blue). A horizontal scan across the sectorwest of Oberpfaffenhofen at a low elevation (1�)allows to retrieve instantaneous rate rain frompolarimetric measurements (Fig. 7). This addsquantitative detail to the larger overview shownin Fig. 5.
More generally it becomes obvious that thedetection and regular monitoring of such a con-vective system in near real-time carries potentialfor nowcasting purposes and warning schemes.We now attempt a quantification of this potentialusing a combination of nowcasting (up to 1 hahead) and forecasting schemes (several hoursahead).
A. Tafferner et al.
4. Nowcasting and forecasting
Short term forecasting of severe weather phe-nomena and issuing appropriate warnings is par-ticularly important for timely planning of riskprevention measures by public authorities andthe private sector. These high impact weatherfeatures are however difficult to predict. On onehand they are often short-lived and of smallscale. On the other hand, also longer living, prop-agating convective systems undergo variousphases during their life cycle, from rapid devel-
opment over mature phase to decay, i.e. thereexist complex dynamical and micro-physicalprocesses which cannot be detected by currentroutine observation systems, at least not to thedesired level of detail. Furthermore, convectivecomplexes may split or merge which complicatesthe whole process even more. Due to the lack ofinitial data which describe accurately the state ofthe atmosphere on small scales, it is understand-able that numerically forecasting such weatherfeatures correctly in space and time will oftenfail, despite high spatial grid resolution and elab-orate model physics. The success of such fore-casts, at least on a routine basis, is therefore oftena matter of good fortune, at least for time scalesexceeding 60min.
Therefore, present nowcasting efforts relymostly on techniques based on extrapolation ofrecent observations in time. Various nowcastingsystems have been developed over the past 20years based on such an approach using primari-ly remote sensing data from radar, satelliteand lightning (e.g., Dixon and Wiener 1993;Handwerker 2002; Morel and S�een�eesi 2002;Mueller et al. 2003). A status report on nowcast-ing thunderstorms is presented in the work ofWilson et al. (1998).
For the upper Danube catchment area, wepresent for the thunderstorm outbreak of 12August 2004, nowcasting examples using thetools available at the Institut f€uur Physik derAtmosph€aare of the Deutsches Zentrum f€uur Luft-und Raumfahrt (DLR). These comprise a cloudtracker, a radar tracker and high resolution nu-merical forecasting model.
Fig. 7. Instantaneous rainrate (mm=h) in the sectorwest of Munich (large patch), determined from polar-imetric measurements at 1701 UTC on 12 August2004; radar beam elevation: 1�; pixel size: 1 km� 1 km
Fig. 6. Cross-section at 1658 UTC on 12 August 2004 towards SW (240�) through an approaching thunderstorm with thepolarimetric radar POLIDRAD at DLR Oberpfaffenhofen: reflectivity (left) and hydrometeor classification (10 classes)from various combinations of polarimetric data (right)
Development and propagation of severe thunderstorms in the Upper Danube catchment area
4.1 Nowcasting with the cloud tracker
The cloud tracker Cb-TRAM is not only used fortracking and monitoring convective clouds, butalso to extrapolate the cloud’s position and sizeup to one hour ahead in time by applying a dis-placement vector field of an area-based imagematcher. This vector field, defined at each pixelposition of the image and often called ‘‘opticalflow’’, describes the warping of one image intothe subsequent one in such a way that either thedifference of the image intensities is minimised(classical optical flow; used here in Cb-TRAM)or that the local correlation is maximised (Zinneret al. 2008). As an example we show CB-TRAM
results for the thunderstorm propagating acrossthe upper Danube catchment in the afternoon of
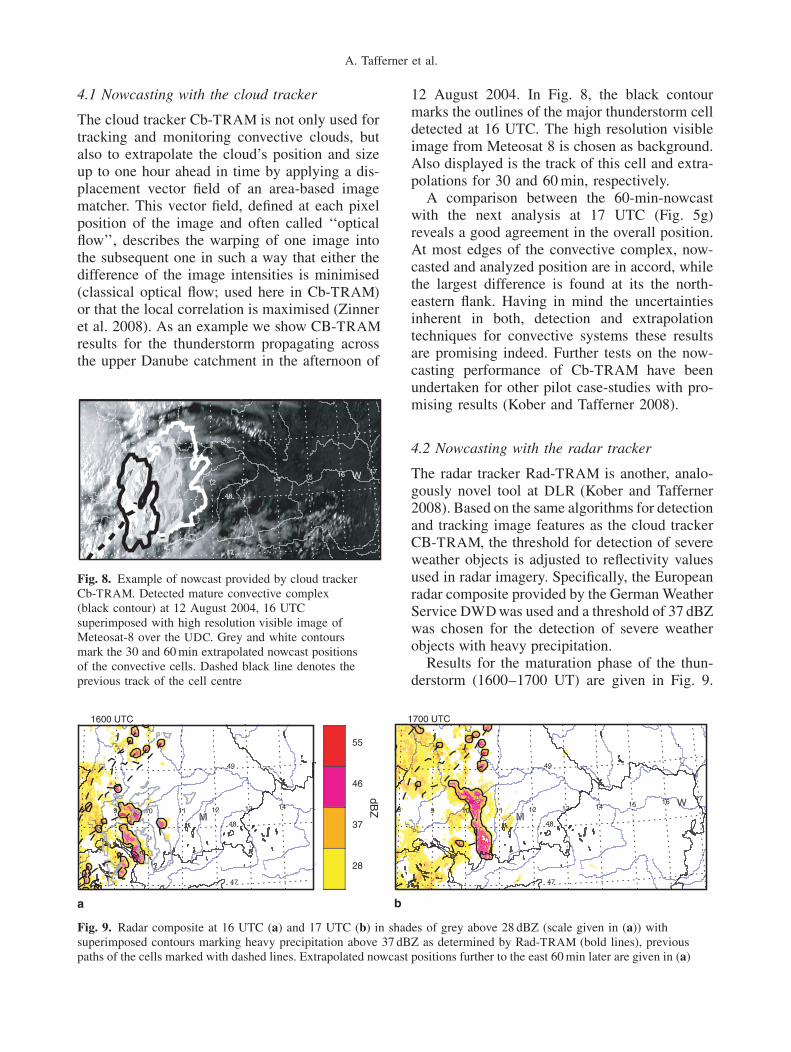
12 August 2004. In Fig. 8, the black contourmarks the outlines of the major thunderstorm celldetected at 16 UTC. The high resolution visibleimage from Meteosat 8 is chosen as background.Also displayed is the track of this cell and extra-polations for 30 and 60min, respectively.
A comparison between the 60-min-nowcastwith the next analysis at 17 UTC (Fig. 5g)reveals a good agreement in the overall position.At most edges of the convective complex, now-casted and analyzed position are in accord, whilethe largest difference is found at its the north-eastern flank. Having in mind the uncertaintiesinherent in both, detection and extrapolationtechniques for convective systems these resultsare promising indeed. Further tests on the now-casting performance of Cb-TRAM have beenundertaken for other pilot case-studies with pro-mising results (Kober and Tafferner 2008).
4.2 Nowcasting with the radar tracker
The radar tracker Rad-TRAM is another, analo-gously novel tool at DLR (Kober and Tafferner2008). Based on the same algorithms for detectionand tracking image features as the cloud trackerCB-TRAM, the threshold for detection of severeweather objects is adjusted to reflectivity valuesused in radar imagery. Specifically, the Europeanradar composite provided by the GermanWeatherService DWDwas used and a threshold of 37 dBZwas chosen for the detection of severe weatherobjects with heavy precipitation.
Results for the maturation phase of the thun-derstorm (1600–1700 UT) are given in Fig. 9.
Fig. 8. Example of nowcast provided by cloud trackerCb-TRAM. Detected mature convective complex(black contour) at 12 August 2004, 16 UTCsuperimposed with high resolution visible image ofMeteosat-8 over the UDC. Grey and white contoursmark the 30 and 60min extrapolated nowcast positionsof the convective cells. Dashed black line denotes theprevious track of the cell centre
Fig. 9. Radar composite at 16 UTC (a) and 17 UTC (b) in shades of grey above 28 dBZ (scale given in (a)) withsuperimposed contours marking heavy precipitation above 37 dBZ as determined by Rad-TRAM (bold lines), previouspaths of the cells marked with dashed lines. Extrapolated nowcast positions further to the east 60min later are given in (a)
A. Tafferner et al.
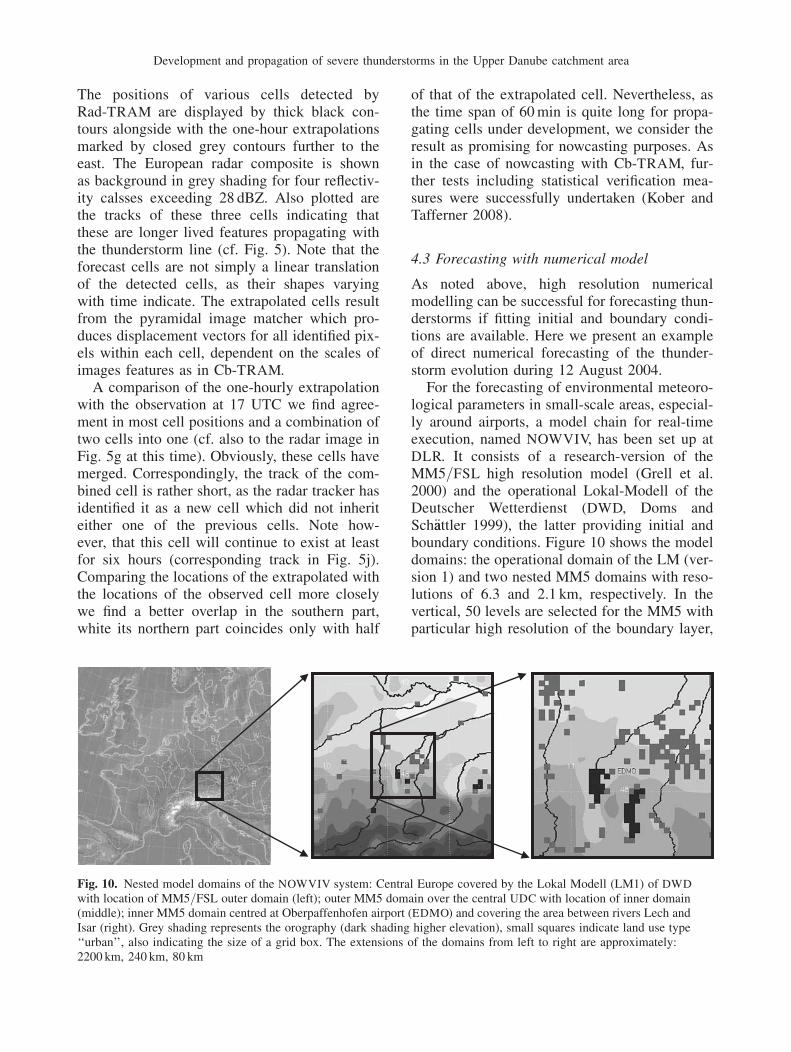
The positions of various cells detected byRad-TRAM are displayed by thick black con-tours alongside with the one-hour extrapolationsmarked by closed grey contours further to theeast. The European radar composite is shownas background in grey shading for four reflectiv-ity calsses exceeding 28 dBZ. Also plotted arethe tracks of these three cells indicating thatthese are longer lived features propagating withthe thunderstorm line (cf. Fig. 5). Note that theforecast cells are not simply a linear translationof the detected cells, as their shapes varyingwith time indicate. The extrapolated cells resultfrom the pyramidal image matcher which pro-duces displacement vectors for all identified pix-els within each cell, dependent on the scales ofimages features as in Cb-TRAM.A comparison of the one-hourly extrapolation
with the observation at 17 UTC we find agree-ment in most cell positions and a combination oftwo cells into one (cf. also to the radar image inFig. 5g at this time). Obviously, these cells havemerged. Correspondingly, the track of the com-bined cell is rather short, as the radar tracker hasidentified it as a new cell which did not inheriteither one of the previous cells. Note how-ever, that this cell will continue to exist at leastfor six hours (corresponding track in Fig. 5j).Comparing the locations of the extrapolated withthe locations of the observed cell more closelywe find a better overlap in the southern part,white its northern part coincides only with half
of that of the extrapolated cell. Nevertheless, asthe time span of 60min is quite long for propa-gating cells under development, we consider theresult as promising for nowcasting purposes. Asin the case of nowcasting with Cb-TRAM, fur-ther tests including statistical verification mea-sures were successfully undertaken (Kober andTafferner 2008).
4.3 Forecasting with numerical model
As noted above, high resolution numericalmodelling can be successful for forecasting thun-derstorms if fitting initial and boundary condi-tions are available. Here we present an exampleof direct numerical forecasting of the thunder-storm evolution during 12 August 2004.
For the forecasting of environmental meteoro-logical parameters in small-scale areas, especial-ly around airports, a model chain for real-timeexecution, named NOWVIV, has been set up atDLR. It consists of a research-version of theMM5=FSL high resolution model (Grell et al.2000) and the operational Lokal-Modell of theDeutscher Wetterdienst (DWD, Doms andSch€aattler 1999), the latter providing initial andboundary conditions. Figure 10 shows the modeldomains: the operational domain of the LM (ver-sion 1) and two nested MM5 domains with reso-lutions of 6.3 and 2.1 km, respectively. In thevertical, 50 levels are selected for the MM5 withparticular high resolution of the boundary layer,
Fig. 10. Nested model domains of the NOWVIV system: Central Europe covered by the Lokal Modell (LM1) of DWD
with location of MM5=FSL outer domain (left); outer MM5 domain over the central UDC with location of inner domain(middle); inner MM5 domain centred at Oberpaffenhofen airport (EDMO) and covering the area between rivers Lech andIsar (right). Grey shading represents the orography (dark shading higher elevation), small squares indicate land use type‘‘urban’’, also indicating the size of a grid box. The extensions of the domains from left to right are approximately:2200 km, 240 km, 80 km
Development and propagation of severe thunderstorms in the Upper Danube catchment area
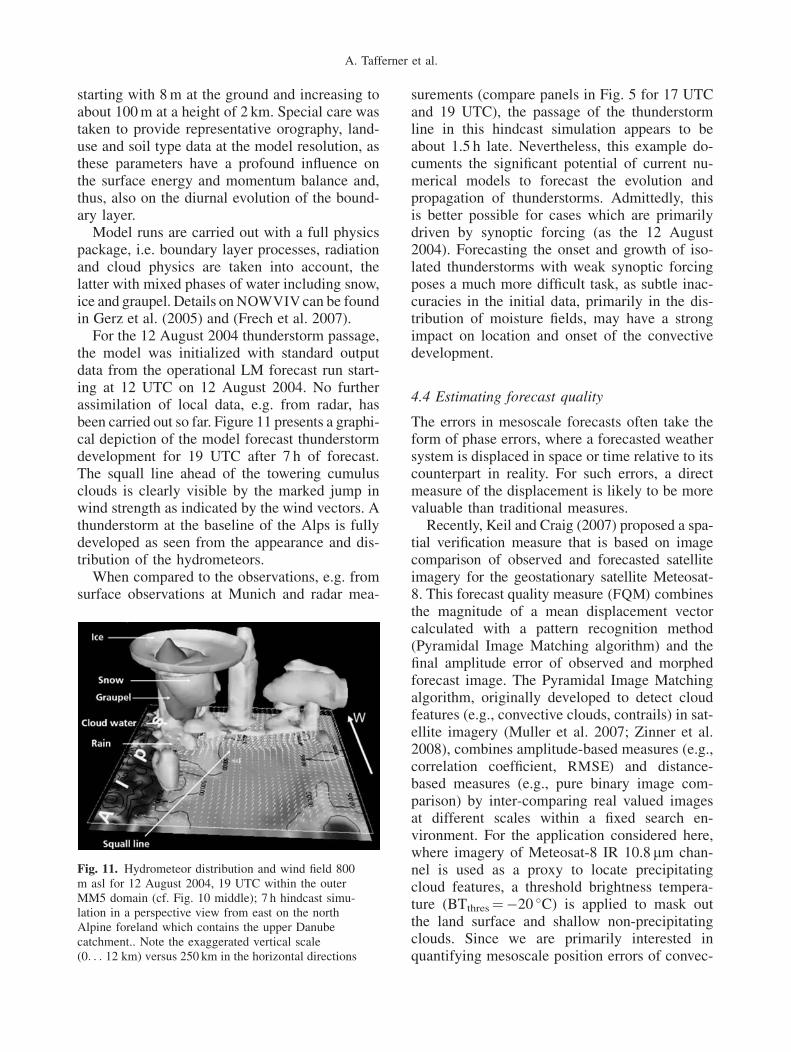
starting with 8m at the ground and increasing toabout 100m at a height of 2 km. Special care wastaken to provide representative orography, land-use and soil type data at the model resolution, asthese parameters have a profound influence onthe surface energy and momentum balance and,thus, also on the diurnal evolution of the bound-ary layer.Model runs are carried out with a full physics
package, i.e. boundary layer processes, radiationand cloud physics are taken into account, thelatter with mixed phases of water including snow,ice and graupel. Details on NOWVIVcan be foundin Gerz et al. (2005) and (Frech et al. 2007).For the 12 August 2004 thunderstorm passage,
the model was initialized with standard outputdata from the operational LM forecast run start-ing at 12 UTC on 12 August 2004. No furtherassimilation of local data, e.g. from radar, hasbeen carried out so far. Figure 11 presents a graphi-cal depiction of the model forecast thunderstormdevelopment for 19 UTC after 7 h of forecast.The squall line ahead of the towering cumulusclouds is clearly visible by the marked jump inwind strength as indicated by the wind vectors. Athunderstorm at the baseline of the Alps is fullydeveloped as seen from the appearance and dis-tribution of the hydrometeors.When compared to the observations, e.g. from
surface observations at Munich and radar mea-
surements (compare panels in Fig. 5 for 17 UTCand 19 UTC), the passage of the thunderstormline in this hindcast simulation appears to beabout 1.5 h late. Nevertheless, this example do-cuments the significant potential of current nu-merical models to forecast the evolution andpropagation of thunderstorms. Admittedly, thisis better possible for cases which are primarilydriven by synoptic forcing (as the 12 August2004). Forecasting the onset and growth of iso-lated thunderstorms with weak synoptic forcingposes a much more difficult task, as subtle inac-curacies in the initial data, primarily in the dis-tribution of moisture fields, may have a strongimpact on location and onset of the convectivedevelopment.
4.4 Estimating forecast quality
The errors in mesoscale forecasts often take theform of phase errors, where a forecasted weathersystem is displaced in space or time relative to itscounterpart in reality. For such errors, a directmeasure of the displacement is likely to be morevaluable than traditional measures.
Recently, Keil and Craig (2007) proposed a spa-tial verification measure that is based on imagecomparison of observed and forecasted satelliteimagery for the geostationary satellite Meteosat-8. This forecast quality measure (FQM) combinesthe magnitude of a mean displacement vectorcalculated with a pattern recognition method(Pyramidal Image Matching algorithm) and thefinal amplitude error of observed and morphedforecast image. The Pyramidal Image Matchingalgorithm, originally developed to detect cloudfeatures (e.g., convective clouds, contrails) in sat-ellite imagery (Muller et al. 2007; Zinner et al.2008), combines amplitude-based measures (e.g.,correlation coefficient, RMSE) and distance-based measures (e.g., pure binary image com-parison) by inter-comparing real valued imagesat different scales within a fixed search en-vironment. For the application considered here,where imagery of Meteosat-8 IR 10.8 mm chan-nel is used as a proxy to locate precipitatingcloud features, a threshold brightness tempera-ture (BTthres¼�20 �C) is applied to mask outthe land surface and shallow non-precipitatingclouds. Since we are primarily interested inquantifying mesoscale position errors of convec-
Fig. 11. Hydrometeor distribution and wind field 800m asl for 12 August 2004, 19 UTC within the outerMM5 domain (cf. Fig. 10 middle); 7 h hindcast simu-lation in a perspective view from east on the northAlpine foreland which contains the upper Danubecatchment.. Note the exaggerated vertical scale(0. . . 12 km) versus 250 km in the horizontal directions
A. Tafferner et al.
tive storms that may occur in similar synopticenvironments, the coarsest matching scale is con-fined to sub-synoptic distances of at most a fewhundred kilometers. A forecasted and an observedfeature that are closer than this distance will beconsidered to be the same feature, but displaced inspace (and a displacement vector will be comput-ed), whereas features separated by larger distanceswill be assumed to be unrelated.A displacement vector field is computed which
morphs the simulated image into a best match ofthe observed image. The magnitude of the meandisplacement vector gives some indication of theforecast quality, provided that there are featuresin the fields available to be matched. This infor-mation is combined with an amplitude error ofobserved and morphed forecast brightness tem-peratures, which gives an indication of whetherthere are cloud features that have in fact beenmatched. The metric FQM attains zero for a‘‘perfect’’ forecast.Here the FQM is applied evaluating mesoscale
forecasts performed with the non-hydrostatic
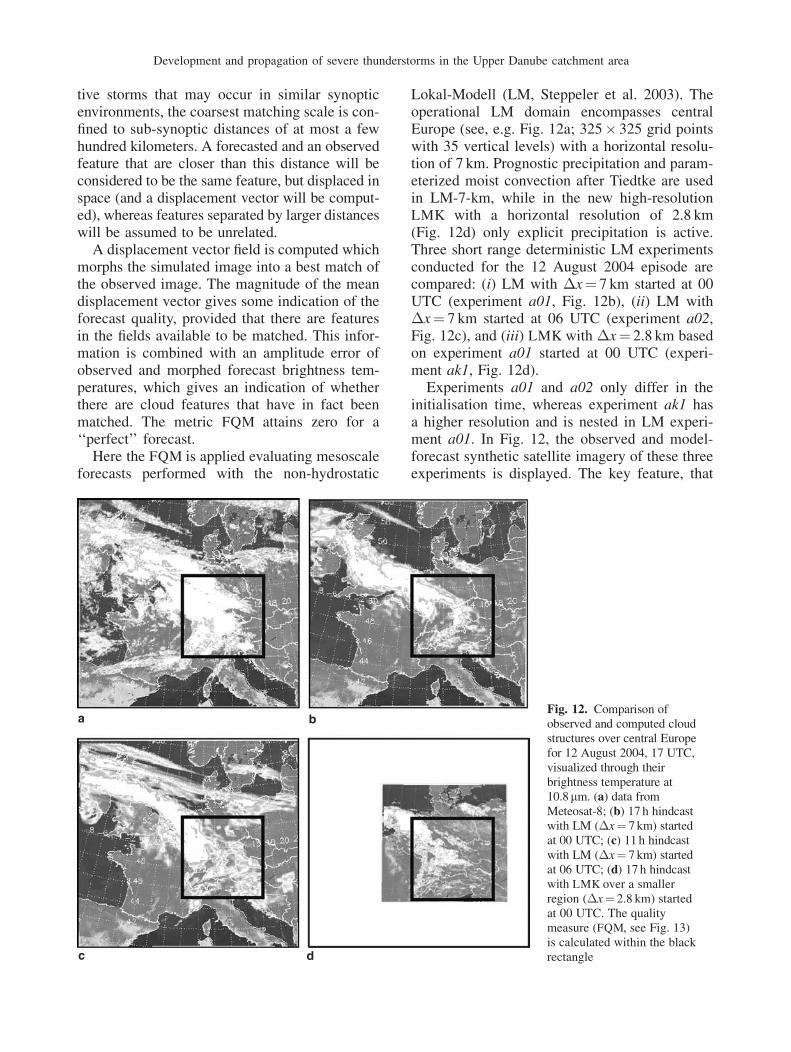
Lokal-Modell (LM, Steppeler et al. 2003). Theoperational LM domain encompasses centralEurope (see, e.g. Fig. 12a; 325� 325 grid pointswith 35 vertical levels) with a horizontal resolu-tion of 7 km. Prognostic precipitation and param-eterized moist convection after Tiedtke are usedin LM-7-km, while in the new high-resolutionLMK with a horizontal resolution of 2.8 km(Fig. 12d) only explicit precipitation is active.Three short range deterministic LM experimentsconducted for the 12 August 2004 episode arecompared: (i) LM with �x¼ 7 km started at 00UTC (experiment a01, Fig. 12b), (ii) LM with�x¼ 7 km started at 06 UTC (experiment a02,Fig. 12c), and (iii) LMK with �x¼ 2.8 km basedon experiment a01 started at 00 UTC (experi-ment ak1, Fig. 12d).
Experiments a01 and a02 only differ in theinitialisation time, whereas experiment ak1 hasa higher resolution and is nested in LM experi-ment a01. In Fig. 12, the observed and model-forecast synthetic satellite imagery of these threeexperiments is displayed. The key feature, that
Fig. 12. Comparison ofobserved and computed cloudstructures over central Europefor 12 August 2004, 17 UTC,visualized through theirbrightness temperature at10.8mm. (a) data fromMeteosat-8; (b) 17 h hindcastwith LM (�x¼ 7 km) startedat 00 UTC; (c) 11 h hindcastwith LM (�x¼ 7 km) startedat 06 UTC; (d) 17 h hindcastwith LMK over a smallerregion (�x¼ 2.8 km) startedat 00 UTC. The qualitymeasure (FQM, see Fig. 13)is calculated within the blackrectangle
Development and propagation of severe thunderstorms in the Upper Danube catchment area

is the cloud system extending from the BritishIsles to the Alps as shown in the observation(Fig. 12a), is reproduced in all experiments.However, LM underestimates the cloud amountand, particularly, the pre-frontal convective clouds.The position and orientation of the cloud systemis best captured in LM experiment a01 (Fig. 12b)exhibiting convective pre-frontal clouds acrossBavaria at 17 UT. LM experiment a02 (Fig. 12c)produces more clouds than a01, but the weathersystem is slightly lagging behind the observedposition and, consequently, compares worsewith satellite observations. LMK experimentak1 (Fig. 12d), despite operating at higher reso-lution, strongly underestimates the developmentof convection between the river Danube and theAlps in southern Bavaria resulting in a mismatchwith satellite observation in that region, whereasthe location of the cold front along the FrenchGerman border is nicely reproduced. Calculatingthe forecast quality measure confirms this visualsubjective evaluation.In Fig. 13, a time series of the FQM is depicted
for the period 12 to 23 UTC on 12 Aug 2004. LMexperiment a01 is generally better than a02,whereas ak1 gives slightly lower values. Accord-ing to FQM, experiment a01 is better than a02 at17 UTC, while the errors in ak1 compensate inthe 900� 900 km2 region (bad forecast of con-vection, good forecast of cold front) giving asimilar value as for experiment a02. All FQM
values of the three short-range forecasts peak at
17 UTC indicate the well-known difficulty ofmesoscale models to reproduce the spatio-tempo-ral evolution of strong summertime convectiveactivity.
Summarizing, the new quality measure basedon image matching of observed and syntheticsatellite data provides an objective measure toestimate forecast quality which can be appliedto evaluate different numerical forecasts fora certain weather event, which has to containclouds.
5. Potential of an integrated system
In the previous chapters, we demonstrated howindividual cells within a propagating thunder-storm line can be monitored by satellite, radarand lightning data, nowcasted by the cloud andradar trackers CB-TRAM and Rad-TRAM andforecasted by high-resolution numerical weatherprediction models. Furthermore, algorithms areable to derive rain rate and hydrometeor typefrom radar observations.
Generally these tools have been designed indi-vidually for a particular purpose independent ofone another. Combining these within one integrat-ed system can be expected to provide a greatlyenhanced benefit in monitoring and nowcastingcapability, i.e. an integrated system can processand contrast the assertions of the individual tools,e.g. as regards to the exact location of a particularweather system, its intensity and movement, andthus provide a more reliable assertion of the futurestate of a weather system as when only one datasource or nowcasting tool were used.
Integrated systems have already been in-stalled for particular purposes, e.g. for providingweather informational products for improvingair terminal planning as realized in the Inte-grated Terminal Weather System (ITWS) forseveral US airports (Evans and Ducot 1994). Aco-operation among the weather services ofGermany, Switzerland, Denmark and Canada hasbeen established to design a workstation basedinteractive graphical user interface for the dis-play of all kind of meteorological data includingthe output from numerical models and nowcast-ing applications (Koppert 2002). This system,named NINJO, has meanwhile been establishedat forecasting offices in Germany. For nowcast-ing significant weather objects, the blending
Fig. 13. Time series of forecast quality measure(FQM) during the second half of 12 August 2004 forthree deterministic simulations of the Lokal Modell (LM)evaluated for the marked area indicated in Fig. 12
A. Tafferner et al.
of data from surface observations and from theFrench radar network has been realized at Meteo-France within an operational environment al-lowing also forecaster expertise incorporation(S�een�eesi et al. 2004). At DLR, a data fusion con-cept has been used for setting up and opera-tionally implementing a system for diagnosing
atmospheric conditions for aircraft icing bycombining surface and radar observations withforecast profiles of temperature and humidity(Tafferner et al. 2003).
Before describing the proposed integrated sys-tem, parts of which are already realized at DLR,we provide a complete summary of all tools in
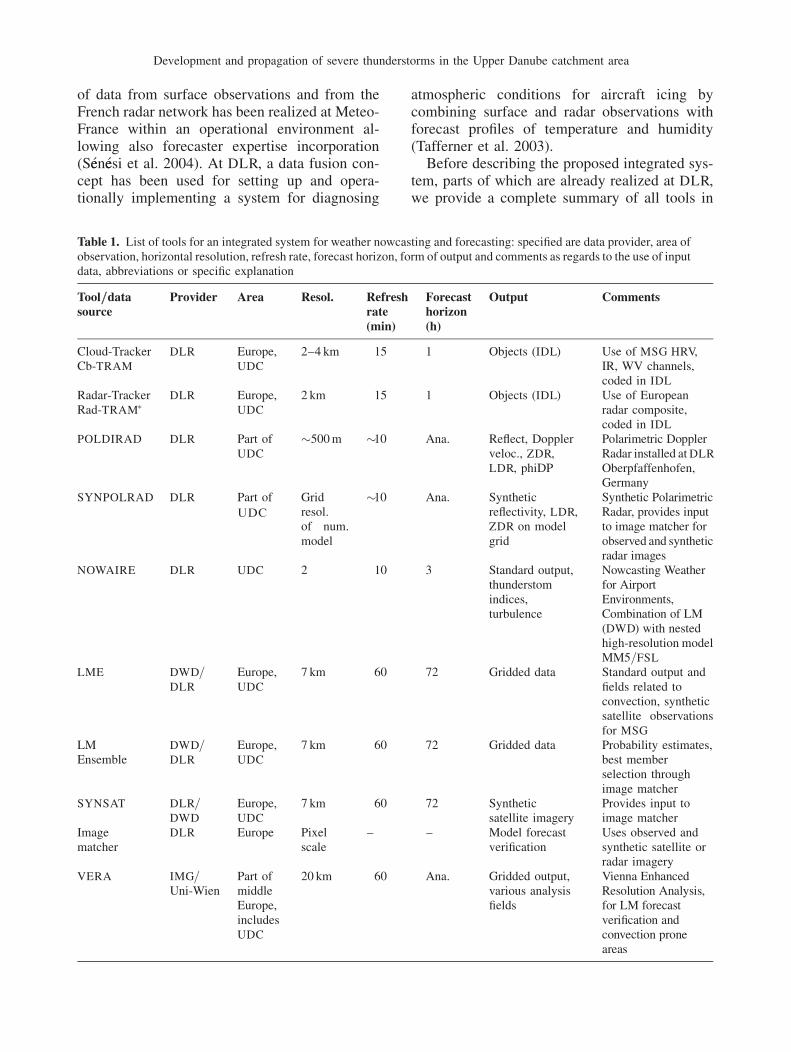
Table 1. List of tools for an integrated system for weather nowcasting and forecasting: specified are data provider, area ofobservation, horizontal resolution, refresh rate, forecast horizon, form of output and comments as regards to the use of inputdata, abbreviations or specific explanation
Tool==datasource
Provider Area Resol. Refreshrate(min)
Forecasthorizon(h)
Output Comments
Cloud-TrackerCb-TRAM
DLR Europe,UDC
2–4 km 15 1 Objects (IDL) Use of MSG HRV,IR, WV channels,coded in IDL
Radar-TrackerRad-TRAM�
DLR Europe,UDC
2 km 15 1 Objects (IDL) Use of Europeanradar composite,coded in IDL
POLDIRAD DLR Part ofUDC
�500m �10 Ana. Reflect, Dopplerveloc., ZDR,LDR, phiDP
Polarimetric DopplerRadar installed at DLR
Oberpfaffenhofen,Germany
SYNPOLRAD DLR Part of
UDC
Gridresol.of num.model
�10 Ana. Syntheticreflectivity, LDR,ZDR on modelgrid
Synthetic PolarimetricRadar, provides inputto image matcher forobserved and syntheticradar images
NOWAIRE DLR UDC 2 10 3 Standard output,thunderstomindices,turbulence
Nowcasting Weatherfor AirportEnvironments,Combination of LM(DWD) with nestedhigh-resolution modelMM5=FSL
LME DWD=DLR
Europe,UDC
7 km 60 72 Gridded data Standard output andfields related toconvection, syntheticsatellite observationsfor MSG
LMEnsemble
DWD=DLR
Europe,UDC
7 km 60 72 Gridded data Probability estimates,best memberselection throughimage matcher
SYNSAT DLR=DWD
Europe,UDC
7 km 60 72 Syntheticsatellite imagery
Provides input toimage matcher
Imagematcher
DLR Europe Pixelscale
– – Model forecastverification
Uses observed andsynthetic satellite orradar imagery
VERA IMG=Uni-Wien
Part ofmiddleEurope,includesUDC
20 km 60 Ana. Gridded output,various analysisfields
Vienna EnhancedResolution Analysis,for LM forecastverification andconvection proneareas
Development and propagation of severe thunderstorms in the Upper Danube catchment area
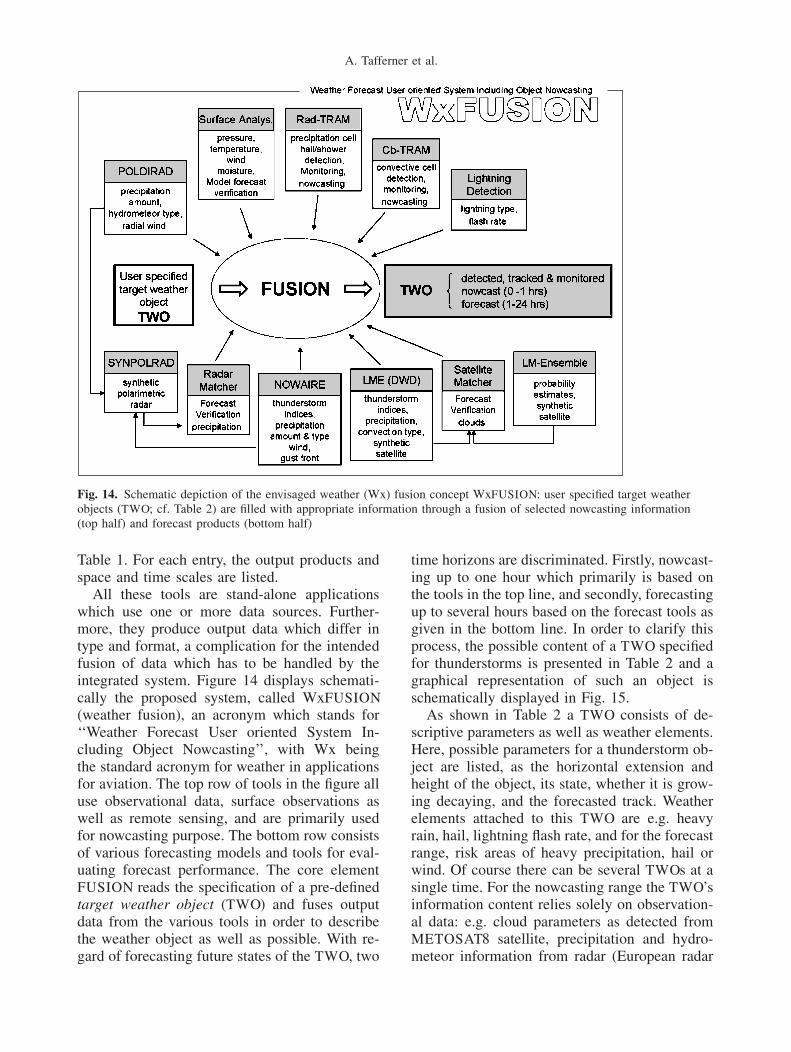
Table 1. For each entry, the output products andspace and time scales are listed.All these tools are stand-alone applications
which use one or more data sources. Further-more, they produce output data which differ intype and format, a complication for the intendedfusion of data which has to be handled by theintegrated system. Figure 14 displays schemati-cally the proposed system, called WxFUSION
(weather fusion), an acronym which stands for‘‘Weather Forecast User oriented System In-cluding Object Nowcasting’’, with Wx beingthe standard acronym for weather in applicationsfor aviation. The top row of tools in the figure alluse observational data, surface observations aswell as remote sensing, and are primarily usedfor nowcasting purpose. The bottom row consistsof various forecasting models and tools for eval-uating forecast performance. The core elementFUSION reads the specification of a pre-definedtarget weather object (TWO) and fuses outputdata from the various tools in order to describethe weather object as well as possible. With re-gard of forecasting future states of the TWO, two
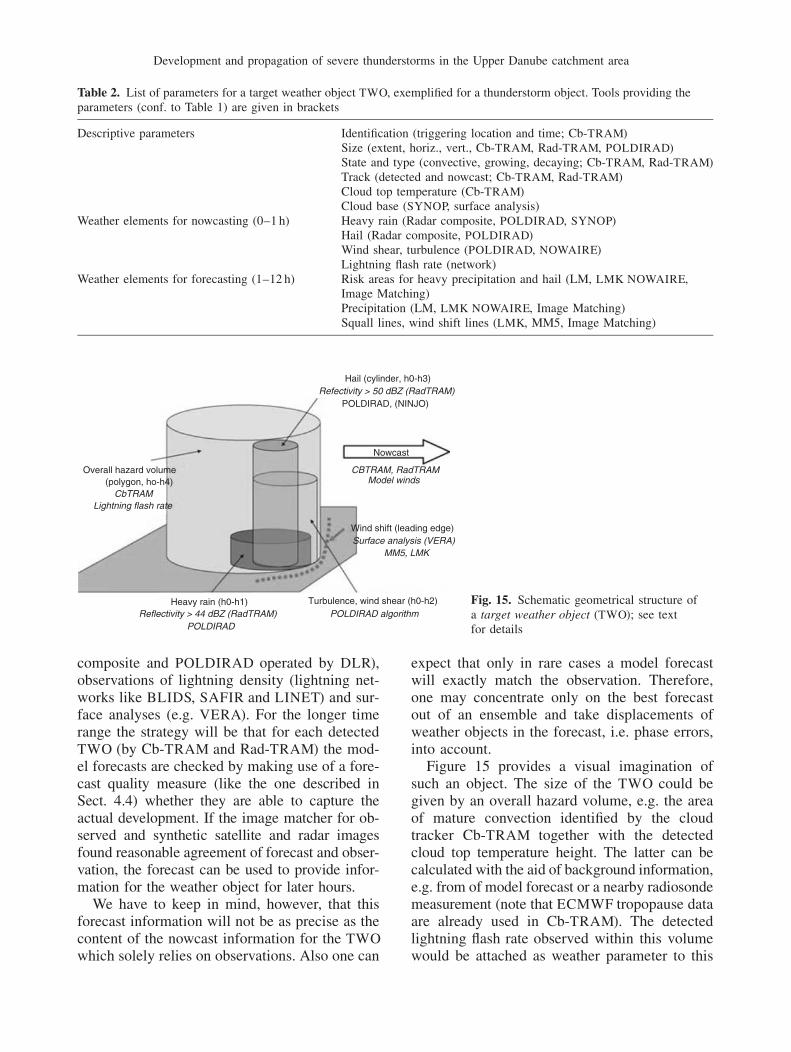
time horizons are discriminated. Firstly, nowcast-ing up to one hour which primarily is based onthe tools in the top line, and secondly, forecastingup to several hours based on the forecast tools asgiven in the bottom line. In order to clarify thisprocess, the possible content of a TWO specifiedfor thunderstorms is presented in Table 2 and agraphical representation of such an object isschematically displayed in Fig. 15.
As shown in Table 2 a TWO consists of de-scriptive parameters as well as weather elements.Here, possible parameters for a thunderstorm ob-ject are listed, as the horizontal extension andheight of the object, its state, whether it is grow-ing decaying, and the forecasted track. Weatherelements attached to this TWO are e.g. heavyrain, hail, lightning flash rate, and for the forecastrange, risk areas of heavy precipitation, hail orwind. Of course there can be several TWOs at asingle time. For the nowcasting range the TWO’sinformation content relies solely on observation-al data: e.g. cloud parameters as detected fromMETOSAT8 satellite, precipitation and hydro-meteor information from radar (European radar
Fig. 14. Schematic depiction of the envisaged weather (Wx) fusion concept WxFUSION: user specified target weatherobjects (TWO; cf. Table 2) are filled with appropriate information through a fusion of selected nowcasting information(top half) and forecast products (bottom half)
A. Tafferner et al.
composite and POLDIRAD operated by DLR),observations of lightning density (lightning net-works like BLIDS, SAFIR and LINET) and sur-face analyses (e.g. VERA). For the longer timerange the strategy will be that for each detectedTWO (by Cb-TRAM and Rad-TRAM) the mod-el forecasts are checked by making use of a fore-cast quality measure (like the one described inSect. 4.4) whether they are able to capture theactual development. If the image matcher for ob-served and synthetic satellite and radar imagesfound reasonable agreement of forecast and obser-vation, the forecast can be used to provide infor-mation for the weather object for later hours.We have to keep in mind, however, that this
forecast information will not be as precise as thecontent of the nowcast information for the TWO
which solely relies on observations. Also one can
expect that only in rare cases a model forecastwill exactly match the observation. Therefore,one may concentrate only on the best forecastout of an ensemble and take displacements ofweather objects in the forecast, i.e. phase errors,into account.
Figure 15 provides a visual imagination ofsuch an object. The size of the TWO could begiven by an overall hazard volume, e.g. the areaof mature convection identified by the cloudtracker Cb-TRAM together with the detectedcloud top temperature height. The latter can becalculated with the aid of background information,e.g. from of model forecast or a nearby radiosondemeasurement (note that ECMWF tropopause dataare already used in Cb-TRAM). The detectedlightning flash rate observed within this volumewould be attached as weather parameter to this
Fig. 15. Schematic geometrical structure ofa target weather object (TWO); see textfor details
Table 2. List of parameters for a target weather object TWO, exemplified for a thunderstorm object. Tools providing theparameters (conf. to Table 1) are given in brackets
Descriptive parameters Identification (triggering location and time; Cb-TRAM)Size (extent, horiz., vert., Cb-TRAM, Rad-TRAM, POLDIRAD)State and type (convective, growing, decaying; Cb-TRAM, Rad-TRAM)Track (detected and nowcast; Cb-TRAM, Rad-TRAM)Cloud top temperature (Cb-TRAM)Cloud base (SYNOP, surface analysis)
Weather elements for nowcasting (0–1 h) Heavy rain (Radar composite, POLDIRAD, SYNOP)Hail (Radar composite, POLDIRAD)Wind shear, turbulence (POLDIRAD, NOWAIRE)Lightning flash rate (network)
Weather elements for forecasting (1–12 h) Risk areas for heavy precipitation and hail (LM, LMK NOWAIRE,Image Matching)Precipitation (LM, LMK NOWAIRE, Image Matching)Squall lines, wind shift lines (LMK, MM5, Image Matching)
Development and propagation of severe thunderstorms in the Upper Danube catchment area
volume. Inside the overall hazard volume, obser-vations of polarimetric radar will allow to deter-mine finer scale volumes, as for hail, turbulenceand heavy precipitation. Here, of course, certainthresholds have to be prescribed, e.g. as indicatedin the figure for the hail volume. Furthermore,the leading edge of a moving thunderstorm sys-tem could be identified from surface analysesor high resolution model forecasts. Such a lineis drawn in Fig. 4 deduced from the surfaceanalysis of wind in the VERA system. All databelonging to one TWO can be packed into aspecified format, ideally one which is well suitedfor objects, e.g. BUFR or XML, and distributedto users.Of course, WxFUSIOM can also make use of
redundant information, e.g. forecast tracks of thecloud and the radar tracker. If the tracks agree,the future positions of the TWO can be forecastedfor the next hour with high confidence. Also prob-abilistic measures may be assigned to the tracks orfuture positions. As the image matching tool iden-tifies forecast errors (cf. Sect. 4.4) it could be usedto assign a confidence value to the current modelforecast. A highly useful application of this tech-nique would also be to determine the best forecastout of an ensemble as described in Tafferner et al.(2002) and then take the output of this forecast forthe extended forecast range, e.g. rain amount,wind strength, and convective activity. Forecastquality can also be estimated from the VERA
analyses which provide difference charts betweenobservation and the forecast and can, therefore,determine phase shifts.In summary, a sophisticated combination of
the tools and data within the integrated systemWxFUSION should allow to detect and monitorspecified target weather objects and to estimatetheir geometric and weather related parameters.Future states of the weather objects up to onehour are provided by the nowcasting tools, e.g.in time intervals of 15min and with an updaterate of 15min, the latter being dependent on theavailability of satellite and radar data. As thequality of forecast mesoscale weather complexesis expected to degrade strongly already withinthe first hour, a high update rate is necessary toassure high quality products within this period.This requirement is much sought by several usergroups, e.g. from aviation, where nowcasts forthe next 20min have to be as precise as possible
for airport operations while longer term forecastsshould at least be precise enough to aid in strate-gic decision making, as e.g. opening or closingarrival gates. With regard to forecasting, the de-velopment and tracking of TWOs beyond thenowcasting range has to be based on model out-put data. Here it has to be assured that the fore-cast at hand is in accord with the observations asidentified by image matching of observed andsynthetic satellite and radar data. It is anticipatedthat the unifying vision of WxFUSION will beboth useful and profitable during the inter-disci-plinary project ‘Weather and Aviation’, whichstarted in 2008.
Acknowledgements
Reinhold Steinacker and Stephan Schneider at the Universityof Vienna are thanked for making available the VERA anal-yses. This study was supported by the European CommissionProject RISK-AWARE (INTERREG III B CADSES Neigh-bourhood Programme). Meteosat data are copyrighted byEUMETSAT. The European radar composite is a productof DWD (German Weather Service).
References
Bergeron T (1928) €UUber die dreidimensional verkn€uupfendeWetteranalyse. Erster Teil: Prinzipielle Einf€uuhrung in dasProblem der Luftmassen- und Frontenbildung (On thethree-dimensional interlinking weather analysis. Firstpart: Basic introduction to the problem of air-mass andfront generation). Geof Publ 5(6): 111pp
Cegnar T, Rakovec J (eds) (2005) International Workshopon Timely Warnings of Heavy Precipitation Episodesand Flash Floods. A collection of 10 essays with Sloveniaas geographical focus. Special publication, SlovenianMeteorological Society, Ljubljana, 114pp
Dixon M, Wiener G (1993) TITAN: Thunderstorm identifi-cation, tracking, analysis, and nowcasting – a radar-basedmethodology. J Atmos Ocean Tech 10: 785–97
Doms G, Sch€aattler U (1999) The Nonhydrostatic LimitedArea Model LM (Lokal Modell) of DWD: Part I: Scien-tific Documentation. DeutscherWetterdienst, Offenbach,172pp
Evans JE, Ducot ER (1994) The Integrated Terminal Weath-er System (ITWS). Lincoln Lab J 7(2): 449–74
Frech M, Holz€aapfel F, Tafferner A, Gerz T (2007) High-resolution weather database for the terminal area offrankfurt airport. J Appl Meteor Clim 46: 1913–32
Gerz T, Holz€aapfel F, Bryant W, K€oopp F, Frech M, TaffernerA, Winckelmans G (2005) Research towards a wake-vortex advisory system for optimal aircraft spacing.C R Physique 6: 501–23; DOI: 10.1016=j.crhy.2005.06.002
Grell GA, Emeis S, Stockwell WR, Schoenemeyer T, ForkelT,Michalakes J, Knoche R, SeidlW (2000) Application of
A. Tafferner et al.
a multiscale, coupled MM5=chemistry model to the com-plex terrain of the VOTALP valley campaign. AtmosEnviron 34: 1435–53
Hagen M, Schiesser H-H, Dorninger M (2000) Monitor-ing of mesoscale precipitation systems in the Alps and thenorthern Alpine foreland by radar and rain gauges.Meteorol Atmos Phys 72: 87–100
Handwerker J (2002) Cell tracking with TRACE3D – a newalgorithm. Atmos Res 61: 15–34
Keil C, Craig GC (2007) A displacement-based error mea-sure applied in a regional ensemble forecasting system.Mon Wea Rev 135: 3248–59
Keil C, Volkert H (2000) Precipitation in the northern Alpineregion: Case-study-type validation of an operational fore-cast model. Meteorol Atmos Phys 72: 161–73
Kober K, Tafferner A (2008) Tracking and nowcasting ofconvective cells using remote sensing data from radar andsatellite. Meteorol Z (submitted)
Koppert H-J (2002) A Java based meteorological worksta-tion. 18th Internat. Conf. on Interactive Information andProcessing Systems for Meteorology, Oceanography andHydrography, Amer Meteorol Soc, Boston, pp. 307–10
Kron W (2004) Hochwasser. In: Wirtz A (ed) Wetterkatastro-phen und Klimawandel (Weather catastrophies and climatechange), Edition Wissen, M€uunchener R€uuckversicherungs-Gesellschaft, Order no. 302-04220, pp. 122–31
Morel C, S�een�eesi S (2002)A climatology ofmesoscale convec-tive systems over Europe using satellite infrared imagery. I:Methodology. Quart J Roy Meteorol Soc 128: 1953–71
Mueller C, Saxen T, Roberts R, Wilson J, Betancourt T,Dettling S, Oien N, Yee J (2003) NCAR Auto-nowcastsystem. Wea Forecast 18: 545–61
Muller J-P, Denis M-A, Dundas RD, Mitchell KL, Naud C,Mannstein H (2007) Stereo cloud-top heights and cloudamount retrieval from ATSR2. Int J Remote Sensing 28:1921–38; DOI: 10.1080=01431160601030975
Ranzi R, Zappa M, Bacchi B (2007) Hydrological aspects ofthe mesoscale alpine programme: findings from fieldexperiments and simulations. Quart J Roy MeteorolSoc 133: 867–80
S�een�eesi S, Morel C, Brovelli P, Arbogast E, Autones F,Bernard-Bouissi�eeres I, Bouzom M, Reynaud J (2004)Objectoriented convection nowcasting – using radarand satellite data in a man-machine mix. Proc. 3rd
European Conference on Radar Meteorology and Hydrol-ogy, 6–10 September, Visby, Sweden
Steinacker R, Dorninger M, W€oolfelmaier F, Krennert T(2000a) Automatic tracking of convective cells and cellcomplexes from lightning and radar data. Meteorol AtmosPhys 72: 101–10
Steinacker R, Haeberli C, P€oottschacher W (2000b) A trans-parent method for the analysis and quality evaluation ofirregularly distributed and noisy observational data. MonWea Rev 128: 2303–16
Steppeler J, Doms G, Sch€aattler U, Bitzer HW, Gassmann A,Damrath U, Gregoric G (2003) Meso-gamma scale fore-casts using the nonhydrostatic model LM. MeteorolAtmos Phys 82: 75–96
Tafferner A, Hauf T, Leifeld C, Hafner T, Leykauf H, VoigtU (2003) ADWICE-advanced diagnosis and warningsystem for aircraft icing environments. Wea Forecast18: 184–203
Tafferner A, Mannstein H, Paccagnella T, Marsigli C,Montani A, Nerozzi F (2002) On finding the best forecastout of an ensemble by satellite image matching for MAPIOP2b. 10th AMS Conf. on Mountain Meteor., Proc. Vol.pp. 201–4
Volkert H (2000) Heavy precipitation in the AlpineRegion (HERA): Areal rainfall determination for floodwarnings through in-situ measurements, remote sensingand atmospheric modelling. Meteorol Atmos Phys 72:73–85
Volkert H, Gutermann T (2007) Inter-domain cooperationfor mesoscale atmospheric laboratories: The MesoscaleAlpine Programme as a rich study case. Quart J RoyMeteorol Soc 133: 949–67
Volkert H, Weickmann L, Tafferner A (1991) The papalfront of 3 May 1987: A remarkable example of fronto-genesis near the Alps. Quart J Roy Meteorol Soc 117:125–50
Wilson JW, Crook NA, Mueller CK, Sun J, Dixon M (1998)Nowcasting thunderstorms: a status report. Bull AmerMeteor Soc 79: 2079–99
Zinner T, Mannstein H, Tafferner A (2008) Cb-TRAM:tracking and monitoring severe convection from onsetover rapid development to mature phase using multi-channel Meteosat-8 SEVIRI data. Meteorol Atmos Phys(in print)
Development and propagation of severe thunderstorms in the Upper Danube catchment area