Embed Size (px)
Citation preview

DEVELOPMENTANDQUALITYEVALUATIONOFAREADY-TO-EATBANANACOMPOSITEFOOD
FOROLDERINFANTSANDYOUNGCHILDREN
By
MakafuiA.Borbi
ATHESIS
SubmittedtoMichiganStateUniversity
inpartialfulfillmentoftherequirementsforthedegreeof
FoodScience−MasterofScience
2016

ABSTRACT
DEVELOPMENTANDQUALITYEVALUATIONOFAREADY-TO-EATBANANACOMPOSITEFOODFOROLDERINFANTSANDYOUNGCHILDREN
By
MakafuiA.Borbi
Amonglow-incomefamiliesindevelopingcountries,foodsfedtoinfantsandyoungchildrenarerichin
carbohydrates but limiting in protein, and importantmicronutrients. Inadequate protein levels in the
diet of children can lead to protein energy malnutrition (PEM). The objective of this study was to
develop a high-proteinweaning food,with enhanced nutritional composition and sensory properties.
Lightredkidneybeans,brownriceandsemi-ripeCavendishbananaswereusedforthedevelopmentof
banana-rice-bean(BRB)porridge.Theserawmaterialswereair-driedat60°Cfor8-16h,andmilledinto
flours, which were used to formulate seven BRB composite flour treatments. The treatments and
individualflourswereanalyzedfornutritionalcompositionandphysicochemicalproperties.Fouroutof
seventreatmentswereselectedforsensoryevaluationofporridge.AllBRBcomposite flourcontained
significant levelsofprotein,rangingfrom5.70to8.52g/100g.Ashandcrudefatcontentrangedfrom
2.25to3.05g/100gand1.23to1.73,g/100grespectively.Theresistantstarchanddietaryfibercontents
were 6.35 to 9.21 and 10.1 to 11.82 g/100g, respectively. The raffinose and stachyose levels ranged
from0.19to0.46mg/gand3.49to6.27mg/g,respectively.Thepreparedporridgeswereshowntobe
ofacceptablequalityby31AfricanandAsianmothers.Twenty-nineofthepanelistsindicatedthatthey
wouldfeedatleastoneoftheporridgestoachildbelowfiveyearsofage.Basedontheresultsofthis
study,BRBporridgecouldbeusedasanutritiousweaningfood.

iiiiii
Tomywonderfulparentsandsiblingswhoinculcatedinmethevalueofpersistence—MrESQGbeve,MrsOliviaKuwornu-Gbeve,
Mawuli,Senyo,Dzidefo,Mawutor,AkpeandEyram.

iviv
ACKNOWLEDGEMENTS
IwouldliketoexpressmyprofoundgratitudetomymajoracademicadvisorDr.KirkDolanand
co advisor Dr. Muhammad Siddiq, for their scientific guidance and immense contribution
towards my research work. I am grateful to my guidance committee members, Dr. Gale
StrasburgandDr.LeslieBourquinfortheircontinuousguidance,expertiseandcontributions.I
alsowanttothankDr.JaniceHarteDr.SungeunCho,Dr.KarenCichyandDr.SharonHooperfor
theirimmensecontributiontowardsthesuccessofthisresearchwork.IamalsogratefultoDr.
FrederikDerksenandAnneSchnellerfortheirconfidenceinme.
I am forever grateful to The MasterCard Foundation Scholars program for their financial
support,particularlytheMichiganStateUniversityteamfortheirmoralsupportandformaking
theacademicjourneylighter.
Withouttheprayers,supportandencouragementofmyfamilyIwouldn’thavemadeitthisfar.
Iamthankfultomymum,dadandmysiblings.BigthankstoEdwinBlewusiFiawoyife;youhave
alwaysbeenthere.Ifinallywanttothankallwhoparticipatedinthesensoryevaluationofthe
infantfood.
Tothebigbrainbehindthescene,ELIzuzWegibborTheLordMightyandStrong,Iamgrateful!

vv
TABLEOFCONTENTS
LISTOFTABLES............................................................................................................................viii
LISTOFFIGURES.............................................................................................................................x
KEYTOABBREVIATIONS................................................................................................................xi
CHAPTER1......................................................................................................................................1INTRODUCTION..............................................................................................................................1
CHAPTER2......................................................................................................................................5LITERATUREREVIEW......................................................................................................................52.1StandardsandNutritionalGuidelinesforyoungchildren.....................................................5
2.1.1WHOnutritionalguidelines...........................................................................................62.1.2CodexAlimentariusrecommendations.........................................................................8
2.2Traditionaldietsforyoungchildren.....................................................................................82.2.1Africa.............................................................................................................................82.2.2Ghana............................................................................................................................9
2.3RecentDevelopmentsandRecommendationforfeedingyoungchildren...........................92.3.1Value-addedfoodproducts.........................................................................................102.3.2Fortifiedfoodproducts................................................................................................102.3.3Dietarysupplements...................................................................................................11
2.4NutrientrichrawmaterialschoicesusedininfantFoodFormulation...............................112.4.1Banana.........................................................................................................................122.4.1.1Nutritionalsignificanceofbanana............................................................................132.4.2Beans...........................................................................................................................142.4.2.1Nutritionalsignificanceofbeans..............................................................................152.4.3Rice..............................................................................................................................162.4.3.1Nutritionalcompositionofrice.................................................................................16
2.5ProcessingandPreparationofrawmaterialsforformulationofdietsforinfants.............172.5.1Sortingandcleaning....................................................................................................172.5.2Soaking........................................................................................................................182.5.3Dehulling......................................................................................................................182.5.4Fermentation...............................................................................................................182.5.5Roasting.......................................................................................................................192.5.6Milling..........................................................................................................................202.5.7Extrusioncooking........................................................................................................202.5.8Fooddehydration........................................................................................................212.5.8.1Air-drying..................................................................................................................212.5.8.2Vacuumdrying..........................................................................................................22

vivi
2.5.8.3Spraydrying..............................................................................................................222.5.8.4Drumdrying..............................................................................................................232.5.8.5Freeze-drying............................................................................................................23
2.6QualityEvaluation..............................................................................................................242.6.1Protein.........................................................................................................................252.6.2Carbohydrates.............................................................................................................252.6.3Dietaryfiber.................................................................................................................252.6.4Resistantstarch...........................................................................................................262.6.4.1Starchclassification..................................................................................................272.6.4.2Functionalpropertiesofresistantstarch.................................................................282.6.5Oligosaccharides..........................................................................................................302.6.6Lipids............................................................................................................................312.6.7VitaminsandMinerals.................................................................................................32
CHAPTER3....................................................................................................................................37MATERIALSandMETHODS...........................................................................................................373.1Flourprocessing.................................................................................................................373.1.1Redkidneybeanflour..................................................................................................373.1.2Riceflour......................................................................................................................383.1.3Bananaflour................................................................................................................38
3.2Productformulation...........................................................................................................383.3ProximateAnalysis.............................................................................................................393.3.1Moisturecontent.........................................................................................................393.3.2Ashcomposition..........................................................................................................403.3.3CrudeFat.....................................................................................................................403.3.4Protein.........................................................................................................................413.3.4.1Digestion...................................................................................................................413.3.4.2Neutralizationanddilutionofdigestedsamples......................................................413.3.4.3Nitrogendetermination............................................................................................41
3.4Raffinoseandstachyosedetermination.............................................................................423.4.1Extraction.....................................................................................................................423.4.2HPLCanalysis...............................................................................................................433.6Resistantstarchdetermination......................................................................................453.6.1Hydrolysisandsolubilisationofnon-resistantstarch..................................................453.6.2MeasurementofResistantStarch...............................................................................463.6.3Non-Resistant(Solubilized)Starch..............................................................................46
3.7MineralAnalysis.................................................................................................................483.8Physicalproperties.............................................................................................................493.8.1Color............................................................................................................................493.8.2Bulkdensity.................................................................................................................493.8.3Waterabsorptionandoilabsorptioncapacities(WAC/OAC)......................................503.8.4Watersolubilityindex..................................................................................................50
3.9SensoryevaluationofBRBcompositeporridge.................................................................503.10StatisticalAnalysis............................................................................................................52

viivii
CHAPTER4....................................................................................................................................53RESULTSANDDISCUSSION...........................................................................................................534.1Nutritionalcompositionofingredients..............................................................................534.2ProximatecompositionofBRBcompositeflours...............................................................574.3Non-digestiblecarbohydratesofBRBcompositeflours.....................................................594.4MineralComposition..........................................................................................................614.5Physicalproperties.............................................................................................................634.6SensoryEvaluationandconsumeracceptability................................................................68
CHAPTER5....................................................................................................................................73OUTCOMESandRECOMMENDATIONS........................................................................................735.1Conclusion..........................................................................................................................735.2Recommendations..............................................................................................................73
APPENDICES..................................................................................................................................75AppendixA:Recommendednewdietaryreferenceintake......................................................75AppendixB:Workingstandardsolutionsformineralanalysis.................................................76AppendixC:Chromatogramoutputforsugaranalysis.............................................................77
REFERENCES.................................................................................................................................78

viiiviii
LISTOFTABLES
Table2.1:WHOrecommendednutrientintakeforchildrenage6to23months.........................7
Table2.2:Nutritionalcompositionofrawanddehydratedbananaper100g.............................14
Table2.3:Nutritionalcompositionofdifferentcultivarsofdrybeansflour................................15
Table2.4:Nutritionalprofile(per100g)ofwhiteandbrownrice...............................................17
Table2.5:PhysiologicrolesanddeficiencysignsofB-complexvitamins.....................................34
Table3.1:BRBcompositeflours(%).............................................................................................39
Table3.2:Standardsolutionsfornitrogendetermination...........................................................42
Table3.3:Variableandfixedworkingconditionsforcalcium,iron,magnesiumandzinc...........49
Table4.1:NutritionalcompositionofBanana,riceandbeanflour.............................................53
Table4.2:ProximatecompositionofBRBcompositeflours........................................................59
Table4.3:Resistantstarch,totaldietaryfiber,raffinoseandstachyosecontentofBRBcompositeflours...................................................................................................................61
Table4.4:Calcium,iron,magnesiumandzinclevels(mg/100g)ofbanana,riceandbeanflour…….........................................................................................................................................62Table4.5:Calcium,iron,magnesiumandzinclevelsinBRBcompositeflour..............................63
Table4.6:ColorparametersL*,a*,b*,valuesandChromaandHueangleofbanana,riceandbeanflour.............................................................................................................................64
Table4.7:Density,watersolubility,andwaterandoilabsorptionpropertiesrice,beansand
bananaflour.........................................................................................................................65Table4.8:ColorparametersL*,a*,b*,valuesandChromaandHueangleofBRBcomposite
flour......................................................................................................................................67Table4.9:Density,waterandoilabsorptionandwatersolubilitypropertiesofBRBcomposite
flours.....................................................................................................................................68
ixix
Table6.1:Recommendednewdietaryreferenceintake(DRI)forchildrenage6to23months..
..............................................................................................................................................75Table6.2:Concentrationsofworkingstandardssolutionsforcalcium,magnesium,ironandzinc
..............................................................................................................................................76

xx
LISTOFFIGURES
Figure2.1:Resistantstarchanditseffectonbloodglucoselevel................................................29
Figure2.2:Structureofsomegalactooligosaccharides................................................................31
Figure4.1:SensoryattributesandoverallacceptabilityofBRBporridge...................................69
Figure4.2:PercentpanelistdistributionofoverallacceptabilityofBRBporridge.......................70
Figure4.3:Checkallthatapply(CATA)attributesofBRBporridge.............................................71
Figure4.4:Checkallthatapply(CATA)ingredientsofBRBporridge...........................................73
Figure6.1:Chromatogramsforrice,bananaandbeanflourinreplicates...................................77

xixi
KEYTOABBREVIATIONS
CATA:checkallthatapply
FAO:FoodandAgricultureOrganization
GHSGhanaHealthService
GSS:GhanaStatisticalService
MOH:MinistryofHealth
NDC:Non-digestiblecarbohydrates
OAC:oilabsorptioncapacity
RS:Resistantstarch
TDF:Totaldietaryfiber
UNICEF:UnitedNationChildren’sFund.
WAC:Waterabsorptioncapacity
WAI:Wateractivityindex
WCARO:WestandCentralAfricaRegionalOffice
WHO:WorldHealthOrganization
WSI:Watersolubilityindex

1
CHAPTER1
INTRODUCTION
Stuntingandwastingare themostcommonconditions inchildrenbelowfiveyearsof
agefromlowandmiddle-incomecountries,particularlychildrenfromlowsocioeconomicstatus
families (Vollmerandothers2014). Stuntingoccurswhenachild’sheight is too low for their
age,specifically,“whoseheightsarelessthantwostandarddeviationsbelowthemedianheight
for the age of the standard reference population” (UNICEF/WHO 2015). The most common
causeofstuntingislackofessentialmacroandmicronutrientssuchasprotein,ironandzincin
thedietofchildren.Stuntingtypicallyleadstonegativegrowthconsequencessuchascognitive
impairmentinchildren,whichcanbeirreversible(DeweyandAdu-Afarwuah2008).
Globally,“5.9millionchildrenundertheageof5diedin2015andabout45%ofallchild
deaths are linked to malnutrition” (UNICEF 2015). Children below the age of 5 in some
developingcountriessuchasMalawioftensufferfromseveremalnutrition.Thismalnutritionis
evident in the high rate (42%) of stunting in this demographic (UNICEF 2015). UNICEF/WHO
(2015) reportedadecline in stunting rateglobally in theyear2015but ironically, numberof
stunted children is increasing in Africa and the continent has not experienced significant
improvement in stunting rate (UNICEF/WHO 2015). In Ghana for instance, 28% stunting in
children less than5 yearsof agewas recorded in2011ofwhich35%were from low-income
familiesandonly14%werefromthericherquintile (WCARO2011).Asof2014,Ghana isstill
listedasoneof the countries that suffer frommalnutrition: 19%of childrenare stunted,5%
wasted,and11%sufferfromunderweight(GSS/GHS/ICF2015).

2
The growth rates of breast-fed infants (mostly below 6 months) in most developing
countriesaresimilartothoseofinfantsindevelopedcountries(GSS/GHS/ICF,2015).However,
during the weaning period, infants in developed countries continue to grow normally while
stunting and wasting are observed in most infants in developing countries due to
undernutrition (Lartey and others 1999). This underdevelopment is mostly due to the poor
nutritionalqualityofcomplementaryfoodsthatarefedtoinfantsandtootherfactorssuchas
infectionsand inadequate feeding (Amaglohandothers2012). WHOdefinescomplementary
feeding as “the process starting when breast milk alone is no longer sufficient tomeet the
nutritional requirements of infants, and therefore other foods and liquids are needed, along
withbreastmilk.”
Cereal-legumeporridgesarethemostcommontraditionalfoodsgiventoinfantsduring
theweaningperiodandhas receivedmuch interestover theyears.Cowpea, soybean,maize,
andgroundnutsarethemostpopularingredientsusedinformulation.Thehighstarchcontent
(amylose) in maize leads to high viscosity of porridge during cooking due to swelling and
requires dilution with large amounts of water leading to consequent thinning of nutrients
(Amaglohandothers2013).Theadditionoflocallyproducedfoodcropsisbeingexploredasan
alternativetofortificationandtoaddressthechallengesofmalnutrition.Therightselectionand
combimationof indigeniousfoodcropscouldhelpmeetmacronutrientneedsofolder infants
andyoungchildren(Twumandothers2015).
InGhana,approximately20to50%lossesoffoodcropsincludingfruitsandvegetables
arelostannually(Twumandothers2015).Theadditionoffruitsandvegetablestoinfantfoodis
recommended by Codex Alimentarius (CODEX 1991). Dessert banana is rich in minerals,

3
vitamins,potassium,phosphorousandmagnesium.Italsoandenhancestheflavorandtasteof
most foods (Da mota and others 2000; Bello-Perez and others 2012). Dessert banana is
underutilized and is subjected to high post-harvest losses in Ghana because it is mostly
consumedfreshandrarelyincorporatedintofoodproducts(Twumandothers2015).
RiceisthesecondmostconsumedcerealaftermaizeinGhana.Locallyproducedriceis
usuallycrowdedoutbyimportedricebecauseofconsumerpreferenceforimportedrice.Some
ofthereasonsforthisarethepoorqualityoflocalriceproduced,andageneralinclinationto
importedgoods(BoakyeandEgyir2014).Processingandaddingrice,asaningredienttoother
productswill,therefore,increaseitsvalue.BrownriceisagoodsourceofB-carotene,thiamine,
niacin and magnesium (Babu and others 2009; Boakye and Egyir 2014). Beans contain
appreciable levels of carbohydrates, protein, and fiber. Inmost tropical countries, however,
substantialpostharvestlossesofbeansoccurduetohightemperaturesandhumidityandalso
spoilagecausedbyweevilsduetolackofstoragefacilities(Nyombaireandothers2011;Ruiand
Boye2013).Findingwaystoprocessand incorporatethesefoodcrops intoready-to-eatshelf
stableproducts,wouldnotonlymitigatetheproblemofundernutritionamongchildrenunder
fiveyearsofage,butitwillalsocontributetoaddingvaluetothesefoodcropswithconsequent
reductioninpostharvestlosses.
Theoverallgoalofthisstudytherefore,wastodevelopaready-to-eatcomplementary
food,with improvedprotein contentand sensoryattributesusing rice,bananaandbean, for
useinGhanaandotherdevelopingnations.Thisistohelpmitigateprotein-energymalnutrition
(PEM)andalsotohelpdiversifythenumberoftraditionalcomplementaryfoodsavailablefor
children. The objective is to analyze the level of selected nutrients and non-digestible

4
carbohydrates.Nutritionalcompositioncovered inthisstudy included:proximateandmineral
composition,raffinose,stachyoseandresistantstarchandsomephysicochemicalproperties.

5
CHAPTER2
LITERATUREREVIEW
Thepurposethissectionistoreviewnutritionalrequirementsforinfantsandyoung
childrenandalsotodescribeavailablemethodsforprocessingandproducinginfantfood.
2.1StandardsandNutritionalGuidelinesforyoungchildren
GuidelinesforpreparingcomplementaryfoodsareusuallyestablishedbyWorldHealth
Organization (WHO) and Codex Alimentarius. These standard procedures and guidelines are
highly recommended during processing and formulation of foods given to infants. This is to
ensure optimum growth, development, and good health. Dietary guidelines cover daily
nutritionalrequirements,whichprovidesnutrientsintherightamountwithoutcausingexcess
or deficit (WHO/FAO 2004). TheWHO hopes to achieve 45% rate in stunting by 2025. The
developmentofnutritionallyadequate complementary foods isoneof the interventions that
areemployed tohelpachieve this goal.With regard to the2025goal, governmentagencies,
whichregulatesuchastheFoodandDrugAuthorityinvariousnations,arerequiredtoenforce
strictregulationsonthedevelopmentandmarketingofinappropriatecomplementaryfoodsto
children. They should endorse and allow commercialization of food products that meet
standardrequirementsandnationaldietaryguidelinesforinfants(WHO2015).
The requirements of a healthy diet for children are similar to that for adults.
Components of a healthy diet include legumes, nuts, fruits and vegetables, low sodium, low
sugar and high potassium levels. Recommendations for children include exclusively

6
breastfeeding of infants for at least 6months and continually for 2 years accompaniedwith
complementaryfoods(WHO2015).
2.1.1WHOnutritionalguidelines
Nutritional requirements for children vary with the current stage of growth and
development.Recommendednutrientintake(RNI)isthedailynutrientrequirementthatmeets
the daily nutritional need of a healthy individual. The RNI set byWHO for children from 6
monthsupto23monthsarerepresentedintable2.1.Therecommendedlevels(table2.1)were
adaptedfromtheWHOguidelinesfrom1998.Therearenotmanyrecommendationsforolder
children from age 2 to 5 years. There is, however, work underway for the development of
dietaryguidelinesspecificforchildrenofthisagegroup(WHOHQ/AFRO2013).

7
Table2.1:WHOrecommendednutrientintakeforchildrenage6to23months
Nutrient RecommendedIntake 6to8months 9to11months 12to23months Protein(g/day) 9.1 9.6 10.9 VitaminA(μgRE/day) 400 400 400 Folate(μg/day) 80 80 160 Niacin(mg/day) 4 4 6 Pantothenicacid(mg/day) 1.8 1.8 2.0 Riboflavin(mg/day) 0.4 0.4 0.5 Thiamine(mg/day) 0.3 0.3 0.5 VitaminB6(mg/day) 0.3 0.3 0.5 VitaminB12(μg/day) 0.5 0.5 0.9 VitaminC(mg/day) 30 30 30 VitaminD(μg/day) 5 5 5 VitaminK(μg/day) 10 10 15 Calcium(mg/day) 400 400 500 Chloride(mg/day) 500 500 800 Copper(mg/day) 0.3 0.3 0.4 Fluoride(μg/day) 0.05 0.05 0.05 Iodine(μg/day) 90 90 90 Iron(mg/day) 9.3 9.3 5.8 Magnesium(mg/day) 54 54 60 Manganese(mg/day) 0.02 0.02 0.02 Phosphorous(mg/day) 400 400 270 Potassium(mg/day) 700 700 800 Selenium(μg/day) 10 10 17 Sodium(mg/day) 320 350 500 Zinc(mg/day) 4.1 4.1 4.1 RE:Retinolequivalent(DeweyandBrown2003)

8
2.1.2CodexAlimentariusrecommendations
Thechoiceofrawmaterialsforpreparationandformulationof infantfoodsshouldbe
based on availability, affordability, diets that are usually given to children aswell as feeding
habits of infants. Rawmaterials should be sorted and cleanedwhere applicable. Also, raw
materialsaretobetreated inawaysoastoreduceantinutritient levels.Soaking,moistheat
treatment, fermentation, cooking for prolongedhours are commonprocessingmethods that
canhelpinminimizinglecthins,phytate,trypsininhibitorsandotherantinutrients.Fiberlevels
mustbereducedtoaminimumof5g/100gondrybasis.Energycomingfromproteinshallnot
belessthan6%ormorethan15%ofthetotalenergycomingfromthecomplementaryfoods
(CODEX1991).
2.2Traditionaldietsforyoungchildren
Most Africanmothers in the low ormiddle socio-economic class resort to traditional
foods for feeding their children due their inability to afford complementary foods that are
commerciallyavailable.Anotherreasonismothers’preferencetofamiliaringredientsthatare
usedinthepreparationofthesetraditionalfoodshencemakingmotherstrustthosefoodsthat
aretraditionallyprepared(Ejiguiandothers2007).
2.2.1Africa
Africandietsareheavilyplant-basedandsoarediets for infantsandchildrenyounger
thanfiveyearsofage.Porridgepreparedfromcerealsandlegumeblendsisthemostpopular
porridgegiventoinfantsandchildrenonthecontinentofAfrica(Achi2015;Achidiandothers
9
2016;Gabaza2016).Maize,millet, cowpeas, soybean,andgroundnutsareoftenusedduring
preparation. The use of these types of blends helped in the reduction of protein energy
malnutritionovertheyearsincountrieslikeGhana.Mashedbananasarealsogiventoinfantsin
countries likeUganda (Gibsonandothers2010;Achidi andothers2016).When legumesand
cerealsareused,theyareusuallyprocessedbyroastingorfermentationmethod.Regardlessof
theuseoftheseblends,somepartsoftheAfricancontinentandotherdevelopingcountriesstill
sufferfromprotein-energymalnutrition(UNICEF/WHO2015).
2.2.2Ghana
Porridges prepared from locally produced legume and cereal blends are the most
commonweaningfoods.Additionalfoodsthatareintroducedaftersixmonthsuptotwoyears
are banku and stew, tea, fried eggs, sausage, yam, mashed kenkey, jollof rice, bread, and
‘mpotompoto’, etc. (Pelto and Klemesu 2011). These foods range from semi-solid to solid
foods;theageofachildisadeterminantoffoodchoiceandextentofsolidity.Thesefoodsare
given to children at least twice a day; frequency is again determined by a child’s age and
demands for food. That is, the degree of solidity of food increases with age (GSS/GHS/ICF
2015).
2.3RecentDevelopmentsandRecommendationforfeedingyoungchildren
Several interventions have been put in place to help address the challenge of
malnutrition. This includes educating mothers on the importance of adequate and healthy
feeding practices for infants and young children. The most common approach is the

10
development and formulation nutritious food products thatwould helpmeet the nutritional
requirementsofthisdemographic
2.3.1Value-addedfoodproducts
These types of food products involve the application of different processingmethods
such as dehydration, milling, extrusion, juicing, etc. to improve and preserve foods (USDA
2016). The growing need for key nutrients, particularlymicronutrients led to the addition of
processedfruitsandvegetablestoalreadyexistingcereal-legumeblendsthataretraditionally
produced.Recentdevelopments includeadditionofpowderedfish,sweetpotatoflour, fruits,
vegetablesandmilksolidstoenhancethenutrientdensityofcomplementaryfoodsforinfants
and young children (Achidi andUkwuru 2015;Murthy and others 2016). A recent study by
OyeyinkaandOyeyinka (2016)suggested thatadditionofMoringaoleifeirapowder improves
thenutritionalqualityoffoodproductstargetedtowardschildren.
2.3.2Fortifiedfoodproducts
Fortificationoffoodproductsforinfantsandyoungchildrenbecomesimportantwhena
childisfedtherightamountoffoodbuthis/hernutritionalrequirementsarenotmet.Infants
betweentheagesof6to8months,forinstance,requirehighlevelsofnutrientsintheirfoods
duetotherapidgrowthrate.FoodFortificationinvolvestheadditionofcertainmicronutrients
(thisismostlythecasefortraditionalcomplementaryfoodspreparedforinfants)intheirpure
form or by adding food ingredients that are considered to be rich sources of some
micronutrients,mostly vitaminsandminerals. The food fortificant shouldassimilatewell into

11
the food product that is being fortified while maintaining sensory properties of the food
product(OyenyinkaandOyenyinka2016).
Vitamin A, zinc and iron are the most common micronutrients that are fortified in
complementary foods in developing countries. Iron and zinc are not fully absorbed in the
infant’sgut;thepresenceofhighlevelsofcertainantinutritionalfactorssuchasphyticacidin
complementaryfoodsinhibitscompleteabsorptionandmakesthesemineralslessbioavailable
(Gabazaandothers2016).
2.3.3Dietarysupplements
Dietary supplements are products that may come in the form of tablets, syrups or
powdermostly containing essentialminerals, vitamins, and amino acids that are ingestedby
mouthfornutritionalpurposes(WHO,2016).Theyaremostlyrecommendedbasedonspecial
needs. Over 300 million children worldwide died from anemia in 2011, which led to the
development of recent guidelines by the WHO for infants and children on daily iron
supplementation,especiallyforchildreninareasofhighmalariaprevalence(WHO2016).
2.4NutrientrichrawmaterialschoicesusedininfantFoodFormulation
Thechoiceofrawmaterialsforformulatinginfantdietsisdeterminedbydifferentsuch
asnutrientdensityoftraditionaldiets,complementaryfeedingpractices,socioeconomicfactors
andavailabilityofingredients(CODEX1991).Someexamplesofcommonlyutilizedlegumesand
cerealsfortraditionalinfantdietsinAfricaandotherdevelopingcountriesaremillets,sorghum,
maize, soybean, rice, etc. Cereals are typically rich in sulfur-containing amino acids (cysteine

12
andmethionine)butlimitingintheessentialaminoacidlysinewhilelegumesaregenerallyhigh
in lysinebuthaveonly low levelsofcysteineandmethionine.Thereforecerealsand legumes
arecomplementaryintermsofproteinandessentialaminoacidneeds(Bazazandothers2016;
Tembaandothers2016).Fruits,ingeneral,containasubstantialamountofmicronutrientsand
antioxidantsandtheirincorporationincreasesthenutritionalqualityofcomplementaryfoods.
MostfruitsarerecognizedfortheirvitaminC,fiber,antioxidantandmineralcontents.
2.4.1Banana
Banana(Musaspp.)iswidelycultivatedintropicalandsubtropicalregionsofdeveloping
countries,usuallyby small-scale farmersasa staple food.Bananasarealsogrownona large
scaleforexport.Theyarerankedasoneofthelargestgrownfoodcropsworldwidefollowing
rice, maize, and wheat. Bananas are classified into two groups based on their culinary
characteristics (dessert and sweet bananas) and cooking bananas. Cooking bananas include
plantainsandareusuallycookedbeforeconsumption(Auroreandothers2009).
Compared to fruits like apples and oranges, processed banana products are less
commononthemarket(Auroreandothers2009).Attheendoftheyear2000,only0.1%of
the bananas that were produced globally were used industrially (Aurore and others 2009).
AccordingtothesecondannualreportoftheUnitedStatesInternationalTradeCommissionin
2011, banana is one of the least processed fruits in Africa, and undergoes high post-harvest
losses. To add value to banana and avoid post-harvest losses, the fruit is incorporated into
other food products such as cake and pie (Aurore and others 2009; Karthiayan and others
2013).

13
2.4.1.1Nutritionalsignificanceofbanana
Dessert bananas are easily digestible (Mohapatra and others 2010) and can be
incorporated into food products that are made for individuals who may have the need for
digestibility,oilandfat-freefoodsandhighermineralcontentdiets.Peoplewiththesespecial
needs include; infants, the elderly and individuals with stomach ulcers and some
gastrointestinaldisorders(Auroreandothers2009).
The pulp contains significant levels of potassium, phosphorous and magnesium (Table 2.1)
Dehydratedbananascontainrelativelyhighenergyandsugarlevels(Table2.1).Theproximate,
mineralandvitamincompositionoffreshanddehydratedbananasarerepresentedintable2.2.
Thereismuchinterestgrowinginbananaduetoitspotentialuseasafoodsourcefor
diabetesmanagementbecauseithasalowglycemicindexanditisalsousedtotreatdiarrhea
(Mohapatraothers2010;PillayandFungo2016).Bananaalsocontainsimportantphenolicsand
flavonoidswhich, act as antioxidants. The nutritional value of banana flourmakes it a great
product for use in baby foods, particularly when accompanied by legumes (Mohapatra and
others2010).

14
Table2.2:Nutritionalcompositionofrawanddehydratedbananaper100g
Nutrient Unit Rawbanana Dehydratedbanana
ProximateWater g 74.91 3Energy Kcal 89 346Protein g 1.09 3.89Totallipids 0.33 1.81Carbohydrate g 22.84 88.28Totaldietaryfiber g 2.6 9.9Totalsugars 12.23 47.3
MineralsCalcium mg 5 22Iron mg 0.26 1.15Magnesium mg 27 108Phosphorous mg 22 74Potassium mg 358 1491Sodium mg 1 3Selenium μg 1 3.9
VitaminsVitaminC mg 8.7 7Thiamin mg 0.031 0.18Riboflavin mg 0.073 0.24Niacin mg 0.665 2.8VitaminB-6 mg 0.367 0.44Folate mg 20 14Choline,total mg 9.8 19.6BetaCarotene μg 26 101Alphacarotene μg 25 96VitaminA,IU IU 64 248VitaminK μg 0.5 2(USDA2016).
2.4.2Beans
Common beans (Phaseolus vulgaris L.) are legumes, which thrive well in Eastern Africa and
somepartsofsouthernAfrica.Asubstantialamountofdrybeansarelostafterharvestdueto
lackofappropriatestoragefacilitiesandpreservationmethods.(Nyombaireandothers2011)

15
2.4.2.1Nutritionalsignificanceofbeans
Drybeansaregenerallylowinfatbuthighinproteinanddietaryfiber(Table2.3).The
protein present in beans is about two times the amount present in cereals. Due to the
expensivenatureofanimalproteins,beanmealisapreferablesourceofproteinindeveloping
countriesparticularlyamongfamilieswithlowsocioeconomicstatus.Thispreferenceisdueto
the rich protein and calorie content of beans. In developing countries, beans are boiled and
eatenasacuisineandservedwithotherdelicacies(Nyombaireandothers2011).Knownforits
high dietary fiber content (Table 2.3), beans serve as a good source of roughage, which
enhances bowel movement. The proximate compositions of a variety of kidney beans are
showninTable2.3.
Table2.3:Nutritionalcompositionofdifferentcultivarsofdrybeansflour
Beancultivar Fat(%) Protein(%) Ash(%)Crude/dietary
fiber%)
Cranberry 1.28-1.4 22.36-24.3 4.25 20.9 Darkredkidney 1.1-1.16 27.09-28.5 4.84 21.9 Kidney(wetbasis) 1.6 20.9 3.8 26.3(d) Lightredkidney 1.28 24.15 4.40 - Kidney*wb 1.7 24.5 3.3 - Pinto 1.0-1.34 23.19-23.7 4.53 21.8 Navy 1.5-1.8 25.1-30.4 3.85-4.6 7.6,23.3 Navy* 1.74 23.1-28.3 3.73-4.1 1.95 *=dehulledWb=wetbasis(RuiandBoye2013)

16
2.4.3Rice
Rice (Oryza sativa L) is an important cereal, largely produced in Asian countries, is a
staplefoodsomecountriesandisconsumedinmorethanhalfoftheglobe.Riceconsumption
is increasing inmost sub-SaharanAfrican countries and is takingover from traditional staple
foodssuchasyamandcassava(Tomlinsandothers2005).Irrespectiveofthevariety,riceisa
goodsourceofcarbohydrates,particularlystarchandishighincalories,232Kcal(Table2.4).It
alsocontainsfiber,somemicronutrientssuchasphosphorousandmagnesium(Table2.4).
2.4.3.1Nutritionalcompositionofrice
Nutritionalcompositionof ricevarieswith rice type; that is,white rice (milledrice)or
brown rice. Brown rice is the type of rice in which the husk has not been removed and is
generallyconsideredmorenutrientdensecomparedtoitswhitericecounterparts(Table2.4).
Riceisremarkablyhighincarbohydratesandcontainsrelativelylowlevelsofprotein.Whennot
consumedtogetherwithprotein-richingredientsdiets,rice-baseddietscould,leadtoprotein-
energymalnutrition(Babuandothers2009).Phyticacid,anantinutritionalfactorispresentin
the rice bran and can be reduced by soaking or more significantly by fermentation and
germination (Kaur and Kapoor̂ 1990). Rice bran also contains other antinutrients such as
tannins,oxalates,trypsininhibitorsandpolyphenols(KaurandKapoor̂1990).

17
Table2.4:Nutritionalprofile(per100g)ofwhiteandbrownrice
Parameters Brownrice WhitericeCalories 232 232Protein(g) 4.88 4.1Carbohydrate(g) 49.7 49.6Fat(g) 1.17 0.205Dietaryfiber(g) 3.32 0.74Thiamin,B1(mg) 0.223 0.176Riboflavin,B2(mg) 0.039 0.021Niacin,B3(mg) 2.73 2.050Viatamin,B6(mg) 0.294 0.103Follacin(μg) 10 4.1VitaminE(mg) 1.4 0.462Magnesium(mg) 72.2 22.6Phosphorous(mg) 142 57.4Potassium(mg) 137 57.4Selenium(mg) 26 19Zinc(mg) 1.05 0.141(Babuandothers2009)
2.5ProcessingandPreparationofrawmaterialsforformulationofdietsforinfants
Toensureasafeandhealthydietforinfantsandyoungchildren,certainprocessesing
meethodsandmethodsarerecommendedbyCodexAlimentariusduringformulationof
complementaryfoods.
2.5.1Sortingandcleaning
Sortingandcleaningarecarriedouttoremovedebris,foreignmaterials,anddamaged
seeds. It also involves treatment of the raw material with water to remove unwanted
materials.Sortingandcleaningarealmostalwaystheinitialstagesofrawmaterialpreparation

18
before proceeding to the next stage of treatment. This stage applies to all types of raw
materialsusedinformulationofinfantfoods(CODEX1991).
2.5.2Soaking
Where applicable, legumes, cereals and pulses are soaked by covering with enough
water,atleast4xwater(Afifyandothers2011;AchiandUkwuru2016).Thepositiveeffectof
soakingonreducingoligosaccharidessuchasraffinoseandstachyoseandotherantinutritional
factorsiswelldocumented(EgaunlentyandAworh2003;Siddiqandothers2006).
2.5.3Dehulling
Dehulling is the removal of the seed coats of lentils, legumes, pulses, or oil seeds to
minimize the amount of dietary fiber to an acceptable level for infants and young children
(CODEX 1991). There is evidence of disruption in zinc and iron absorption in infants who
consumedietshighindietaryfiber(CODEX,1991;Gabazaandothers2016).Dietaryfiberalso
reducesintakeoffoodininfantsandchildren,inducessatietyataminimumintakeandleadsto
bulkinessofstool.Dehullingcanreduceconcentrationsofphenoliccompounds,antinutritional
factors: phytates, chymotrypsin and trypsin inhibitors and tannins, which have the ability to
drastically,reduceproteinabsorptionandaminoaciddigestibility(CODEX1991;Egaunlentyand
Aworh2003).
2.5.4Fermentation
Fermentation is an age-old process employed in foodpreservation. Fermentation is a
biochemicalprocessinwhich,asubstrateistransformedbytheactionofmicroorganismsinto

19
othercompoundssuchasethanol,which,mayenhancenutritionalandsensorypropertiesof
food products (Adenike 2016;Gabaza and others 2016). Thismethod ismostly applicable to
cerealsandgrains suchasmaize,millet, and sorghumduring thepreparationof infant foods
(Egaunlentyandothers2002;Galatiandothers2014).InGhana,atypicalfermentationprocess
involvessoakingmaizeinwaterfor3daystoaweektoallowtheseedstosprout.Thesprouted
seeds are latermilled and turned into a gruel knownas ‘Koko’ for infants (Nagai andothers
2012).
The fermentation process can be either controlled or uncontrolled; the uncontrolled
process does not employ specific microorganisms and is a random spontaneous process,
inducedbymicroorganismspresentintheenvironment(Adeninke2016).Thelattermethodis
used inhomes inAfrica andotherdeveloping countriesduring thepreparationof traditional
gruelsforbothadultsandinfants.Thechallenge,however,isthepossibilityofcontaminationof
cerealsandgrainswithmycotoxinsduringthefermentationperiod(Watsonandothers2015).
Fermentationhelpsinthereductionofphytateactivitybyhydrolyzingthem;thiscouldenhance
mineralabsorptionandimproveB-vitamincontent(CODEX1991).
2.5.5Roasting
Roastingortoastinginvolvesdryheatingoflegumes,cereals,grains,pulsesandoilseeds
at very high temperatures (80°C) before or after soaking coupled with dehydration (CODEX
1991;Twumandothers2015).Thisprocess significantly improves tasteand flavorof legume
andcerealblends,which isattributedtopre-digestionofstarches.Digestibilityofthetoasted
product also improves (CODEX 1991). Roasting also decreases bulkiness (density) and also

20
results in high quality end product because insects,microorganisms and enzyme activity are
destroyedathigh temperatures (CODEX1991). Lossofproteincould,however,occurduring
roasting due to the browning reaction that occurs between amino acids and reducing
carbohydratesathightemperatures;agoodcontroloftheprocessisneededtoavoidprotein
loss (CODEX1991).Roasting is themajormethodemployedat thehouseholdandsmall-scale
level to prepare weanimix, a popular weaning food in Ghana. It is difficult to optimize
temperaturesathouseholdandsmall-scalelevelssoprocesscontrolarenotadequate(CODEX
1991).
2.5.6Milling
Dry rawmaterials after pretreatment can be combined andmilled together ormilled
separately and mixed afterward depending on technological feasibility. Preserving the
nutritional quality ingredients during milling is very important. While milling reduces the
particlesizeofingredientsandmakestheirincorporationintoproducteasier,itcouldalsolead
tobulkinessofthefloursamples(CODEX1991;Nagaiandothers2012).Bulkinesscan,however,
bereducedbyadditionofalpha-amylasestoallowpre-digestionofstarchandhelpreducethe
amount of water required during cooking. Excess dilution of formulated product during
preparation could cause reduction in food to water ratio leading to low nutrient density
(Amaglohandothers2013).
2.5.7Extrusioncooking
Extrusioncookingisatechniqueusedtocookfoodunderhighpressureandcontrolled
temperature(Obatoluandothers2000;Nyombaireandothers2011).Theproductisallowedto

21
passthroughdifferentsizesofdie(s)-determinedbydesiredattributes.Theextrudateexhibits
different physical and sensory attributes than the original ingredients (Alonso and others,
2000). Extrusion cooking is used for the production of snacks, breakfast cereals, and instant
powders. The process can be employed for further cooking of composite ingredients of
intendedinfantformulaaftermilling(OjokohandFagbemi2016).
Extrusioncookinghasanadvantageofloweringtheamountofwaterrequiredtoreach
gelatinization temperature. It also inactivates phytic acid and trypsin inhibitors (Camire and
others 1990; CODEX 1991). The amino acids L-lysine, L-arginine, L-tryptophan and sulfur-
containing amino acids cysteine and methionine and vitamins may, however, be lost if
processingparameterssuchastemperaturearenotwellcontrolled(CODEX1991).
2.5.8Fooddehydration
Food dehydration is a method of food preservation that has been in existence for
several centuries (Vega-Mercado and others 2001; Aguilera and others 2003). This method
entailsremovalofmoisturefromfoodproductstoalevelthatminimizesmicrobialactivityand
chemical reactions which otherwise could lead to food product deterioration (Aguilera and
others2003).
2.5.8.1Air-drying
This method is relatively less expensive than most drying methods (freeze drying,
vacuum drying, and microwave dehydration) and is used to dehydrate food products in an
enclosedvacuumorchamber.Materialstobedehydratedareoftenplacedonopentraysand
hot air is passed over the products and moisture is removed by convection. The air-drying

22
method is referred to as the traditional or conventional drying method because it is often
operatedat relativelyhigher temperature. It is able toprovideappreciable shelf stabilitybut
may compromise the nutritional, sensory, chemical and physical qualities of food products.
Commonlyalteredqualitiesinclude:lossofflavor,alteredtaste,textureandrehydrationability,
andreducedvitaminC(CohenandYang1995;Vega-Mercadoandothers2001).
2.5.8.2Vacuumdrying
Thisissimilartoair-dryingbutitmakesuseoflowertemperaturesandhigherpressures
to remove water. It is relatively less expensive compared to freeze-drying and the product
characteristicsandattributes(flavor,taste,andaroma)arebetterpreservedduringthisprocess
compared to air-drying (Chen and others 2006; Thipayarat, 2007). Vacuum belt drying is a
subtypeofvacuumdryingexcepttheprocessiscontinuous(Chenandothers2006;Wangand
others2007).
2.5.8.3Spraydrying
Liquidsamplesorfreeflowingproductsaredehydratedusingthismethod.Spraydrying
consistsofdropletformationthatispumpedthroughanozzleintoahotdryingmedium,which
utilizesatomizationtoevaporatemoistureandtoformfineparticles.Theendproductparticles
are mostly uniform and even spherical shapes but may vary depending on whether the
temperatureatwhichtheproductsaredriedisbeloworabovedroplettemperature.Powdered
milk and instant coffee are commonly produced by this method. Spray drying has the
advantage of producing uniform and specified product characteristics under constant
23
conditions. It is also a continuous process and easy to operate (Vega-Mercado and others
2001).
Ahugeshortfallofthismethod,however,isthatitisnotsuitablefordryingawiderange
or types of products. For instance, rawmaterials that are high in fat cannot be dehydrated
usingspraydryingunlessthefatcontentisremovedtoaminimallevel.Also,materialshighin
sugarcontentmayhavetobedilutedorspraydriedwithacarriersuchasmaltodextrins(Cohen
andYang1995).
2.5.8.4Drumdrying
Drum drying is employed for dairy products, cereals, gelatin beverages and bakery
goods.Itcanbeusedtodehydrateslurries,purees,andpastesbyconduction.Theproductto
bedehydratedisuniformlypouredoveraheateddrumtoevaporatemoisture;thedrumblades
scrapedriedproduct.Theuniformityofslurryandfullattachmentofproductstothedrumis
importantforobtainingahighqualityandfullydehydratedproduct.Occasionally,theproduct
mayneedsomemodificationbyadditionofother ingredientstoensuretheaboveconditions
aremet.Thecommerciallyavailabledrummaybeasingleordoubledrum.Highratesofdrying
areobtainedduringdrumdryingandareveryheateconomical.Thedisadvantage,however,is
thehightemperatureofthedrumsthatcausesseveredamagetotheendproduct.Thishasled
toadeclineintheuseofdrumdrying(CohenandYang1995;Vega-Mercadoandothers2001).
2.5.8.5Freeze-drying
Freezedryingisutilizedforanyproducttypeaslongasitcanbefrozen.Freeze-drying
alsoknownaslyophilization,operatesontheprincipleofsublimation.Frozensamplesaredried

24
atroomtemperaturesunderhighvacuum(Vega-Mercadoandothers2001).Thetemperatures
leadtolittleornolossesinsensoryattributesorstructure.Also,theporousnatureoftheend
productattainedasresultofsublimationof icecrystalsfromtheproduct’ssurfacecausesthe
producttorehydrateatafastrate(Vega-Mercadoandothers2001;Prothon2002).
The process is very expensive for commercial use because of extensive periods of
drying,whichleadstohighercompressorenergyrequirements.Longerdryingperiodsrequired
during freeze-drying is due to the formation of a thick layer whiles the drying process
progresses, making removal of remaining ice crystals difficult (Cohen and Yang 1995; Vega-
Mercadoandothers2001).
2.6QualityEvaluation
Qualityevaluationincludesbut isnot limitedtonutritionalanalysis,microbialanalysis,
aswellasphysicochemicalproperties,functionalpropertiesandalsosensoryattributes.Quality
evaluation is essential as it influences consumer preferences, packaging decisions, and shelf
stability.Nutritionalcompositionanalysisistheprioritywhenitcomestofoodsgiventoinfants
andchildren(Achidiandothers2016).
Nutritionalqualityalsoincludesantinutritionalfactors.Proteinsandmicronutrientsare
themost importantnutrients for infantsandyoungchildren.Theaveragehuman requiresat
least 49 different nutrients to maintain a normal and healthy development. A lack or
insufficientintakeofoneofthe49nutrientscouldleadtoadversehealtheffectsorevendeath
(Welch and Graham 2004). Most childhood stunting, infections and morbidity are linked to
inadequateintakeofoneormoremicronutrients(UNICEF/WHO2015).

25
2.6.1Protein
Normalgrowthanddevelopmentof infantsandyoungchildrenaredeterminedbythe
amountandqualityofproteinconsumed.Qualityofprotein isentailsbioavailabilityandalso
the presence and amount of essential amino acids. A combination of legumes and cereals
provides the right amount and quality of protein. However, it may become necessary to
improvetheproteinquality (bioavailabilityandamountofessentialand limitingaminoacids)
for children by the addition of fish, meat or dairy products to allow for amino acid
complementarity(DeweyandAdu-Afarwuah2008).
2.6.2Carbohydrates
Carbohydratesareoneof thesourcesofenergy in thedietandare foundprimarily in
starchyfoods.Toprovidetherightamountofenergy,easilydigestiblestarchyfoodsshouldbe
selected for children.Other higher energy sources such as fat and oils can also be added to
increase energy levels. Incorporation of certain carbohydrates for other purposes, such as
sweetness,shouldbeaddedsparingly(CODEX1991).
2.6.3Dietaryfiber
Dietaryfibersarenon-digestiblepartsofcarbohydratesthatescapedigestionandmay
be fermented in the human gut to produce short chain fatty acids that are nutritionally
beneficial. Excess gas production could, however, result from fermentation. Dietary fiber is
comprised of complex mixture of indigestible polysaccharides (cellulose, hemicelluloses,

26
oligosaccharides,pectins,gums),and lignin foundmostly inplantcellwallmaterial (Toshand
Yada2010;Brownlee2011).
Dietaryfiberisassociatedwitheasybowelmovementandstoolbulkiness(Agget,2003).
Theantinutritional effectofdietary fiber is still unclearandnot concretelydocumented. The
positiveeffectsseemtoexceedthesuspectedanti-nutritionalfactors:“Dietaryfiberspromote
beneficialphysiologicaleffectsincludinglaxation,and/orbloodcholesterolattenuation,and/or
bloodglucoseattenuation”(ToshandYada2010).
Some studies showed that dietary fiber can decrease absorption of zinc, iron and
micronutrientsthatarepresentonlyinminuteconcentrations(Gabazaandothers2016).Codex
Alimentariusrecommendationofdietaryfiberinformulatedcomplementaryfoodisatmost5g
per100gonadrybasis(CODEX1991).
2.6.4Resistantstarch
Thepolymerchainsofstarchesaremadeofmostlystraight-chainamyloseandbranched
chain amylopectin molecules. The branched-chain amylopectin has glucose molecules
connectedby,linearα(1→4)andbranchedchainα(1→6)glycosidiclinkages.Thelinearchain
is packed more closely compared to the branched chains, which are packed more loosely
contributing to instability in the latter. Starches exist in the native form but they can be
chemically or enzymaticallymodified to produce a specific or desired type of starch. Native
starch can be classified based on a crystalline pattern exhibited under x-ray crystallography,
digestibilitybyenzymesandalsobynutritionalproperties(Sajilataandothers2006).
27
2.6.4.1Starchclassification
X-raycrystallinestructureiscomposedoftypesA,BandC.Thesetypesaredetermined
by the chain lengths of polymers making up the core of the loosely packed amylopectin
network, by the compactness and density of starch granules and also by the availability of
waterinthesystem(Sajilataandothers2006;Sharmaandothers2008).
The incubation of starch in vitro with digestible enzymes without prior treatment,
results in rapidly digestible, slowly digestible, and resistant starch. This classification is
determinedbyeaseandrateofconversion into itsmonomerglucoseunits.Rapidlydigestible
starches (RDS)areentirelyhydrolyzedtoglucoseunitsafter20minutesof incubation.This is
attributed to its irregularly shaped and loosely packed nature, which make them easily
accessibletodigestiveenzymessuchasalphaamylase.RDStypesarecommonisfoodsthatare
cookedbyapplicationofmoistheat.Commonexamplesarepotatoesandbread(Sajilataand
others2006;Sharmaandothers2008).
Slowlydigestiblestarch (SDS)undergoesdigestionslower in thesmall intestine (about
100 minutes). This type of starch, are also amorphous in nature, except it is not physically
accessible to digestive enzymes. Slowly digestible starches are found in food products with
uncooked starch such as green bananas. Resistant starch (RS) does not digest in the small
intestineandmaybefermentedonceitreachesthelargeintestines.Duringchemicalassays,RS
iscalculatedbysubtractingthesumofRDSandSDSfromtotalstarch(TS).(WooandSeib2002;
Agettandothers2003;Sajilataandothers,2006).
Classificationaccording tonutritionalpropertiesproduces twomaincategories-digestibleand
resistantstarches.ThedigestiblegroupconsistsofRDSandSDSwhilstresistantgroupconsists

28
of4subcategories:resistantstarchtype1,2,3and4(RS1,RS2,RS3,RS4respectively)(Sajilata
andothers2006).RStype1iscommoninfullyorpartiallymilledgrains,cereals,legumesand
certain bulky starches. Their resistance to digestion can be reduced by through milling and
chewing(Sajilataandothers2006).RStype2hasaspecialgranularstructurethatmakesthem
inaccessible.Thistypeispredominantinrawstarchduetorelativelydehydratedstarchcontent
andcompactlatticestructure.RStype2comesfromungelatinizedstarch,whichiscommonin
bananas.Cookingandothermethodsoffoodprocessingminimizetheresistanceandamount
ofRStype2.
RStype3isformeduponcooling.Gelatinizedstarchcontainingamylosemoleculeshave
thetendencytoretrogradetoformRStype3.Theyaretotallyinaccessibleandescapedigestion
inthesmallintestine,particularlybypancreaticamylases.Theycanbedistributedinsolutionby
additionofpotassiumhydroxide (Sajilataandothers2006).RS type4 if formedduringcross-
linkingofchemicallymodifiedstarchesandaretheleastsusceptibletodigestibility(Sajilataand
others2006).
2.6.4.2Functionalpropertiesofresistantstarch
Commercially, resistant starches are often incorporated into other food products,
especiallytopreparelow-moisturefoodproducts.Thewideusageofresistantstarchesinthe
foodindustryisduetotheirlowwater-holdingcapacity,smoothtexture,blandtasteandwhite
color,whichallowlessinterferencewiththeintegrityofproductstheyareaddedto(Sajilitaand
others 2006). The health benefits of resistant starches include hypoglycemic effects,
hypocholesterolemiceffect,minimalgallstoneformationanditscapacitytocurbcoloncancer
29
(ToppingandClifton2001).ResearchalsoshowedthatRSprovidesaprebioticeffectbyserving
as a substrate for the growthof beneficial bacteria such asBifidobacterium (Bird andothers
2010). Additionally, absorption of calcium, zinc, phosphorous and iron are enhanced in the
presenceofapproximately16.4%RScomparedwithdietsmadeexclusivelyofdigestiblestarch
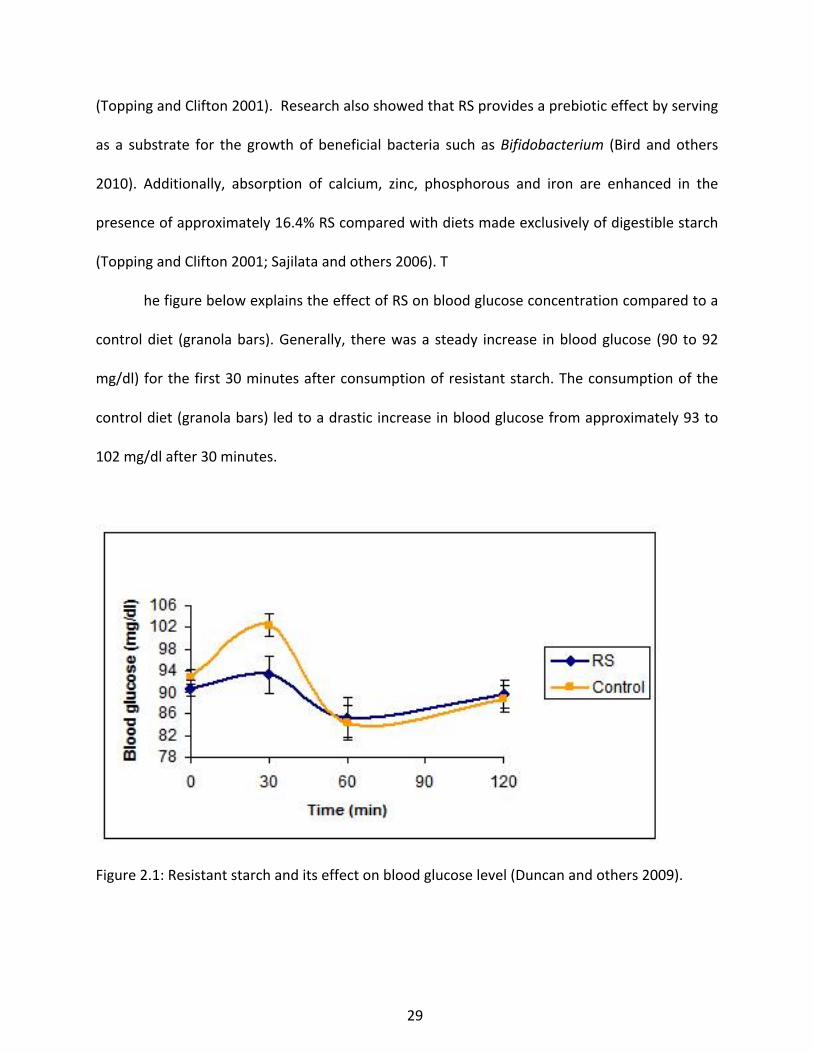
(ToppingandClifton2001;Sajilataandothers2006).T
hefigurebelowexplainstheeffectofRSonbloodglucoseconcentrationcomparedtoa
controldiet (granolabars).Generally, therewasa steady increase inbloodglucose (90 to92
mg/dl)forthefirst30minutesafterconsumptionofresistantstarch.Theconsumptionofthe
controldiet(granolabars)ledtoadrasticincreaseinbloodglucosefromapproximately93to
102mg/dlafter30minutes.
Figure2.1:Resistantstarchanditseffectonbloodglucoselevel(Duncanandothers2009).
30
2.6.5Oligosaccharides
Oligosaccharides such as raffinose and stachyose are not digestible and are classified
under non-digestible group of carbohydrates. Non-digestible carbohydrates produce low to
zeroenergy in foods.Oligosaccharidesmostly fall intooneof the followingcategories: inulin,
fructooligosaccharides, galactooligosaccharides or trans-galactooligosaccharides (Roberfroid
and Slavin 2000). Fructooligosaccharides are found in certain fruits like bananas; inulin in
artichoke and galactooligosaccharides in legumes, pulses, and some vegetables.
Galactooligosaccharidesincluderaffinoseandstachyose.Theinabilityofmonogastricmammals
to completely digest and absorb these oligosaccharides is due to the lack of the alpha-
galactosidaseenzyme(Agostoniandothers2004).
During the breakdown and fermentation of oligosaccharides in the colon, other
products (Figure 2.3) or excess gas production could result (Mussatto and Mancilha 2007).
Stachyose, a tetrose, and raffinose are the main culprits associated with gastrointestinal
discomfort due to excessive gas production. Their levels are reduced during soaking and
cookingwhichleadstoaconsequentreductioningasproduction(Mulimani1995;RuiandBoye
2013). The functional and health benefits linked to oligosaccharides are a prebiotic effect,
hypocholesterolemia, hypoglycemia, colonic health, etc. These health effects are greatly
connectedtofructooligosaccharidesand,toalesserextent,togalactooligosaccharides(Aggett
andothers2003).

31
Figure2.2:Structureofsomegalactooligosaccharides
2.6.6Lipids
Fatsand lipidsare important incomplementary foodsandtheyboost thebulkenergy
content of foods. Essential fatty acids, linoleic and alpha-linolenic acid are necessary for
cognitivedevelopment in infants and children. They are alsonecessary for the absorptionof
fat-soluble vitamins (WHO/FAO 2004). The addition of oils sources containing omega 3 fatty
acids suchasDocosahexaenoicacid (DHA)at recommended levels shouldalsobe considered
whenpreparingfoodforinfantsandolderchildren(CODEX1991).
32
2.6.7VitaminsandMinerals
Vitaminandmineraldeficienciesamongchildrenindevelopingcountriesarecommonly
reportedforcalcium,iron,zincandvitaminA.Otherimportantvitaminsandmineralsinclude:
vitamin B complex, vitamin C, vitamin D, vitamin E, folate, and selenium. All vitamins and
mineralsprovidedinachild’sdietshouldmeetdailynutritionalrequirementsasrecommended
intable1.Eachvitaminormineralplaysaspecialroleandensuresthehealthydevelopmentof
infantsandchildren(WHO/FAO2004).
Vitamin A is essential for good vision and deficiency of vitamin A can cause night
blindness, xerophthalmiaor cause susceptibility toother infections likeanemiaanddiarrhea.
EfficientabsorptionofvitaminA isalsodependentonthepresenceof fator fattyacids.Fish,
liver,eggyolk,wholemilk,greenleafyvegetables,yellowandorangenon-citrusvegetablesare
foodsourcesrichinvitaminA(WHO/FAO2004).
VitaminD is requiredforhealthyskingrowthandoptimumabsorptionofcalciumand
phosphate which in turn lead to strong bone development, muscle contraction and nerve
development. Sunlight is required tomake vitaminD inhumans is the sun.Only aminimum
amount is provided through the diet. Latitudinal differences, seasonal changes, and cultural
disparity can have a significant effect on the vitamin D supply in both children and adults.
BabiesborninautumnareatahigherriskofvitaminDdeficiency(WHO/FAO2004).
Vitamin C also known as ascorbic acid is synthesized in the liver of some mammals
mostlyfromglucose.HumansareunabletosynthesizevitaminCandisthereforerequiresfrom
thediet.VitaminCisanelectrondonor,thebasisofitsantioxidant,biochemicalandmolecular
functions.Itsantioxidantroleenablesittostabilizefolateinfood.VitaminCisalsoneededfor

33
repairofdamagedtissues.ThedeficiencyofvitaminCinthedietcanleadtoscurvy.VitaminC
also increases the absorption of soluble non-heme iron at levels at approximately 25mg by
chelationorbymaintainingironinthereducedform.Citrusfruits,kiwi,papaya,andvegetables
aregoodsourcesofvitaminC(WHO/FAO2004).
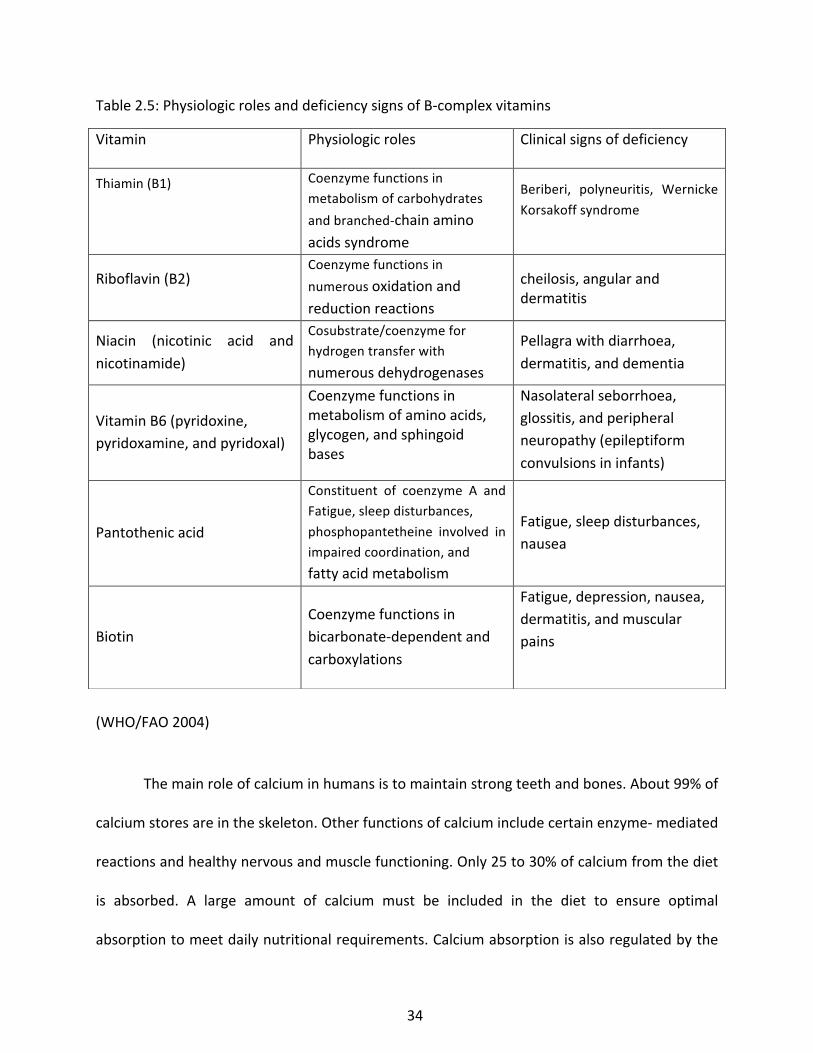
B-ComplexVitaminsreferstoallBvitaminsexcludingvitaminB12.Themainfunctionin
additiontootherphysiologicalrolesisactingasacoenzymeorcofactorinmanybiochemical
pathways required inmetabolismof certainnutrients suchas carbohydrates, branched-chain
aminoacids,fattyacids,etc(Table2.5).RiceandwheatarethemainsourcesofB-vitamins;the
amount of these vitamins can be significantly compromised when cereals are excessively
polished. Beriberi (cardiac and dry), peripheral neuropathies, pellagra, and oral and genital
lesionsrelatedtoriboflavindeficiencyusedtobeaglobalhealthchallengeinsomepartsofthe
worldbuthasexperiencedahugedecline(WHO/FAO2004).
34
Table2.5:PhysiologicrolesanddeficiencysignsofB-complexvitamins
(WHO/FAO2004)
Themainroleofcalciuminhumansistomaintainstrongteethandbones.About99%of
calciumstoresareintheskeleton.Otherfunctionsofcalciumincludecertainenzyme-mediated
reactionsandhealthynervousandmusclefunctioning.Only25to30%ofcalciumfromthediet
is absorbed. A large amount of calcium must be included in the diet to ensure optimal
absorptiontomeetdailynutritionalrequirements.Calciumabsorptionisalsoregulatedbythe
Vitamin Physiologicroles Clinicalsignsofdeficiency
Thiamin(B1)
Coenzymefunctionsinmetabolismofcarbohydratesandbranched-chainaminoacidssyndrome
Beriberi, polyneuritis, WernickeKorsakoffsyndrome
Riboflavin(B2)Coenzymefunctionsinnumerousoxidationandreductionreactions
cheilosis,angularanddermatitis
Niacin (nicotinic acid andnicotinamide)
Cosubstrate/coenzymeforhydrogentransferwithnumerousdehydrogenases
Pellagrawithdiarrhoea,dermatitis,anddementia
VitaminB6(pyridoxine,pyridoxamine,andpyridoxal)
Coenzymefunctionsinmetabolismofaminoacids,glycogen,andsphingoidbases
Nasolateralseborrhoea,glossitis,andperipheralneuropathy(epileptiformconvulsionsininfants)Pantothenicacid
Constituent of coenzyme A andFatigue,sleepdisturbances,phosphopantetheine involved inimpairedcoordination,andfattyacidmetabolism
Fatigue,sleepdisturbances,nausea
BiotinCoenzymefunctionsinbicarbonate-dependentandcarboxylations
Fatigue,depression,nausea,dermatitis,andmuscularpains

35
amountofsodium,vitaminD,andproteinthatarepartofthediet.Increasedintakeofsodium
leadstoanincreaseincalciumexcretionintheurine.VitaminDhelpsinefficientabsorptionof
calcium, a lack or decreased vitamin D in the body could increase susceptibility to calcium
deficiency (WHO/FAO 2004). Major sources of calcium are dairy products and certain plant
sourcessuchaslegumesandsomefruitsandvegetables.Thedailyrequirementsofinfantsand
childrenrangedfrom200to800mg/day(WHO/FAO2004).
Seleniumisatracemineral,whichperformscomplexbiochemicalfunctionsandislinked
to the antioxidant activity of glutathione. A decrease in selenium intake is associated with
consequentdecreaseinglutathionecapacity.Adailyseleniumintakeincomplementaryfoods
andinfantformulaisrecommendedatalevelof10μg(WHO/FAO2004).
Magnesium acts as a cofactor for several biochemical enzymes involved in protein
synthesis,RNAandDNAsynthesis(HurleyandDoane1989).Magnesiumiswidelydistributed
inmostfoodsandcommonlyfoundingreenleafyvegetables,legumes,nuts,spices,soyflour,
andsomeshellfish.Magnesiumdeficiencyisrarebutseveredeficienciescanleadtosymptoms
such as muscular weakness, nausea, anorexia, weight loss, tetany, muscular spasm and
hyperirritability(WHO/FAO2004).
Iron is responsible for heme synthesis,which is essential for oxygen transport in the human
body(HurleyandDoane1989).Infantssolelydependonironfromthedietandanincreasein
iron requirement is needed during the weaning period to sustain normal growth and
development. Foods containingappreciable levelsof lean redmeat andascorbic acidusually
aresufficienttoprovidedailyironneedsduringthisperiod(WHO/FAO2004).“Irondeficiencyis
possibly one of the most common nutritional deficiencies” (WHO/FAO 2004). The most
36
common symptoms of iron deficiency are anemia. Studies also suggest a link between iron
deficiencyandbrainimpairmentinchildren,whichmakesincreasingironcontentinthedietfor
childrenveryimportant(WHO/FAO,2004).
Zinc helps inmotor coordination and the entire neuron system is dependent on the
adequate availability of zinc. Leanmeat, redmeat,whole grains, cereals, and legumes are a
goodsourceofzinc(WHO/FAO2004).Noknownclinicalsymptomshavebeendocumentedfor
mild to low level of zincdeficiency, but severedeficiencies could lead todelayed sexual and
bonedevelopment,diarrhea,alopecia,skinlesionsandsusceptibilitytoinfections(Hurleyand
Doane1989).
In summary, several important factors are considered during the development of an
infant food containing sufficient nutrients for developing countries. Additionally, processing
methodsmustbechosencarefullytoproduceatastyvalueadded-productthatismarketablein
low-income areas of the developing world. The next chapter outlines the methods used to
produceandanalyzesuchaproduct.

37
CHAPTER3
MATERIALSandMETHODS
Canvendishbananas,brownriceandlightredkidneybeanswerepurchasedfromalocal
source.Chemicalsandreagentsusedwereofanalyticalgrade.Resistantstarchanddietaryfiber
assaykitswerepurchasedfromMegazymeinternational(Wicklow,Ireland).Allotherchemicals
and reagents towere purchase from SigmaAldrich (St. Louis,Missouri, USA). All treatments
were prepared in duplicates and the entire procedure was completely repeated from raw
materialtreatmenttophysicochemicalanalysis.
3.1Flourprocessing3.1.1Redkidneybeanflour
Red kidney beans were sorted, cleaned and washed in cold water. The beans were
soakedin4xwaterat70°Cfor8h.Thewaterwasdrainedandthebeanswerecookedinboiling
water for30min.Cookedbeanswerecooledundercold runningwaterandairdriedusinga
fooddehydrator,modelSD-P9000(TribestSedona,Anaheim,C.A.,U.S.A.)at60±1°Cfor8-10h.
(ambientairenteredthedryeratatemperatureof23±2°Candwarmairexitedthedryerat60
±2°C;humidity intheroomwasrecordedat17±2%).Dehydratedbeansweredehulled ina
hammermill, modelW series (Schutte-Buffalo, N.Y., U.S.A.) followed bymanual removal of
remaining seed coats. Sampleswere thenmilledusing aUDY sample cyclonemill, Belt-Drive
model3010-019(UDYCorp.Rome,Italy)toaparticlesizeof0.5mm.Theflourwaspackagedin
1-milpolyethylenebagsandstored23±1°Cuntilused.

38
3.1.2Riceflour
Brownricewascleanedandwashedandcookedfor30minutesinboilingwater.Thericewas
thencooledanddriedat60±1°C for8-10h.Conditionswere thesameas thoseusedduring
dehydrationofkidneybeans.
3.1.3Bananaflour
Cavendish bananas (DoleTM brand) ranging from “more green than yellow” to “more
yellow than green” banana was purchased. CIE color of fresh bananas with peels was also
determined;thebcolorvalue,which isan indicatorofthedegreeofyellownessrangedfrom
33.83to52.75.Bananaswerepeeled,andslicedusingaknife intoabout4mmthicknessand
treatedwithascorbicandcitricacid.Thepretreatedbananasliceswereuniformlyarrangedon
traysanddriedat60°CinaSedonadehydratorfor12-16h.Dehydratedslicesweremilledinto
flour(0.5mm).
3.2Productformulation
Bean, rice, andbanana (BRB) composite flours treatmentsarepresented inTable3.1.
TheratioswereselectedbasedonCodexAlimentariusrecommendationofamountofenergy
required fromprotein, from6 to15%of total energy contained in the complementary food
(CODEX1991)andalsobasedonconsumerperception.Individualflourswerealsoanalyzedfor
nutritionalandphysicochemicalproperties.

39
Table3.1:BRBcompositeflours(%)
Treatment Banana Rice Beans
Trt-1 80 10 10
Trt-2 70 10 20
Trt-3 70 20 10
Trt-4 60 25 15
Trt-5 55 20 25
Trt-6 50 30 20
Trt-7 45 40 15
3.3ProximateAnalysis
Moisture,totallipidsandashcontentsweredeterminedbasedonAOAC2005methods
withaslightmodificationduringdeterminationoftotallipidsbytheuseofmicrowave-hexane
extraction.
3.3.1Moisturecontent
About2gofsampleswereweighedintodryaluminumpans.Sampleswereplacedina
forced-airovenovernightat105⁰C,and thencooled indesiccators.Dryweightwas recorded
andpercentagemoisturedetermined.

40
3.3.2Ashcomposition
Emptycruciblespluscoverswereweighedand2-3gofsampleswereaddedandplaced
in a muffle furnace overnight at 550°C. They were allowed to cool in a muffle furnace and
transferred to desiccators to finish cooling. Crucibles plus ashwereweighed andpercentage
ashcontentwascalculated.
3.3.3CrudeFat
Sample tube liners, specific for a microwave reaction unit, Multiwave model 3000
(AntonPaar,Ashland,N.C,U.S.A.)wereplacedinthetubeholderofananalyticalscale.Usinga
Approximately1gofBRBcompositefloursamplesweretransferredtothebottomofthetube
liners.Tubelinerswereplacedinceramicvesselsand10mLeachofacetoneandhexanewas
added.Vesselswereassembled,placedonacarouselandthenintoamicrowaveextractor.
The extractor was operated under the following conditions: temperature ramp
increased5⁰C/min,110°Cfinaltemperature;heldfor10minat110°C;cooledto40(about20
min) and disassembled. Sample extracts were filtered through glass wool into pre-weighed
round bottom flask and solventwas evaporated using a rotary evaporator. Flasks containing
crudefatweredriedat100⁰Cfor~10min,cooledinadesiccatorandweighed.Totalcrudefat
wasdetermined.

41
3.3.4Protein
Protein content was determined using Kjeldahl method for sample digestion and
neutralizationfollowedbyindophenolmethodofnitrogendetermination.
3.3.4.1Digestion
Approximately0.5gsampleswereplacedintomicrowavedigestiontubesand4mLof
hydrogenperoxidewasaddedfollowedby6mLofsulfuricacid.Thetubeswereassembledinto
acarouselforandheatedforatotalof1h.Thetubeswereheldfor45minutesatapressure
rate of 0.5 bar/S and 800W and cooled for 20 minutes in the microwave digestion unit,
Multiwavemodel3000 (AntonPaar,Ashland,V.A.,U.S.A.).Aftercompletedigestion, samples
weretransferredtoa100mLvolumetricflaskfollowedbyadditionofwatertobringthefinal
volumeto100mL.
3.3.4.2Neutralizationanddilutionofdigestedsamples
TwoMilliliterdigestedsamplewasaddedtoapproximatelyof25mLofwaterina100
mLbeaker.Digestedsamplewasneutralizedwith1MNa2CO3toobtainapHof6.5 -7.5and
transferred toa50mLvolumetric flask.Volumewasbrought to50mLwithwaterandmixed
thoroughly.
3.3.4.3Nitrogendetermination
Ammoniumchloridewasusedasanitrogensourceforpreparationofastandardcurve.
Fivestandardswerepreparedandsampledilutionspreparedwhennecessary.

42
Table3.2:Standardsolutionsfornitrogendetermination.
PreparationofStandards 0μgN 1.25μgN 2.5μgN 3.75μgN 5μgN
mLofstandard(5µgofN/mL) 0 0.25 0.5 0.75 1mLofnanopureH2O 1 0.75 0.5 0.25 0
Twomilliliterseachofreagent1(10gPhenol,50mgsodiumpentacyanonitrosylferrate
dehydrateperL)andreagent2(15gsodiumhydroxide,10mLsodiumhypochloriteperL)were
added to each tube andmixedwell. Tubeswere placed in awater bath at 50°C for 40min.
Samples and standardswere blue color after 10 – 15min. After the 40min incubation, the
absorbance of samples and standards were measured at 640nm using a microplate reader,
model,synergyHTXMulti-Mode(BioTek,Winooski,VT,U.S.A)andnitrogenconcentrationwas
quantifiedusingstandardcurvesandproteincontentwascalculatedusingaconversionfactor
of6.25.
3.4Raffinoseandstachyosedetermination
3.4.1Extraction
RaffinoseandstachyosecontentsweredeterminedaccordingtothemethodofKuoand
others(1988).Floursamples(75mgto100mg)weresuspendedinapproximately80%ethanol
ina5mLflutedcap,(Note:volumeofethanoladdedwascalculatedforeachsamplebasedon
theirrespectiveweightsfromastandardconcentrationof25mg/mL),placedhorizontallyonan
orbitalshaker (50rpm)at40Cfor16h,andthesuspensionwascentrifugedat3000g for10
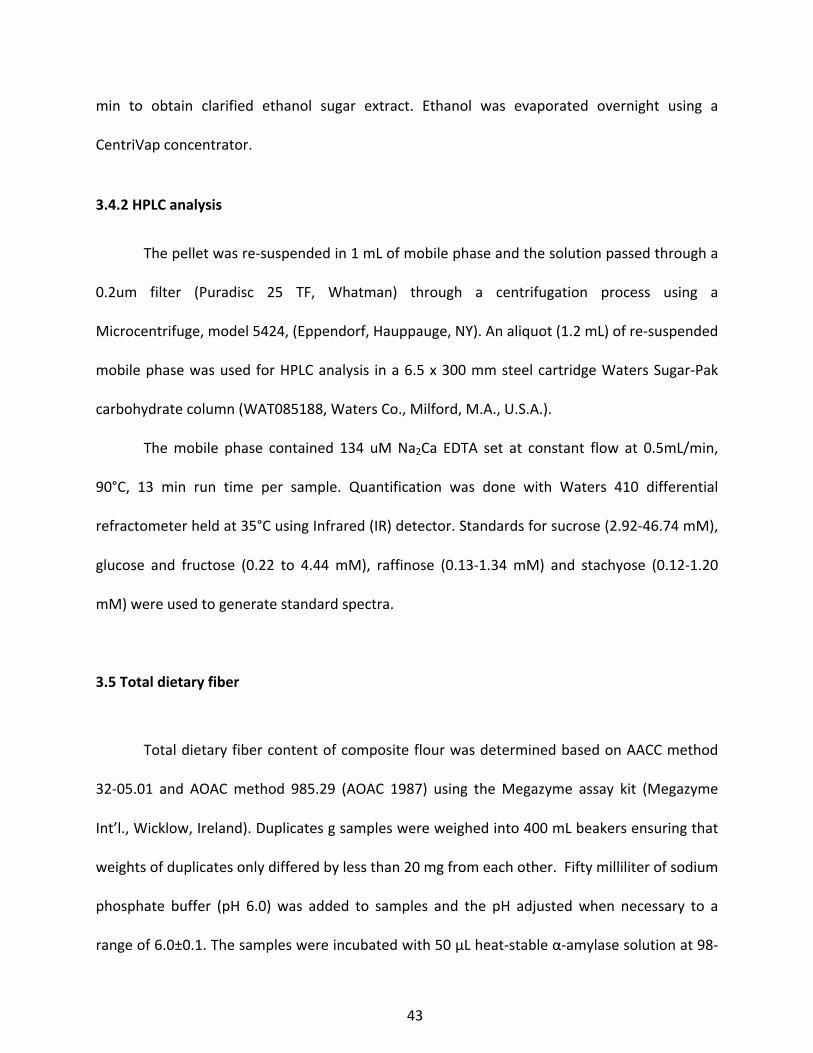
43
min to obtain clarified ethanol sugar extract. Ethanol was evaporated overnight using a
CentriVapconcentrator.
3.4.2HPLCanalysis
Thepelletwasre-suspendedin1mLofmobilephaseandthesolutionpassedthrougha
0.2um filter (Puradisc 25 TF, Whatman) through a centrifugation process using a
Microcentrifuge,model5424,(Eppendorf,Hauppauge,NY).Analiquot(1.2mL)ofre-suspended
mobilephasewasusedforHPLCanalysis ina6.5x300mmsteelcartridgeWatersSugar-Pak
carbohydratecolumn(WAT085188,WatersCo.,Milford,M.A.,U.S.A.).
Themobile phase contained 134 uMNa2Ca EDTA set at constant flow at 0.5mL/min,
90°C, 13 min run time per sample. Quantification was done with Waters 410 differential
refractometerheldat35°CusingInfrared(IR)detector.Standardsforsucrose(2.92-46.74mM),
glucose and fructose (0.22 to 4.44mM), raffinose (0.13-1.34mM) and stachyose (0.12-1.20
mM)wereusedtogeneratestandardspectra.
3.5Totaldietaryfiber
TotaldietaryfibercontentofcompositeflourwasdeterminedbasedonAACCmethod
32-05.01 and AOACmethod 985.29 (AOAC 1987) using theMegazyme assay kit (Megazyme
Int’l.,Wicklow,Ireland).Duplicatesgsampleswereweighedinto400mLbeakersensuringthat
weightsofduplicatesonlydifferedbylessthan20mgfromeachother.Fiftymilliliterofsodium
phosphate buffer (pH 6.0)was added to samples and the pH adjustedwhen necessary to a
rangeof6.0±0.1.Thesampleswereincubatedwith50µLheat-stableα-amylasesolutionat98-

44
100°Cfor15mininawaterbathwithintermittentshakingat5minintervals.Thebeakerswere
covered with aluminum foil before incubation. The solutions were allowed to cool to room
temperatureandpHadjustedto7.5±0.1with0.275NNaOHsolution.
The samples were then incubated at 60°C with 100 µL of protease solution for 30
minutes with continuous agitation. The solutions were to cooled to room temperature, pH
adjusted with 0.325 N HCl solution to 4.5±0.2, 200 µL amyloglucosidase was added and
incubatedat60°Cwithcontinuousagitationfor30minutes.
10.Pre-heated95%ethanol(280mL)wasaddedtosamplesandleftatroomtemperaturefor1
htoallowtheformationofprecipitate.
Theprecipitatedenzymedigestswerefilteredthroughpre-weighedcelitecontainedina
frittedglasscrucible.Thecelitewasmoistenedandredistributedwith78%ethanolanddrawn
ontothefrittedglassofcrucibletoformanevenmatbyapplyingsuctionusingavacuumpump.
Sampleresiduesobtainedduringfiltrationweresuccessivelywashedwiththree20mLportions
of78%ethanol,two10mLportionsof95%EtOH,andtwo10mLportionsofacetone.
Cruciblescontainingresidueweredriedat105°Cinanairovenovernight,cooledinadessicator
and weighed to determine residue weight. The residues were then corrected for ash and
protein.Oneduplicatewasashedinamufflefurnaceat525°Cfor5hours,cooledindesiccator
andweighedtodetermineashcontent.Proteinweightwasdeterminedforthesecondresidue,
using the Kjeldahl method (with colorimetric determination of nitrogen) and by using 6.25
factor.Blankswererunalongsamplestomeasurecontributionsfromreagentsused.

45
Calculations
Uncorrectedaverageblankresidue(UABR)=Averageblankresidueofduplicate
blanks(mg)
Blankproteinresidue(BPR)=UABRx%proteininblank
Blankashresidue(BAR)=UABRx%ashinblank
Correctedblank(CB)=UABR-BPR-BAR
Uncorrectedaveragesampleresidue(USAR)=Avsampleresidueofduplicate
samples
Sampleproteinresidue(SPR)=USARx%proteininsample
Sampleashresidue(SAR)=USARx%ashinsample
Correctedsampleresidue(CSR)=USAR-SPR-SAR-CB
%TDF=100xCSR/mgsample
3.6Resistantstarchdetermination3.6.1Hydrolysisandsolubilisationofnon-resistantstarch
For resistant starch measurement, AOACMethod 2002.02 (AOAC 2000) method was
used,followingtheMegazymeassaykit(MegazymeInt’l.,Wicklow,Ireland).Floursamples(100
±5mg)weredirectlyweighedinto15mLFalcontubes.Tubesweregentlytappedtoensurethat
samples reached the bottom of tubes. Four milliliters of pancreatic α-amylase (10 mg/mL)
containing amyloglucosidase (AMG) was added to each tube. Tubes were tightly capped,
content of tubesweremixedusing a vortexmixer, and incubated in a 37°Cwater bathwith
continuous shaking. The tubes were removed after 16 h and excess water on tube surface
wiped;theywerethenuncappedandtreatedwith4.0mLofethanol (99%v/v)withvigorous
stirringonavortexmixer.Thetubeswerecentrifugedat1,500gfor10minandsupernatants
decanted.Thepelletswerere-suspendedin2mLof50%ethanolwithvigorousmixing.Samples

46
were again centrifuged after further addition of 6mL of 50% ethanol, stirred, decanted, re-
suspendedandcentrifugedonelasttime.Anyliquidremainingafterdecantationwasremoved
byinvertingthetubesonabsorbentpaper.
3.6.2MeasurementofResistantStarch
Pelletswerere-suspendedin2mLof2MKOHanddissolvedbystirringwithmagnetic
barsfollowedbystirringinice/waterbathfor20min.Inordertopreventenzymehydrolysis,8
mLof1.2Msodiumacetatebuffer(pH3.8)wasaddedtoeachtubewithstirringand0.1mLof
amyloglucosidase(AMG)wasaddedandmixed.Tubeswereincubatedinawaterbathat50°C
for30minwithintermittentmixing.Samplescontaininggreaterthan10%RSweretransferred
into100mLvolumetricflask,toppedupwithdistilledwater,andmixedwell.Externalmagnets
were used to remove the stirrer bar in while washing the solution from the tube into the
volumetricflask.Analiquotofthesolutionwastakenandcentrifugedat1,500gfor10min.No
dilution step was required for samples containing less than 10% RS; tubes were directly
centrifuged for 10min. Aliquots (0.1mL) in duplicates of supernatants for both diluted and
undilutedstepweretransferredtoglasstubes(16x100mm)and3mLofGOPODreagentwas
added.Thesolutionwasthenincubatedat50°Cfor20min.
3.6.3Non-Resistant(Solubilized)Starch
Supernatant solutions obtained by centrifugation of the initial incubation were
combined with the supernatants obtained from the subsequent two 50% ethanol washings.
Volumewasadjustedto100mLwith100mMsodiumacetatebuffer(pH4.5) inavolumetric
flaskandmixedthoroughly.Induplicates,0.1mLoftheresultingsolutionwasincubatedwith

47
10μLofdiluteAMGsolution(300U/mL)in100mMsodiummaleatebuffer(pH6.0)for20min
at50°C.Thesolutionwasmixedwith3.0mLofGOPODreagentandthetubeswereincubated
at50°Cforafurther20min.
3.6.4MeasurementofAbsorbance
Absorbanceofall samplesandstandardsweremeasuredat510nmagainsta reagent
blank forboth resistantandnon-resistant starch. The contentof resistantandnon-resistant
(solubilised)starchweredeterminedbyfurthercomputation:
ResistantStarch(g/100gsample)(samplescontaining>10%RS):
=ΔExFx100/0.1x1/1000x100/Wx162/180
=ΔExF/Wx90.
ResistantStarch(g/100gsample)(samplescontaining<10%RS):
=ΔExFx10.3/0.1x1/1000x100/Wx162/180
=ΔExF/Wx9.27.
Non-Resistant(Solubilized)Starch(g/100gsample):
=ΔExFx100/0.1x1/1000x100/Wx162/180
=ΔExF/Wx90.
ΔE=absorbance(reaction)readagainstthereagentblank.
F=conversionfromabsorbancetomicrograms(theabsorbanceobtainedfor100µgofD-
glucoseintheGOPODreactionisdetermined,andF=100(µgofD-glucose)dividedbythe
GOPODabsorbanceforthis100µgofD-glucose.
100/0.1=volumecorrection(0.1mLtakenfrom100mL).
1/1000=conversionfrommicrogramstomilligrams.

48
W=dryweightofsampleanalyzed=“asis”weightx[(100-moisturecontent)/100].
100/W=factortopresentRSasapercentageofsampleweight.
162/180=factortoconvertfromfreeD-glucose,asdetermined,toanhydro-D-glucoseas
occursinstarch.
10.3/0.1=volumecorrection(0.1mLtakenfrom10.3mL)forsamplescontaining0-10%RS
3.7MineralAnalysis
Calcium,iron,magnesium,andzincwereanalyzedinthisstudyfollowingAOACOfficial
Method 999.11 (AOAC 2005) for sample and standard preparation. Atomic absorption
spectrometer model, SpectrAA 55 series (Agilent Technologies, Santa Clara, CA, U.S.A.) was
usedtoanalyzeCa,Fe,Mg,andZn.Approximately0.5gofporridgesamplesweredigestedfor
90min with 2mL of H2O2 and 8mL of nitric acid in aMicrowave extraction unit. Digested
sampleswerediluted to25mLwithdeionizewater. ForCaandMg,5mLofdiluteddigests
werefurtherdilutedto20mLforfinalabsorbancereadings.Ca,Fe,Mg,andZnstandardswere
prepared from calcium carbonate, iron metal, magnesium wire, and zinc metal strips,
respectively.Foreachmineral,workingstandards(AppendixB)werepreparedfromthe1000
µg/mL stock solutions. Lanthanum standard solution was added to calcium and magnesium
standards, to minimize matrix interferences. The working conditions for each mineral are
represented inTable3.3.Pressurewasprovided intheatomicabsorptionspectrophotometer
usingairacetylene.

49
Table3.3:Variableandfixedworkingconditionsforcalcium,iron,magnesiumandzinc
Wavelength(nm) SlitWidth(nm) Lampcurrent(mA) OptimumWorkingrange(μg/mL)
Calcium 422.7 0.5 10 0.01–3Iron 248.3 0.2 5 0.06–15Magnesium 202.6 1.0 4 0.15–20Zinc 213.9 1.0 5 0.01–2
3.8Physicalproperties
3.8.1Color
Colorparametersweremeasuredforbanana,rice,beanandBRBcompositefloursusing
aMinoltacolormeter,modelCR-400(KonicaMinoltaSensing,Inc.,Osaka,Japan).TheCIEL*,
a*,andb*werereadusingaD75lightsourceandtheobserverangleat10°.About25gofflours
wasplacedinasamplecupandcolorvalueswererecordedas:L*(0,black;100,white),a*(–a,
greenness;+a,redness),andb*(–b,blueness;+b,yellowness). Colorvaluesa*andb*values
wereusedtocalculatetheChromaandHueangleaccordingtomethodofLittle(1975):
Chroma= 22 ba +
Hueangle(h°)= ⎟⎠
⎞⎜⎝
⎛−
ab1tan
3.8.2Bulkdensity
Bulk density (loose) was determined according to the method of Okaka and Potter
(1977).A50-gsamplewasfilledintoa100-mLgraduatedmeasuringcylinder.Thecylinderwas

50
tappedgentlyseveral timesona laboratorybenchtoaconstantvolume.Theresults forbulk
densitywerereportedasg/mL.
3.8.3Waterabsorptionandoilabsorptioncapacities(WAC/OAC)
Water and oil absorption capacities were determined by the method of Mason and
Hoseney,(1969).Twogramsofflourweremixedwith20mLdistilledwaterandrefinedcornoil
(for oil absorption capacity) at 30C and centrifuged using Sorval RT 6000B Refrigerated
centrifuge,for15min.Thesupernatantsweredriedinanovenat130°Cfor2hours.Waterand
oilabsorptionwascalculatedastheincreaseinweightofthepelletorsediment.
3.8.4Watersolubilityindex
Dried supernatants obtained from the determination of WAI step were weighed to
determinethewatersolubilityindexofflourusingthisformula:
WSI= wtofsupernatant+wtofdriedsupernatant X100wtoforiginalsample
3.9SensoryevaluationofBRBcompositeporridge
Outofthe7BRBcompositeflourtreatments,4wereselectedforporridgepreparation
and = sensory evaluation. This choice of four flours was to prevent tasting and evaluation
WACorOAC = (wtofsediment+centrifugetube)–(wtofcentrifugetube) X100wtoforiginalsample

51
fatigue. Sensory evaluation of porridge was carried out at Michigan State University,
DepartmentofFoodScienceandHumanNutrition,SensoryLaboratory.
Thirty-onemothers from17countrieson theAfricanandAsiancontinent (DRCongo,Ghana,
Kenya, Malawi, Uganda, Tanzania, South Africa, India, Zambia, Zimbabwe, China, Taiwan,
Vietnam, Namibia, Pakistan and Sierra Leone) participated in the sensory evaluation.
Participants were allowed to read and sign a consent form confirming their acceptance to
participate in thesensoryevaluation.Onlymotherswhoconsentedwereallowedtoevaluate
theporridge.Evaluatorswerecompensatedwith$15forparticipation.TheInstitutionalReview
Board(IRB)attheMichiganStateUniversityapprovedthisstudy.
Aninstantporridgewaspreparedfromthebananacompositeflour inaratioof1:3(1
partofflourto3partsofwater).Waterat60°Cwasmixedwithapproximately5gofflourto
formporridgesthatwereservedtopanelist.Sampleswereserved intransparentplasticcups
labeledwithrandom3-digitnumbers-241,871,463and973.Panelistswereaskedtoevaluate
the porridge for its consistency, flavor, appearance, mouthfeel, sweetness and overall
acceptabilityona9-pointHedonicscale(Meilgaardandothers1999):9=likeextremely,8=like
verymuch,7=likemoderately,6= likeslightly,5=neither likenordislike,4=dislikeslightly,
3=moderately, 2= dislike very much and 1= dislike extremely. “Check all that apply” (CATA)
technique,containingalistoffiveattributesandingredientswereutilizedtogainmoreinsight
intoconsumerperceptionoftheweaningporridge.Participantswerealsoaskediftheywould
feedanyoftheporridgestoachildlessthan5years.Thesensoryevaluationquestionnairewas
preparedusingSIMS(vs.6.0)sensorysoftware(SIMS,BerkelyHeightsNJ,US).
52
3.10StatisticalAnalysis
One-way analysis of variance (ANOVA)was used to analyze the data, using Statistical
Package for Social Sciences (SPSS version 22, International Business Machines, New York,
U.S.A.). The sensory data were analyzed by ANOVA using SAS software, version 9.3 (SAS
Institute, Inc.,Cary,NorthCarolina,U.S.A.).Theseparationofmeansor significantdifference
comparisonsweremadebyTukey’sHSDandthestatisticalsignificancewasdefinedasp<0.05.

53
CHAPTER4
RESULTSANDDISCUSSION
4.1Nutritionalcompositionofingredients
Proximatecomposition,dietaryfiber,raffinoseandstachyosecontentofrice,beanand
bananaflourarerepresentedinTable4.1.Nosignificancedifferences(P>0.05)wereobserved
between the three samples for moisture content. Banana flour recorded the highest ash
content.Allsamplesdifferedsignificantly(P<0.05)inashcontent.Proteincontentwashighest
forbean flour and least forbanana flour as expected.Banana flour contained relativelyhigh
levelsofresistantstarch,whichdiffered(P<0.05)fromamountpresentinriceandbeanflour.
Riceandbean flour contain some stachyoseand raffinose. Stachyoseand raffinosewerenot
detectedinbananaflour.Beanflourcontainedhighestamountsofthedietaryfiber.
Table4.1:NutritionalcompositionofBanana,riceandbeanflour.
Bananaflour Riceflour BeanflourMoisture(%) 4.59±1.19a 3.65±0.59a 3.76±0.61a
Ash(%) 3.07±0.026c 1.23±0.01a 2.88±0.11bFat(%) 1.00±0.01c 2.42±0.17a 1.82±0.96b
Protein(%) 3.76±0.13c 7.87±0.45a 20.15±0.44bResistantstarch(g/100g) 6.27±0.49b 2.81±1.96a 3.70±0.20aRaffinose(mg/g) ND 0.26±0.09a 1.64±0.08b
Stachyose(mg/g) ND 1.06±0.007a 13.17±0.61b
Dietaryfiber(g/100g) 9.54±0.56c 6.60±0.56a 22.82±0.69bMeans ± SD in the same column with same letters are not significantly different (Tukey’s HSD test,P>0.05)ND=Notdetected

54
Apart fromwater activity,moisture content is one of the important determinants of
shelf stability of food products. Lowermoisture contents of food are associatedwith longer
shelf life relative to food products containing high levels of moisture. This is because High
moisture content support microbial growth especially yeasts and moulds. The moisture
contentsobservedinthepresentstudyweresignificantlylowerthanvalues,8.4to13.7,g/100g
reported by Asare and others (2004) for rice-cowpea blend and also the maximum CODEX
recommendations(15.5g/100g)forwheatflour(CODEX,1985).
Ash is the total amount of inorganic content remaining after the organic carbon
components are oxidized upon exposure to high heat treatment in a furnace (550°C). The
inorganicmaterial(ash) isreferredtoasthetotalmineralcompositionofaparticularsample.
Fresh bananas contain high levels of minerals, particularly, potassium, magnesium and
phosphorous.Thisexplainstherelativelyhightotalashmaterialinbananaflour(P<0.05)(Table
4.1).
Lipids are important in children’s diet for efficient absorption of fat-soluble vitamins
suchasvitaminA,whichisimportantforgoodsightdevelopmentininfants.Also,essentialfatty
acids assist in cognitive development in infants, curbing their susceptibility to cognitive
impairment in adulthood. Crude fat components of the individual ingredientswere generally
lowasexpectedforfruits,cereals,andlegumes(Table4.1).
Protein is by far one of the most important nutrients that are required for normal
growthanddevelopmentinchildren.Legumesarenaturallyrichinprotein,containingabout3
timestheproteinlevelincereals.Proteinsreportedinliteratureforredkidneybeansflourare
generallyfrom23to30%(RuiandBoye,2013).Theamountsrecordedinthisstudyareslightly

55
lowerthanreported(Table4.1).Theamountofproteinreportedhereforbanana(3.76%)and
brownriceflour(7.87%)areconsistentwiththose listedbyUSDAfoodcompositiondatabase
(USDA,2016).
Unripebananascontainresistantstarchtype2(RS2),whichdecreasessignificantlywith
ripening (Akerbergandothers1998). Akerbergandothers (1998) reporteda resistantstarch
(RStype2)contentbetween31%to72%totalstarch.Langkildeandothers(2002)andMenezes
and others (2011) reported 54% and 48.99% respectively of RS type 2 in raw green banana
flour. Semi-ripebananaswereused in this studyhencea lower value, 6.27% (Table4.1)was
obtained.Thiscouldpresentpotentialbenefitsifthisbananaflourisusedintheformulationof
food products for infants; infants and young children require only moderate amount of
resistant starch in their diets. This is becausediets consisting of highnon-digestible starches
content leads to low digestible energy density of food products (CODEX 1991). Children
consume foods in relatively smaller quantities compared to adults and may require higher
energyfromaparticularmeal.Sajilataandothers(2002)reportedthatmealscontainingabout
16.4%resistantstarchwereassociatedwithhighercalciumandironabsorptionratesinthegut
comparedtostarchesthatarecompletelydigested.
ResistantstarchlevelsobtainedinthisstudyaresimilartoresultsreportedbyTovarand
others(1990)andWangandothers(2010).Theyreportedadecreasingresistantstarchcontent
with cooking. Wang and others (2010) recorded a decrease of RS from 29.37 to 3.59% for
cooked red kidney bean whiles Tovar and others (1990) reported 3.3% resistant starch in
cooked,freeze-driedandmilledredkidneybeanflour.Thisisconsistentwith3.70%obtainedin
thisstudy(Table4.1),consideringthatthebeansinthisstudywerecookedfor30minutesand

56
thatofTovarandothers(1990)werecookedfor60to70minutes.Theresistantstarchcontent
ofbrownriceflour(2.85%)issimilartothoseobtainedbyDelaHeraandothers,(2013)(2.3%
to3.8%)andbyEggumandothers(1993)(2%to3.4%). Egumandothers(1993)reportedan
increasedinresistantstarchwithcooking.
Raffinose and stachyose are naturally abundant in legumes and pulses but lower in
cerealsandabsent in fruits.Thegeneral trendobtained for raffinoseandstachyose forbean
flour in this study, is incongruencewith the resultsobtainedbyShimelisandRakshit (2007).
Theyreportedadecreaseinraffinosecontentduringsoakingandcookingbutarelativelyhigh
level of stachyose even after cooking. Raffinose content (1.64mg/g) is closer to the value
reportedbyShimelisandRakshit (2007)(1.8mg/g).They,however,showed loweramountof
stachyose(4.7mg/g)comparedto13.17mg/g(Table4.1).JangchudandBunnag(2001)useda
synonymousmethod to theoneemployed in this studyexcept thebeanswereboiled for15
minutes and they obtained raffinose and stachyose values of 5.6mg/g and 17.9mg/g
respectively. Compared to values reported in this study, it is apparent a relatively longer
cookingtime(30minutes)playedaroleinlowercontentofraffinoseandstachyose.
Shanmugavelanandothers(2013)reportedanaverageraffinosecontentof0.29g/100g
for cereals in general and 0.16 g/100g for brown-black rice. Overall, no values have been
reportedinliteratureforraworprocessedbrownriceandbananas.Thecurrentstudypresents
0.26mg/g and 1.06 mg/g of raffinose and stachyose, respectively, for rice flour. The
predominanttypeofoligosaccharideinbananasisfructooligosaccharides;theyhavenotbeen
shown to contain galactooligosaccharides including raffinose and stachyose (Mussatto and
Mancilha2007).Noraffinoseandstachyosewasdetectedinbananasforthisstudy.However,

57
weobservedpseudopeaks forbanana flour.Thechromatograms for raffinoseandstachyose
forthethreefloursarelistedinappendixC.
Bean flourcontained thehighest totaldietary fiber (TDF)content (22.82g/100g).Tosh
andYada(2010)documentedTDFlevelsfrom23g/100gto32g/100gforalltypesofrawkidney
beans seeds.Wang and others (2010) reported that cooking increases dietary fiber content;
they showedan increase indietary fiber from19.97g/100g to24.56g/100g for80%cooked
darkredkidneybeansflour.TheTDFcontentinthisstudyisconsistentwithvaluesstatedinthe
twostudiesabove.Theslightly lowerlevelscouldalsobelinkedtothefactthatkidneybeans
usedweredehulledtosomeextent;dehullingreducesfibercontent(CODEX1991).Theamount
of TDF in brown rice flourwas 6.6g/100g. TheUSDA Fooddatabase composition indicated a
4.6g/100gTDFcontent forrawbrownrice flour.Additionally,Leeandothers (1988)reported
4.91g/100gto7.34g/100gfordifferentvarietiesofbrownrice.TheTDFforbananaflourwas
9.54g/100g,whichissimilartothosestatedbyUSDAfoodcompositiondatabase(9.9g/100g).
TDF values of 7.6 g/100g for fully ripe bananas and 6 g/100g to 15.5 g/100g for varieties of
greenbananasarealsowelldocumented in literature(DaMotaandothers2000;Auroreand
others2009)
4.2ProximatecompositionofBRBcompositeflours
Proximate composition of the seven different composite flours prepared from rice,
bean, and banana flours is represented in Table 4.2. Significant differences (P<0.05) existed
betweenmostBRB (banana-rice-bean)composite flours forallproximatecompositionexcept
formoisture content (P>0.05). Essentially, all nutrients seem tobeadirect reflectionof the

58
amountshownbythevariousingredients(rice,beans,andbananaflour)inTable4.1.Thiscould
beanindicationofminimalinteractioneffectbetweenthethreefloursatthelevelsusedinthe
presentstudy.
For instance,Trt-1containing themostbanana flour (80%) showedpercentageashof
3.05% (Table 4.2) Similarly, sample Trt-5made of highest bean flour percentage (25%) gave
proteincontentof(8.53%).ThehighestMC(4.42%)isabouttwotimeslessthancodexstandard
for flour (8%). This could be a good indicator of potential shelf stability of all composites.
Protein composition of composite flours (5.70% to 8.52%) is identical to the ones shown by
similar composite flour producedby Twumandothers (2015) using soybean flour “5.46% to
8.95%” (Table 4.2). It must, however, be acknowledged that the composite ratios and
ingredients used in formulation of products in the two study are totally different. No
significance difference existed between Trt-1 and Trt-3; both flours had bean flour content
maintainedat10%anddifferentriceandbananaflourpercentages.Trt-5andTrt-6showedno
significancedifference(p>0.05)forproteinandash(Table4.2).
Nutritionally,allflourscontainedrecommendedlevelsofproteinsincethetotalamount
of proteinneeded from complementary foods tomeetdaily proteinneedsper day for older
infantsandyoungchildren, ranged from2g for6-8monthsold infantsand5 to6g for infants
who are 12-23 months old (Dewey and Adu-Afarwuah 2008). Percentage lipids at levels
reportedinthisstudyseemtoolow(Table4.2)tomeetdailylipidneedsforinfantsandolder
infants.However,itisnotedthatporridgeorsimilarfoodsarenotconsideredatypicalsource
offatinthedietsofyoungchildren.Theamountoflipidrequiredfromcomplementaryfoodsis
approximate“3gday-1at9–11monthsand9–13gday-1at12–23months”(DeweyandAdu-

59
Afarwuah2008).Itmaybenecessarytoaccompanyfoodpreparedfromtheseflourswithother
foods containing lipidsparticularly thosewithessential fatty acids. Such sources include fish,
egg,liver,nutpastesandvegetableoils(DeweyandAdu-Afarwuah2008).
Table4.2:ProximatecompositionofBRBcompositeflours.
Treatmentshadbanana, riceandbean ratios, respectively,as follows:Trt-1=80:10:10,Trt-2=70:10:20,Trt-3=70:20:10,Trt-4=0:25:15,Trt-5=55:20:25,Trt-6=50:30:20,andTrt-7=45:40:15.Means ± SD in the same column with same letters are not significantly different (Tukey’s HSD test,P>0.05)
4.3Non-digestiblecarbohydratesofBRBcompositeflours
Dataforresistantstarch(RS),totaldietaryfiber(TDF),raffinoseandstachyoseforBRB
treatments are presented in Table 4.3. Numerically, values of all nutritional components
represented the original amount present in rice, bean and banana flourwith respect to the
percentageusedintheBRB(banana-rice-bean)compositeflours.Statistically,however,RS,and
TDF componentswerenot different for all BRB composite flour treatments (P>0.05). Some
differences(P<0.05)wereobservedinStachyoseandraffinoselevels.Trt-5containingthemost
beanscontentshowedthehighestraffinoseandstachyose.
Treatments Moisture(%) Ash(%) Fat(%) Protein(%)
Trt-1 4.41±0.94a 3.05±0.31c 1.23±0.07a 5.70±0.10aTrt-2 4.42±0.96a 2.77±0.07bc 1.35±0.05ab 7.29±0.16bcTrt-3 4.16±0.97a 2.81±0.32bc 1.42±0.07bc 6.15±0.17a
Trt-4 4.17±0.99a 2.49±0.15ab 1.52±0.07cd 5.83±1.28ab
Trt-5 4.12±1.10a 2.59±0.18ab 1.52±0.06cd 8.52±0.21d
Trt-6 4.04±0.85a 2.29±0.02a 1.62±0.08de 8.13±0.22cd
Trt-7 4.18±1.15a 2.25±0.16a 1.73±0.09e 7.77±0.24cd

60
Therearenospecificdietaryguidelinesfortheamountofnon-digestiblecarbohydrates
(NDC), suchas raffinose, stachyoseand resistant starch that shouldbepresent in thedietof
children in The lack of solid regulations of NDCs (encompasses components represented in
table3) isprobablyduetothewell-establishedphysiologicalrolesofNDCs inthehumangut.
NDCs provide prebiotic effects in children (Vandenplas 2002; Agget and others 2003). Some
oligosaccharides including galactooligosaccharides are occasionally added to commercial
complementary foodsasprebiotics (Aggetandothers2003;Vandenplas2002). Somestudies
alsosuggestalinkbetweenabsorptionofcertainmicronutrientswithdietshighinNDCs(Agget
andothers2003).
Regardless,onlymoderateamountsofNDCsareneededinyoungchildrenbecausethe
lack or over consumption of NDCs can cause certain adverse effects such as diarrhea and
difficultyemptying thebowel inyoungchildren (Aggetandothers2003).Theuseof riceand
riceproductsininfantfoodwereassociatedwithreductioninregurgitation.
TheAmericanAcademyofPediatricsrecommends0.5g/kgdietaryfiberperbodyweight
(Aggetandothers2003)andCODEXrecommends5%TDFondrybasisincomplementaryfoods.
Total dietary fiber content of BRB composite flours exceeds Codex standards for
complementary foods (CODEX1991). Itmaybevery important touse fullydehulledbeans in
flourformulationtohelpreducethedietaryfibercontent(CODEX1991).
RScontentsuggestedthatapproximately90.9to93.6g/100gofstarchpresent inBRB
compositeflourisdigestible.Thiswasevidentinthehighsucrose,fructoseandglucoselevels
recordedforbanana,riceandbeanflour(AppendixC).

61
Table4.3:Resistantstarch,totaldietaryfiber,raffinoseandstachyosecontentofBRBcompositeflours
Treatmentshadbanana, riceandbean ratios, respectively,as follows:Trt-1=80:10:10,Trt-2=70:10:20,Trt-3=70:20:10,Trt-4=0:25:15,Trt-5=55:20:25,Trt-6=50:30:20,andTrt-7=45:40:15.Means ± SD in the same column with same letters are not significantly different (Tukey’s HSD test,P>0.05)
4.4MineralComposition
Theamountofcalcium, iron,magnesiumandzinc inbanana, riceandbean flour,and
bananaflourareshowninTable4.4.Beanflourshowedhighlevelsofcalcium,iron,magnesium
andzinc.All threefloursdifferedsignificantly (P<0.05) inmineralcontents.Thecalcium, iron,
magnesiumandzinccontentsforbeanflourwereclosertothevaluesreportedbyWangand
others (2010) andBarampamaand Simard (1995) for kidneybeans.Wang andothers (2010)
reported78Ca,5.37Fe,153Mgand3.04Znmg/100gdrybasis.BarampamaandSimard(1995)
obtained145mg/100gforiron,2.76mg/100gforzincand145mg/100gformagnesium.
Mineral content obtainedwere similar to the amounts found byGregorio and others
(2000);Heinemannandothers(2005)fordifferentvarietiesofbrownrice.
Treatments Resistantstarch(g/100g)
Totaldietaryfiber(g/100g)
Raffinose(mg/g)
Stachyose(mg/g)
Trt-1 9.21±2.2a 10.35±0.87a 0.19±0.08a 3.53±0.17aTrt-2 8.17±1.18a 11.60±0.79a 0.35±0.07b 4.62±0.71abTrt-3 8.13±3.35a 10.1±0.73a 0.22±0.06ab 3.49±0.24aTrt-4 7.17±1.84a 10.64±0.65a 0.31±0.10b 3.99±1.03abTrt-5 6.71±1.30a 11.82±0.42a 0.46±0.09c 6.27±0.40cTrt-6 6.99±1.63a 11.11±0.33a 0.41±0.07c 4.92±0.43bTrt-7 6.38±1.40a 10.63±0.01a 0.35±0.09b 3.95±0.37ab

62
Amounts of calcium, iron, magnesium found in banana flour (20.61, 1.11, 101.95 and 0.66,
mg/100grespectively)arecomparabletoresultsacquiredbyHaslindaandothers(2009).They
obtained 28.9 Ca, 1.73 Fe, 105.34Mg and 0.74 Zn,mg/100g respectively on a dry basis for
greenbananaflour.
Table4.4:Calcium,iron,magnesiumandzinclevels(mg/100g)ofbanana,riceandbeanflour
Means ± SD in the same rowwith same superscripts are not significantly different (Tukey’sHSDtest,P>0.05)
Theamountofcalcium, iron,magnesiumandzinc inBRBcomposite flours treatments
arepresentedinTable4.5. Mineralcontentdifferedsignificantly(P<0.05)amongtreatments.
Thehighestironandmagnesiumlevels(2.83and111.61,mg/100g)respectivelyobtainedinthis
studyweregenerallyhigherthanthelargest(0.59Feand12.6Mg,mg/100g)valuerecordedby
Twum and others (2015) for maize-soybean composite flour. However, they reported 2.34
mg/100gofzinc,whereasthepresentstudyrecorded1.44mg/100g(Table4.5).
Recommendeddailynutrientintake(RDI)forinfantsandchildrenaged6monthsto23months
bytheWHO(2002)standardsforcalcium,iron,magnesiumandzincare400mgto500mg,5.8
mg to 9.3mg, 54mg to 60 mg and 2.8 mg to 4.1mg per day respectively. CODEX also
recommends that 50 to 75%of RDI of individual nutrients come from complementary foods
(CODEX1991;Dewey2008).Basedonbioavailability,RDIforironandzincarerecommendedas
Bananaflour Riceflour BeanflourCalcium 20.61±0.8a 10.61±0.41b 69.71±0.78cIron 1.11±0.08a 1.19±0.13b 7.27±0.27cMagnesium 101.95±0.98a 109.12±2.73b 131.23±1.18cZinc 0.66±0.03a 2.04±0.05b 2.29±0.04c

63
follows; iron (mg): 11.6, 5.8 and 3.9 for 5%, 10 % and 15% dietary iron bioavailability
respectively. Zinc (mg): 8.3, 4.1 and2.4 for low,mediumandhighdietary zincbioavailability
respectively(CODEX1991).
Considering these standards and other factors such as portion size consumed, the
frequency of feeding, and other diets that are consumed by infants, all composites could
minimally meet most of the daily nutritional requirements for this demographic except for
calciumrequirements.Itwouldthereforebenecessarytoincorporatedairy-baseddietsaspart
offoodsgiventoinfantstohelpmeettheirdailyneedsofcalcium.
Table4.5:Calcium,iron,magnesiumandzinclevelsinBRBcompositeflour
Treatments Calcium(mg/100g)
Iron(mg/100g)
Magnesium(mg/100g)
Zinc(mg/100g)
Trt-1 24.56±0.68ab 1.78±0.08a 105.82±0.97a 0.95±0.03aTrt-2 29.34±0.42d 2.45±0.08bc 108.48±1.00abc 1.14±0.03bTrt-3 23.72±1.19a 2.24±0.19b 105.40±3.24a 1.10±0.06bTrt-4 25.82±0.48bc 2.28±0.08b 108.38±0.60abc 1.26±0.03cTrt-5 30.81±0.49d 2.83±0.10d 111.61±0.38c 1.33±0.05cdTrt-6 26.63±1.08c 2.58±0.14cd 110.23±0.96b 1.41±0.03deTrt-7 24.14±0.48ab 2.33±0.10bc 108.12±1.10ab 1.44±0.17eTreatmentshadbanana, riceandbean ratios, respectively,as follows:Trt-1=80:10:10,Trt-2=70:10:20,Trt-3=70:20:10,Trt-4=0:25:15,Trt-5=55:20:25,Trt-6=50:30:20,andTrt-7=45:40:15.Means ± SD in the same column with same letters are not significantly different (Tukey’s HSD test,P>0.05)
4.5Physicalproperties
Table 4.6 represents data for color parameters, L*, a* and b* values. Color is an
importantparameter in foodproducts,particularlypertaining toaestheticsattributesof food
productsandconsumerpreference.L*value indicatesthedegreeof lightness(whiteness),a*

64
valuesrepresentsgreentoredandb*value,bluetoyellow.ThehighestLvaluewasexpressed
in rice flour followedbybean flourand thenbanana flour.Banana flourdifferedsignificantly
(P<0.05) from rice and bean flour, which did not differ from each other (P>0.05); this same
trendwasshownfora*values.Allfoursdifferedsignificantly(P<0.05)inb*parameter.Banana
flourhad thehighest a value (3.05) followedbybean flour (1.67) and lastly rice flour (0.36).
Beanflourshowedtheleastdegreeofyellowness(b*=8.51).Bananaflourshowedthehighest
b*value.
Table4.6:ColorparametersL*,a*,b*,valuesandChromaandHueangleofbanana,riceandbeanflour
L a b Chroma HueangleBananaflour 76.89±2.49b 3.05±0.47c 15.19±1.61b 15.5±1.66b 1.37±0.00bRiceflour 82.77±0.2a 0.36±0.19a 9.82±0.63a 9.82±0.62a 1.53±0.02aBeanflour 82.63±0.17a 1.67±0.06b 8.51±0.27a 8.67±0.25a 1.38±0.01b
Means±SDinthesamerowwithsamesuperscriptsarenotsignificantlydifferent(Tukey’sHSDtest,P>0.05)
Thelightredkidneybeansusedinthisresearchlostmostofitscoloraftersoaking.The
highdegreeof lightnesscouldalsobeattributedtothe fact thatabout70%of theseedcoats
wereremovedbeforemilling.Waniandothers(2013)reportedanL*valueof81.6,a*=1.3and
b*=7.9forrawredkidneybeanflour.Lambertandothers(2006)showedanL*valueof85,a*=
1andbvalueof13forrawbrownriceflour.L*a*andb*valuesarelowerthanreportedabove
(82.77, 0.36 and 9.82 respectively). Differences in physical attributes between cooked and
uncookedricecouldbeamajorfactor.L*parametersreportedherewereslightlyhigherwhiles
bvaluesarelower(L*=76.89andb=15.19)thanthosepresentedbyRakshit(2011)forfullyripe

65
bananaflour(L*=68.29andb=21.6).Thedifferenceisapparentlyduetotheuseofmoregreen
than ripe bananas in formulating the flour. Chroma color parameter is an indicator of the
richnessofcolorordegreeofcolorintensity. Bananaflourseemsricherincolorthanriceand
beanflours(P<0.05).Hueanglewhichbasicallyindicateshowasampleappeartothehumaneye
suggestthatriceflourappeareddifferently(P<0.05)frombeanandbananaflour.
Data for density, water absorption index (WAI), water solubility index (WSI), and oil
absorptioncapacity(OAC)arerepresentedintable4.7.Bulkdensityisthemassperunitvolume
ofoccupiedbyasample.Bulkdensityinfluencespackagingandtransportationdecisionsinthe
foodindustry.Bulkdensitydifferedforallthreeflours(P<0.05).Moongngarmandothers(2014)
showed 0.6 to 0.67 g/mL for varieties of brown rice flour,Wani and others (2013) reported
0.88mg/mL for raw kidney bean flour; Zakpa and others (2010) reported 0.76 g/mL for ripe
plantain.
Table4.7:Density,watersolubility,andwaterandoilabsorptionpropertiesrice,beansandbananaflour.
Bulkdensity(g/mL) WAC(g/g) WSI(%) OAC(g/g)Bananaflour 0.85±0.02a 3.03±0.64a 24.65±0.11a 1.82±0.04aRiceflour 0.708±0.03b 4.75±0.22b 1.1±0.0b 1.67±0.04bBeanflour 0.76±0.002c 3.80±0.01c 10.22±0.01b 1.65±0.03bMeans± SD in the same rowwith same superscripts arenot significantlydifferent (Tukey’sHSD test,P>0.05)
Waterabsorptionindexorwaterabsorptioncapacityandoilabsorptioncapacityisthe
amountofwateroroilrespectively,thatisheldpergramofflourorprotein. Riceflour,with
leastmoisturecontentexhibitedthehighestwaterholdingcapacityfollowedbybeanflourand

66
forbanana flour (Table4.7).This trend iscontrary to the linear relationshipbetweenprotein
concentrationandwaterabsorptioncapacity(RuiandBoye2013).
Foroilabsorptioncapacity (OAC),bananaflourshowedthehighestvalueanddiffered
significantlytoOACofbeansandriceflourdidnotdifferfromeachother(P>0.05)(Table4.7).
Siddiqandothers (2010)obtainedWAIandOACof2.25and1.52 respectively for redkidney
bean flour,which is similar to values obtain in the current study.WAI andOAC reported by
Beckerandothers(2014)forvarietiesofbrownriceflourwere2.85g/gtoand1.81to2.03g/g
respectively.Gamlath(2008)indicatedWAIforextrudedbananaflourat5.68g/g.Eventhough
theabovevaluesweobtained for riceandbanana flourdiffered fromwhat is reportedhere,
thedisparitiesarenotextreme.
Water solubility index is linked to degree of dextrinization and gelatinization and
consequentstarchsolubility.Itisareflectionoftheamountofstarchgranulesthatunderwent
disruption during processing (Nyombaire and others 2011). Rice is a relatively rich source of
starchcomparedtobeansandsemi-ripebananas.TheWSIvalueforriceflourisanindicationof
highdegreeofintactstarchgranuleshenceleastwatersolubility(Table4.7).Bananaflourwas
relatively more soluble (24.65%) but slightly higher than those found (23.35%) by Gamlath
(2008)forextrudedbananaflour.
L*, a*, b* Chroma, and Hue color parameters for composite flours are presented in
Table4.8.L*valuesrangedfrom76.74obtainedforTrt-1to79.85forTrt-6.LowerL*values
wouldbeanegativeindicatorofqualityduetoenzymaticbrowningofbananas.Valuesfora*
parameterrangedfrom1.99forTrt-6to2.91forTrt-1.b*valuesrangedfrom12.92to14.72.

67
Nodifferencesinb*values(p>0.05)wereobservedamongtreatments.Significantdifferences
existedforamongtreatmentsforL*anda*values.Asareandothers(2004)showedL*values
ranging from 79.07 to 91.21 for extruded rice-cowpea-groundnut blend. All BRB composite
floursshowedthesame(P>0.05)degreeof intensity indicatedbychromavalues (Table4.1).
Resultsobtained forHueangleshowedthat,with theexceptionofTrt-6andTrt-7, theother
porridgesamplesdidnotdifferinappearance.
Table4.8:ColorparametersL*,a*,b*,valuesandChromaandHueangleofBRBcompositeflour
Treatments L* a* b* Chroma HueangleTrt-1 76.74±1.69a 2.91±0.06c 14.72±1.03a 15.02±0.99a 1.375±0.02aTrt-2 77.31±1.05ab 2.72±0.05c 13.89±0.67a 14.15±0.64a 1.377±0.01aTrt-3 77.13±1.04ab 2.66±0.11c 13.81±0.86a 14.07±0.82a 1.379±0.02aTrt-4 78.94±0.75bc 2.30±0.08b 13.83±1.67a 14.02±1.66a 1.404±0.01abTrt-5 77.67±0.46ab 2.65±0.25c 13.28±0.32a 13.54±0.26a 1.373±0.02aTrt-6 79.85±0.75c 1.99±0.25a 13.12±1.77a 13.27±1.78a 1.420±0.00bTrt-7 78.97±0.40bc 2.00±0.06a 12.92±0.88a 13.07±0.87a 1.417±0.00bTreatmentshadbanana, riceandbean ratios, respectively,as follows:Trt-1=80:10:10,Trt-2=70:10:20,Trt-3=70:20:10,Trt-4=0:25:15,Trt-5=55:20:25,Trt-6=50:30:20,andTrt-7=45:40:15.Means ± SD in the same column with same letters are not significantly different (Tukey’s HSD test,P>0.05)
Results for density,Water absorption index (WAI), oil absorption capacity (OAC) and
watersolubilityindex(WSI)arepresentedintable4.9.ThehighestWSIwasobtainedforTrt-1
(28.41%) and the least (17%) for Trt-7. TheWSI obtained for composite flours appear to be
affected by amount of banana and rice flour used in formulation. Trt-1 formulatedwith the
highest banana contentwas themost solublewhiles Trt-7 containinghighest amountof rice
flour showed the least degree of solubility (Table 4.9). In exception of WSI, there were no
differences(P>0.05)betweenallBRBcompositeflourswithregardstodensity,WACandOAC.

68
Thedensities(0.78to0.82,mg/mL)obtainedforBRBporridgesfellwithintherange(0.295to
1.541, g/mL) reportedbyAsare andothers, (2004) for extruded rice-cowpea-groundnut. It is
expected that extruded flours would be lighter in terms of density, compared to those
processedbyothermethods(CODEX1991).
Table4.9:Density,waterandoilabsorptionandwatersolubilitypropertiesofBRBcompositeflours
Treatments Density WAI OAC WSI(%)Trt-1 0.82±0.009a 2.79±0.23a 1.76±0.04a 28.41±0.06bTrt-2 0.82±0.014a 2.87±0.16a 1.71±0.06a 26.12±0.02abTrt-3 0.81±0.034a 3.02±0.19a 1.77±0.05a 24.01±0.05abTrt-4 0.78±0.035a 3.03±0.21a 1.75±0.01a 23.29±0.04abTrt-5 0.80±0.007a 2.98±0.21a 1.76±0.03a 22.66±0.05abTrt-6 0.81±0.001a 3.10±0.32a 1.75±0.02a 19.84±0.37abTrt-7 0.78±0.037a 3.03±0.77a 1.74±0.03a 17.00±0.03a
Treatmentshadbanana, riceandbean ratios, respectively,as follows:Trt-1=80:10:10,Trt-2=70:10:20,Trt-3=70:20:10,Trt-4=0:25:15,Trt-5=55:20:25,Trt-6=50:30:20,andTrt-7=45:40:15.Means ± SD of treatments in the same column with same superscripts letters are not significantlydifferent(P>0.05).
4.6SensoryEvaluationandconsumeracceptability
The results of sensory attributes (appearance, consistency,mouthfeel, sweetness and
overall acceptability) of four BRB porridges are shown in Figure 4.1. Apart from sweetness
attribute, no differenceswere observed in panelist ratings between porridge samples for all
attributesandoverallacceptability.Sweetnessscoressuggestedahigherlikingofsampleswith
increasing banana content; Trt-1 & Trt-2 differed from Trt-5 (P< 0.05). All porridges were
acceptablebasedsensoryscoresof6.5to7.1ona9-pointHedonicscale.Outof31panelists29
ofthemagreedtheywouldfeedanyoftheporridgestoachildbelow5years.

69
Figure4.1:SensoryattributesandoverallacceptabilityofBRBporridge
Treatmentshadbanana, riceandbean ratios, respectively,as follows:Trt-1=80:10:10,Trt-2=70:10:20,Trt-4=0:25:15,Trt-5=55:20:25.
The percentage of mothers on the hedonic scale regarding overall acceptability is
presentedinfigure4.2.Consumertastepreferencesareoneofthemostcomplicatedaspectsof
sensorychemistry,duetogreatdisparities intastepreferences. It ishoweverwellnotedthat
the demographic used for the sensory evaluation are from 17 different countries. Thewide
range of taste preferences was evident in the overall liking for each of the porridges.Most
mothers, 41.9% liked Trt-1 very much, but Trt-1 also seemed to be the highest on “dislike
slightly”and“dislikemoderately”scale(6.5%).Surprisingly,thesecondhighestporridgeonthe
“likeverymuch”scale(likedby32.3%panelists)wasTrt-5.Thisconfirmedthecomplexityand
unpredictabilityofconsumerpreferences.Regardless,therewasadecentoverallacceptability
ofallporridges.
5.86
6.26.46.66.87
7.27.4Appearance
Consistency
Mouthfeel
Sweetness
Flavor
Overallacceptability
Trt-1
Trt-2
Trt-4
Trt-5

70
Figure4.2:PercentpanelistdistributionofoverallacceptabilityofBRBporridge
Treatmentshadbanana, riceandbean ratios, respectively,as follows:Trt-1=80:10:10,Trt-2=70:10:20,Trt-4=0:25:15,Trt-5=55:20:25.
Figure4.3representpercentagedistributionofdescriptionofattributesbypanelistfor
BRBcompositeporridgesamples;Panelistswereaskedto“checkallthatapply”(CATA).There
were distinctions and some trends between samples for some attributes such as flavorful,
bland, beany and raw. The percentage of panelists, who selected flavorful, decreased with
decreasingbananaflourcontent;thissametrendinreversewasrecordedfor“bland”attribute.
“Traditional” description of samples was higher for higher rice plus bean flour content
combined (Figure 4.3). There were differences (P<0.05) between porridge samples for:
“flavorful”,“sweet”andtraditionalattributes.
Approximately15%of themothersperceivedbeany flavor inTrt-2andTrt-5.Mostof
the mothers who selected beany and “raw” attributes chose the composite flours with the
highest percentage of bean flour (20% and 25%). This suggests a feeling of “rawness” with
0.05.010.015.020.025.030.035.040.045.0
%panelists
Trt-1
Trt-2
Trt-4
Trt-5

71
increasing bean flour content. However, no differenceswere observed between samples for
panelists who described the porridge samples as “beany” and “raw”. At 10% bean flour, it
appears panelists’ perception of “beany” flavor and rawness of porridge, only one panelist
perceivedbeany“flavor”and“rawness”.
Figure4.3:Checkallthatapply(CATA)attributesofBRBporridge
Treatmentshadbanana, riceandbean ratios, respectively,as follows:Trt-1=80:10:10,Trt-2=70:10:20,Trt-4=0:25:15,Trt-5=55:20:25.Thesamelettersonbarsarenotsignificantlydifferent(P>0.05)
Resultfor“CheckAllThatApply”(CATA)ingredientsisshowninFigure4.4.Bananawas
themostperceivedingredient.Bananahasanaturallystrongandoverwhelmingflavor,which
increases with the degree of ripeness. The perception and distinction of banana flavor as
dehydratedflourincompositescouldsuggestminimalflavorlossduringtheair-dryingprocess.
Mothers also perceived bean and rice; these ingredients including bananawere listed in the
a
a
a
a
ab
b
a
ab
aa
a
a
b a
bca
a
a
ab
a
ac
a
a a
b
a
a
0.0
10.0
20.0
30.0
40.0
50.0
60.0
70.0
Percentageofpanelists
Trt-1
Trt-2
Trt-4
Trt-5

72
consent forms that were signed by participants. Differences existed between samples for
banana,beanandcornperceptionbypanelists.
Other ingredients and flavors indicated were corn, carrot, wheat and citrus. The
number of panelists who perceived corn andwheatwere relatively higher compared to the
numberwhoperceivedcarrotandcitrus;onlyonepersonperceivedcarrot.Thepercentageof
panelists perceptionof citrus decreasedwithdecreasingbanana component,which couldbe
duetothepresenceofabout7mgascorbicacid inbananaflour(USDA2016).Recognitionof
wheat, corn and carrot could be linked to flavor and ingredient interaction, producing a
differentsensoryeffectoritcouldbejustasaresultofmisperceptionbysomepanelists.
Figure4.4:Checkallthatapply(CATA)ingredientsofBRBporridge
Treatmentshadbanana, riceandbean ratios, respectively,as follows:Trt-1=80:10:10,Trt-2=70:10:20,Trt-4=0:25:15,Trt-5=55:20:25.Barssharingthesameletterwithinattributesarenotsignificantlydifferent(p>0.05)
a
b
a
ab a
a
a
ab
a
a ab
a
a
a
ab
a
a
aba
a
b
a
a
aa
a
a
0.0
10.0
20.0
30.0
40.0
50.0
60.0
70.0
80.0
90.0
Banana Bean Carrot Rice Corn Wheat Citrus
Percentageofpanelists
Trt-1
Trt-2
Trt-4
Trt-5

73
CHAPTER5
OUTCOMESandRECOMMENDATIONS
5.1Conclusion
All BRB composite flour contained significant levels of protein. Flatulence-causing
oligosaccharideswere lower inBRBflour than incookedbeanflourandtheamountsofnon-
energy contributing resistant starch was less than 10%. Dietary fiber levels exceeded Codex
Alimentarius recommendations forcomplementary foods.Banana flourhadapositive impact
on Sweetness and “flavorful” attribute of BRB porridge and could be added to traditional
cereal-legume blends to improve flavor and sweetness, which could ultimately lead to
avoidanceofaddedsugarstotraditionalinfantfoods.Instantporridgespreparedfromselected
BRB composite flourswere all of acceptable quality by 31mothers of Africa andAsia origin.
Twenty-ninemothers indicated that theywould feedat least oneof theporridges to a child
below 5 years of age. BRB porridge could be incorporated as part of children’s diet to help
alleviateproteinenergymalnutrition.
5.2Recommendations
Itisimportanttoaccompanydietscontainingcereal-legumeblendswithfoodscoming
fromanimal sources inorder to improvezincand ironcontents toensureadequacyof these
nutrients for infants. Additionally, fortification of cereal-legume blends with limiting but
essential minerals is important to meet daily nutritional requirements. Also, fruits and
vegetablescontaininghighlevelsofvitaminCcouldbeaddedtodietsgiventoinfantstohelp
improveabsorptionofsolublenon-hemeiron,whichisthemaincomponentinmosttraditional

74
infantdiets.Antinutritionalfactorsshouldbedeterminedtoknowtheextentofbioavailability
ofzincandironincereal-legumeblendsmadeforchildren,suchasBRBinfantfood.

75
APPENDICES

75
AppendixA:Recommendednewdietaryreferenceintake
Table6.1:Recommendednewdietaryreferenceintake(DRI)forchildrenage6to23months
Nutrient
RecommendedIntake
6to8months 9to11months 12to23months
Protein(g/day) 9.1 9.6 10.9
VitaminA(μgRE/day) 500 500 300
Folate(μg/day) 80 80 150
Niacin(mg/day) 4 4 6
Pantothenicacid(mg/day) 1.8 1.8 2.0
Riboflavin(mg/day) 0.4 0.4 0.5
Thiamine(mg/day) 0.3 0.3 0.5
VitaminB6(mg/day) 0.3 0.3 0.5
VitaminB12(μg/day) 0.5 0.5 0.9
VitaminC(mg/day) 50 50 15VitaminD(μg/day) 5 5 5
VitaminK(μg/day) 2.5 2.5 30Calcium(mg/day) 270 270 500
Chloride(mg/day) 500 500 800
Copper(mg/day) 0.2 0.2 0.3Fluoride(μg/day) 0.5 0.5 0.7
Iodine(μg/day) 130 130 90
Iron(mg/day) 11 11 7
Magnesium(mg/day) 75 75 80Manganese(mg/day) 0.6 0.6 1.2
Phosphorous(mg/day) 275 275 460
Potassium(mg/day) 700 700 800Selenium(μg/day) 20 20 20
Sodium(mg/day) 320 350 500
Zinc(mg/day) 3 3 3(Adebeyiandothers2016).
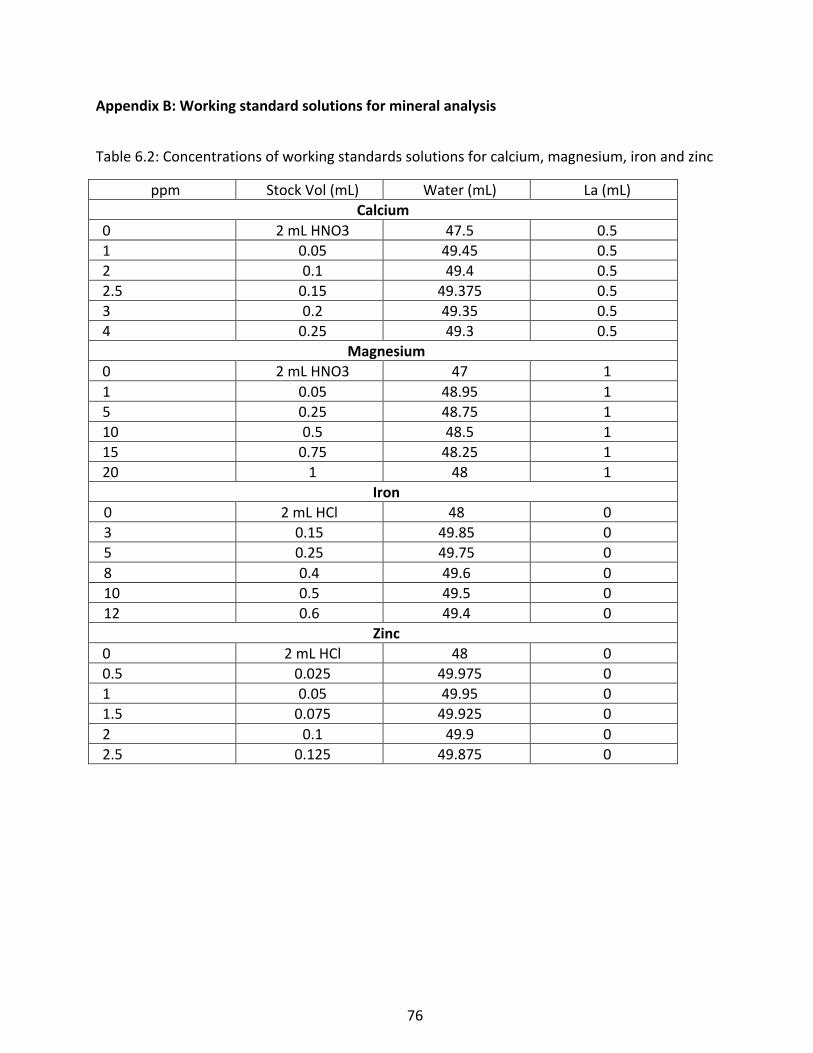
76
AppendixB:Workingstandardsolutionsformineralanalysis
Table6.2:Concentrationsofworkingstandardssolutionsforcalcium,magnesium,ironandzinc
ppm StockVol(mL) Water(mL) La(mL)Calcium
0 2mLHNO3 47.5 0.51 0.05 49.45 0.52 0.1 49.4 0.52.5 0.15 49.375 0.53 0.2 49.35 0.54 0.25 49.3 0.5
Magnesium0 2mLHNO3 47 11 0.05 48.95 15 0.25 48.75 110 0.5 48.5 115 0.75 48.25 120 1 48 1
Iron0 2mLHCl 48 03 0.15 49.85 05 0.25 49.75 08 0.4 49.6 010 0.5 49.5 012 0.6 49.4 0
Zinc0 2mLHCl 48 00.5 0.025 49.975 01 0.05 49.95 01.5 0.075 49.925 02 0.1 49.9 02.5 0.125 49.875 0

77
AppendixC:Chromatogramoutputforsugaranalysis
Riceflour
Riceflour
Bananaflour
Bananaflour
Beanflour
Beanflour
Figure6.1:Chromatogramsforrice,bananaandbeanflourinreplicates
Peak1=glucose-6phosphate,peak2=stachyose,peak3=raffinose,peak4=sucrose,peak5=glucose,peak7=fructose

78
REFERENCES

79
REFERENCES
AchiOK,Ukwuru,M. 2015. Cereal-based fermented foodsofAfrica as functional foods. Int JMicrobiolApp2:71-83Achidi A U, Tiencheu B, Tenyang N, Womeni HM, Moyeh MN, Ebini LT, Tatsinkou F. 2016.Quality evaluation of nine instant weaning foods formulated from cereal, legume, tuber,vegetableandcrayfish.IntJofFoodSciNutrEng6:21–31.AdenikeOM. 2016. Effect of co-fermentation on nutritional and sensory evaluation of bitteryamandcowpeaascomplementaryfood.IntJCurrMicrobiolAppSci5:267–78.AfifyAE,El-BeltagiHS,El-SalamSMA,OmranAA.2011.Bioavailabilityofiron,zinc,phytateandphytase activity during soaking and germination of white sorghum varieties. Plos One 6:e25512.doi:10.1371/journal.pone.0025512.Aggett PJ, Agostoni C, Axelsson I, Edwards CA, Goulet O, Hernell O. 2003. Non-digestiblecarbohydrates in the diets of infants and young children: a commentary by the ESPGHANCommitteeonNutrition.JPediatrGastroentNutr36:329–37.Agostoni C, Axelsson I, Goulet O, Koletzko B, Michaelsen KF, Puntis JW. 2004. Prebioticoligosaccharidesindieteticproductsforinfants:acommentarybytheESPGHANCommitteeonNutrition.JPediatrGastroentNutr39:465–73.AguileraJM,ChiraltA,FitoP.2003.Fooddehydrationandproductstructure.TrendsFoodSciTech14:432–37.AkerbergAK,LiljebergHG,GranfeldtYE,DrewsAW,BjörcIM1998.Aninvitromethod,basedon chewing, to predict resistant starch content in foods allows parallel determination ofpotentiallyavailablestarchanddietaryfiber.JNutr128:651–60.Amagloh FK, Hardacre A,Mutukumira AN,Weber JL, Brough L, Coad J. 2012. Sweet potato-basedcomplementaryfoodforinfantsinlow-incomecountries.FoodNutrBulletin33:3–10.[AOAC] Association of Official Analytical Chemists 1987. Changes in methods. J Assoc AnalChem70:393.[AOAC]AssociationofOfficialAnalyticalChemists2000.Officialmethodsofanalysis.17thed,AOACINTERNATIONAL,WashingtonDC,U.S.A.[AOAC]AssociationofOfficialAnalyticalChemists,2005.Officialmethodsofanalysis.18thed,

80
AOACINTERNATIONAL,Gaithersburg,MD,U.S.A.Asare EK, Sefa-Dedeh S, Sakyi-Dawson E, Afoakwa EO. 2004. Application of response surfacemethodology for studying the product characteristics of extruded rice–cowpea–groundnutblends.IntJFoodSciNutr55:431–9.AuroreG, Parfait B, Fahrasmane L. 2009. Bananas, rawmaterials formaking processed foodproducts.TrendsFoodSciTech20:78–91.Babu PD, Subhasree RS, Bhakyaraj R, Vidhyalakshmi R. 2009. Brown rice-beyond the colorrevivingalosthealthfood.Am-EurasJAgron2:67-72.BarampamaZ,SimardRE.1995.Effectsofsoaking,cookingandfermentationoncomposition,in-vitro starch digestibility and nutritive value of common beans. Plant Foods HumNutr 48:349–65.Bazaz R, Baba WN, Masoodi FA. 2016. Development and quality evaluation of hypoallergiccomplementary foods from rice incorporated with sprouted green gram flour. Cogent FoodAgri2:1154714.Bello-Perez AL, Agama-Acevedo E, Gibert O, Dufour D. 2012. Banana. In: Tropical andSubtropicalFruitProcessingandPackaging.Editor,Siddiq,M. JohnWiley&Sons,Ames, IowaJohnWiley&Sons,Inc.p137-57.Bird A, Conlon M, Christophersen C, Topping D. 2010. Resistant starch, large bowelfermentation and a broader perspective of prebiotics and probiotics. Beneficial Microbes 1:423–31.BoakyeID,EgyirSI.2014.FactorsthatInfluenceHouseholdDemandforLocallyProducedBrownRiceinGhana.JEconSustainDev5:14-21.BrownleeIA.2011.Thephysiologicalrolesofdietaryfibre.FoodHydrocolloids25:238–50.Camire ME, Camire A, Krumhar K. 1990. Chemical and nutritional changes in foods duringextrusion.CritRevFoodSci29:35–57.Chen RR, Wang J, Gong L, Li YZ. 2006. Comparison of vacuum belt, freeze and air-dryingmethodsofprocessingbananapuree.TChineseSocAgriMach37:159–62.CODEX. 1991. Guidelines on Formulated Complementary foods for older infants and youngchildren(Cac/Gl8-1991).Availablefrom:http://www.fao.org/fao-who-codexalimentarius/standards/list-of-standards/en/.Accessed2016September15.

81
CODEX.1985.Standardforwheatflour.(CODEXSTAN152-1985).Availablefrom:http://www.fao.org/fao-who-codexalimentarius/standards/list-of-standards/en/.Accessed2016September20.CohenJS,YangTC.1995.Progressinfooddehydration.TrendsFoodSciTech6:20–5.DaMotaRV,LajoloFM,CordenunsiBR,CiaccoC.2000.Compositionandfunctionalpropertiesofbananaflourfromdifferentvarieties.Starch-Stärke52:63–8.De laHera E,GomezM, Rosell CM. 2013. Particle size distributionof rice flour affecting thestarchenzymatichydrolysisandhydrationproperties.CarbohydPolym98:421–7.Dewey KG, Adu-Afarwuah S. 2008. Systematic review of the efficacy and effectiveness ofcomplementaryfeedinginterventionsindevelopingcountries.MaternChildNutr4:24–85.DeweyKG,BrownK.H.2003.Updateontechnicalissuesconcerningcomplementaryfeedingofyoungchildren indevelopingcountriesand implicationsfor interventionprograms.FoodNutrBull24:5–28.Duncan S, Barbeu B, Aigster A. 2009. Effects of acute resistant starch consumption onpostprandialglucoseandinsulinresponsesandoxidativestressparametersinHispanicwomen.IGERT.Availablefrom:http://www.igert.org/highlights/155.Accessed2016September24.Egaunlety M, Aworh OC, Akingbala JO Houben JH, Nago CM. 2002. Nutritional and sensoryevaluationofmaize-basedtempe-fortifiedweanigfoods.IntJFoodSciNutr53:15–27.EgaulentyM,AworhOC.2003.Effectofsoaking,dehulling,cookingandfermentationwithRhizopusoligosporusontheoligosaccharides,trypsininhibitor,phyticacidandtanninsofsoybean.(GlycinemaxMerr.),cowpea(VignaunguiculataL.Walp)andgroundbean(MacrotylomageocarpaHarms)JFoodEng56:249–254.EggumBO,JulianoBO,PerezCM,AcedoEF.1993.Theresistantstarch,undigestibleenergyandundigestibleproteincontentsofrawandcookedmilledrice.JCerealSci18:159–170.Ejigui J, Savoie L, Marin J, Desrosiers T. 2007. Improvement of the nutritional quality of atraditional complementary porridge made of fermented yellow maize (Zea mays): Effect ofmaize–legumecombinationsandtraditionalprocessingmethods.FoodNutrBull28:23–34.Gabaza M, Muchuweti M, Vandamme P, Raes K. 2016. Can fermentation be used as asustainable strategy to reduce iron and zinc binders in traditional African fermented cerealporridgesorgruels?FoodRevInt.doi:10.1080/87559129.2016.1196491

82
GalatiA,Oguntoyinbo FA,MoschettiG, CrescimannoM, Settanni L. 2014. The cerealmarketandtheroleoffermentationincereal-basedfoodproductioninAfrica.FoodRevInt30:317–37.GamlathS.2008.Impactofripeningstagesofbananaflouronthequalityofextrudedproducts.IntJFoodSciTech43:1541–1548.GibsonRS,BaileyKB,GibbsM,FergusonEL.2010.Areviewofphytate,iron,zinc,andcalciumconcentrations in plant-based complementary foods used in low-income countries andimplicationsforbioavailability.FoodNutrBull31:S134–S46.GregorioGB,SenadhiraD,HtutH,GrahamRD.2000.Breedingfortracemineraldensityinrice.FoodNutrBull21:382–6.[GSS/GHS/ICF] Ghana Statistical Service. Ghana Health Service (GHS), and ICF. 2015.International Demographic and Health Survey. Rockville, Maryland, USA. Available from:https://dhsprogram.com/pubs/pdf/FR307/FR307.pdf.Accessed2016September24.HaslindaWH,ChengLH,ChongLC,AziahAN.2009.Chemicalcompositionandphysicochemicalpropertiesofgreenbanana(Musaacuminata)flour.IntJofFoodSciNutr60:232–239.HeinemannRJB,FagundesPL,PintoEA,PenteadoMVC,Lanfer-MarqueUM.2005.Comparativestudy of nutrient composition of commercial brown, parboiled andmilled rice from Brazil. JFoodComposAnal18:287–96.HurleyWL, Doane RM. 1989. Recent developments in the roles of vitamins andminerals inreproduction.JDairySci72:784–804.JangchudK,BunnagN.2001.EffectofsoakingtimeandcookingtimeonqualitiesofredKidneybeanflour.KasetsartJ,35:409–15.Karthiayani A, Varadharaju N, Siddharth M. 2013. Textural properties of banana (musaacuminata) stored undermodified atmosphere conditions using diffusion channel. J Agri EngBiotech1:17-22.KaurD,Kapoor̂AC.1990.Someantinutritionalfactorsinricebean(Vignaumbellata):effectsofdomesticprocessingandcookingmethods.FoodChem37:171–9.KuoTM,VanmiddlesworthJF,WolfWJ.1988.Contentofraffinoseoligosaccharidesandsucroseinvariousplantseeds.JAgriFoodChem36:32–6.
83
Lamberts L, Bie ED, Derycke V, Veraverbeke WS, De Man W, Delcour JA. 2006. Effect ofprocessingconditionsoncolorchangeofbrownandmilledparboiledrice.CerealChem83:80–85.LangkildeAM,ChampM,AnderssonH.2002.Effectsofhigh-resistant-starchbananaflour(RS2)on in vitro fermentation and the small-bowel excretion of energy, nutrients, and sterols: anileostomystudy.AmJClinNutr75:104–111.LarteyA,ManuA,BrownKH,PeersonJM,DeweyKG.1999.Arandomized,community-basedtrial of the effects of improved, centrally processed complementary foods on growth andmicronutrientstatusofGhanaianinfantsfrom6to12monthsofage.AmJClinNutr70:391–404.Lee HJ, Byun SM, Kim HS. 1988. Studies on the dietary fiber of brown rice andmilled rice.KoreanJFoodSciTech20:576–84.LittleAC.1975.Aresearchnote:Offonatangent.JFoodSci40:410–11.MasonWR,HoseneyRC.1986.Factorsaffectingtheviscosityofextrusion-cookedwheatstarch.Cerealchem63:436-41.Meilgaard M, Civille GV, Carr BT. 1999. Affective tests: consumer tests and in-house panelacceptancetestsIn:Sensoryevaluationtechniques,3rded.NewYork:CRCPress.p242–3.MenezesEW,TadiniCC,TribessTB,ZuletaA,BinaghiJ,PakN.2011.Chemicalcompositionandnutritionalvalueofunripebananaflour(Musaacuminata,var.Nanicão).PlantFoodHumNutr66:231–7.MohapatraD,MishraS,SutarN.2010.Bananaanditsby-productutilization:anoverview.JSciIndRes69:323–9.MoongngarmA,MoontreeT,DeedpinrumP,PadtongK.2014.FunctionalpropertiesofbrownriceflourasaffectedbyGermination.APCBEEProcedia8:41–6.Mulimani VH. 1995. Enzymic hydrolysis of raffinose and stachyose in soymilk by alpha-galactosidasefromGibberellafujikuroi.BiochemMolBiolInt36:897–905.
MurthyBS,HiremathJP,DarshanGB,RoopaOM.2016.QualityAttributesOfComplementaryFoodPreparedUsingMaltedWheatAndFoxtailMillet(Setariaitalica)FloursWithMilkSolids.IntJSciEnvironTech5:765–73.MussattoSI,MancilhaIM.2007.Non-digestibleoligosaccharides:areview.CarbohydPolym68:587–97.

84
Nagai TO, Staatz JM, Bernsten RH, Sakyi-Dawson EO, Annor GA. 2012. Locally ProcessedRoasted-Maize-based Weaning Foods Fortified with Legumes: Factors Affecting TheirAvailabilityandCompetitivenessinAccra,Ghana.AfrJFoodAgriNutrDev9:1927–44.NyombaireG,SiddiqM,DolanKD.2011.Physico-chemicalandsensoryqualityofextrudedlightredkidneybean(PhaseolusvulgarisL.)porridge.LWT-FoodSciTech44:1597–602.Obatolu VA, Cole AH, Maziya-Dixon BB. 2000. Nutritional quality of complementary foodpreparedfromunmaltedandmaltedmaizefortifiedwithcowpeausingextrusioncooking.JSciFoodAgri80:646–50.OjokohAO, Fagbemi AO. 2016. Effects of Fermentation and Extrusion on the Proximate andOrganolepticPropertiesofCowpea-plantainFlourBlends.BritMicrobiolResJ13:1.OkakaJC,PotterNN.1977.Functionalpropertiesofcowpea-wheatflourblendinbreadmaking.JFoodSci42:828–33.Oyeyink AT, Oyeyinka SA. 2016.Moringa oleifera as a food fortificant: Recent trends andprospects. J Saudi Soc Agri Sci. Available from: http://dx.doi.org/10.1016/j.jssas.2016.02.002.Accessed2016September27.
Pelto GH, Armar-Klemesu M. 2011. Balancing nurturance, cost and time: complementaryfeedinginAccra,Ghana.MaternChildNutr7:66–81.
PillayM, FungoR. 2016.Diversity of iron and zinc content in bananas fromeast and centralAfrica.HortScience51:320–324.ProthonF.2002.Combineddehydrationmethods-fromfresh fruit tohigh-quality ingredients.LundUniversity.Availablefrom:http://lup.lub.lu.se/record/465349.Accessed2016September27.Rakshit NJSK. 2011. Processing and Functional Properties of Banana Flour. Int Conf SustainCommdev27:41-46.RoberfroidM, Slavin J. 2000.Nondigestibleoligosaccharides. Crit Revs Food Sci andNutr 40:461–480.RuiX,BoyeIJ.2013.ProcessingofDryBeanFlourfractions.In:SiddiqMandUebersax,editors.DryBeansandPulsesProduction,ProcessingandNutrition.Ames,Iowa:JohnWiley&Sons,Inc.p205‒34.

85
SajilataMG,SinghalRS,KulkarniPR.2006.Resistantstarch–areview.ComprRevFoodSci5:1–17.ShanmugavelanP,KimSY,KimJB,KimHW,ChoSM,KimSN,KimHR.2013.Evaluationofsugarcontent and composition in commonly consumed Korean vegetables, fruits, cereals, seedplants,andleavesbyHPLC-ELSD.CarbohydRes380:112–7.SharmaA, YadavBS, Ritika. 2008. Resistant starch: physiological roles and food applications.FoodRevInt24:193–234.Shimelis EA, Rakshit SK. 2007. Effect of processing on antinutrients and in vitro proteindigestibility of kidney bean (Phaseolus vulgaris L.) varieties grown in East Africa. Food Chem103:161–172.SiddiqM,NyombaireG,DolanKD,MatellaNJ,HarteJB.2006.ProcessingofSugar-CoatedRedKidney Beans (Phaseolus vulgaris L): Fate of oligosaccharides and phytohemagglutinin (PHA),andEvaluationofSensoryQuality.JFoodSci71:521-26.SiddiqM,RaviR,HarteJB,Dolan,KD.2010.Physicalandfunctionalcharacteristicsofselecteddrybean(PhaseolusvulgarisL.)flours.LWT-FoodSciandTech43:232–7.Temba MC, Njobeh PB, Adebo OA, Olugbile AO, Kayitesi E. 2016. The role of compositingcerealswithlegumestoalleviateproteinenergymalnutritioninAfrica.IntlJofFoodSciTech.doi:10.1111/ijfs.13035.Thipayarat A. 2007. Quality and physiochemical properties of banana paste under vacuumdehydration.IntlJofFoodEng.doi:10.2202/1556-3758.1112.TomlinsKI,ManfulJT,LarwerP,HammondL.2005.UrbanconsumerpreferencesandsensoryevaluationoflocallyproducedandimportedriceinWestAfrica.FoodQualPrefer16:79–89.Topping DL, Clifton PM. 2001. Short-chain fatty acids and human colonic function: roles ofresistantstarchandnonstarchpolysaccharides.PhysiolRev81:1031–64.ToshSM,YadaS.2010.Dietaryfibresinpulseseedsandfractions:Characterization,functionalattributes,andapplications.FoodResInt43:450–60.Tovar J, Bjoerck IM, AspNG. 1990. Analytical and nutritional implications of limited enzymicavailabilityofstarchincookedredkidneybeans.JAgriFoodChem38:488–93.TwumLA,KottohID,Torby-TettehW,BuckmanES,Adu-GyamfiA.2015.PhysicochemicalandElementalAnalysesofBananaCompositeFlourforInfants.BritJApplSciTech6:276.

86
[UNICEF/WHO]WorldBankGroupjointchildmalnutritionestimates.2015.Levelsandtrendsinchildmalnutrition,2015edition.Availablefrom:http://www.who.int/nutgrowthdb/jme_brochure2015.pdf?ua=1.Accessed2016September24.UNICEF.2015.CommittingtoChildSurvival:APromiseRenewedProgressReport2015.Keyfindingsofthe2015edition.Availablefrom:http://www.apromiserenewed.org/wp-content/uploads/2015/09/APR_2015_8_Sep_15.pdf.Accessed2016September19.USDA Food Composition Databases: National Nutrient Database for Standard ReferenceRelease28slightlyrevisedMay,2016.Availablefrom:https://ndb.nal.usda.gov/ndb/search/list.Accessed2016September24.Vandenplas Y,DeGreef E,Devreker T,Veereman-WautersG,HauserB. 2013. Probiotics andprebioticsininfantsandchildren.CurrInfectDisRep15:251–62.Vega-MercadoH,Góngora-NietoMM,Barbosa-CánovasGV.2001.Advancesindehydrationoffoods.JFoodEng49:271–89.VollmerS,HarttgenK,SubramanyamAM,FinlayJ,KlasenS,SubramanianSV.2014.Associationbetween economic growth and early childhood undernutrition: evidence from 121Demographic and Health Surveys from 36 low-income and middle-income countries. LancetGlobHealth2:225-34.Wang J, Li YZ, Chen RR, Bao JY, Yang GM. 2007. Comparison of volatiles of banana powderdehydratedbyvacuumbeltdrying,freeze-dryingandair-drying.FoodChem104:1516–21.Wang N, Hatcher DW, Tyler RT, Toews R, Gawalko EJ. 2010. Effect of cooking on thecompositionofbeans(PhaseolusvulgarisL.)andchickpeas(CicerarietinumL.).FoodResInt43:589–94.Wani IA,SogiDS,WaniAA,GillBS.2013.Physico-chemicalandfunctionalpropertiesoffloursfromIndiankidneybean(PhaseolusvulgarisL.)cultivars.LWT-FoodSciTech,53:278–84.Watson S, Gong YY, Routledge M. 2015. Interventions Targeting Child Undernutrition inDevelopingCountriesMayBeUnderminedbyDietaryExposuretoAflatoxin.CritRevFoodSciNutrdoi:10.1080/10408398.2015.1040869.WCARO,2011,UNICEFannualReportforGhana.Availablefrom:http://www.unicef.org/ghana/gh_resources_2011Annual_Report.pdf.Accessed2016September24.

87
WelchM, Graham D. 2012. Breeding formicronutrients in staple food crops from a humannutritionperspective.JExpBot55:353-64.[WHO/FAO]WorldHealthOrganization and Food andAgricultureOrganization of theUnitedNations.2004.Vitaminandmineralrequirements inhumannutrition:reportofa jointexpertconsultation,2004,2ndedition.WHOHQ/AFRO.2013.Maternal,infantandyoungchildnutritioninEastandSouthernAfricancountries: moving to national implementation. Report of a World Health Organizationworkshop.Entebbe,Uganda,26–28November2013.Geneva:WorldHealthOrganization;2014.
[WHO] World Health Organization. 1998. Complementary feeding of young children indevelopingcountries:AReviewofCurrentScientificKnowledge:Geneva.
[WHO] World Health Organization. 2015. Guideline: Sugars intake for adults and children,Geneva.
[WHO]WorldHealthOrganization.2016.Guideline:Daily ironsupplementationin infantsandchildren,2016,Geneva.WooKS,SeibPA,2002.Cross-linkedresistantstarch:preparationandpropertiesCerealChem79:819–825.Zakpaa HD, Mak-Mensah EE, Adubofour J. 2010. Production and characterization of flourproducedfromripe“apem”plantain(MusasapientumL.var.paradisiacal;Frenchhorn)growninGhana.JAgriBiotechnolSustainDev2:92.