Embed Size (px)
Citation preview

The University of MaineDigitalCommons@UMaine
Electronic Theses and Dissertations Fogler Library
Summer 8-2018
Development and Shelf Life Evaluation of a NovelFermented Seaweed Sauerkraut UtilizingCommercially Important Maine SeaweedsSarah M. BrochuUniversity of Maine, [email protected]
Follow this and additional works at: https://digitalcommons.library.umaine.edu/etd
Part of the Food Science Commons
This Open-Access Thesis is brought to you for free and open access by DigitalCommons@UMaine. It has been accepted for inclusion in ElectronicTheses and Dissertations by an authorized administrator of DigitalCommons@UMaine. For more information, please [email protected].
Recommended CitationBrochu, Sarah M., "Development and Shelf Life Evaluation of a Novel Fermented Seaweed Sauerkraut Utilizing CommerciallyImportant Maine Seaweeds" (2018). Electronic Theses and Dissertations. 2891.https://digitalcommons.library.umaine.edu/etd/2891

DEVELOPMENT AND SHELF LIFE EVALUATION OF A NOVEL FERMENTED
SEAWEED SAUERKRAUT UTILIZING COMMERCIALLY
IMPORTANT MAINE SEAWEEDS
By
Sarah Brochu
B.S. Maine Maritime Academy, 2016
A THESIS
Submitted in Partial Fulfillment of the
Requirements for the Degree of
Master of Science
(in Food Science and Human Nutrition)
The Graduate School
The University of Maine
August 2018
Advisory Committee:
Denise Skonberg, Associate Professor of Food Science and Human Nutrition,
Advisor
Brian Perkins, Research Assistant Professor of Food Science and Human Nutrition
Jennifer Perry, Assistant Professor of Food Science and Human Nutrition
Juan J Romero, Assistant Professor of Animal Nutrition

© 2018 Sarah Brochu
All Rights Reserved
ii

DEVELOPMENT AND SHELF LIFE EVALUATION OF A NOVEL FERMENTED
SEAWEED SAUERKRAUT UTILIZING COMMERCIALLY
IMPORTANT MAINE SEAWEEDS
By Sarah Brochu
Thesis Advisor: Dr. Denise Skonberg
An Abstract of the Thesis Presented in Partial Fulfillment of the Requirements for the
Degree of Master of Science (in Food Science and Human Nutrition)
August 2018
Fermented vegetables can provide consumers with important health benefits, particularly
due to the presence of probiotics. These fermented products have gained popularity with
American consumers over the past decade. Therefore, a lacto-fermented seaweed sauerkraut,
containing seaweed and cabbage, was developed to address this trend and to create a value-added
seaweed product with extended refrigerated shelf life. The objective of this study was to evaluate
the effects of kelp species and seaweed incorporation level on the fermentative success,
microbial safety, consumer acceptability, and refrigerated shelf life of seaweed sauerkraut for 60
days post inoculation.
Six treatments with varying levels (25%, 50%, 75%) of farm-raised kelp (sugar kelp or
winged kelp) were processed in triplicate. Shredded fresh kelp and cabbage were mixed with 2%
kosher salt, inoculated with Lactobacillus plantarum (~106 CFU/g) and Leuconostoc
mesenteroides (~101 CFU/g), and fermented at ambient temperature until a pH of < 4.6 was
achieved. The presence of pathogens (Vibrio spp., Salmonella, Staphylococcus aureus, Listeria
spp.) was evaluated and coliforms were enumerated in the fresh sauerkraut. Titratable acidity

(TA), pH, instrumental texture (shear force), color, antioxidant capacity, aerobic plate counts,
lactic acid bacteria, yeasts and molds were measured periodically for 60 days after inoculation by
the lactic acid bacteria (LAB). Additionally, acetic acid, lactic acid, sugar (glucose, fructose,
sucrose), and ethanol levels were determined using high-performance liquid chromatography
(HPLC). Multi-way analysis of variance was performed to evaluate significant (p<0.05) effects
of the treatment variables. Sensory acceptability of these products was also evaluated to
determine the consumer response to the 25% and 50% winged kelp and sugar kelp treatments.
Kelp species and incorporation levels significantly affected most variables tested in the
freshly prepared sauerkraut. LAB grew fastest in the winged kelp treatments, with all products
reaching a pH below 4.6 within 3 days and resulting in significantly lower pH and higher TA
compared to the sugar kelp treatments. In contrast, the sugar kelp treatments did not achieve a
pH of <4.6 until day 14. Kelp incorporation levels significantly influenced LAB counts with the
highest average counts for both kelp species occurring in the 25% (7.5 log CFU/g) and 50% (7.7
log CFU/g) treatments. Notably, sugar kelp (SK) treatments had significantly lower shear force
values than winged kelp (WK), and as concentrations of SK increased from 25% to 75% shear
force decreased from 165.5 to 53.8 N. In regard to antioxidant capacity, there were no
differences among SK and WK treatments but increasing seaweed concentrations improved total
phenolic content and ferric reducing antioxidant power (FRAP) values of the sauerkraut. The SK
treatments had higher levels of coliforms, and Vibrio sp. was detected only in the 75% SK
treatment on day 7.
This study is the first to report on lactic acid fermentation to produce fresh seaweed
sauerkraut. Seaweeds are primarily sold in dried form, and fermentation offers the potential to
introduce refrigeration-stable, value-added, seaweed products to the market. Results indicate that
seaweed sauerkrauts produced from fresh farm-raised kelp were refrigeration stable throughout
the study.

vi
ACKNOWLEDGEMENTS
I would first like to express my appreciation to my advisor Dr. Skonberg. Thank you for
your continuous guidance and support. Your knowledge (of everything) and drive to always do
more has been truly inspiring. I am so happy to be your student. Thank you for spending many
hours meeting with me and for always being an email away. I am also grateful for my committee
members, Dr. Perry, Dr. Perkins, and Dr. Romero for their help throughout the last two years.
Dr. Perry, thank you for teaching me all about microbiology and for all your support! Dr.
Perkins, I appreciate all your help with the HPLC. A special mention to Katherine Davis-Dentici,
who was always there to lend a helping hand with every question or need I had. Your kindness is
amazing.
I would like to extend my thanks to the School of Food and Agriculture for providing the
funding for this research and granting me this assistantship. I am very grateful for the
opportunity to work on this research. Additionally, thank you to SEANET for research funding.
Thank you to Spring Tide Seaweed and Maine Coast Sea Vegetables for providing me with a
continuous supply of seaweed throughout my research.
This research would not have been possible without the support from my lab mates. I am
so grateful that they were always by my side throughout this whole process (including late
nights) and for their continuous support. My sincerest thanks goes to Dhriti, Charlie, Sami,
Bouhee, Juliana, Surbhi, Alison, and Kilee. You made this experience so fun and I wouldn’t have
wanted to work with any other people throughout this journey.
There are no words to describe how thankful I am to my family. I would like to thank my
parents whom I am forever indebted to (literally and figuratively), as they have supported me
with much love and patience. Lastly, to my loving, supportive, and patient fiancé, thank you! I

vii
am so by my side and for always being there to offer me reassurance. Your support has been so
wonderful and it will not be forgotten how much you have helped me.

viii
TABLE OF CONTENTS
ACKNOWLEDGEMENTS ...........................................................................................................vi
LIST OF TABLES ........................................................................................................................xii
LIST OF FIGURES .....................................................................................................................xiii
1. INTRODUCTION……….........................................................................................................1
1.1. Seaweeds……………….....................................................................................................1
1.2. Sea vegetables ....................................................................................................................1
1.3. Seaweed industry ...............................................................................................................2
1.4. Lacto-fermentation.............................................................................................................6
1.5. Food industry uses for lacto-fermentation..........................................................................7
1.5.1. Preservation..............................................................................................................7
1.5.2. Flavor.......................................................................................................................9
1.5.3. Health.....................................................................................................................10
1.6. Vegetable lacto-fermentation............................................................................................12
1.6.1. Sauerkraut..............................................................................................................12
1.7. Seaweed fermentation......................................................................................................14
1.7.1. Inoculate species....................................................................................................18
1.7.2. Salt content.............................................................................................................18
1.7.3. Fermentation time..................................................................................................19
1.8. Justification.......................................................................................................................20
1.9. Objectives.........................................................................................................................21

ix
2. MATERIALS AND METHODS ………………....................................................................22
2.1. Experimental design.........................................................................................................22
2.2. Seaweed sauerkraut……………………………………………………………………..23
2.2.1. Processing..............................................................................................................23
2.2.2. Preparation.............................................................................................................24
2.3. Inoculation........................................................................................................................25
2.3.1. Lactobacillus plantarum........................................................................................25
2.3.2. Leuconostoc mesenteroides...................................................................................26
2.4. Microbiological analysis...................................................................................................26
2.4.1. Aerobic plate counts (APC)...................................................................................26
2.4.2. Lactic acid bacteria counts (LAB).........................................................................27
2.4.3. Coliform counts.....................................................................................................27
2.4.4. Fungi………..........................................................................................................28
2.4.5. Pathogens...............................................................................................................28
2.5. pH.....................................................................................................................................29
2.6. Titratable acidity...............................................................................................................29
2.7. Texture analysis................................................................................................................30
2.8. Colorimetric analysis........................................................................................................31
2.9. Antioxidant analysis.........................................................................................................31
2.9.1. Sample preparation................................................................................................31
2.9.2. Total phenolic content (TPC) ................................................................................32
2.9.3. Ferric reducing antioxidant power (FRAP) assay..................................................33
2.9.4. α, α-diphenyl-β-picrylhydrazyl (DPPH) assay………………………………..…33

x
2.10. High performance liquid chromatography (HPLC)…………………...…………34
2.11. Statistical analysis..................................................................................................35
2.12. Sensory testing.......................................................................................................35
2.12.1. Seaweed sauerkraut preparation for sensory testing…..........................................36
2.12.2. Sample testing........................................................................................................36
3. RESULTS AND DISCUSSION…………………………...………………………………...38
3.1. Overview...........................................................................................................................38
3.2. Microbiology....................................................................................................................38
3.2.1. Lactic acid bacteria counts.....................................................................................38
3.2.2. Aerobic plate counts..............................................................................................45
3.2.3. Coliform counts.....................................................................................................48
3.2.4. Fungi………..........................................................................................................50
3.2.5. Pathogens...............................................................................................................51
3.3. pH.....................................................................................................................................52
3.4. Titratable acidity...............................................................................................................55
3.5. Texture analysis................................................................................................................58
3.6. Colorimetric analysis........................................................................................................62
3.7. Antioxidant analysis.........................................................................................................65
3.7.1. Total phenolic content (TPC).................................................................................65
3.7.2. Ferric reducing antioxidant power (FRAP) assay…………………...…...............67
3.7.3. α, α-diphenyl-β-picrylhydrazyl (DPPH) assay…………………………………..69
xi
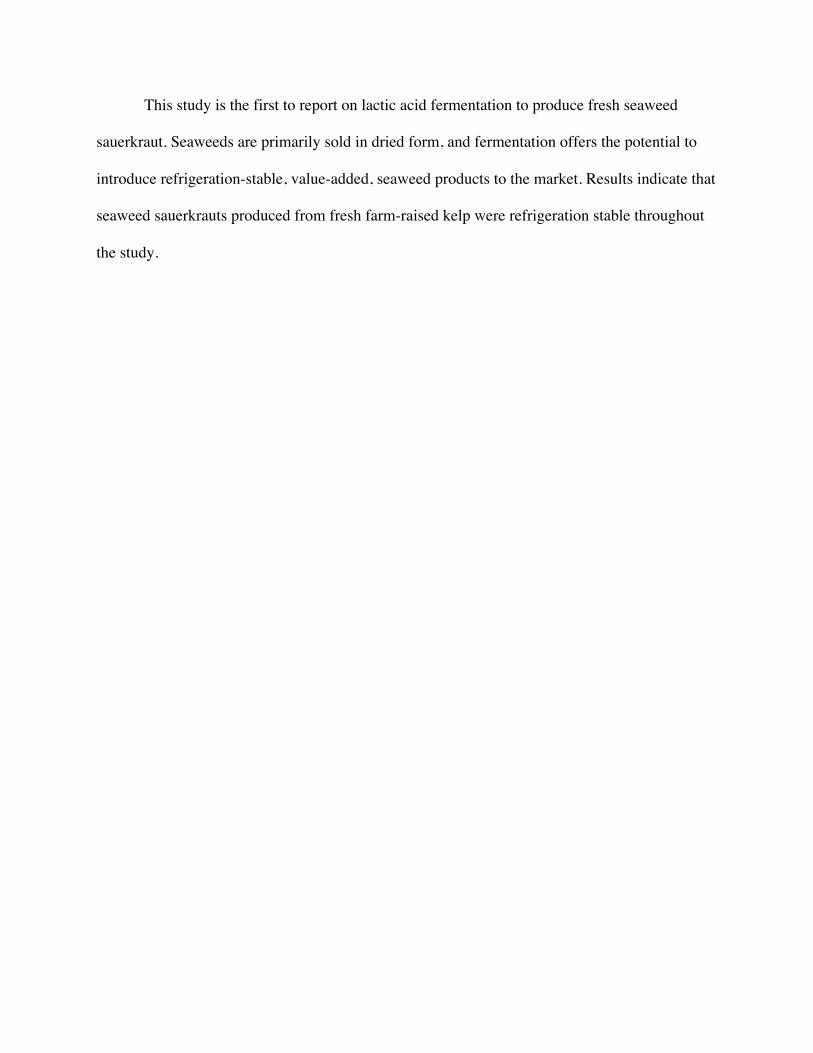
3.8. Organic acids....................................................................................................................72
3.8.1. Lactic acid..............................................................................................................72
3.8.2. Acetic acid.............................................................................................................74
3.9. Sugars...............................................................................................................................75
3.10 Sensory testing.................................................................................................................79
3.10.1 Overall liking…………………………………………………………………….80
3.10.2 Flavor……………………………………………………………………………81
3.10.3 Color……………………………………………………………………………..82
3.10.4 Aroma……………………………………………………………………………83
3.10.5 Saltiness………………………………………………………………………….83
3.10.6 Texture………………………………………………………………...…………83
4. OVERALL CONCLUSIONS AND RECOMMENDATIONS................................................86
REFERENCES..............................................................................................................................90
APPENDICES...............................................................................................................................97
Appendix A Recruitment Notice.......................................................................................97
Appendix B Seaweed Sauerkraut Informed Consent.........................................................98
Appendix C Seaweed Sauerkraut Questionnaire...............................................................99
BIOGRAPHY OF THE AUTHOR..............................................................................................102

xii
LIST OF TABLES
Table 1. Media, incubation time, and temperatures used to detect different
pathogens...............................................................................................................29
Table 2. Lactic acid bacteria populations (log CFU/g) of seaweed sauerkraut
over time................................................................................................................44
Table 3. Aerobic plate counts (log CFU/g) of seaweed sauerkraut over time.....................47
Table 4. Mean pH of seaweed sauerkraut samples over time…………..............................54
Table 5. Spearman correlations among pH, titratable acidity (TA), lactic acid bacteria
population (LAB), and aerobic plate counts (APC)...............................................55
Table 6. Mean titratable acidity (%) in seaweed sauerkraut over time................................57
Table 7. Mean shear force values (N) in seaweed sauerkraut over time...………………..62 Table 8. Mean L*, a*, and b* values in seaweed sauerkraut over time...............................64
Table 9. Mean total phenolic content (mg/g) of seaweed sauerkraut over time .................66
Table 10. Mean FRAP (μmol FSE/g) values in seaweed sauerkraut over time.. ………......69
Table 11. Mean DPPH EC50 (mg/mL) values in seaweed sauerkraut over time …………...70
Table 12. Spearman Correlation among TPC, DPPH, and FRAP values of seaweed
sauerkraut..………………………………………………………………………………..72
Table 13. Mean hedonic scores for four seaweed sauerkraut treatments on a 9-point
hedonic scale……………………………………………………………………..80
Table 14. Spearman Correlation table of sensory attribute scores…...………………….….82

xiii
LIST OF FIGURES
Figure 1. Palmaria palmata, also known as dulse (McKirdy, 2015)......................................4
Figure 2. Alaria esculenta, also known as winged kelp (Norwegian Seaweeds, 2018)..........4
Figure 3. Saccharina latissima, also known as sugar kelp (Algolesko, 2018)........................5
Figure 4. Changes in the flora of Lactobacilli during Chinese sauerkraut fermentation......13
Figure 5. Mean lactic acid bacteria populations (log CFU/g) in seaweed sauerkraut
over time, a) sugar kelp and b) winged kelp…………………..............................40
Figure 6. Mean aerobic plate counts (log CFU/g) in seaweed sauerkraut by species……...46
Figure 7. Mean positive coliform count (MPN/g) in seaweed sauerkraut by species.……..50
Figure 8. Mean pH values in seaweed sauerkraut by species………………………...........52
Figure 9. Overall mean titratable acidity (%) in seaweed sauerkraut by seaweed
concentration…………………………………………………………………......56
Figure 10. Mean shear force (N) of seaweed sauerkraut by species ………………………..58
Figure 11. Mean shear force (N) of seaweed sauerkraut by seaweed concentration,
a) sugar kelp and b) winged kelp. ……………………………………………….60
Figure 12. Mean L* a* b* values of seaweed sauerkraut samples by species........................63
Figure 13. Overall mean FRAP values (μmol FSE/g) in seaweed sauerkraut by
species....................................................................................................................67
Figure 14. Overall mean FRAP values (μmol FSE/g) in seaweed sauerkraut by
seaweed concentrations………...……..…………………...................................68
Figure 15. Mean lactic acid and acetic acid concentrations (g/L) in seaweed
sauerkraut by species….........................................................................................73

xiv
Figure 16. Mean lactic acid and acetic acid concentrations (g/L) in seaweed
sauerkraut over time…………………………………………….………………..74
Figure 17. Mean sugar content (g/L) in seaweed sauerkraut by species…………….............76
Figure 18. Overall mean of sugar concentration (g/L) in seaweed sauerkraut over
time……..…….........................………….............................................................78
Figure 19. Frequency of “Overall liking” scores for four seaweed sauerkraut
treatments……………………………………………………………...…………81
Figure 20. Frequency of texture scores for four seaweed sauerkrauts treatments.………….84

1
1. INTRODUCTION 1.1. Seaweeds
Seaweeds are marine macroalgae that are found in coastal areas around the world.
Because they are found globally, there are over 10,000 species of seaweed and more that are
continuing to be discovered (Mouritsen et al. 2013b). Many species can tolerate harsh
environments that fluctuate in temperature, have rapid ocean currents, or are highly saline
(Mouritsen et al. 2013b). Furthermore, seaweeds are usually found attached to hard substrates,
because their environment is subject to strong waves. They have specialized tissues that serve as
anchorage, called a holdfast, similar to a plant’s root system (Mouritsen et al. 2013b). However,
there are some species that float freely in the ocean. Typically, seaweeds grow in the intertidal
zone because the sunlight helps them grow through photosynthesis, as all seaweeds contain
chlorophyll and are photosynthetic (Mouritsen et al. 2013b). However, some species, like kelps,
grow deep in the ocean.
Seaweeds are divided into three categories based on their color: Chlorophyta (green),
Rhodophyta (red) and Phaeophyta (brown). The seaweed categories also differ in structural and
biochemical features. Brown and red seaweeds are mostly found in marine waters, but green
seaweeds can also be found in freshwater systems. There are approximately 6,200 red species,
1,800 green species, and 1,800 brown species of seaweed (Mouritsen et al. 2013b).
1.2. Sea vegetables
Seaweed can be used in a variety of applications including cosmetics, medicine, and
food. Seaweeds used in foods are often called sea vegetables because any edible seaweed is
termed a sea vegetable. Seaweeds are super foods that are rich in vitamins and provide important
health benefits.

2
In addition, seaweeds can offer different benefits than land plants. For example, seaweeds
can provide 10-20 times more minerals than land plants because seaweeds can obtain minerals
from seawater (Makkar et al. 2016).
Seaweeds are rich in proteins and prebiotics, are good sources of bioactive compounds,
are low in lipids, and contain non-starch polysaccharides (Fleurence, 1999). Furthermore, the
polysaccharides found in seaweeds have the potential to have medicinal values for the body
(Smit, 2004). Seaweeds are also a good source of fiber and the consumption of seaweeds may
reduce the risk of colon cancer (Smit, 2004).
Brown, red, and green seaweeds offer different dietary benefits for humans. Red and
green seaweeds are higher in protein and mineral content compared to brown seaweeds (Makkar
et al. 2016). Red and green seaweeds contain ~50% and 30% protein content, respectively
(Makkar et al. 2016). Nonetheless, brown seaweeds are rich in bioactive compounds such as
phloroglucinol-based polyphenolic compounds, carotenoids, and polyunsaturated fatty acids
(Holdt and Kraan, 2011). Bioactive compounds can influence human health and act similarly to
antioxidants. Furthermore, brown seaweeds contain alginate, laminarin, and fucoidan which are
resistant to human digestive enzymes, making them a source of dietary fiber (Charoensiddhi et
al. 2016).
1.3. Seaweed industry
The seaweed industry is growing, and seaweeds that are used for direct human
consumption around the world is a 5.29-billion-dollar (USD) industry (Chopin and Sawhney,
2009). This equates to 8.59 million tons of edible seaweeds harvested in a year, according to
2006 data (Chopin and Sawhney, 2009).

3
The worldwide seaweed industry farms approximately 220 seaweed species. However,
the edible seaweed market consists of three dominant seaweed genera: ,)ubmok ro( airanimaL
,)iron ro( aryhproP and .)9002 ,yenhwaS dna nipohC( )emakaw ro( airadnU
Asian countries are the largest consumers of seaweeds and most of the world’s edible
seaweeds are produced in Asian countries (Chopin and Sawhney, 2009). However, the recent
radioactive contamination of Asian waters, caused by the leaking Fukushima nuclear plant in
Japan, has created safety concerns about seaweeds from this area. Therefore, Maine’s seaweed
industry has the opportunity to grow to meet the increased demands for high quality seaweeds.
The Maine seaweed industry is the number one edible seaweed producer in the United
States (NBC, 2015). In 2014, 17.7 million pounds of seaweed were collected by Maine
harvesters and the number of Maine seaweed companies has doubled from 10 years ago (NBC,
2015). North American Kelp, Springtide Seaweed, Maine Coast Sea Vegetables, SOURCE
Maine, VitaminSea, and Atlantic Holdfast Seaweed Company are just some of the more than 20
companies that grow or harvest seaweed in Maine. Furthermore, some of these companies have
been around for 30 years or more (Maine Seaweed Council, 2016). One company, Maine Coast
Sea Vegetables, harvests roughly 100,000 pounds of seaweed a year and sells their products to
Amazon, Whole Foods, and other health food stores (Maine Coast Sea Vegetables, 2016).
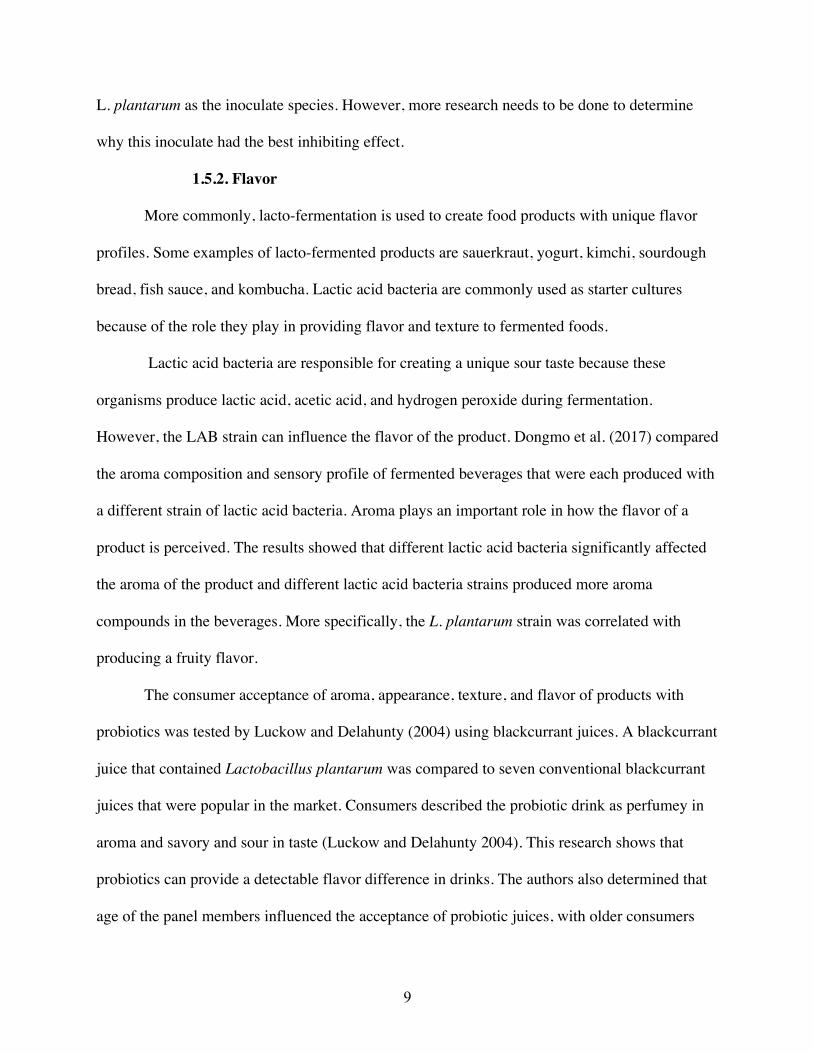
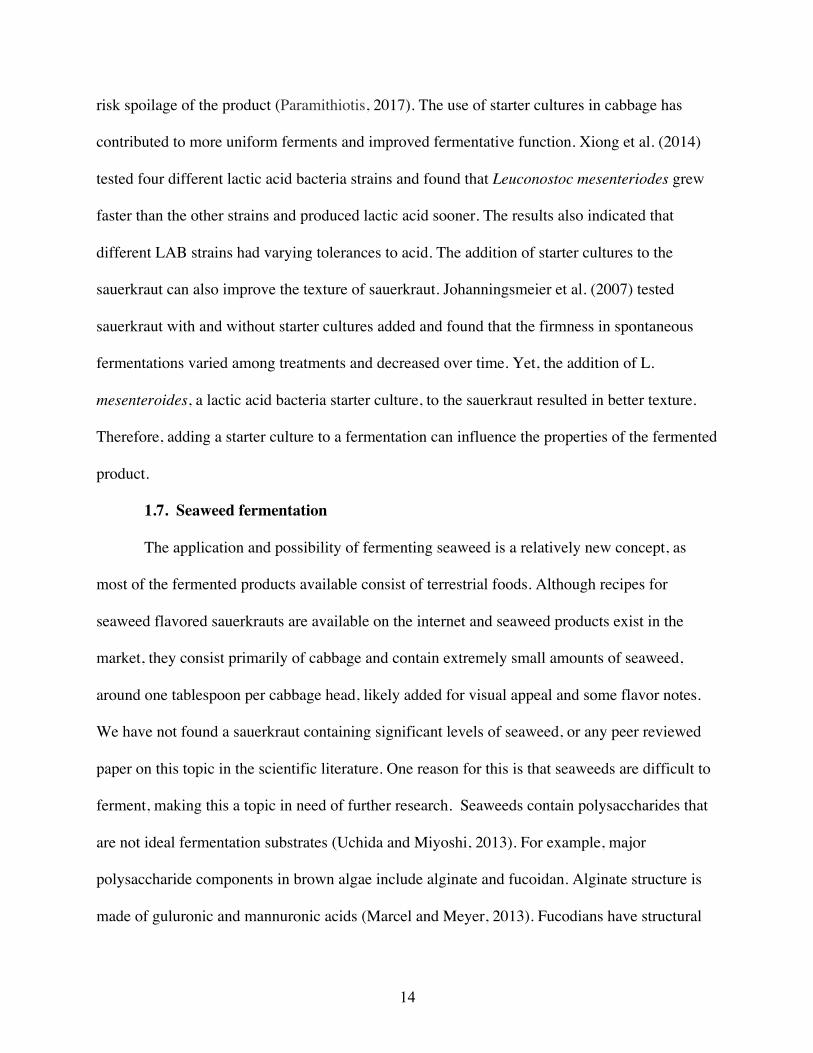
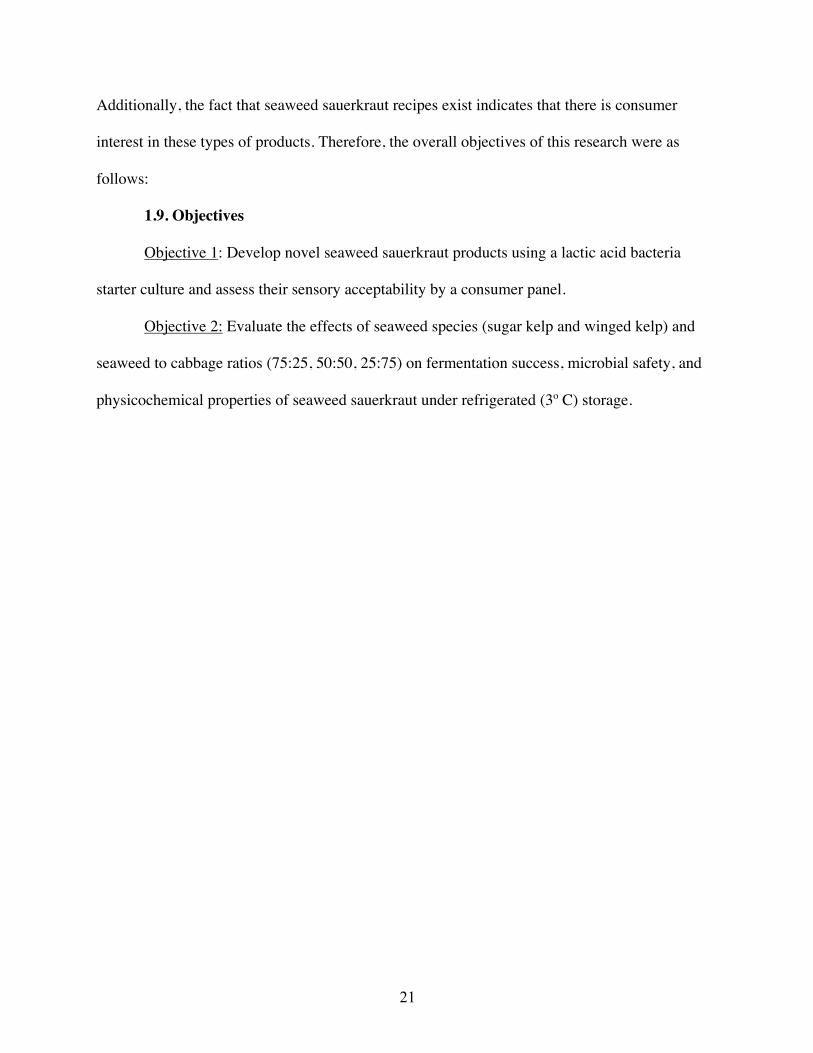
The success of Maine’s seaweed industry comes from the variety of edible seaweeds
native to Maine’s coast such as Palmaria palmata (or dulse) (Figure 1), Alaria esculenta (or
winged kelp) (Figure 2), and Saccharina latissima (or sugar kelp) (Figure 3). Dulse are red
seaweeds that are harvested from the early summer to fall (Maine Coast Sea Vegetables, 2016).
Dulse is found in many food dishes across the world and is also commonly consumed as a snack.
Dulse can also be used as a nutritional supplement because it is rich in iodine, protein, and iron

4
(Mouritsen et al. 2013a). Sugar kelp and winged kelp, are large brown seaweeds that have long
and thin blades with wavy edges. There are about 300 different kinds of kelps that are classified
under the laminariales, edible kelps (Mouritsen et al. 2013b). Kelps often create kelp forests in
the ocean because of their large size that can reach up to 50 meters long (Mouritsen et al. 2013b).
Figure 1. Palmaria palmata, also known as dulse (McKirdy, 2015).
Figure 2. Alaria esculenta, also known as winged kelp (Norwegian Seaweeds, 2018).

5
Figure 3. Saccharina latissima, also known as sugar kelp (Algolesko, 2018).
The winged kelps and sugar kelps found in Maine offer consumers important health
benefits. The winged kelps are a good source of Vitamin A (Mouritsen et al. 2013b) and protein,
while sugar kelps offer medicinal and unique flavor characteristics to consumers. Sugar kelps
are unique because they have a sweeter taste (Mouritsen et al. 2013b). When sugar kelps are
dried, they excrete polysaccharides and mannitol, the compound responsible for the sweet taste
of this seaweed. Overall, kelps are rich in vitamins, minerals, and phytonutrients (Mouritsen et
al. 2013b). Some minerals found in kelps are calcium, potassium, iodine, and magnesium
(Mouritsen et al. 2013b). In addition, kelps have a naturally high monosodium glutamate (MSG)
content, responsible for their umami taste (Mouritsen et al. 2013b). Therefore, kelp is often
incorporated in a variety of foods such as, soup, salad, cooked dishes, or sprinkled on food, like a
spice. However, some varieties of kelps are better for human consumption because some are thin
and soft, while others can be undesirably thick and tough.
While many of Maine’s seaweeds are freshly harvested, few seaweeds are sold fresh to
the market. Dried seaweeds have a longer shelf life than fresh seaweeds, therefore, many edible
6
seaweeds are sold in either dried or frozen forms. One potential alternative to drying seaweed is
to ferment it. Fermenting could transform fresh seaweed into a shelf stable product. Furthermore,
seaweeds are super foods that are rich in vitamins and provide important health benefits.
Fermenting seaweed could increase its health benefits and create a non-dairy alternative
probiotic product for consumers.
1.4. Lacto-fermentation
Fermentation can be described as respiration without air, meaning that microbial enzymes
can cause chemical changes in food anaerobically. In addition, fermentation is a process in which
an organism converts a carbohydrate into an alcohol or an acid. One type of fermentation is
called lacto-fermentation, during which lactic acid bacteria convert carbohydrates, such as
glucose, from fruits and vegetables into lactic acid (Paramithiotis, 2017).
The natural presence of lactic acid bacteria on vegetables allows for spontaneous
fermentation to occur yet, using a starter culture in fermentation provides a more reliable and
consistent fermentation (McFeeters, 2004). One of the most common starter cultures used in
lacto-fermented products is Lactobacillus plantarum (Molin, 2001). However, there are many
different species of lactic acid bacteria that are found in fermented products. Lactobacillus,
Leuconostoc, Pediococcus and Streptococcus are the main genera involved in desirable food
fermentations (FAO, 1998). Lactic acid bacteria are gram positive, aerotolerant, anaerobic,
micro-aerophillic, bacteria. Lactic acid bacteria can be heterofermentors or homofermentors.
Heterofermentors produce lactic acid, acetic acid and other products, while homofermentors
produce mostly lactic acid. Lactobacillus bacteria are unique because some are heterofermenters
or homofermenters (FAO, 1998).

7
The success of lactic acid bacteria growth is dependent on temperature, salt content, and
oxygen availability (FAO, 1998). Furthermore, lactic acid bacteria growth can also be affected
by the carbohydrate source and concentration and pH levels (Gupta et al. 2011). Changing the
pH of the environment can affect how lactic acid bacteria inhibit other bacteria (Akbar et al.
2016).
1.5. Food industry uses for lacto-fermentation
One current food trend is that consumers are looking for more simple food products that
contain fewer ingredients (Inova Market Insights, 2018). Simple products are considered by
many consumers as healthier and more natural. One example of making products simpler could
be to replace common artificial preservatives found in foods with food fermentation, which is a
natural preservation process. One outcome of this trend is the increased development of lacto-
fermented foods. Innova Market Insights reports that fermented foods and beverages increased
by 35 percent in the U.S. from 2015 to 2016. Therefore, there is a lot of opportunity for new
fermented products because the demand for fermented products will likely continue to increase
in the near future.
1.5.1. Preservation
One of the reasons lacto-fermentation is used in the food industry is because of its ability
to preserve vegetables, increase their shelf life, and enhance safety of food products. The process
of fermentation preserves food naturally by decreasing pH and slowing the growth of spoilage
bacteria. Fermentation utilizes the sugars in the product/vegetable and produces organic
compounds, like propionic acid and lactic acid (Paramithiotis, 2017). The production of these
acids creates an unsuitable (low pH) environment, causing antimicrobial activity.

8
Using lacto-fermentation for food preservation can also be termed as biopreservation.
Biopreservation refers to the use of living microbes to extend the shelf life of foods (Akbar et al.
2016). Biopreservation is a natural method that decreases the use of preservatives or
antimicrobials in foods, ingredients that consumers are avoiding. Lactic acid bacteria provide
biopreservation because they produce lactic acid, acetic acid, hydrogen peroxide and other
antimicrobial compounds, that help extend the shelf life of vegetables (Akbar and Anal, 2014).
Additionally, lactic acid bacteria have antagonistic metabolites and bacteriocins (Akbar et al.
2016). Bacteriocins are natural proteins that have antimicrobial properties that can inhibit the
growth of other similar bacteria or unwanted microbes, such as spoilage bacteria and pathogens
(Akbar et al. 2016). Lacto-fermentation also helps to preserve antioxidants such as ascorbic acid,
phenols, and colored pigments like beta carotene and anthocyanin (Panda et al. 2009). It is for
these reasons that lactic acid bacteria improve the safety, shelf life, and quality of food products
and are used in preservation.
Lactic acid bacteria are used for food preservation because of their ability to decrease
food contamination by foodborne pathogens and spoilage bacteria. Lactic acid bacteria,
particularly L. plantarum, helped to inhibit growth of foodborne pathogens (Staphylococcus
aureus, Salmonella spp., Clostridium perfringens, Bacillus cereus) in a fermented red seaweed
beverage (Ratanburee et al. 2011, Hayisame-ae et al. 2014). L. plantarum was reported to have
the most promising ability to control fungi such as yeast and mold in fermented plant beverages
(Prachyakij et al. 2008). Prachyakij et al. (2008) studied samples of fermented plant beverages
that are common to Thailand. Some samples were contaminated with yeast and a total of 72
lactic acid bacteria strains were studied to see which strain could inhibit yeast contamination.
They found that mold and yeast spoilage were less likely to occur in a fermented product using
9
L. plantarum as the inoculate species. However, more research needs to be done to determine
why this inoculate had the best inhibiting effect.
1.5.2. Flavor
More commonly, lacto-fermentation is used to create food products with unique flavor
profiles. Some examples of lacto-fermented products are sauerkraut, yogurt, kimchi, sourdough
bread, fish sauce, and kombucha. Lactic acid bacteria are commonly used as starter cultures
because of the role they play in providing flavor and texture to fermented foods.
Lactic acid bacteria are responsible for creating a unique sour taste because these
organisms produce lactic acid, acetic acid, and hydrogen peroxide during fermentation.
However, the LAB strain can influence the flavor of the product. Dongmo et al. (2017) compared
the aroma composition and sensory profile of fermented beverages that were each produced with
a different strain of lactic acid bacteria. Aroma plays an important role in how the flavor of a
product is perceived. The results showed that different lactic acid bacteria significantly affected
the aroma of the product and different lactic acid bacteria strains produced more aroma
compounds in the beverages. More specifically, the L. plantarum strain was correlated with
producing a fruity flavor.
The consumer acceptance of aroma, appearance, texture, and flavor of products with
probiotics was tested by Luckow and Delahunty (2004) using blackcurrant juices. A blackcurrant
juice that contained Lactobacillus plantarum was compared to seven conventional blackcurrant
juices that were popular in the market. Consumers described the probiotic drink as perfumey in
aroma and savory and sour in taste (Luckow and Delahunty 2004). This research shows that
probiotics can provide a detectable flavor difference in drinks. The authors also determined that
age of the panel members influenced the acceptance of probiotic juices, with older consumers

10
being more accepting of the probiotic drink. This is possibly because older consumers could be
less sensitive to the unique flavor of the probiotic drink. In addition, females that were over 40
preferred the flavor of the probiotic juices and indicated that they would also drink them more
frequently than conventional juices (Luckow and Delahunty, 2004).
Overall, lacto-fermentation can impact the flavor of products. There are several variables
in a fermented product that can influence its taste. The overall acidity, salt, addition of spices,
different microbial strains, and how the product is packaged, are a few examples of how flavor
can easily be influenced.
1.5.3. Health
Consumers are becoming more interested in their personal health and are more concerned
about making responsible food choices. It is for this reason that consumers are interested in foods
that offer health or probiotic benefits (Granato et al. 2010). Foods that provide these benefits are
termed functional foods. Lacto-fermented products are considered functional foods because
lacto-fermented products provide consumers with important health benefits, particularly
probiotic benefits. Overall, probiotics are “good” bacteria that administer health benefits, like
disease prevention or improved digestion (Dunne et al. 2001; Luckow and Delahunty, 2004).
Beganovic et al. (2011) defined a probiotic as containing 106 CFU/g live probiotic strains.
Probiotics aid in disease prevention because they compete with pathogens (e.g. E. coli,
Salmonella spp.) by binding to epithelial cell binding sites to inhibit colonization by pathogenic
bacteria (Akbar et al. 2016). In addition, some probiotics can produce bioactive compounds that
inhibit the growth of other bacteria (Akbar and Anal, 2014). Probiotics can aid in digestion
because they can survive extreme conditions, such as wide pH ranges and can tolerate bile salts
to ensure that they work in the intestinal passage of the body (Dunne et al. 2001). Some lactic

11
acid bacteria can offer probiotic benefits because of their strong ability to survive in the human
gut and inhibit microbes. It can take the human body three hours to digest certain meals and this
means that lactic acid bacteria must survive in the acidic conditions of the GI tract to administer
health benefits to the body (Olejnik et al. 2005). Duangjitcharoen et al. (2009) studied the
probiotic characteristics of Lactobacillus plantarum by researching how it could survive in the
gastrointestinal tract. The results showed that L. plantarum was a successful probiotic because it
survived in a range of differing environments. Furthermore, L. plantarum is commonly found in
the human gastrointestinal (GI) tract. The human GI tract is an acidic environment that contains
bile salts. These conditions are like the environment in a fermenting process and is why these
bacteria can survive in that environment. In addition, this study confirmed that L. plantarum was
safe to use in fermented products after studying mice that had consumed L. plantarum fermented
products.
Consumers are very interested in products that contain probiotics. Foods and
supplements containing probiotic ingredients were worth $16 billion (USD) in 2008 and the
market continues to grow (Granato et al. 2010). Interestingly, most probiotic products are dairy
products, with yogurt being the most consumed product (Granato et al. 2010). Dairy products are
not always ideal, due to lactose intolerance and specific diets (veganism) that preclude their
consumption. Non-dairy examples of probiotics include supplements, sauerkraut, and kombucha.
Therefore, there appears to be a lot of potential for the continued development of some non-dairy
probiotic products.

12
1.6. Vegetable lacto-fermentation
1.6.1. Sauerkraut
Sauerkraut is a fermented cabbage product that is usually served as a side dish or
condiment. Sauerkraut typically ferments from naturally present lactic acid bacteria. The
microflora found on cabbage changes based on growing region, season, and cultivation patterns
(Xiong et al. 2012). Sauerkraut typically contains cabbage and sometimes a mixture of spices
and garlic. Cabbage is usually immersed in a 6-8% (w/v) salt solution and left at room
temperature to ferment for 6-12 days in a mason jar (Xiong et al. 2012.)
It is important to have an anaerobic environment during cabbage fermentation. The
sauerkraut should be kept lidded and the contents should be covered with enough brine to reduce
the risk of oxygen exposure. Oxygen can increase the growth of other microorganisms that thrive
in aerobic environments and this can spoil the fermentation and negatively impact the flavor of
the product (Paramithiotis, 2017).
The addition of salt to the cabbage plays an important role in fermentation success. Salt
helps improve the flavor of fermented products and, to some extent, inhibits growth of some
spoilage bacteria (Xiong et al. 2016). Mainly, salt is used because it is responsible for
maintaining the texture of the cabbage, as it prevents the cabbage from softening (Paramithiotis,
2017). Contrastingly, too much salt can negatively impact the fermentation. Xiong et al. (2016)
found that high salt concentration (8% w/v) decreased the growth of lactic acid bacteria
populations and delayed the fermentation.
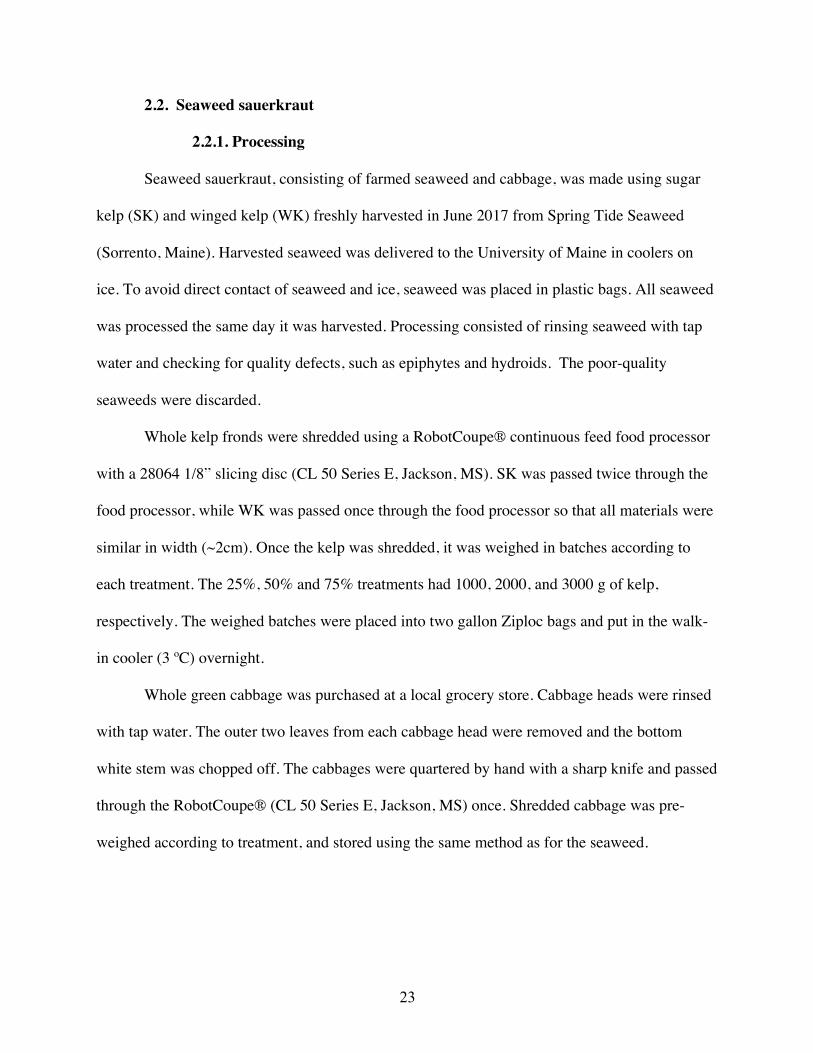
The natural bacteria present in the sauerkraut changes throughout the fermentation time
and influences the outcome of the fermented product. The bacteria L. plantarum, L. casei and
L. zeae are dominant species found in sauerkraut. In a study by Xiong et al. (2012), L. plantarum

13
reached its maximum concentration on the second day and then decreased throughout the seven-
day period, while L. casei reached its maximum on the third day (Figure 4). L. zeae survived the
shortest amount of time because it is most sensitive to high acidity (Xiong et al. 2012).
L. mesenteroides was the dominant species at the beginning of the fermentation, while
E. faecalis, L. lactis, L. zeae, L. plantarum and L. casei were present towards the end of the
fermentation period (Xiong et al. 2012).
In sum, the population dynamic of spontaneous sauerkraut production changes
throughout the fermentation period. Knowledge of the population dynamic of microflora in
sauerkraut can help control the fermentation process and how to use starter cultures to provide a
more consistent population dynamic.
Figure 4. Changes in the flora of Lactobacilli during Chinese sauerkraut fermentation.
(◆ L. plantarum; ■ L. casei; ▲ L. zeae) (n = 6). Values below 1 indicate that the count was less than the detection limit (10 CFU/mL). Obtained from Xiong et al. (2012).
Spontaneous fermentations are highly dependent on the lactic acid bacteria present and
this results in unpredictable fermentations. If a spontaneous fermentation does not have enough
lactic acid bacteria present from the start this can affect the acidity levels of the treatment and
14
risk spoilage of the product (Paramithiotis, 2017). The use of starter cultures in cabbage has
contributed to more uniform ferments and improved fermentative function. Xiong et al. (2014)
tested four different lactic acid bacteria strains and found that Leuconostoc mesenteriodes grew
faster than the other strains and produced lactic acid sooner. The results also indicated that
different LAB strains had varying tolerances to acid. The addition of starter cultures to the
sauerkraut can also improve the texture of sauerkraut. Johanningsmeier et al. (2007) tested
sauerkraut with and without starter cultures added and found that the firmness in spontaneous
fermentations varied among treatments and decreased over time. Yet, the addition of L.
mesenteroides, a lactic acid bacteria starter culture, to the sauerkraut resulted in better texture.
Therefore, adding a starter culture to a fermentation can influence the properties of the fermented
product.
1.7. Seaweed fermentation
The application and possibility of fermenting seaweed is a relatively new concept, as
most of the fermented products available consist of terrestrial foods. Although recipes for
seaweed flavored sauerkrauts are available on the internet and seaweed products exist in the
market, they consist primarily of cabbage and contain extremely small amounts of seaweed,
around one tablespoon per cabbage head, likely added for visual appeal and some flavor notes.
We have not found a sauerkraut containing significant levels of seaweed, or any peer reviewed
paper on this topic in the scientific literature. One reason for this is that seaweeds are difficult to
ferment, making this a topic in need of further research. Seaweeds contain polysaccharides that
are not ideal fermentation substrates (Uchida and Miyoshi, 2013). For example, major
polysaccharide components in brown algae include alginate and fucoidan. Alginate structure is
made of guluronic and mannuronic acids (Marcel and Meyer, 2013). Fucodians have structural

15
units that consist of fucan and sulfated polysaccharides (Marcel and Meyer, 2013). Red algae
contain agar and carrageenan. Green algae and seagrasses contain cellulose and hemicellulose as
major components (Uchida and Miyoshi, 2013). However, seaweeds also contain sugars that
could possibly be utilized during fermentation. Hwang et al. (2011) compared lactic acid yields
from seaweed sugars to land plant sugars. The results showed that seaweed contained diverse
sugars (D-galactose, D-mannitol, L-rhamnose, D-glucuronic acid, and L-fucose) and the
predicted lactic acid yields were comparable to fermenting land plants. Furthermore, recent
studies have reported successful fermentation of brown and red seaweeds by using lactic acid
bacteria starter cultures and various seaweed pre-treatments.
Gupta et al. (2011) evaluated the effects of thermal processing of seaweed and
aerobic/anaerobic conditions of seaweeds on the growth of lactic acid bacteria. The fermentative
capability of three Irish brown seaweeds (Himanthalia elongata, Laminaria digitata, and
Laminaria saccharina) were tested by using L. plantarum as the starter culture. For the heat
treatment, seaweeds were placed in an autoclave at 95º C for 15 min. The results from this
preliminary study suggested that growth of lactic acid bacteria could not be sustained in any of
the raw seaweed species, however lactic acid bacteria growth did occur in the heat treated L.
digitata and L. saccharina. The heat treatment resulted in an increase in the amount of sugars
readily used by L. plantarum. Furthermore, heat treatment could help reduce the microbial
surface load on the seaweed and increase availability of nutrients and sugars in the seaweeds for
the bacteria (Gupta et al. 2011). Overall, this study showed that heat treated L. digitata and L.
saccharina were suitable substrates for lactic acid fermentation by L. plantarum.

16
The results showed the highest cell populations were found in the L. digitata treatments,
while L. saccharina achieved a faster fermentation time because it took less time for maximum
cell growth to occur (Gupta et al. 2011).
Gupta et al. (2011) also tested the effects of aeration conditions on lactic acid bacteria
growth and acetic acid production by changing the speed of agitation. Microaerophillic and
aerobic conditions were tested and growth kinetics, such as the lag period and maximum specific
growth rate of the L. plantarum, were measured. The agitation speed of the culture influenced the
lactic acid bacteria growth; as the agitation speed was increased, the maximum cell growth
decreased. This was due to the different metabolic processes that occurred in the presence of
oxygen during fermentation (Gupta et al. 2011).
Ratanaburee et al. (2011) studied the use of L. plantarum as a seaweed starter culture by
researching the optimal conditions and ingredients for producing a functional fermented red
seaweed beverage. Dried Gracilaria fisheri, a red seaweed that is commonly found in Thailand,
was used in this study because it contains carotenoids, polyphenols, and phenolic acid that can be
beneficial for human health (Ratanaburee et al. 2011). The authors studied four different
fermented plant beverage formulations. The first formulation, treatment A, consisted of red
seaweed, sucrose, and water. Treatment B was similar to treatment A, but had the addition of a
5% starter culture of L. plantarum. Treatment C was also similar to treatment A, however it
included an increased sucrose concentration and the addition of monosodium glutamate (MSG).
Treatment D was the same as treatment C, but had the addition of a 5% starter culture of L.
plantarum.

17
Gamma-aminobutyric acid (GABA) is often found in fermented foods because some
lactic acid bacteria (Lactobacillus brevis, L. plantarum and Lactococcus lactis) can produce it.
GABA has been shown to prevent diabetes, inhibit the growth of cancer cells, and reduce
hypertension (Adeghate and Ponery, 2002). GABA is a non-protein amino acid compound that
is made through the decarboxylation of glutamic acid by the glutamate decarboxylase enzyme
(Siragusa et al. 2007). Because of this process, MSG was added to treatments C and D to
determine if it could lead to an increase in the amount of GABA synthesized (Ratanaburee et al.
2011). Results indicated that the treatments that were inoculated with a starter culture had a
higher number of beneficial microbes, total bacteria count (TBC), and LAB count after the
fermentation period of 60 days. Additionally, LAB was the dominant bacteria present in all
treatments. Treatments C and D, the treatments with the added MSG, produced higher amounts
of GABA during the fermentation period, with treatment D producing the highest amount.
However, the MSG treatments scored the lowest on a sensory test that measured flavor, odor,
and color due to their salty taste. Lastly, as the sugar content decreased during the fermentation
the acidity level increased.
Ratanburee et al. (2011) showed that fermentation of dried Gracilaria fisheri is possible.
However, the balance between having a palatable product and having a high GABA content still
remains in question. Adding MSG to seaweed fermentations resulted in an unpalatable product,
despite the high GABA production. This research also showed that yeast contamination can be a
problem during seaweed fermentation, as yeast contamination was found in all treatments.
Research by Uchida et al. (2007) on the fermentation of the brown seaweed, Undaria
pinnatifida, addressed the problem of bacterial contamination in fermentation by determining
how lactic acid bacteria could regulate the growth of contaminant bacteria. This research also

18
provided alternatives to the need to sterilize seaweed prior to fermentation. Sterilizing seaweed
can reduce the load of undesirable microbes during fermentation, however, sterilizing can
destroy some of the nutritional properties and the appearance of seaweeds. The appropriate
inoculate species or salt content could help to reduce the microbial load and omit the need to
sterilize seaweed prior to fermentations.
1.7.1. Inoculate species
Uchida et al. (2007) studied fourteen different lactic acid bacteria strains to determine
which strain could reduce the presence of spoilage bacteria in fermentations. All the treatments
that had no added inoculate spoiled, indicating that the addition of an inoculate may be a
necessary component to successful seaweed fermentation. The inoculates L. brevis, L.
plantarum, L. casei, and L. rhamnosus showed the highest inhibition of bacterial contamination
and showed 90% predominance in the cultures (Uchida et al. 2007). These inoculate species,
except for L. brevis, were homofermenters and they all produced the highest quantity of lactic
acid compared to the other strains. The high acid production by these species lowered the pH of
the fermented culture, most likely causing the successful inhibition of contaminant species.
The temperature (21° C) used during this study could have played a role in the inhibition
capabilities of certain strains. Typically, cultures are incubated at 37° C for optimal growth.
However, this experiment was conducted at a temperature closer to the natural temperature of the
ocean and the environment of seaweed. Because of this, LAB strains that showed the highest
populations in these conditions could be used to ferment seaweed (Uchida et al. 2007).
1.7.2. Salt content
Uchida et al. (2007) also researched the conditions for fermenting seaweeds by
investigating the effects of salt content, a variable that had never been tested before. Treatments

19
were made using wakame (Undaria pinnatifida) seaweed powder, water, 3.5% salt (w/v),
inoculate, and cellulase. Similar mixtures were made without the addition of salt. Cellulase was
added as a pretreatment for the seaweed powder because previous findings by Uchida et al.
(2007) showed a higher soluble sugar content and more successful ferment with the addition of
cellulase. Cellulase allows for saccharification, the hydrolysis of polysaccharides to soluble
sugars to help support fermentation. Cellulase also helped to avoid rotting during fermentation
(Uchida et al. 2007).
The presence of salt helped to inhibit unwanted microbes, as cultures without salt grew
contaminant bacteria that spoiled the fermented product. The concentration of salt added also
affected the growth of Lactobacillus starter cultures. Lactobacillus are not halotolerant and their
growth is restricted as the salt concentration is increased above 5%. It was found that salt
concentrations that ranged from 2.5-3.5% resulted in the most ideal fermentation conditions
(Uchida et al. 2007).
1.7.3. Fermentation time
The effects of fermentation period on seaweed were determined based on the production
of lactic acid, total acid, sugar consumption, and pH levels (Ratanburee et al. 2011). The authors
measured the fermentation of a red seaweed, Gracilaria fisheri, throughout the course of 60 days
and found that most biochemical changes occurred within the first 7 days. It was found that the
highest levels of lactic acid bacteria occurred within the first ten days of the fermentation period
with a gradual decline thereafter. The total bacteria count displayed a similar trend, where almost
all treatments showed the highest count within ten days. In addition, the total sugar decreased the
most rapidly after 7 days, this also resulted in the increase of total acidity. The pH of the

20
fermentation decreased the most rapidly within the first day of the fermentation. After 60 days,
the pH in the tested treatments ranged from 3.2-3.8, with the initial pH range being 5-7.
In addition, similar findings by Uchida et al. (2007) determined that fermentation period
of a brown seaweed, Unidaria pinnatifida, was seven days based on lactic acid production, pH
consistency, and the increase in microbial counts. The microbial counts increased from the first
day to the fourth or sometimes until the seventh day of the study. After this time, the microbial
count gradually decreased while the pH stayed constant.
1.8. Justification
Maine’s seaweed industry is growing and there are limited types of products available,
creating a need for product development. Fermentation can be used to create a value-added
refrigerated product that utilizes fresh seaweed and serves as an alternative to dried products.
Fermentation could also be a low cost preservation method for small producers. Furthermore,
fermenting seaweed could create a non-dairy alternative probiotic product for consumers, as well
as increase the health potential of this super food that is already rich in nutrients.
Based on this review of the literature, the key variables that influence seaweed
fermentation are salt content, environmental oxygen levels, inoculate species, temperature, and
the pre-treatment of seaweed. At this point, seaweed fermentation is a relatively new concept
and has mostly been tested in the development of fermented seaweed beverages, primarily for
Asian consumers. While some of these variables have been studied on seaweeds, none have been
tested on sugar kelp (Saccharina latissima) and winged kelp (Alaria esculenta), raising the
question of whether these economically important Maine seaweeds can successfully be
fermented. In addition, although seaweed sauerkraut recipes are available, to our knowledge,
there are no scientific reports on the development of lactic acid fermented seaweed sauerkraut.
21
Additionally, the fact that seaweed sauerkraut recipes exist indicates that there is consumer
interest in these types of products. Therefore, the overall objectives of this research were as
follows:
1.9. Objectives
Objective 1: Develop novel seaweed sauerkraut products using a lactic acid bacteria
starter culture and assess their sensory acceptability by a consumer panel.
Objective 2: Evaluate the effects of seaweed species (sugar kelp and winged kelp) and
seaweed to cabbage ratios (75:25, 50:50, 25:75) on fermentation success, microbial safety, and
physicochemical properties of seaweed sauerkraut under refrigerated (3º C) storage.

22
2. MATERIALS AND METHODS
2.1. Experimental design
The overall objectives of this research were to: 1) Develop novel seaweed sauerkraut
products using a lactic acid bacteria starter culture and assess their sensory acceptability by a
consumer panel, and 2) Evaluate the effects of seaweed species (Factor 1: sugar kelp, winged
kelp) and seaweed to cabbage ratios (Factor 2: 75:25, 50:50, 25:75) on fermentation success,
microbial safety, and physicochemical properties of seaweed sauerkraut under refrigerated (3º C)
storage. Six treatments with varying fresh kelp (sugar kelp or winged kelp) levels (25%, 50%,
75%) were prepared in triplicate for a 2 x 3 complete randomized design with repeated
measurements over time. Shredded kelp and cabbage were mixed with 2% kosher salt,
inoculated with Lactobacillus plantarum (~106 CFU/g) and Leuconostoc mesenteroides (~101
CFU/g), and allowed to ferment at ambient temperature (21-22º C) until a pH of < 4.6 was
achieved. Subsequently, the sauerkraut was stored at 3º C and shelf life was evaluated.
Fermentation was evaluated by measuring aerobic plate counts (APC), lactic acid bacteria (LAB)
counts, titratable acidity (TA) and pH. Additionally, acetic acid, lactic acid, sugars (glucose,
fructose, sucrose), and ethanol levels were determined using high-performance liquid
chromatography (HPLC). These measurements were taken on days 1, 3, 5, 7 and 14 after
inoculation. The presence of pathogens (Vibrio, Salmonella, Staphylococcus aureus, Listeria)
was evaluated prior to inoculation and seven days after inoculation. The pH, titratable acidity
(TA), instrumental texture (shear force), color, antioxidant capacity, APC, LAB counts,
coliforms, yeasts, and molds were measured periodically for 60 days post inoculation.
23
2.2. Seaweed sauerkraut
2.2.1. Processing
Seaweed sauerkraut, consisting of farmed seaweed and cabbage, was made using sugar
kelp (SK) and winged kelp (WK) freshly harvested in June 2017 from Spring Tide Seaweed
(Sorrento, Maine). Harvested seaweed was delivered to the University of Maine in coolers on
ice. To avoid direct contact of seaweed and ice, seaweed was placed in plastic bags. All seaweed
was processed the same day it was harvested. Processing consisted of rinsing seaweed with tap
water and checking for quality defects, such as epiphytes and hydroids. The poor-quality
seaweeds were discarded.
Whole kelp fronds were shredded using a RobotCoupe® continuous feed food processor
with a 28064 1/8” slicing disc (CL 50 Series E, Jackson, MS). SK was passed twice through the
food processor, while WK was passed once through the food processor so that all materials were
similar in width (~2cm). Once the kelp was shredded, it was weighed in batches according to
each treatment. The 25%, 50% and 75% treatments had 1000, 2000, and 3000 g of kelp,
respectively. The weighed batches were placed into two gallon Ziploc bags and put in the walk-
in cooler (3 ºC) overnight.
Whole green cabbage was purchased at a local grocery store. Cabbage heads were rinsed
with tap water. The outer two leaves from each cabbage head were removed and the bottom
white stem was chopped off. The cabbages were quartered by hand with a sharp knife and passed
through the RobotCoupe® (CL 50 Series E, Jackson, MS) once. Shredded cabbage was pre-
weighed according to treatment, and stored using the same method as for the seaweed.

24
2.2.2. Preparation
Shredded cabbage and shredded seaweed were placed into a commercial stainless steel
mixing bowl according to each treatment, for a total mass of four kg per batch. Then, 80 g (2%
wt/wt) of canning and pickling salt (Morton, Manistee, MI) were added to each of the 18
batches. The salt was spread on the surface of the seaweed and cabbage mixture, and after five
minutes the seaweed, cabbage, and salt were hand mixed (using gloves for sanitary purposes)
vigorously for three minutes. The mixture sat for one minute and then it was mixed again by
hand for one minute. This process was done to extract brine from the seaweed and cabbage
mixture. Next, the contents of the bowl were packed into a one gallon glass fermentation jar
(Kombucha Brooklyn, Kingston, NY) that contained a plastic lid and airlock. After the
fermentation jar had been packed halfway, the jar was aseptically inoculated, using an
autoclaved pipette tip and gloves, with Lactobacillus plantarum (106 CFU/g) and Leuconostoc
mesenteroides (101 CFU/g). A total of 10 g of the seaweed and cabbage mixture was removed
from each batch to perform microbial testing pre-and post-inoculation.
The fermentation jar was packed with the seaweed and sauerkraut mixture, with
approximately two inches of headspace filled with brine above the solid materials. The jar was
sealed with the airlock lid, which was filled halfway with water and monitored to ensure this
level was maintained. Treatment jars were labeled and coded according to the seaweed
percentage and seaweed species in the product. For example, a treatment with 75% sugar kelp
and 25% cabbage was coded: SK 75. Each of the six treatments was prepared in triplicate
batches (A, B, C), for a total of 18 fermentation jars. The seaweed and cabbage mixtures were
fermented in a lab at ambient temperature (21-22º C) until a pH of < 4.6 was achieved to prevent
growth of Clostridium botulinum. Subsequently, the fermentation jars containing the product

25
were placed in refrigerated storage (3º C) for 60 days post inoculation. Samples (brine and/or
vegetable material, depending on analyses) were aseptically taken from each fermentation jar
periodically to perform microbiological, pH, TA, instrumental texture, color, antioxidant
capacity, and HPLC analyses.
2.3. Inoculation
2.3.1. Lactobacillus plantarum
Lactobacillus plantarum (ATCC 8014) was obtained in Kwik-Stick™ form from
Microbiologics (St. Cloud, MN) and it was stored in the refrigerator at 2°-5°C prior to use. The
L. plantarum was streaked onto a Lactobacilli MRS agar plate (Alpha Biosciences, Baltimore,
MD) at room temperature (21-22º C) and placed into a 35°C incubator for 48 hours. White
colonies formed on the MRS plate after 48 hours.
To calculate the amount of bacteria needed to inoculate the seaweed/cabbage mixture to
the desired 106 CFU/g, the population count was determined after 24 hours of growth. To do this,
one single colony was aseptically isolated from an incubated MRS agar plate and was placed into
a test tube with nine mL of room temperature Lactobacilli MRS broth (Alpha Biosciences,
Baltimore, MD). The L. plantarum tube was incubated for 24 hours and 1:10 serial dilutions
were performed in 0.1% peptone (BD, Sparks, MD). Each dilution was plated, using aseptic
technique, onto new MRS plates and incubated for 48 hours. The colony forming units (CFU) of
L. plantarum per mL of sample broth were determined by the plate count number and multiplied
by the dilution factor. This process was repeated ten times to calculate an average population
count. The average growth after 24 hours was ~4 X10⁹ (~log 9) and this value was used to
estimate the volume (mL) of inoculate needed for each fermentation jar.

26
2.3.2. Leuconostoc mesenteroides
Leuconostoc mesenteroides was isolated from Choozit Cheese Cultures (Danisco, Paris,
France). Approximately 0.5 g of this powder was directly placed in nine mL of MRS broth and
incubated for 24 hours at 40º C. Then, 0.1 mL was plated onto MRS plates and incubated upside
down for 48 hours at 40º C. A single colony was used from the MRS plate and the same
inoculation process was used as for L. plantarum.
To calculate the amount of L. mesenteroides needed to inoculate the seaweed/cabbage
mixture to the desired 101 CFU/g, it was assumed that the population growth dynamics in 24
hours were similar to L. plantarum. Jeong et al. (2017) studied the growth of L. mesenteroides
and found that the population was 9.85 x 10⁸ (~9.60 log CFU/g) after 24 hours, similar to L.
plantarum.
2.4. Microbiological analysis
Cabbage, winged kelp, and sugar kelp were each weighed (10 g) into sterile stomacher
bags and combined with 90 mL of sterile 0.1% peptone (BD, Sparks, MD). Samples were
automatically homogenized (Interscience BagMixer®, Woburn, MA) for two minutes.
Appropriate serial dilutions were carried out in sterile 0.1% peptone. To conduct microbial
analysis of the sauerkraut treatments, one mL of brine was removed from the treatments and
serially diluted with 0.1% peptone.
2.4.1. Aerobic plate counts (APC)
Aerobic plate counts (APC) using tryptic soy agar (TSA) (Alpha Biosciences, Baltimore,
MD) plates were measured using aseptic techniques on days 0, 1, 3, 7, 14, 28, and 60. The TSA
plates were prepared according to manufacturer’s instructions (Alpha Biosciences, Baltimore,
Maryland). One mL of brine was sampled from each treatment replicate. Serial dilutions in 0.1%

27
peptone (BD, Sparks, Maryland) were plated in duplicate. TSA plates were incubated upside
down for 48 hours at 37 ºC and colonies were counted.
2.4.2. Lactic acid bacteria counts (LAB)
The lactic acid bacteria populations were counted using Lactobacilli MRS agar (Alpha
Biosciences, Baltimore, MD). One mL of sample brine was aseptically removed from each
treatment replicate on days 0, 1, 3, 7, 14, 28, and 60. Serial dilutions in 0.1% peptone (BD,
Sparks, Maryland) were prepared based on the total plate counts and plated in duplicate,
accordingly. MRS plates were incubated upside down for 48 hours at 40º C and colonies were
counted. The LAB plate counts were based on colony counts of 25-300 per plate. The plate count
number was multiplied by the dilution factor and LAB was calculated as colony forming units
(CFU/g).
2.4.3. Coliform counts
Coliform counts were obtained using the three tube Most Probable Number (MPN)
method (FDA, 2010; Hardy Diagnostics, 2018). Nine separate tubes of ten mL of lactose broth
(Acumedia, Lansing, MI) were inoculated with 3 x 1mL, 3 x 0.1 mL, 3 x 10 μL brine and
incubated at 37 ºC for 24 hours. After 24 hours, the test tubes were examined for turbidity and
bubbles. The scoring of the most probable number was determined by comparing the number of
positive test tubes to the table from the US Food and Drug Administration (FDA) Bacterial
Analytical Manual (FDA, 2018). Presumptive positives were confirmed using brilliant green bile
lactose broth (BGLB) (BD Biosciences, Maryland). Each of the BGLB tubes was inoculated
using a loophole from the positive MPN tubes and they were incubated at 37º C for 24 hours and
checked for bubbles.

28
2.4.4. Fungi
Acidified potato dextrose agar (APDA) plates were made using potato dextrose agar
(Alpha Biosciences, Baltimore, MD) and 10% tartaric acid (pH 3.5) to measure yeast and mold
growth according to manufacturer’s instructions from Hardy Diagnostics (2018). A one mL
aliquot of sample brine was taken out of each treatment replicate. Serial dilutions prepared in
nine mL peptone broth were plated. APDA plates were incubated at room temperature (21-22º C)
for 5+ days and the number of yeast and molds were counted after 7 days.
2.4.5. Pathogens
Pathogens were checked in the raw cabbage and kelps used to make the seaweed
sauerkraut and in each of the treatments before inoculation and at the end of the first week of
fermentation. Pathogens tested were those reasonably likely to be present in a typical processing
facility. Vibrio spp. was also inspected due to its ubiquitous presence in the marine environment.
Methods from the Bacteriological Analytical Manual for Staphylococcus aureus,
Salmonella, Listeria monocytogenes, and Vibrio (FDA, 2018) were modified to enumerate the
pathogens accordingly. To identify each pathogen, 25 g of each of the test materials were placed
aseptically into a 225ml pathogen specific broth, placed in a stomacher bag for two minutes,
incubated in stomacher bags for 24-48h, then streaked and spread plated (0.1mL) in duplicate
onto pathogen-specific plates (Table 1). The plates were checked for growth to determine the
presence of pathogens.

29
Table 1. Media, incubation time, and temperatures used to detect different pathogens.
Pathogen Media Incubation Time and Temperature Staphylococcus
aureus Tryptic soy broth (Acumedia, Lansing, MI) with 10% salt (NaCl) and 1% sodium pyruvate (TSBSP) incubated at 35º C for 24 h.
Baird-Parker (Alpha Biosciences, Baltimore, MD) plates incubated at 35º C for 48 h.
Salmonella spp. Lactose broth (Acumedia, Lansing, MI) incubated at 35 ºC for 24 h.
Xylose lysine deoxycholate agar (XLD) (Alpha Biosciences, Baltimore, MD) incubated at 35º C for 48 h. The plates were checked for colonies with black centers.
Listeria monocytogenes
Listeria enrichment broth (LEB) (Alpha Biosciences, Baltimore, MD) incubated at 28º C for 24 h.
Modified oxford agar base (MOX) (Alpha Biosciences, Baltimore, MD) plates incubated at 28º C for 48 h.
Vibrio spp. Alkaline peptone water (pH 8.6) (Alpha Biosciences, Baltimore, MD) incubated at 28º C for 24 h.
Thiosulfate-citrate-bile salts-sucrose agar (TCBS) (Alpha Biosciences, Baltimore, MD) plates incubated at 28º C for 48 h.
2.5. pH
The pH measurements of each treatment batch were taken using a Thermo
Scientific™ Orion Star™ A111 pH Benchtop Meter (Waltham, MA) with a flat probe
attachment (Thermo Scientific™ Orion™ AquaPro™ Flat Surface 9135, Waltham, MA).
Approximately 10 g of seaweed sauerkraut were aseptically removed from the fermentation jars.
The flat probe was placed directly on the seaweed sauerkraut until a consistent reading was
obtained. Measurements were taken in duplicate per fermentation jar and pH values were
averaged. pH measurements were taken on days 1, 3, 5, 7, 14, 28 and 60 post inoculation.
2.6. Titratable acidity
A modified titratable acidity (TA) procedure (UC Davis, 2018) was used as an
approximation of total acidity in the treatments on days 1, 3, 5, 7, 14, 28, and 60. Seaweed
sauerkraut (10 g) from each treatment was aseptically removed from the fermentation jars and

30
the weight was recorded (0.1g). The sample was placed into a beaker with 100 mL of distilled
water and a magnetic stir bar. A pH meter, 0.1 N sodium hydroxide (NaOH) (Fisher Scientific,
Waltham, MA), and a magnetic stir plate were set-up to perform the titration. The sodium
hydroxide was slowly titrated into the beaker until the standard pH of 8.2 was achieved. The total
volume (mL) of titrant added was recorded.
The calculations were based on the acidity of lactic acid, where the volume of sodium
hydroxide that was added was converted to moles of lactic acid and multiplied by the equivalent
milligrams of lactic acid and divided by the original weight of the sample (g). TA was measured
as a percentage value according to the following formula:
Normality of NaOH (mol/L)*Volume of NaOH (mL)* Equivalent weight of lactic acid (g/mol)* 100=% TA Sample mass(g) * 1000
2.7. Texture analyses
A Kramer shear force method was used to evaluate the texture of the seaweed sauerkraut,
using methods modified from Johanningsmeier et. al (2007). The texture analyzer (TA-XTi2,
Texture Technologies Inc., Scarsdale, NY) was calibrated using a 5,000 g load cell from the
same company before each use. Twenty-five g of seaweed sauerkraut were loaded in a single
layer on the base of the Kramer shear cell (TAXTi2, Texture Technologies Inc., Scarsdale, NY),
with a total of five flat blades. The pre-test and post-test speed was set to 2 mm/sec with a
distance of 50 mm (Johanningsmeier et. al 2007). The force (N) required to shear the sample was
recorded by the texture analysis software (Exponent 32, version 5.0, 6.0, 2010, Texture
Technologies Inc., Scarsdale, NY). The test was repeated ten times for every treatment replicate,
and force values were averaged.

31
2.8. Colorimetric analyses
Colorimetic analysis was performed using a LabScan XE Colorimeter (HunterLab) to
determine L*, a*, and b* values. Before each use, the colorimeter was warmed for 30 minutes
and was standardized using black and white ceramic standard plates. The area view was set to
1.75 inches and the port size was set to 5. Colorimeter sample cups (353002, Corning, Durham,
NC) were filled to the top with seaweed sauerkraut. A total of three readings were taken and
averaged by the software by rotating the colorimeter cup slightly clockwise after the initial
reading. Ten subsamples were measured for each treatment replicate and averaged.
2.9. Antioxidant analysis
2.9.1. Sample preparation
Approximately 50 g of seaweed sauerkraut from each treatment replicate were taken at
days 21, 42, and 60 of the experiment. Antioxidant analysis was performed at these times
because they represented likely time points when typical consumers would receive this product.
The samples were placed in plastic bags (Nasco Whirlpack, Fort Atkinson, WI), placed in the
blast freezer (-30º C) (Southeast Cooler, Lithia Springs, GA) for 1 hour, and then stored at -80 ºC
for three weeks. Samples were later processed using a freeze drier (35 EL, VirTis Co. Inc.
Gardiner, NY) for 72 hours (24 hours for each cycle) until the sample weights no longer
fluctuated. The dried samples were crushed and ground by using a mortar and pestle. The ground
samples were stored in plastic bags (Nasco Whirlpack, Fort Atkinson, WI) in the freezer (-80
ºC).
The ground samples were thawed and weighed to 2 g (± 0.005 g) and 20 mL of 60%
methanol (Fisher Scientific, Waltham, MA) was added to the samples in an Erlenmeyer flask, 10
mL, at a time. The samples were placed on a shaker for 24 hours at 210 rpm (13687700 Multi-

32
Platform Shaker, Fisher Scientific, Waltham, MA) with parafilm to cover each Erlenmeyer flask
and to minimize sample evaporation. Next, the samples were centrifuged for 10 minutes at 2100
xg (Beckman Avanti J-25, Brea, CA). The supernatant was collected and 10 mL of 60%
methanol was added to the centrifuge tube and vortexed for 30 seconds to mix the solution. The
sample was placed back on the shaker for ten minutes and then centrifuged again. This process
was repeated two more times and the supernatant volumes were combined. After this process,
distilled water was added to the supernatant to bring the total volume to 50 mL. The solution was
vortexed for 30 seconds. This extract was used for all antioxidant analysis and it was kept no
longer than 48 hours at -20º C.
2.9.2. Total phenolic content (TPC)
The Folin-Ciocalteu method was used to measure the total phenolic content in the
sauerkraut samples (Matanjun et al. 2008, Rajauria et al. 2010). The Folin-Ciocalteu reagent
(Sigma Aldrich, St. Louis, MO) was diluted (1:10) in distilled water prior to use. The diluted
Folin (1.5 mL) was added to 200 μL of sample extract, then the solution was vortexed for ten
seconds. After a five-minute incubation period, 1.5 mL of 6% sodium bicarbonate solution was
added. The samples were then placed in the dark for 1 hour to incubate.
Stocks of varying amounts of gallic acid (TCI Chemicals, Portland, OR) (0-200ug/mL in
40% methanol) were used as a standard. Samples were run in duplicate and the values were
averaged per treatment replicate. The absorbance was measured at 725 nm using a
spectrophotometer (Beckman Du 530, Brea, CA) and the blank for this protocol was 40%
methanol. Total phenolic content was expressed as mg gallic acid equivalents per g of freeze-
dried sample.

33
2.9.3. Ferric reducing antioxidant power (FRAP) assay
The Benzie and Strain (1996) method was used with some modifications to perform
FRAP analysis. Four different solutions (A, B, C, D) were made to perform the FRAP analysis.
Solution A was a 300 mM acetate buffer (pH 3.6) that was made by adding 3.1 g sodium acetate
trihydrate (Fisher Scientific, Waltham, MA) to 16 mL glacial acetic acid (Fisher Scientific
Waltham, MA). The solution was brought up to 1000 mL (1L) with distilled water. Solution B
was 10 mM 2,4,6-tripyridyl-s-triazine (TPTZ, Acros, Fair Lawn, NJ) in 40 mM hydrochloric
acid (HCl, Fisher Scientific Waltham, MA). Solution C was 20 mM FeCl36H20 (Acros, Fair
Lawn, NJ). Solution D (FRAP reagent) was a mixture of Solution A, Solution B, and Solution C
(10:1:1) that was stirred until well mixed. Solution D was warmed to 37º C in a water bath prior
to use. A standard curve was comprised of varying concentrations (50-500 μM) of FeSO47H2O in
deionized water (Spectrum Chemicals, New Brunswick, NJ). To conduct this assay, one mL of
sample extract or standard was placed in a cuvette and 3 mL of warmed FRAP reagent was
added. After 4 minutes, the absorbance was measured at 593 nm against a deionized water blank.
An internal control of 250 μM Trolox (Acros, Fair Lawn, NJ) in 40% MeOH (Fisher Scientific,
Waltham, MA) was used. Each sample extract was analyzed in duplicate and results were
expressed in μmol ferrous sulfate equivalents (FSE) per gram of freeze-dried sample.
2.9.4. α, α-diphenyl-β-picrylhydrazyl (DPPH) assay DPPH was performed based on the method from Blois (1958) with modifications. A 0.2
mM DPPH (Sigma Aldrich, St. Louis, MO) solution was prepared in 100% ethanol. To conduct
the assay, varying amounts (0.5, 1.0, 1.5, 2.0 mL) of the sample extracts were each pipetted into
test tubes, total volumes were brought to 2 mL using 40% methanol and vortexed for 10 seconds.

34
Next, 2 mL of DPPH solution was added to the test tubes which were then vortexed for 10
seconds. The test tubes were incubated in the dark for 30 minutes.
After a 30-minute incubation in the dark, the absorbance was measured at 517 nm against
the blank of 100% ethanol. Duplicate sample extracts were prepared the same way to make
sample blanks that would account for the purple color of DPPH. Therefore, 2 mL of ethanol was
added to the 2 mL of seaweed extracts instead of DPPH solution. The make the control, 2 mL of
either DPPH solution or ethanol was added to 2mL of 40% methanol. In addition, Trolox
standards were also made in duplicate for this procedure to serve as a positive control. To make
the Trolox standards, varying volumes (0.25, 0.50, 1.0 1.5, 2.0 mL) of Trolox were added to test
tubes and brought up to 2 mL with 40% methanol and 2 mL of ethanol was added to half of the
test tubes and 2 mL of DPPH solution was added to the other half. The following formula was
used to calculate % inhibition:
% DPPH inhibition = Control Abs – (Sample Abs – Sample Blank Abs) x 100 Control Abs (DPPH and 40% MeOH)
The calculated % DPPH inhibition values were plotted against the concentrations
(mg/mL) of sample and the effective concentration (mg/mL) of sample required to inhibit 50%
of the DPPH radical (EC50) was calculated using the slope and constant of the plotted line.
2.10. High performance liquid chromatography (HPLC)
HPLC analysis was performed on brine samples to quantify acetic acid, lactic acid,
glucose, sucrose, fructose, and ethanol concentrations. Brine samples (1 mL) were collected on
days 1, 3, 5, 7, and 14 of the study and stored at -20º C. Samples were thawed in the refrigerator,
diluted (1:3) in mobile phase (0.01M H2SO4), then passed through 0.45 μm filters (Advanced
Microdevices MDI Membrane Technologies, Ambala Cantt, India) using a 5-mL plastic syringe.
35
Filtered samples were placed into 2 mL vials and loaded in the HPLC (Agilent Technologies,
Santa Clara, CA). The HPLC system consisted of an 1100 series pump, degasser and
autosampler, and a 1200 series refractive index detector (RID). The 0.05 M H2SO4 mobile phase
temperature was set at 50º C and the injection volume was 20.0 μL. The column (Agilent Hi-
Plex H) flow was 0.6 mL/min. Standards of sucrose, glucose, and fructose ranging from 0.0025-
0.03 mg/mL were prepared to identify and quantify sugars in sample brines. Standards ranged
from 0.0001-0.01 mg/mL for acetic acid and from 0.0003-0.01 mg/mL for lactic acid. For
ethanol, standards ranged from 1-3 mg/mL.
2.11. Statistical analysis
Data were analyzed using IBM SPSS Statistics 24. Outliers were removed using a 3 X
Interquartile range (IQR). Multi-way analysis of variance (ANOVA) was used to assess the main
effects of seaweed species (2 levels), seaweed concentration (3 levels), and time (variable levels,
depending on analysis) on dependent variables (Laerd Statistics, 2018). Tukey’s Honest
Significant Difference (HSD) test was selected for post-hoc analyses. A significance value of
p<0.05 was chosen for all statistical analyses. A Spearman Correlation was used to assess the
linear relationships between select dependent variables.
2.12. Sensory testing
Consumer acceptability testing occurred at the University of Maine Sensory Evaluation
Center (SEC) in Hitchner Hall on Tuesday, March 27th 2018 between the hours of 11:00 am and
5:00 pm. Approximately one hundred participants who enjoy consuming sauerkraut were
recruited via word of mouth, e-mail, and posted flyers to rate the acceptability of the seaweed
sauerkraut (Appendix A). Prior to testing, institutional review board (IRB) approval was
obtained. An informed consent was provided before participation and those allergic to seafood

36
and those who do not enjoy consuming seaweed or sauerkraut were asked to not participate in
the sensory evaluation (Appendix B). The consumers received a three dollar incentive for their
participation.
2.12.1. Seaweed sauerkraut preparation for sensory testing
All samples were processed using fresh seaweed collected on March 1, 2018 from Spring
Tide Seaweed (Sorrento, Maine). The seaweed sauerkraut was prepared using the same methods
as described previously. A total of 3000 g of shredded seaweed and cabbage were weighed,
mixed with 2% canning and pickling salt, inoculated with L. plantarum (106 cfu/g) and
Leuconostoc mesenteroides (101 cfu/g), packed into four fermentation vessels, and allowed to
ferment at room temperature. To guarantee the safety of these products, the presence of
pathogens (E. coli, Vibrio) was checked and the end pH in the samples was verified as < 4.0.
This pH was below the minimum pH of 4.6 needed to control the growth of Clostridium
botulinum. Once the desired pH was established, the samples were placed in the walk-in cooler
(3º C) for two weeks until sensory evaluation to simulate when a typical consumer might receive
the commercial product after transport and stocking.
2.12.2. Sample testing
Consumers tested four seaweed sauerkraut samples: two sugar kelp and two-winged kelp
formulations made with 25 and 50 percent seaweed concentrations. The samples were served
chilled and panelists were asked to evaluate the texture, color, flavor, aroma, and overall
acceptability of the products using a 9-point hedonic scale (1 = dislike extremely, 5 = neither like
nor dislike, 9 = like extremely) (Meilgaard et al. 2016) (Appendix C). Just about right scales
(1=Not nearly salty/sour enough, 3=Just about right, 5=Much too salty/sour) were used to
evaluate sourness and saltiness. Prior to testing the samples, panelists were asked general
demographic questions and how often they consumed seaweed, sauerkraut, and probiotics.

37
Lastly, the participants were asked to add any additional comments about the samples they
tested.
The test process was executed using SIMS 2000 software (SIMS Sensory Quality Panel
Software Cloud Systems, Sensory Computer Systems, Berkeley Heights, NJ) and the
acceptability data were assessed by one-way Analysis of Variance (ANOVA) and Tukey’s post-
hoc test to determine significant (p <0.05) differences among the four samples.
During testing, the environmental conditions were kept clean and well-lit to control
variables and biases. Distractions were kept to a minimum and differences were minimized
amongst samples by filling each ramekin half full (~25 g) of seaweed sauerkraut. Samples were
placed into two-ounce clear plastic containers that had computer printed labels attached at the
same location. All samples were kept at a similar temperature by holding them in the refrigerator
until serving. The presentation of samples was balanced and randomized according to the SIMs
software. The participants were asked to evaluate the four coded samples from left to right and to
take a sip of water in between samples.

38
3. RESULTS AND DISCUSSION 3.1. Overview
The results indicate that kelps can be fermented successfully and that seaweed species
and incorporation level affect certain characteristics of the fermented products. Visually, the
winged kelp (WK) sauerkraut was slightly darker green and the fermentation vessels had more
brine. Seaweed and cabbage were clumped together in the SK treatments and were somewhat
slimy to the touch. Some SK treatments also had a slight red color, possibly from yeast
contamination, at the upper surface of the sauerkraut and this have may been due to air exposure
from having less brine in the treatments or from repeated sampling. Each fermentation jar was
filled to the top with brine to normalize the amount of brine across treatments and to avoid
exposure to air, however some samples bubbled over during fermentation resulting in some loss
of brine. Furthermore, fermentation jars had to be checked frequently to make sure that samples
were covered in brine. To avoid this in future studies, fermentation weights could be used to help
keep the samples more packed and submersed in brine. The bubble production in the air lock
showed that all treatments produced carbon dioxide, however less bubbling occurred in the high
SK concentration treatments. No spoilage off odors were noted during the experiment and
overall, these products remained stable throughout the refrigerated storage study.
3.2. Microbiology
3.2.1. Lactic acid bacteria counts
Each treatment was inoculated with Lactobacillus plantarum (target 106 CFU/g) and
Leuconostoc mesenteroides (target 101 CFU/g) at the beginning of the study (Day 0). The lactic
acid bacteria count immediately post inoculation was less than 4 log CFU/g in all treatments.
This was lower than expected, possibly because the microbial sampling for this time point was
taken shortly after inoculation. The average lactic acid bacteria count in the seaweed sauerkraut
39
treatments ranged from 3.00- 7.79 log CFU/g over time as the counts increased throughout the
study (Figure 5). However, all treatments reached an average lactic acid bacteria count of 106
CFU/g or higher during the study. The increase in total lactic acid bacteria populations over time
was expected due to fermentation and the use of starter cultures. Furthermore, the high (≈106)
lactic acid bacteria populations found in the treatments show the potential of this product as a
probiotic. Beganovic et al. (2011) defined probiotic products as containing at least 106 live
probiotic colonies per gram and the added Lactobacillus plantarum and Leuconostoc
mesenteroides are both considered probiotic strains (Beganovic et al. 2011). Additionally, the
maximum lactic acid bacteria populations found in this study are comparable to an inoculated
2.5% NaCl sauerkraut study by Beganovic et al. (2011), where counts ranged from 5.88-7.27 log
CFU/mL.

40
Figure 5. Mean lactic acid bacteria populations (log CFU/g) in seaweed sauerkraut over time, a) sugar kelp and b) winged kelp.
a)
b) Values are means ± S.D. (n=3).
0123456789
10
0 1 3 7 14 21 28 35 42 49 60
LogCFU/g
Time(Days)
25%SugarKelp 50%SugarKelp 75%SugarKelp
0123456789
0 1 3 7 14 21 28 35 42 49 60
LogCFU
/g
Time(Days)
25%WingedKelp 50%WingedKelp 75%WingedKelp

41
There was a significant (p=0.03) interaction between seaweed species, concentration, and
time with regard to LAB population. Seaweed species had a significant effect on LAB counts in
the sauerkraut, as SK had a significantly (p<0.01) higher (5.42 log CFU/g) average lactic acid
bacteria population overall compared to WK (3.97 log CFU/g). The higher overall LAB counts
in the SK treatments is because their LAB counts remained steady over time. Additionally, there
was a significant interaction between time and treatment (p<0.01). After day 7 of the study, mean
LAB counts across SK treatments varied by only 1 log CFU/g. In contrast, the LAB counts over
time in WK dropped similarly to an inoculated sauerkraut fermentation study on red cabbage
(Hunaefi et al. 2013). The authors reported maximum LAB counts on day 7 and after the
maximum was reached, the population decreased slowly, a trend that was also found in the WK
treatments. Despite the higher average LAB counts in SK, WK reached 6% higher maximum
LAB counts during the study. For WK, the maximum mean LAB counts occurred on day 7 (7.08
log CFU/g), while for SK, the maximum mean LAB count was on day 60 (6.65 log CFU/g).
Overall, the highest mean lactic acid bacteria count was 6.42 log CFU/g on day 7.
The difference in LAB counts among seaweed species is interesting because both species
are brown seaweeds. Brown seaweeds are rich in carbohydrates including laminarin, mannitol,
and structural carbohydrates such as alginate and cellulose (Schiener et al. 2015). Their
carbohydrate contents vary seasonally, as seaweed have more storage carbohydrates during the
fall because they are an energy source in the colder months (Schiener et al. 2015).
Carbohydrates are necessary for LAB growth and ideal carbohydrates used in seaweed
fermentation are the glucose polymer laminaran and sugar alcohol mannitol (Sandbakken et al.
2018). Therefore, the changing carbohydrate composition during seasons could account for the
differences in LAB counts among species. A study compared the seasonal differences in the

42
composition of WK and SK and found that WK had maximum carbohydrate content during early
June and July (Schiener et al. 2015). However, SK carbohydrate maximums were found later in
fall (Schiener et al. 2015). The seaweed was collected in June for this study. Therefore, high WK
LAB counts found in the first week of this study could be from the availability of carbohydrates
in the WK and could account for the delayed fermentation in SK. Furthermore, seasonality also
influences the minerals and vitamins found in seaweed species and changes the micronutrients
available for microbial growth in fermentation and this could account for LAB count variability
among species (Schiener et al. 2015).
There was a significant interaction between seaweed concentration and seaweed species
(p=0.01) and seaweed concentration and time (p<0.01). Varying amounts of SK/cabbage
influenced lactic acid bacteria growth, with significantly (p<0.01) lower overall LAB counts
found in the 75% SK treatment. However, in the WK, the 25%, 50%, and 75% treatments were
not significantly different in lactic acid bacteria populations (Table 2). Lactic acid bacteria are
naturally found on cabbage and an average of 3.71 log CFU/g was present on the raw cabbage.
No lactic acid bacteria were detected in raw winged kelp and sugar kelp starting material, based
on a 25-300 colonies per plate detection limit. Despite the higher starting lactic acid bacteria
populations in the cabbage compared to kelps, the treatments with more cabbage did not have
significantly higher mean LAB populations, likely from inoculating ~100 times higher than the
natural LAB population found on cabbage. However, this could also suggest that seaweed has
similar nutrients to cabbage that can sustain lactic acid bacteria populations. As mentioned
previously, cabbage and seaweed are rich sources of carbohydrates. There are also important

43
micronutrients found in cabbage and seaweed, like zinc, that help support microbial growth
during fermentation (Wu et al. 2008; Schiener et al. 2015).

44

45
3.2.2. Aerobic plate counts
There was a significant interaction found among seaweed species and seaweed
concentration (p<0.01), seaweed species and time (p<0.01), and seaweed concentration and time
(p<0.01). The aerobic plate counts were 23% higher overall in the SK treatments (5.53 log
CFU/g) compared to the WK treatments (4.25 log CFU/g), meaning that there was a significantly
higher total bacteria population in the SK treatments (Figure 6). The WK aerobic plate count
remained consistent over time among different seaweed concentrations, with a mean ranging
from 4.23-4.28 log CFU/g (Table 3). All WK concentrations had significantly lower average
aerobic plate count throughout the study when compared to SK treatments. In contrast, the
addition of SK affected the aerobic plate count, as the highest average aerobic plate count was in
the 50% treatment (6.33 log CFU/g), while the lowest average aerobic plate count was in the
75% treatment (4.69 log CFU/g). These results were unusual, however, this could have been due
the antimicrobial effects of seaweed (Kausalya and Narasimha 2015

46
Figure 6. Mean aerobic plate counts (log CFU/g) in seaweed sauerkraut by species.
Values are means ± S.E. Treatments not sharing a letter are significantly (p<0.001) different based on Multi-Way ANOVA (n=9).
SugarKelp WingedKelpMean 5.53 4.25
0
1
2
3
4
5
6LogCFU/g
Species
b
a

47

48
However, the mean aerobic plate count across all treatments was similar at the beginning
(day 0) and the end (day 60) of the study, as the mean aerobic plate count started at 4.13 log
CFU/g and ended at 4.77 log CFU/g. Throughout the study, the overall aerobic plate count
ranged from 3.08-6.99 log CFU/g across all treatments over time. The aerobic plate counts were
considerably lower compared to another sauerkraut study by Beganovic et al. (2011) that tested
three different conventional sauerkraut formulations. One treatment had 4% salt and was a
spontaneous fermentation. The other two treatments were inoculated with L. plantarum and L.
mesenteroides (1:1), with one treatment having 2.5% salt and the other having 4% salt. The mean
range of the aerobic plate count among all these treatments was 6.04 to 8.11 log (Beganovic et al.
2011). The addition of seaweed to the treatments could account for the lower total bacteria
population because compounds in seaweed display antimicrobial activity (Perez et al. 2016).
Brown seaweeds (like kelp) are rich in polysaccharides and phenolic compounds. Because of the
unique structure and chemical nature of these compounds, they are known for antimicrobial,
antiviral, and antifungal activity (Perez et al. 2016). Furthermore, seaweeds produce metabolites
that act as defense mechanisms during environmental stress and act as natural antimicrobial
agents (Perez et al. 2016).
3.2.3. Coliform counts
Coliforms are typically tested to determine water quality and to detect fecal coliforms,
which are evident in water polluted with sewage or animal waste (CDC, 2015). While the
number of coliforms in the seaweed sauerkraut varied randomly throughout the study, positive
MPN tubes were confirmed. This indicates that fecal coliforms were present in some of the
treatments. The cabbage could have contributed to the number of coliforms could that were
found, as the average number of coliforms found on the raw cabbage was 47 times higher than

49
the average number of coliforms found on the winged kelp (15 MPN/g) and sugar kelp (14
MPN/g). Seaweed could have also contributed to these values, if so, indicating that the harvest
waters and seaweed were exposed to coliform bacteria. To support this, the concentration of
seaweed significantly influenced the number of coliforms that were found in the SK seaweed
sauerkraut. The 75% SK had significantly higher coliform counts than the 25% SK and 50% SK
treatments, at 619 + 105.45 MPN/g, 229.6 + 101.87 MPN/g and 85.57 + 101.87 MPN/g,
respectively. Contrastingly, there were no significant differences in coliform counts as the WK
concentrations increased in the treatments. However, the WK treatment fermented sooner than
SK and fermentation is reported to decrease the number of coliforms found in a product
(Kimmons et al. 1999). This could explain the lower number of coliforms detected in WK
sauerkraut and why coliform counts were significantly higher in the SK treatments throughout
the entire study (Figure 7). Additionally, the 75% SK treatments fermented the slowest and this
could also be why this treatment had the highest number of coliforms. Overall, the process of
fermentation did not decrease the number of coliforms, as much as anticipated. Kimmons et al.
(1999) defined product contamination as greater than 100 CFU/mL of sample when measuring
coliforms in different foods. Several seaweed sauerkraut treatments had higher numbers
recorded. Overall, length of storage did not influence the number of coliforms that were found in
the sauerkraut treatments.

50
Figure 7. Mean positive coliform count (MPN/g) in seaweed sauerkraut by species.
Values are means (MPN/g + S.E.) Values not sharing a letter are significantly (p<0.01) different from each other based on Multi-Way ANOVA (n=9).
3.2.4. Fungi
The presence of mold and yeast was monitored throughout the entire study on a weekly
basis. For the most part, mold and yeast were not present throughout the study. Molds were
sometimes detected, but most treatments had an average of less than one mold present each
week. Additionally, the presence of mold and yeast was random among the treatments in the
study.
Molds were not expected in these products, as molds typically grow in aerobic conditions
and the seaweed sauerkraut was sealed and covered in brine. However, yeasts are typical
spoilage organisms in a fermented product. The use of the starter culture, L. plantarum, in this
study helped to avoid yeast contamination among the treatments. Research by Prachyakij et al.
SK WKMean 311 9
0
50
100
150
200
250
300
350
400MPN
/g
Species
a
b

51
(2008) found that L. plantarum enabled the best yeast inhibition in fermented plant beverages
when tested against 72 different LAB strains and helps support the results in this study.
3.2.5. Pathogens
Food safety is important to maintain in all products and pathogens are typically
responsible for foodborne illness. Therefore, the presence of Staphylococcus aureus,
Salmonella, Listeria monocytogenes, and Vibrio was checked in all treatments. One pathogen,
Vibrio, was detected at the start of the study on the raw winged kelp material. Further testing
showed that Vibrio was also present in the first week of the study on the sugar kelp 75%
treatment, but it was not present at the end of the study. The presence of this pathogen could be
because the seaweed in this study was harvested at the end May, which is towards the end of the
harvesting season. Vibrio is a pathogen that is typically more prominent in the summer/warmer
months and this could be why it was detected (CDC, 2017). However, kelp is usually harvested
earlier in the spring and this could help prevent contamination by Vibrio. When samples were
prepared for sensory evaluation using seaweed that was collected in March, no pathogens were
detected. Additionally, collecting the seaweed in March resulted in much cleaner seaweed
overall. There was hardly any biological fouling present, meaning that hydroids, epiphytes, and
other organisms were not on the seaweed. There was a much larger incidence of biological
fouling on the seaweed collected in May.
It should be reiterated that the absence of pathogens, low aerobic plate count, and low
presence of mold/yeast, could be because of the important antimicrobial effects of seaweed
(Kausalya and Narasimha 2015; Perez et al. 2016; Roohinejad et al. 2017). The inhibition of
pathogens was tested in a study by Kausalya and Narasimha (2015). The growth inhibition of 18
different pathogens (S. aureus, E. coli, Enterobacter aerogenes, etc.) was tested in brown

52
seaweed extracts and it was determined that seaweed had significant antimicrobial activity based
on the absence of pathogens.
3.3. pH
pH is a key indicator used to track fermentation, as acid is the main product in a lacto-
fermentation. Kelp species had a significant (p<0.01) effect on pH values of sauerkraut
treatments, with WK treatments having lower overall pH values than SK treatments (Figure 8).
There was also a significant (p=0.02) interaction between species and concentration. In both
species, the 25% treatments had overall pH values that were significantly (p=0.002) lower than
the 75% seaweed concentrations. As the concentration of SK increased there was no significant
effect on pH values. However, as the concentration of WK increased from 50% to 75% the pH
increased significantly (p<0.001) from 4.2 to 4.5.
Figure 8. Mean pH values in seaweed sauerkraut by species.
Values are means ± S.E. Values not sharing a letter are significantly different (p<0.001) from each other based on Multi-Way ANOVA (n=9).
SugarKelp WingedKelpMean 4.8 4.3
4.04.14.24.34.44.54.64.74.84.9
pH
Treatment
b
a
53
Based on pH, there was a significant (p=0.02) three-way interaction between seaweed
species, percent, and time. Regarding time and species, there was a significant (p<0.01)
interaction and WK treatments fermented quicker than the SK treatments. All WK treatments
reached the goal pH of 4.6 or lower by day 3. The results are consistent with other sauerkraut
fermentation studies that inoculated with L. plantarum and L. mesenteroides. Hunaefi et al.
(2013) and Beganovic et al. (2011) inoculated cabbage with L. plantarum and found that the
sauerkraut pH reached below 4.6 by day 4 and day 7, respectively. However, in the current
study, SK did not reach the goal pH until day 14. SK took approximately 11 days longer to
ferment compared to WK (Table 4). The delayed fermentation in the SK treatments is consistent
with the lactic acid bacteria populations, as some of the highest lactic acid bacteria populations
were achieved on day 28 and 60 of the study, which is when the lowest pH values were also
recorded. Furthermore, pH was negatively correlated (p<0.001) with aerobic plate counts (-0.30)
and lactic acid bacteria (-0.35), meaning that the pH decreased when the populations increased.
Although the SK treatments exhibited delayed fermentation in comparison to WK, the
fermentation times were quicker than in typical spontaneous sauerkraut products (Beganovic et
al. 2011). Beganovic et al. (2011) conducted research on spontaneous sauerkraut fermentation,
using 4% salt, and found that the pH did not drop below 4.6 until day 28. Interestingly, the mean
pH values for WK and SK treatments were similar at the start of the study and the end. For WK
treatments, the starting pH was 5.8 the end pH was 3.9. For SK treatments, the mean pH was 5.5
at the beginning of the study and 4.0 at the end.
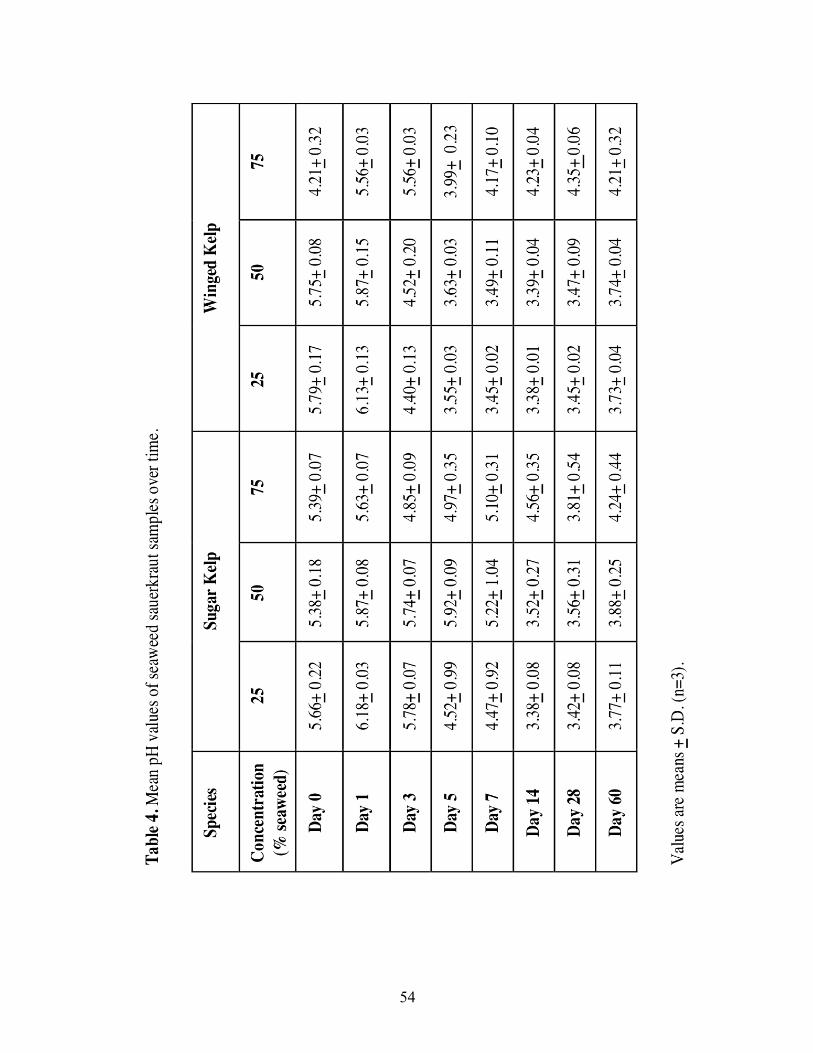
54

55
3.4. Titratable acidity
Similar to the pH results, there was a significant interaction among species, seaweed
concentration, and time (p=0.02). TA was significantly different among species, as the overall
TA of 0.31% for SK samples was significantly (p<0.01) lower than the TA of 0.41% for WK.
This was expected because TA is typically higher in samples that have a lower pH, as supported
by the significant (p<0.01) strong negative correlation (-.848) between TA and pH (Table 5). TA
was positively correlated with aerobic plate counts and lactic acid bacteria, meaning that the TA
increased when the lactic acid bacteria and aerobic plate count increased (p<0.01).
Table 5. Spearman correlations among pH, titratable acidity (TA), lactic acid bacteria (LAB) population, and aerobic plate counts (APC).
pH TA LAB APC
pH ____ -.848** -.353** -.296***
TA -.848** ____ .266** .259**
LAB -.353** .266** ____ .850**
APC -.296*** .259** .850** ____
**=p<0.01, ***=p<0.001.
Overall, as the concentration of seaweed increased, the TA decreased significantly
(p<0.01) at each concentration level (Figure 9). Specifically, this was the case for the SK
treatments. However, in WK treatments, the 25% and 50% TA were not significantly different,
but both were significantly lower than the 75% treatment (p<0.01).

56
Figure 9. Overall mean titratable acidity (%) in seaweed sauerkraut by seaweed concentration.
Values are means ± S.E. Values not sharing a letter are significantly (p<0.001) different from each other based on Multi-Way ANOVA, followed by a Tukey’s HSD post hoc test (n=6).
Among all treatments, time had significant (p<0.01) interactions with percent, as well as
seaweed species (p<0.01). Over time, the average TA increased significantly (p<0.01) from the
beginning of the study at 0.05% (Day 0) to 0.67% (Day 60) (Table 6).
25 50 75Mean 0.56 0.39 0.19
0
0.1
0.2
0.3
0.4
0.5
0.6
0.7TitratableAcid
ity(%
)
Concentration(%)
a
b
c

57

58
3.5. Texture analysis
Texture of fermented products is a key attribute for consumers because it is important
that the structure of the product is preserved. Kelp species significantly (p<0.001) affected the
mean shear force (N) values in the sauerkraut throughout the study (Figure 10). WK treatments
were ~2 times higher in mean shear force values than SK treatments throughout the study. This
result was expected because WK has a distinct midrib in the middle of its blade. This midrib is
thicker than the surrounding blade and similar in thickness to seaweed stipes. This likely
accounted for the higher resistance to shear when comparing the two species, because SK has a
thinner undivided blade.
Figure 10. Mean shear force (N) of seaweed sauerkraut by species.
Values are means ± S.E. Values not sharing a letter are significantly (p<0.001) different based on Multi-Way ANOVA (n=9).
SugarKelp WingedKelpMean 103.7 212.6
0
50
100
150
200
250
ShearF
orce(N
)
b
a

59
There was a significant (p<0.01) interaction between the seaweed species and seaweed
concentration texture values. The texture of the SK sauerkraut treatments was significantly
influenced by seaweed concentration. For SK treatments, as concentrations of SK increased from
25% to 75%, shear force decreased significantly from 165.5 to 53.8 N (Figure 11a).
Interestingly, the percent incorporation did not influence the shear force values of the WK
sauerkraut (Figure 11b), indicating that WK texture was similar to cabbage in terms of resistance
to shear.

60
Figure 11. Mean shear force (N) of seaweed sauerkraut by seaweed concentration, a) sugar kelp and b) winged kelp.
a)
b) Values are means ± S.E. Values not sharing a letter are significantly (p<0.05) different from each other based on Multi-Way ANOVA followed by a Tukey’s HSD post hoc test (n=3).
25 50 75Mean 165.5 91.7 53.8
0
50
100
150
200
250ShearF
orce(N
)
SugarKelpConcentration(%)
a
b
c
25 50 75Mean 219.8 214.4 203.6
0
50
100
150
200
250
ShearF
orce(N
)
WingedKelpConcentration(%)
a aa

61
Throughout the study, there was a significant interaction (p<0.01) between seaweed
species and time. The WK and SK treatments showed similar trends over time with the lowest
shear force values recorded at the beginning of the study and the highest values on day 27,
indicating that resistance to shear increased significantly over time for the first half of the storage
period (Table 7). The mean shear resistance of the SK and WK treatments significantly
decreased by over 30 percent from day 27 to the end of the study (Day 60) with mean values
changing from 208.5 N on day 27 to 142.7 N on day 60. The increase in shear resistance found
in the first half of this study could be due to the use of starter cultures. Johanningsmeier et al.
(2007) found that the firmness of spontaneous fermentation products varied within treatments
and decreased over time. Yet, the addition of L. mesenteroides, a lactic acid bacteria starter
culture, to the sauerkraut helped to retain the texture. The addition of salt to the treatments could
have also influenced the shear resistance values found in the seaweed sauerkraut.
Johanningsmeier et al. (2007) found that adding salt increased the crunchiness (shear firmness)
of conventional cabbage sauerkraut. Their study suggested that salt inhibited activity of
softening enzymes and preserved the original texture (Johanningsmeier et al. 2007). This could
explain why the average shear firmness among all the treatments did not decrease until day 60
for this seaweed sauerkraut study.

62
Table 7. Mean shear force values (N) in seaweed sauerkraut over time.
Species Concentration (% seaweed)
Days 6 12 27 60
Sugar Kelp
25 125.5 + 37.3 140.5 + 32.4 209.9 + 29.1 186.2 + 29.6
50 61.5 + 19.9 86.9 + 23.9 111.7 + 19.0 106.8 + 21.7
75 34.2 + 14.1 38.1 + 15.2 88.7 + 17.1 54.0 + 14.6
Winged Kelp
25 172.1 + 37.9 249.4 + 34.4 278.6 + 40.7 179.2 + 40.5
50 164.7 + 7.9 266.3 + 6.7 267.7 + 7.1 158.9 + 42.5
75 127.9 + 48.5 221.0 + 49.1 294.3 + 47.4 171.1 + 41.1
Values are means + S.D. (n=3).
3.6. Colorimetric analysis
Color is an indicator of quality for many food products and measuring color can show
how the products change over time. Regarding species, the L* values were not significantly
different between WK and SK samples (Figure 12). However, a* and b* values were both
significantly (p<0.01) higher in SK sauerkraut treatments. For b* values, there was also a
significant (p<0.01) three-way interaction between seaweed species, seaweed concentration, and
time. These data indicate that SK samples were more red and yellow in color than the WK
treatments. It could also suggest that SK treatments had more fucoxanthin, as this pigment is
responsible for the yellowish and brownish color of seaweeds (Mouritsen et al. 2013b). When
fuxoxanthin is present, the pigment responsible for green color, chlorophyll a, is masked. WK
treatments were greener than SK treatments, indicating that chlorophyll a was a more dominant
pigment.
The difference in dominant pigments among species could impact the marketability and
consumers’ response to this product. For example, consumers typically relate the color green to

63
nature (Sliburyte and Skeryte 2014). The greener WK might be considered more favorable to
consumers wanting more natural products, although, both products are equally natural.
Figure 12. Mean L* a* b* values of seaweed sauerkraut samples by species.
Values are means ± S.E. Values not sharing a letter are significantly different (p<0.01) from each other based on Multi-Way ANOVA followed by a Tukey’s HSD post hoc test (n=9).
There was a significant interaction between seaweed concentration and seaweed species
for L* values. As the seaweed concentration increased the L* values decreased significantly
(p<0.01). This was expected because the seaweed was darker than the cabbage. The a* values
decreased as the seaweed concentration increased, indicating that the sample became greener
with the addition of seaweed. For a* and b* values, there was a significant interaction between
seaweed concentration and time (p=0.02, p=0.05). A significant interaction (p=0.05) also
occurred between seaweed concentration and species (p=0.05) in the b* values, as the b* values
were highest in the 25%, yet lowest in the 50% concentrations (Table 8).
L* a* b*SK 38.2 2.3 20.8WK 38.9 0.3 16.4
051015202530354045
ColorV
alue
s
ab
ab
a a

64

65
Additionally, the overall L* values were significantly lower on day 6 than other days of
the study. After day 6, the L* values stayed consistent for the rest of the storage time. This
indicates that the samples color was maintained. Additionally, a* and b* values were highest on
day 6.
3.7. Antioxidant analysis
3.7.1. Total phenolic content (TPC)
Throughout the study, SK and WK treatments had very similar average total phenolic
contents (TPC) of 2.38 (mg/g) and 2.61(mg/g), respectively, indicating that species did not
influence TPC. The similarity in TPC among WK and SK sauerkraut treatments is interesting
because other researchers have reported significant differences in TPC among various seaweed
species (Gupta et al. 2012). Gupta et. al (2012) compared the TPC among two different kelp
species, Laminaria digitata and Saccharina latissima (SK). The TPC for L. digitata was 3.1
times lower than for the SK. The variability found among species in that study may have been
due to environmental and location factors. Therefore, the similar TPC found among WK and SK
sauerkraut treatments could be because they were harvested at the same time and in the same
location.
As seaweed concentration increased in SK and WK sauerkraut samples, TPC also
increased and there was a significant (p<0.01) interaction among seaweed concentration and
seaweed species (Table 9). The 75% treatments were more than 50% higher in TPC than the
25% seaweed sauerkraut. However, the TPC in 25% and 50% treatments were not significantly
different from each other for both the WK and SK treatments. Comparing the TPC in this study
to a red cabbage sauerkraut study by Hunaefi et al. (2013) suggests that the addition of seaweed
may have increased the TPC of the sauerkraut. The TPC in red cabbage inoculated with L.

66
plantarum ranged from 1.29-1.85 mg/g throughout a 38-day study, almost 30% lower than the
average TPC found in the WK (2.61 mg/g) and SK (2.38 mg/g) treatments. However, we cannot
confirm that the seaweed was directly responsible for higher TPC level between studies, since
different cabbage species were also used. Yet, TPC of seaweed sauerkraut can be directly
compared to the TPC of fresh WK and SK blades. Nayyar (2016) reported that the average TPC
of WK and SK were approximately 14 mg/g and 2 mg/g, respectively. This suggests that SK and
SK sauerkraut are similar in TPC. However, Nayyar (2016) recorded TPC levels in WK more
than 3x higher than levels found in 75% WK sauerkraut. Differences among studies may be due
to seasonality and the fact that seaweed sauerkraut treatments had less seaweed, however, this
would only account for a slight variation. The TPC of the seaweed sauerkraut treatments did not
significantly change during storage. Additionally, these TPC values can be compared to berries,
fruits well-known for their high antioxidant activity. Huang et al. (2012) found that blueberries,
strawberries, and blackberries had a TPC of 9.44, 2.72, and 5.58 mg/g, respectively. While
blueberries had a particularly high TPC, the TPC of seaweed sauerkraut was comparable to those
of strawberries and blackberries, indicating that this product also has high antioxidant activity.
Table 9. Mean total phenolic content (mg/g) of seaweed sauerkraut over time.
Days
Species Concentration (% seaweed) 21 42 60
Sugar Kelp
25 1.78 + 0.08 1.91 + 0.11 2.11 + 0.14
50 2.20 + 0.29 2.17 + 0.14 2.12 + 0.15 75 2.49 + 0.5 3.43 + 0.36 3.20 + 0.36
Winged Kelp
25 1.58 + 0.06 1.78 + 0.1 1.83 + 0.15
50 1.68 + 0.29 2.04 + 0.15 2.01 + 0.30
75 3.90 + 0.46 4.48 + 0.88 4.17 + 0.52
Values are means + S.D. (n=3).

67
3.7.2. Ferric reducing antioxidant power (FRAP) assay
The FRAP assay assesses the ability of an antioxidant to reduce reactive species. It is an
electron transfer reaction that reduces a ferric oxidant to a ferrous ion (Benzie and Strain 1996).
The higher FRAP values found in SK sauerkraut show that species did influence FRAP values
and that SK treatments had higher antioxidant capacity (Figure 13). Seaweeds tend to differ in
FRAP values among species, with brown seaweeds having high FRAP values when compared to
red seaweeds (Matanjun et al. 2009; O’Sullivan et al. 2011). Furthermore, fermented products
have shown higher FRAP values than non-fermented products (Cho et al. 2015). One reason for
this could be because fermentation releases active peptides, due to the use of Lactobacillus. A
study by Ramesh et al. (2012) found that Lactobacillus strains produced bioactive peptides in
milk, which have antioxidant activity due to their interaction with free radicals.
Figure 13. Overall mean FRAP values (μmol FSE/g) in seaweed sauerkraut by species.
Values are means ± S.E. Values not sharing a letter are significantly (p<0.05) different from each other based on Multi-Way ANOVA followed by a Tukey’s HSD post hoc test (n=9). FRAP = ferric reducing antioxidant power.
SugarKelp WingedKelpMean 22.3 19.4
17
18
19
20
21
22
23
24
FRAP
(μmolFSE/g)
Species
a
b

68
Similar to the results of the TPC analysis, the percentage of seaweed significantly
affected the FRAP values. There was a significant interaction between seaweed species and
seaweed concentration (p<0.01). The highest FRAP values were found in the 75% treatments,
with an average of 26.6 μmol FSE/g dried seaweed sauerkraut in the 75% WK treatment and
37.4 μmol FSE/g in the 75% SK treatment. Additionally, the 75% SK FRAP values were 54%
higher than the 25% treatments. In WK, the 75% FRAP values were 30% higher than the 25%
treatments (Figure 14). Unexpectedly, the FRAP values were lowest in the 50% treatments for
both the SK and WK.
Figure 14. Overall mean FRAP values (μmol FSE/g) in seaweed sauerkraut by seaweed concentrations.
Data are means ± S.E. Values not sharing a letter are significantly (p<0.05) different from each other based on a Multi-Way ANOVA followed by a Tukey’s HSD post hoc test (n=6). FRAP = ferric reducing antioxidant power.
Overall there was a three-way interaction (p<0.01) between time, seaweed concentration,
and seaweed species for FRAP values. There was also a two-way interaction between time and
25 50 75Mean 18.2 11.9 32.5
0
5
10
15
20
25
30
35
40
FRAP
(umolFSE/g)
Concentration(%)
a
b
c

69
seaweed species (p=0.01) and time and seaweed species. (p<0.01). Time influenced the FRAP
values, as the values in SK treatments were 10% higher at day 60 compared to day 21 (Table 10).
Comparably WK treatments were approximately 80% higher at day 60 than day 21. The increase
in FRAP values was mostly due to the 75% sauerkraut treatments. The increase in FRAP values
over time could be due to fermentation and the presence of lactic acid bacteria, as previously
mentioned. In this study, the overall average lactic acid bacteria counts were lowest on day 21
and highest on day 60. Therefore, the increase in lactic acid bacteria metabolic activity could
have produced compounds that increased the antioxidant activity.
Table 10. Mean FRAP (μmol FSE/g) values in seaweed sauerkraut over time.
Species Concentration (% seaweed) Days 21 42 60
Sugar Kelp
25 17.4 + 3.4 13.0 + 4.7 20.0 + 2.6
50 9.2 + 0.5 16.9 + 1.9 11.4 + 0.9
75 36.0 + 3.6 38.7 + 1.9 37.4 + 2.5
Winged Kelp
25 18.2 + 1.8 18.4 + 3.1 19.4 + 3.1
50 10.4 + 0.5 11.5 + 0.8 10.6 + 1.1
75 9.4 + 1.0 39.2 + 5.6 37.5 + 5.9
Values are means + S.D. (n=3). FRAP = ferric reducing antioxidant power.
3.7.3. α, α-diphenyl-β-picrylhydrazyl (DPPH) assay The results of the DPPH assay show that species did not influence the DPPH values. The
DPPH units are reported in EC50 (mg/mL), which is the sample concentration (mg/mL) needed to
inhibit 50% of the DPPH free radicals. Throughout the study, SK and WK treatments had very
similar average EC50 values of 5.31 (mg/mL) and 5.54 (mg/mL), respectively.

70
As seaweed concentrations in the sauerkraut increased, EC50 values decreased
significantly (Table 11). The lower the EC50 value of the sample, the higher its antioxidant
capacity. The 75% treatments had the lowest EC50 values, while the highest was found in the
25% treatments. The 75% percent treatments were approximately three times lower than the 25%
seaweed sauerkraut treatments, overall indicating that they had a higher antioxidant capacity.
Data from Nayyar (2016) support the claim that the addition of seaweed contributes to higher
antioxidant activity. Nayyar (2016) found low DPPH values in seaweeds, with an average EC50
~7mg/mL in sugar kelp and a better value of ~1 mg/mL for winged kelp. For sauerkraut, this
study found average EC50 values of 3.1 and 2.3 mg/mL, in the 75% SK and 75% WK treatments,
respectively. While the WK EC50 values found in seaweed sauerkraut are comparable to those in
raw WK, the SK EC50 values were lower (better) compared to raw sugar kelp. As discussed
previously, the process of fermentation may have contributed to the lower EC50 values by
increasing the production of antioxidant metabolites.
Table 11. Mean DPPH EC50 (mg/mL) values in seaweed sauerkraut over time.
Species Concentration (% seaweed)
Days
21 42 60 Sugar Kelp 25 8.93+ 0.86 7.70 +1.70 5.73 + 0.94
50 6.32 + 1.20 4.86 +1.39 4.80 + 1.24
75 3.41+ 1.39 2.94 + 0.78 3.07 + 0.53
Winged Kelp
25 7.96 + 0.97 6.73+ 0.99 7.52 + 2.86
50 7.44 + 1.65 6.90 +0.42 6.54 + 0.76
75 2.13 + 0.57 2.67 + 1.55 2.01 + 0.56
Values are means + S.D. (n=3). DPPH = α, α-diphenyl-β-picrylhydrazyl.

71
The DPPH EC50 values decreased somewhat over time, but the changes were not
significant. Mean SK and WK EC50 values decreased from 6.22 to 4.53 mg/mL and 5.84 to 5.36
mg/mL, respectively, from day 21 to day 60 of the study. These results are comparable to those
for FRAP values, as there was an increase in antioxidant capacity over time among sauerkraut
samples.
Because TPC, FRAP, and DPPH assays are all indicators of antioxidant activity, they
were compared using Spearman Correlations. DPPH EC50 values were strongly negatively
correlated (-0.788, p<0.01) with TPC and to a lesser extent with FRAP (-0.541, p<0.01) (Table
12). FRAP and TPC were strongly positively correlated (0.601, p<0.01), meaning that samples
with a higher TPC also had a higher FRAP. The data are supported by previous studies that also
reported a high correlation between TPC and antioxidant activity among seaweeds (Chew et al.
2008, Rajauria et al. 2010). One reason for this high antioxidant activity is because seaweeds
have a unique chemical composition. Seaweeds are rich in phlorotannins, which are the
dominant phenolic compounds in brown seaweed. Seaweeds with more phlorotannins have
showed high antioxidant activity. Brown seaweeds also have more biologically active
compounds that have been known to inhibit enzymes (e.g. α-glucosidase, acetylcholinesterase,
and butyrylcholinesterase) and free radicals, making the species rich in important antioxidants
(Andrade et al. 2013). Additionally, seaweed is high in polysaccharides and these
polysaccharides have sulphate groups that could enhance their antioxidant activities (Roohinejad
et al. 2017).
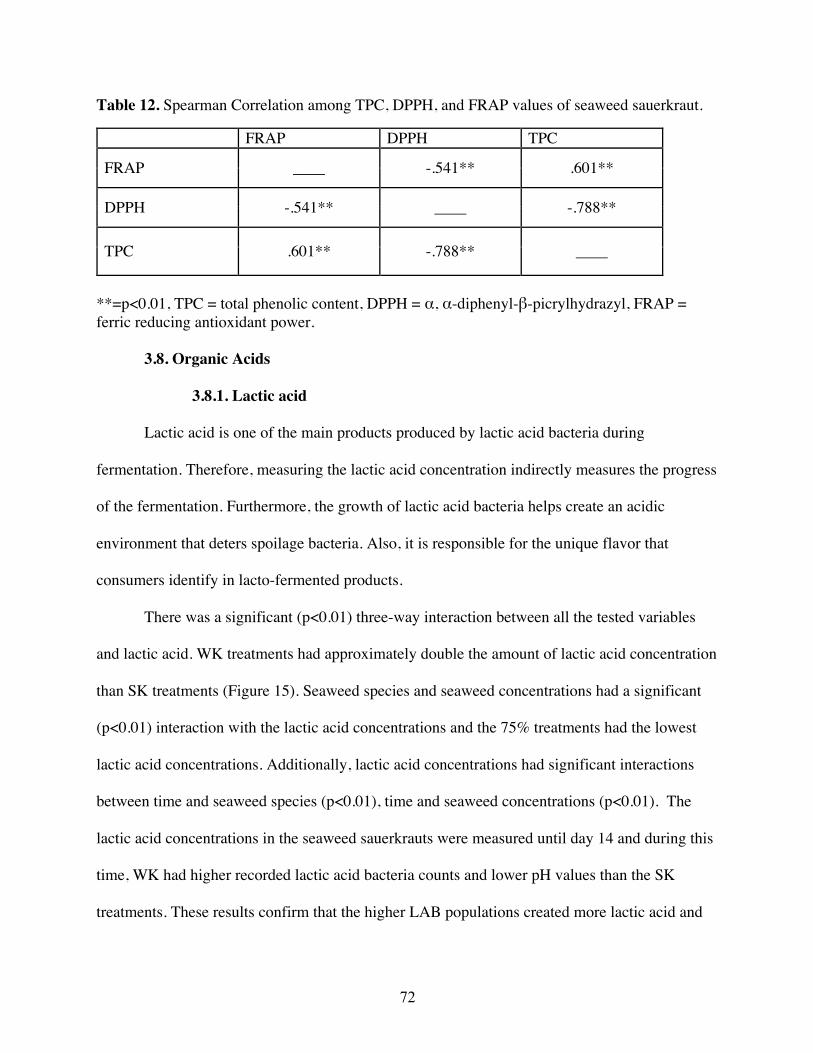
72
Table 12. Spearman Correlation among TPC, DPPH, and FRAP values of seaweed sauerkraut.
FRAP DPPH TPC
FRAP ____ -.541** .601**
DPPH -.541** ____ -.788**
TPC .601** -.788** ____
**=p<0.01, TPC = total phenolic content, DPPH = α, α-diphenyl-β-picrylhydrazyl, FRAP = ferric reducing antioxidant power.
3.8. Organic Acids
3.8.1. Lactic acid
Lactic acid is one of the main products produced by lactic acid bacteria during
fermentation. Therefore, measuring the lactic acid concentration indirectly measures the progress
of the fermentation. Furthermore, the growth of lactic acid bacteria helps create an acidic
environment that deters spoilage bacteria. Also, it is responsible for the unique flavor that
consumers identify in lacto-fermented products.
There was a significant (p<0.01) three-way interaction between all the tested variables
and lactic acid. WK treatments had approximately double the amount of lactic acid concentration
than SK treatments (Figure 15). Seaweed species and seaweed concentrations had a significant
(p<0.01) interaction with the lactic acid concentrations and the 75% treatments had the lowest
lactic acid concentrations. Additionally, lactic acid concentrations had significant interactions
between time and seaweed species (p<0.01), time and seaweed concentrations (p<0.01). The
lactic acid concentrations in the seaweed sauerkrauts were measured until day 14 and during this
time, WK had higher recorded lactic acid bacteria counts and lower pH values than the SK
treatments. These results confirm that the higher LAB populations created more lactic acid and

73
reduced the pH of the sauerkraut. SK took longer to ferment likely explaining the significantly
lower lactic acid concentration.
Figure 15. Mean lactic acid and acetic acid concentrations (g/L) in seaweed sauerkraut by species.
Values are means ± S.E. Values not sharing a letter are significantly different (p<0.01) from each other based on a Multi-Way ANOVA followed by Tukey’s HSD post hoc test (n=9).
Lactic acid concentrations increased continually over time with the highest concentration
found on day 14 (Figure 16). Overall, lactic acid was 40 times higher on day 14 day than on day
0. Lactic acid bacteria counts were highest on day 7 and remained high until day 14, suggesting
that the growth of LAB effected the lactic acid concentrations.
0
1
2
3
4
5
6
7
8
SK WK SK WK
LacticAcid AceticAcid
MeanCo
ncen
tration(g/L)
b
a
a a

74
Figure 16. Mean lactic acid and acetic acid concentrations (g/L) in seaweed sauerkraut over time.
Values are means + S.E (n=18).
The lactic acid concentrations found in this study are comparable to another sauerkraut
study. Trail et al. (1995) tested eight commercial sauerkrauts and found that lactic acid values
ranged from 111-178mM (~10-16g/L) in the fermented products. These lactic acid
concentrations are similar to the seaweed sauerkraut, which had a mean lactic acid concentration
of 13 g/L at the end of the fermentation period.
3.8.2. Acetic acid
Acetic acid was present in low amounts in all treatments. This could be because
Lactobacillus plantarum bacteria are facultative heterofermentors, meaning they can produce
low levels of acetic acid and other products (FAO, 1998), in addition to lactic acid. Also, there
could have been low levels of acetic acid bacteria present in the natural flora. Despite the low
levels, there was a significant (p=0.03) interaction between all the tested variables with regard to
0246810121416
0 1 3 5 7 14
Concen
tration(g/L)
Time(Days)
Lacticacid Aceticacid
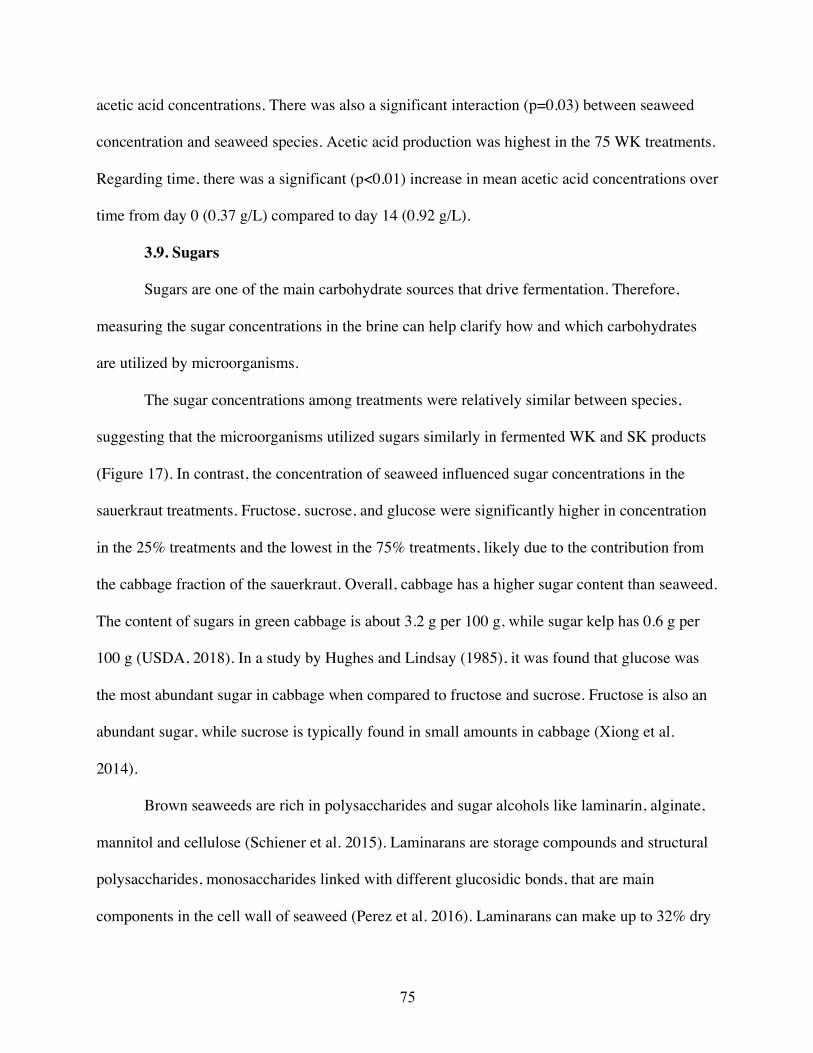
75
acetic acid concentrations. There was also a significant interaction (p=0.03) between seaweed
concentration and seaweed species. Acetic acid production was highest in the 75 WK treatments.
Regarding time, there was a significant (p<0.01) increase in mean acetic acid concentrations over
time from day 0 (0.37 g/L) compared to day 14 (0.92 g/L).
3.9. Sugars
Sugars are one of the main carbohydrate sources that drive fermentation. Therefore,
measuring the sugar concentrations in the brine can help clarify how and which carbohydrates
are utilized by microorganisms.
The sugar concentrations among treatments were relatively similar between species,
suggesting that the microorganisms utilized sugars similarly in fermented WK and SK products
(Figure 17). In contrast, the concentration of seaweed influenced sugar concentrations in the
sauerkraut treatments. Fructose, sucrose, and glucose were significantly higher in concentration
in the 25% treatments and the lowest in the 75% treatments, likely due to the contribution from
the cabbage fraction of the sauerkraut. Overall, cabbage has a higher sugar content than seaweed.
The content of sugars in green cabbage is about 3.2 g per 100 g, while sugar kelp has 0.6 g per
100 g (USDA, 2018). In a study by Hughes and Lindsay (1985), it was found that glucose was
the most abundant sugar in cabbage when compared to fructose and sucrose. Fructose is also an
abundant sugar, while sucrose is typically found in small amounts in cabbage (Xiong et al.
2014).
Brown seaweeds are rich in polysaccharides and sugar alcohols like laminarin, alginate,
mannitol and cellulose (Schiener et al. 2015). Laminarans are storage compounds and structural
polysaccharides, monosaccharides linked with different glucosidic bonds, that are main
components in the cell wall of seaweed (Perez et al. 2016). Laminarans can make up to 32% dry

76
weight (Kraan, 2012) of some brown seaweeds. Alginates are also structural polysaccharides
and are major components of brown seaweed and are made up of mannuronic and guluronic
acids (Perez et al. 2016). Cellulose is a cell wall polysaccharide that is insoluble (Kraan, 2012).
Mannitol is a sugar alcohol found in brown seaweeds and in some species of brown seaweed it
can make up 25% of the dry weight depending on the season (Kraan, 2012). Mannitol is used as
a flavor enhancer and is known for its sweet flavor. These different carbohydrates are
responsible for some of the diverse sugars found in seaweed, including D-galactose, D-mannitol,
L-rhamnose, D-glucuronic acid, and L-fucose (Hwang et al. 2011).
Figure 17. Mean sugar content (g/L) in seaweed sauerkraut by species
Values are means ± S.E. Values not sharing a letter are significantly different from each other based on Multi-Way ANOVA followed by Tukey’s HSD post hoc test (n=9).
Sucrose content was negligible in the seaweed sauerkraut, however, fructose and glucose
content increased over time, with the highest concentrations found on day 7 (Figure 18). The low
sucrose concentration could suggest that sucrose was hydrolyzed, resulting in a slight increase in
0
2
4
6
8
10
12
14
SK WK SK WK SK WK
Sucrose Glucose Fructose
MeanCo
ncen
tration(g/L)
a a
a a
a
a

77
glucose and fructose concentrations throughout the study (Xiong et al. 2014). Fructose levels
increased approximately fourfold by day 7 and there was approximately two times as much
fructose than glucose. Similarly, by day 7 glucose levels increased to 8.35 g/L, approximately 16
times the concentration on day 0 (0.52 g/L). The increase in fructose and glucose concentration
could have been partially due to diffusion of these sugars from the cabbage into the brine.
Overall, these results are comparable to a study by Trail et al. (1995) that tested eight
commercial sauerkrauts and found that glucose ranged from 0-57mM (~0-10g/L), and fructose
ranged from 0-22mM (0-4g/L). The somewhat higher fructose concentrations observed in the
seaweed sauerkraut brine can further be explained by a study by Xiong et al. (2016) that
measured different chemical compositions of sauerkrauts prepared with different salt
concentrations. In that study, fructose concentrations were initially higher in the cabbage than in
the brine. However, over time, the fructose concentration quickly increased in the brine and then
remained steady throughout the fermentation (Xiong et al. 2016). That study suggested that the
increase in fructose concentrations could also indicate that this sugar was not utilized by the
microorganisms.

78
Figure 18. Overall mean of sugar concentration (g/L) in seaweed sauerkraut over time.
Values are means ± S.E. (n=18).
Furthermore, Hwang et al. (2011) conducted a study that compared the fermentation of
the aforementioned seaweed sugars to common sugars found in land plants (D-glucose, D-
xylose, L-arabinose, and D-mannose) by measuring lactic acid yields. They also compared
different lactic acid bacteria strains and their lactic acid yield from different sugars. The authors
reported that seaweed sugars could be fermented, and that different strains of lactic acid bacteria
utilized seaweed sugars differently, resulting in varying lactic acid yields. D-mannitol showed
the highest L-lactic acid yield (>10 g/L) among the seaweed sugars among five different
lactobacillus strains, higher than lactic acid yields from D-glucose and D-galactose. However, D-
glucose and D-galactose also produced high lactic acid yields, meaning that they were readily
consumed by the lactic acid bacteria. Furthermore, this study found that L. plantarum produced
the highest lactic acid yield (≈ 90%), suggesting this would be the best species to ferment the
sugars (Hwang et al. 2011). Therefore, in the current study, the sugars from the seaweed (D-
0
5
10
15
20
25
0 1 3 5 7 14
Concen
tration(g/L)
Time(Days)
Sucrose Glucose Fructose

79
galactose and D-glucuronic acid) could have influenced the sugar concentrations that were found
in the seaweed sauerkraut brine. Evaluating the concentration of specific seaweed sugars and
monitoring their changes during fermentation may provide insight into their potential influence
on fermentation.
3.10. Sensory testing
Sensory evaluation was conducted on four different seaweed sauerkraut formulations to
determine how consumers would react to this product. One hundred panelists participated in this
study: 56% female and 44% male. A majority (71%) of the panelists were in the age range of
18-24 or 25-31. When asked how often they consumed seaweed, 70% indicated that they
consumed seaweed either 1-4 times per year (32%) or 1-2 times per month (38%). Panelists
consumed seaweed more often than sauerkraut, as most panelists consumed sauerkraut less than
once a year (39%) or 1-4 times per year (38%). Over 56% of panelists consumed probiotics at
least once a week and 73% of panelists were aware that fermented foods contained probiotics,
indicating that probiotics were an important part of their diet.
While many attributes were tested, the results of this sensory study indicate that there
were no significant differences among the four different seaweed sauerkraut treatments for all
attributes (Table 13). The lack of significant difference in the sensory attributes among
treatments was surprising because physicochemical analyses revealed significant differences
among treatments. Although sourness was also tested, the data could not be used due to errors in
the computerized testing procedure.

80
Table 13. Mean hedonic scores for four seaweed sauerkraut treatments on a 9-point hedonic scale.
Attribute 25 SK 50 SK 25 WK 50 WK P-Value Color 6.18 ± 1.49 6.15 ± 1.59 6.14 ± 1.31 5.86 ± 1.75 0.4302
Aroma 5.48 ± 1.77 5.40 ± 1.75 5.13 ± 1.79 5.30 ± 1.60 0.5213
Flavor 6.01 ± 1.85 5.81 ± 1.91 5.73 ± 1.88 5.79 ± 1.84 0.7401
Texture 6.73 ± 1.40 6.47 ± 1.51 6.65 ± 1.44 6.60 ± 1.34 0.6291
Overall Liking
5.99± 1.66 5.79 ± 1.80 5.82 ± 1.85 5.85 ± 1.74 0.8627
Values are means + S.D. No significant differences among the means were found based on a Multi-way ANOVA (n=100).
3.10.1. Overall liking Using the 9-point hedonic scale, the average “Overall liking” scores for these products
was 5.86, just under 6.0 which is equivalent to “Like slightly.” The “Overall liking” scores of
consumers who ate seaweed more than once a year averaged 5.95, also equivalent to “Like
slightly.” Those who consumed seaweed less than once a year rated the “Overall liking” of the
sample approximately half a point lower with an average of 5.52, suggesting that overall
acceptability of the seaweed sauerkraut was related to the panelists’ familiarity with seaweed
products.
The overall distribution for “Overall liking” was bell curved, meaning that the data were
normally distributed. A majority of panelists rated the samples at or above a 6, which is the
“Like slightly” category (Figure 19). The 25% SK sample had the highest “Overall liking” score
(5.99 ± 1.66), and 70% of panelists chose “Like slightly” or higher for this sample. The 50% SK
treatment had the lowest “Overall liking” score (5.79 ± 1.80), with 59% of panelists rating the
sample as “Like slightly” or higher.

81
Figure 19. Frequency of “Overall liking” scores for four seaweed sauerkraut treatments.
3.10.2. Flavor Flavor is usually considered one of the most important attributes for product
development. The 25% SK treatment had the highest mean score (6.01 ± 1.85) for flavor.
Panelists commented that this sample had just the right amount of flavor and that it was good.
Additionally, this sample had a nice pickle flavor that helped disguise the ocean flavor. Other
panelists thought that this sample was too sour and didn’t taste like sauerkraut. Some panelists
thought that 50% SK tasted better and had more flavor than the 25% SK. The 25% WK was
described as more bitter, sour, and too seaweedy/smelly. However, the 50% WK was described
as having a pleasant seaweed flavor. Overall, consumers had varying opinions when describing
the flavor of the samples that were both positive and negative, making it difficult to draw
conclusions about flavor attributes.
05
1015202530
25SK 50SK 25WK 50WKDislikeExtremely(1) 1 0 1 0DislikeVeryMuch(2) 3 3 5 2DislikeModerately(3) 4 10 6 9DislikeSlightly(4) 12 16 15 15NeitherLikenorDislike(5) 10 12 9 14LikeSlightly(6) 29 16 24 19LikeModerately(7) 24 24 19 22LikeVeryMuch(8) 13 16 18 15LikeExtremely(9) 4 3 3 4
Num
bero
fPan
elists(#)

82
All sensory attributes tested were significant and positively related (Table 14).
Additionally, “Overall liking” and “flavor” were strongly related (0.89), showing that panelists
who rated the sample higher for overall liking also liked the flavor of the sample. “Overall
liking” and “texture” were also strongly related (0.63), meaning that panelists that liked the
texture also liked the product more, overall. Panelists who rated the flavor higher seemed to like
the aroma more, making these attributes strongly related (0.63).
Table 14. Spearman Correlation table of sensory attribute scores.
Color Aroma Flavor Texture Overall Liking
Color 1 .506** .498** .422** .495** Aroma .506** 1 .628** .419** .649** Flavor .498** .628** 1 .593** .892**
Texture .422** .419** .593** 1 .632** Overall Liking
.495** .649** .892** .632** 1
**=p<0.01
3.10.3. Color
The results from instrumental color analysis indicated the seaweed sauerkrauts were
significantly different in color, with SK samples being more red and yellow, while WK samples
were more green and blue in color. In addition, seaweed samples were detectably different in
color based on observation. The mean hedonic scores for color ranged from 5.86 to 6.18 among
treatments. Panelists noted that they liked the vivid colors of the seaweed and disliked the
bleached color of the cabbage. However, the panelists did not rate the acceptability of color
differently among the samples.

83
3.10.4. Aroma The aroma of seaweed and fermented products is unique. A majority of the panelists’
comments were related to aroma. Despite this, there were no significant differences found among
samples with regard to aroma. However, aroma had the lowest hedonic scores across all
attributes with a mean range of 5.13-5.48 among samples, indicating that panelists had stronger
reactions to this attribute. One reason for this is that panelists had different opinions on what they
liked about the aroma. The 50% WK was described as having the best aroma by some panelists,
while other panelists thought that the smell was too strong and ocean-y. Consumers commented
that the 25% SK and 50% SK smelled nice. The 25% WK was described as having an off-putting
smell that was not as good as the other samples.
3.10.5. Saltiness Seaweed grows in a saline environment and the process of making seaweed sauerkraut
required adding more salt for preservation purposes. Panelists were asked to rate the salt
intensity on a 5-point “Just about Right Scale” from 1 = “not nearly salty enough” to 5 = “much
too salty.” Overall, there were no significant differences in saltiness ratings among treatments.
Consumers rated the amount of salt in the samples as “Just about right,” with mean scores
ranging from 2.92-3.14 among samples and an average mean for all the samples of 3.03 + 0.63.
The mean scores were surprising since a few panelists commented that all the samples, besides
25% SK, were too salty.
3.10.6. Texture Texture is an important sensory property that was positively correlated with overall liking
in the seaweed sauerkrauts. Panelists rated the texture scores highest among all hedonic scores.
Panelists rated the texture similarly for each of the samples with mean scores ranging from 6.47-

84
6.73. This result is interesting because the shear force analysis indicated that there was a
significant difference among seaweed species. SK treatments had lower shear force values,
indicating softer texture. The higher shear force values in WK treatments could be from
structural difference among the species because WK has a firm midrib on its blade. Differences
in texture were also clearly apparent based on observation. While filling the sample cups, the
mushier texture of the SK treatments was evident. Therefore, it was expected that panelists
would rate the samples differently. Panelists described both the SK and WK samples as having a
nice texture and crunch. The 25% SK sample was described as having a good seaweed to
cabbage ratio. However, some panelists mentioned that the 50% SK treatment was slimy.
Figure 20. Frequency of texture scores for four seaweed sauerkrauts treatments.
05
101520253035
25SK 50SK 25WK 50WKDislikeExtremely(1) 0 0 1 0DislikeVeryMuch(2) 0 0 1 1DislikeModerately(3) 2 4 0 0DislikeSlightly(4) 6 10 4 8NeitherLikenorDislike(5) 11 9 14 8LikeSlightly(6) 19 22 21 26LikeModerately(7) 30 28 26 31LikeVeryMuch(8) 24 21 29 21LikeExtremely(9) 8 6 4 5
Num
bero
fPan
elists(#)

85
Almost 80% of panelists rated the texture as “Like slightly” or higher for all the tested
samples (Figure 20). The panelists’ frequency of choosing “Like slightly” or above ranged from
77%-83% among all samples. Overall, the hedonic scores for texture were highest among all
attributes.
The hedonic scores for the seaweed sauerkraut samples could have been improved.
Typically, sauerkraut is made with caraway seeds or other spices. Adding spices could have
resulted in higher flavor scores and helped to mask some of the seaweed aroma that some
panelists did not like. Also, sauerkraut is frequently consumed as a condiment along with
sausages, not by itself. Furthermore, this product is something new that consumers have never
tried before. This could have created a bias against the samples because panelists could have had
preexisting expectations about how the product might, or should, have tasted. Additionally, the
results may have been different if there had been more screening of consumers. Although we
tried to recruit panelists who enjoy consuming seaweed and sauerkraut, if more panelists who
frequently consume seaweed and sauerkraut had tested the product, the acceptability scores may
have been higher.

86
4. OVERALL CONCLUSIONS AND RECOMMENDATIONS
This study is the first report in the scientific literature on lactic acid fermentation of
seaweed to produce seaweed sauerkraut, with a specific focus on Maine seaweed species
incorporated at various levels.
The results indicate that kelps can be fermented successfully and that seaweed species
and incorporation level affect different attributes of the fermented products. Visually, the WK
sauerkraut was slightly darker green and produced more brine. In the SK treatments, seaweed
and cabbage were clumped together and were somewhat slimy to the touch. LAB grew fastest in
WK treatments, with all products reaching the goal pH of less than 4.6 within three days. In
contrast, the SK treatments did not achieve a pH of 4.6 until day 14. Titratable acidity was
significantly correlated with pH values and was also significantly different between species.
Furthermore, all treatments had high (≈106 CFU/g) lactic acid bacteria populations, showing the
potential of this product as a probiotic. The use of the starter cultures, Lactobacillus plantarum
and Leuconostoc mesenteroides, was likely responsible for the successful fermentation of the
seaweed to produce sauerkraut. However, the fermentative success of several different species of
lactic acid bacteria could be studied to result in a quicker fermentation time and increased shear
firmness in the SK treatments, as LAB influenced these variables. Also, the addition of more
than two species of LAB could be useful in improving the fermentation success and texture.
While the inoculation level was based on typical LAB populations found in sauerkraut, it could
have been increased to possibly increase the probiotic benefits of the seaweed sauerkraut.
Furthermore, there are some LAB that are particularly known for their probiotic benefits such as
Lactobacillus acidophilus, that could be further investigated. Typical to most fermentations, the
lactic acid concentration increased over time with the highest concentration found on day 14,

87
while low concentrations of acetic acid were found. As the seaweed concentration in the
sauerkraut treatments increased, sugar concentrations in the brine decreased. Glucose and
fructose were present in higher amounts in the brine compared to sucrose concentrations, which
were negligible throughout the study. Although measurement of lactic acid and sugars was
important for characterizing the extent of fermentation, quantifying additional carbohydrates
may have provided more insight. Seaweeds contain a variety of polysaccharides, and it would be
useful to analyze those carbohydrates and their potential derivatives to better understand how
they are utilized during fermentation.
Pathogens and coliforms were detected in the sauerkraut, despite seaweeds’ reported
antimicrobial activity. The SK treatments had higher levels of coliforms and Vibrio sp. was
detected in the 75% SK treatment, making Vibrio sp. the only pathogen confirmed out of the four
(Vibrio, Salmonella, Staphylococcus aureus, Listeria) that were tested. Despite these results,
contamination by Vibrio may possibly be avoided in the future, as the time and location of
harvest could have effected these results. The presence of Vibrio sp. may have been because the
seaweed was harvested at the end of May, towards the end of the harvesting season. Vibrio is
typically more prominent in the summer/warmer months, although there is a concern that Vibrio
levels might increase in the Gulf of Maine due to the changing climate. Overall, the results
indicate that the main safety concern in the seaweed sauerkraut could be the coliforms and
possibly the presence of E. coli. We recommend that the industry collects seaweed earlier in the
season whenever possible and monitors the water quality of growing/harvesting sites. If seaweed
becomes contaminated with pathogens while making seaweed sauerkraut, fermentation is the
only step to kill the pathogens. This would not be a reliable method of pathogen control since not

88
all pathogens are killed by acidic environments. Additionally, concerns about biogenic amines in
fermented products have arisen and their evaluation may be another aim for future studies.
While physicochemical and microbial differences were found in the different seaweed
sauerkrauts, consumers did not rate the samples differently for acceptability of color, aroma,
overall liking, flavor, saltiness, and texture. The mean scores for overall liking of all the
seaweed sauerkraut samples were just under “Like slightly.” To improve these scores, more
testing could be done on the sauerkraut formulation, which was a very basic recipe. Garlic,
caraway seed, other spices, or other ingredients could be added, which may increase consumer
acceptability of the product. Furthermore, it would have been interesting to ask consumers
whether they typically consumed sauerkraut plain or as a condiment. Additionally, many
panelists who tried the seaweed sauerkraut did not consume sauerkraut frequently. The samples
may have been rated as more acceptable if more frequent sauerkraut consumers had evaluated
the products.
Seaweed sauerkraut could offer important health benefits to consumers, helping to create
a niche market for this product. In addition to probiotic benefits, seaweed sauerkraut is rich in
antioxidants. Although there were no differences in DPPH and TPC of SK vs WK treatments,
increasing the seaweed concentrations improved TPC, FRAP values, and radical scavenging
activity in the sauerkraut. Furthermore, seaweed sauerkraut may offer consumers more nutrients
than dried seaweed. The heat treatment required to dry seaweed can decrease the nutrients in the
products. In contrast, seaweed sauerkraut is produced using a non-thermal preservation process
that could be a lower cost alternative to creating shelf stable products.
In conclusion, the different concentrations of seaweed and species of seaweed influenced
the fermentation success of the product. The WK treatments seemed to be the better fermentative

89
substrate. WK had shear firmness values similar to cabbage and the product was crisp and
crunchy. WK also fermented quicker. In regard to concentrations, the 75% SK treatment was the
least successful of the six treatments, as it took the longest to ferment, had high coliform counts,
and Vibrio was detected. Overall, the 25% and 50% treatments seemed to be the most consistent
throughout the study with each concentration having important strengths. For example, the 25%
treatments fermented more quickly, while 50% treatments mostly had higher antioxidant
capacities.
While the common variables that were tested throughout fermentation and storage
provided important information on the fermentation dynamic, further variables could be tested to
improve quality, safety, or shelf life. Extending the shelf life of the sauerkraut may be useful for
commercial sales. This study lasted 60 days and the product remained stable during this time and
showed no signs of spoilage. These results indicate that the shelf life of fresh seaweed was
extended considerably, as the shelf life of fresh seaweeds is typically less than one week.
The recent rise in consumption of seaweeds, probiotics, and fermented products suggests
that this product could be well received by consumers, and local companies believe there is
market potential for seaweed sauerkraut in Maine. This study evaluated the potential for creating
seaweed sauerkraut and assessed the shelf life and safety of this novel product. The results
obtained offer important information to help the seaweed industry to create value-added products
and diversify markets.

90
REFERENCES Adeghate E, Ponery AS (2002). GABA in the endocrine pancreas cellular localization and function in normal and diabetic rats. Tissue and Cell 34:1-6 Akbar A, Ali I, Anal AK (2016). Industrial perspectives of lactic acid bacteria for biopreservation and food safety. Journal of Animal and Plant Science 26(4):938-948. Akbar A, Anal AK (2014). Occurrence of Staphylococcus aureus and evaluation of anti staphylococcal activity of Lactococcus lactis subsp. lactis in ready-to-eat poultry meat. Annals of Microbiology 64(1):131-138. Algolesko (2018). Our Products. Available from: www.algolesko.com/english-version/our-products/. Accessed 2018 June 24. Andrade P, Barbosa M, Matos RP, Lopes G, Vinholes J, Mouga T, Valnetao P (2013). Valuable compounds in macroalgae extracts. Food Chemistry 138(2-3): 1819-1828. Beganovic J, Pavune A, Gjuracic K, Spoljaree M, Suskovic J, Kos B (2011). Improved sauerkraut production with probiotic strain Lactobacillus Plantarum L4 and Leuconostoc Mesenteroides LMG 7954. Journal of Food Science 76(2):66-85. Benzie IF, Strain JJ (1996). The ferric reducing ability of plasma (FRAP) as a measure of “antioxidant power”: the FRAP assay. Analytical Biochemistry 239:70–6. Blois M (1958) Antioxidant determinations by the use of a stable free radical. Nature 181:1199–1200. Centers for Disease Control and Prevention (CDC) (2015). Drinking Water. Available from: https://www.cdc.gov/healthywater/drinking/private/wells/disease/e_coli.html. Accessed 2018 July 01. Centers for Disease Control and Prevention (CDC) (2017). Vibrio species causing Vibriosis. Available from: https://www.cdc.gov/vibrio/faq.html. Accessed 2018 August 01. Charoensiddhi S, Conlon M, Vuaran M, Franco C, Zhang W (2016). Impact of extraction on prebiotic potential of the brown seaweed Ecklonia radiate by in vitro human gut bacteria fermentation. Journal of Functional Food 24:221-230. Chew YL, Lim YY, Omar M, Khoo KS (2008). Antioxidant activity of three edible seaweeds from two areas in South East Asia. Food Science and Technology 41(6):1067-1072 Cho YH, Shin IS, Hong SM, Kim CH (2015). Production of functional high-protein beverage fermented with lactic acid bacteria isolated from Korean traditional fermented food. Korean Journal of Food Science of Animal Resources 35(2):189-196.

91
Chopin T, Sawhney M (2009). Seaweeds and their mariculture. The Encyclopedia of Ocean Science 4477-4487 Dongmo SN, Sacher B, Kollmannsberger H, Becker T (2017). Key volatile aroma compounds of lactic acid fermented malt based beverages – impact of lactic acid bacteria strains. Food Chemistry 229:565-573. Duangjitcharoen Y, Kantachote D, Ongsakul M, Poosaran N, Chaiyasut C (2009). Potential use of probiotic Lactobacillus plantarum SS2 isolated from a fermented plant beverage: safety assessment and persistence in the murine gastrointestinal tract. World Journal of Microbiology and Biotechnology 25:315-321. Dunne C, O'Mahony L, Murphy L, Thornton G, Morrissey D, O'Halloran S, Feeney M, Flynn S, Fitzgerald G, Daly C, Kiely B, O'Sullivan GC, Shanahan F, Collins JK (2001). In vitro selection criteria for probiotic bacteria of human origin: correlation with in vivo findings. American Journal of Clinical Nutrition 73:386s-392s Fleurence J (1999). Seaweed proteins: biochemical, nutritional aspects and potential uses. Trends in Food Science and Technology 10:25-28. Food and Agriculture Organization (FAO) (1998). Fermented fruits and vegetables: A global perspective-Chapter 5. Available from: http://www.fao.org/docrep/x0560e/x0560e10.htm. Accessed 2017 November 27. Food and Drug Administration (2010). Laboratory Methods - BAM Appendix 2: Most Probable Number from Serial Dilutions. Center for Food Safety and Applied Nutrition. Available from: https://www.fda.gov/Food/FoodScienceResearch/LaboratoryMethods/ucm109656.htm. Accessed 2017 November 23. Food and Drug Administration (2018). Science and Research. Center for Food Safety and Applied Nutrition. Available from: https://www.fda.gov/Food/FoodScienceResearch/default.htmAccessed 2017 November 23. Granato D, Branco GF, Nazzaro F, Cruz A, Faria J (2010). Functional foods and nondairy probiotic food development: trends, concepts, and products. Comprehensive Reviews in Food Science and Food Safety 9(3):292-302 Gupta S, Abu-Ghannam N, Scannell A (2011). Growth and kinetics of Lactobacillus plantarum in the fermentation of edible Irish brown seaweeds. Food and Bioproduct Processing 89(4):346-355. Hardy Diagnostics (2018). Lactose broth - for detection of coliforms and salmonella. Available from: catalog.hardydiagnostics.com/cp_prod/Content/hugo/LactoseBroth.htm. Accessed 2018 July 10.

92
Hayisama-ae W, Kantachote D, Nokkaew U, Chaiyasut C (2014). A potential symbiotic beverage from fermented red seaweed (Gracilaria sheri) using Lactobacillus plantarum DW12. International Food Research Journal 21(5):1789-1796. Holdt SL, Kraan S (2011). Bioactive compounds in seaweed: Functional food applications and legislation. Journal of Applied Phycology 23:543-597. Huang WY, Zhang HC, Liu WX, Li CY (2012) Survey of antioxidant capacity and phenolic composition blueberry, blackberry, and strawberry in Nanjing. Journal of Zhejiang University-Science B 13(2):94-102. Hughes A, Linday RC (1985) Liquid chromatographic analysis of sugars and mannitol in cabbage and fermenting sauerkraut. Journal of Food Science 50(6):1662-1667. Hunaefi D, Akumo D, Smetanska I (2013) Effect of fermentation on antioxidant properties of red cabbages. Food Biotechnology 27(1): 66–85. Hwang, HJ, Lee SY, Kim SM Lee SB (2011) Fermentation of seaweed sugars by Lactobacillus species and the potential of seaweed as a biomass feedstock. Biotechnology and Bioprocess Engineering 16(6):1231-1239. Inova Market Insights (2018). Monitor category and sector activity, explore trends and generate ideas. Innova Market Insights. Available from: www.innovadatabase.com/. Accessed 2018 July 10. Jeong EJ, Moon DW, Oh JS, Moon JS, Seong H, Kim KY, Han NS (2017). Development of cabbage juice medium for industrial production of Leuconostoc Mesenteroides starter. Journal of Microbiology and Biotechnology 27(12): 2112–2118. Johanningsmeier S, McFeeters RF, Fleming HP, Thompson RL (2007). Effects of Leuconostoc Mesenteroides starter culture on fermentation of cabbage with reduced salt concentrations. Journal of Food Science 72(5):166-72. Kausalya M, Narasimha Rao G (2015). Antimicrobial activity of marine algae. Journal of Algal Biomass Utilization 6(1):78-87. Kimmons JE, Brown KH, Lartey A, Collison E, Mensah PPA, Dewey KG (1999). The effects of fermentation and/or vacuum flask storage on the presence of coliforms in complimentary foods prepared for Ghanaian children. International Journal of Food Sciences and Nutrition 50(3):195-201. Kraan S (2012). Algal polysaccharides, novel applications and outlook. Carbohydrates—Comprehensive Studies on Glycobiology and Glycotechnology; InTech: Rijeka, Croatia. Laerd Statistics (2018). One-Way ANOVA in SPSS Statistics. laerd.com/spss-tutorials/one-way-anova-using-spss-statistics.php. Accessed 2018 July 1.

93
Luckow T, Delahunty C (2004). Which juice is healthier? A consumer study of probiotic nondairy juice drinks. Food Quality and Preference 15:751-759. Maine Coast Sea Vegetables (2016). The harvest: Maine coast sea vegetables, sustainably harvested and certified organic. Available from: https://www.seaveg.com/shop. Accessed 2016 27 November. Maine Seaweed Council (2016). Available from: http://www.seaweedcouncil.org/about-the-council/. Accessed 2016 27 November. Makkar H, Tran G, Heuze V, Giger-Reverdin S, Lessire M, Lebas F, Ankers P (2016). Seaweeds for livestock diets: A review. Animal Feed Science and Technology 212:1-17. Marcel AT, Meyer AS (2013). Fucoidans from brown seaweeds: an update on structures, extraction techniques and use of enzymes as tools for structural elucidation. Royal Society of Chemistry 3:8131-8141. Matanjun P, Mohamed S, Mustapha NM, Muhammad K. (2009). Nutrient content of tropical edible seaweeds, Eucheuma cottonii, Caulerpa lentillifera and Sargassum polycystum. Journal of Applied Phycology 21:75–80. Matanjun P, Mohamed S, Mustapha NM, Muhammad K, Ming C (2008). Antioxidant activities and phenolics content of eight species of seaweeds from north Borneo. Journal of Applied Phycology 20:367-373. McFeeters RF (2004). Fermentation microorganisms and flavor changes in fermented food. Journal of Food Science 69:35–37. McKirdy E. Dulse: The guilt-free superfood that tastes like bacon. CNN, Cable News Network. Available from: https://archive.fo/S2Zks. 19 July 2015. Meilgaard C, Civille G, Carr BT (2016). Sensory Evaluation Techniques. CRC Press, Taylor & Francis Group. Molin G (2001). Probiotics in foods not containing milk or milk constituents, with special reference to Lactobacillus plantarum 299v. Animal Journal of Clinical Nutrition 73(Suppl.):380–385. Mouritsen OG, Dawczynski C, Duelund L, Jahreis G, Vetter W, Schröder M (2013a). On the human consumption of the red seaweed dulse (Palmaria palmata (L.) Weber & Mohr). Journal of Applied Phycology 25:1777–1791. Mouritsen OG, Mouritsen JD, Jonhansen M (2013b). Seaweeds: Edible, available, and sustainable. Chicago: University of Chicago Press.

94
Nayyar D (2016). Refrigerated shelf life evaluation and effects of minimal processing on antioxidant capacity of fresh sea vegetables from New England, M.S. thesis, University of Maine, Orono, ME. NBC News (2015). Bringing in the green: Seaweed emerges as new cash crop in Maine. Available from: http://www.nbcnews.com/business/business-news/bringing-greenseaweed-emerges new-cash-crop-maine-n473096. Accessed on 2016 October 15. Norwegian Seaweeds (2018). Norwegian seaweeds network - Alaria Esculenta. http://seaweeds.uib.no/?art=136. Accessed 2018 June 22. Olejnik A, Lewandowska M, Obarska M, Grajek W (2005). Tolerance of Lactobacillus and Bifidobacterium to low pH, bile salts and digestive enzyme. Electronic Journal of Polish Agricultural Universities 8(1):1-5. O’Sullivan AM, Callaghan YC, O’Grady MN, Queguineur B, Hanniffy D, Kerry JP, O’Brien NM (2011). In vitro and cellular antioxidant activities of seaweed extractions prepared from five brown seaweeds harvested in spring from the west coast of Ireland. Food Chemistry 126(3):1064-1070. Panda SH, Panda S, Sivakumar S, and Ramesh R (2009). Anthocyanin rich sweet potato lacto-pickle: production, nutritional and proximate composition. International Journal of Food Science and Technology 44: 445–455.
Paramithiotis S (2017). Lactic acid fermentation of fruits and vegetables. CRC Press. Boca Raton, FL.
Perez M, Jose M, Falque E, Herminia D (2016). Antimicrobial action of compounds from marine seaweed. Marine Drugs 14(3).
Prachyakij P, Schnurer, J, Charernjiratrakul W, Kantachote (2008). Selection and identification of lactic acid bacteria that inhibit yeast contaminants isolated from fermented plant beverages. Songklanakarin Journal of Science and Technology (Suppl. 2): 211-218.
Rajauria G, Jaiswal AK, Abu-Ghannam N, Gupta S (2010). Effect of hydrothermal processing on colour, antioxidant and free radical scavenging capacities of edible Irish brown seaweeds. International Journal of Food Science and Technology 45:2485–2493.
Ramesh V, Kumar R, Singh RRB, Kaushik JK, Mann B (2012). Comparative evaluation of selected strains of lactobacilli for the development of antioxidant activity in milk. Dairy Science and Technology 92:179–188.
Ratanburee A, Kantachote D, Charernjiratrakul W, Penjamras P, Chaiyasut C (2011). Enhancement of γ-aminobutyric acid in a fermented red seaweed beverage by starter culture Lactobacillus plantarum DW12. Electronic Journal of Biotechnology 14(3):1-14.

95
Roohinejad S, Koubaa M, Barba F, Saljjoughian, Amid M, Greiner R (2017). Application of seaweeds to develop new food products with enhanced shelf-life, quality and health related beneficial properties. Food Research International 99:1066–1083
Sandbakken I, Saether M, Funderud J, Aasen I (2018). Acid preservation of Saccharina latissima for application as a carbon source for fermentation to biofuels and chemicals. Journal of Applied Phycology 1-8. Schiener P, Black K, Stanley M, Green D (2015). The seasonal variation in the chemical composistion of the kelp species Laminaria digitata, Laminaria hyperboren, Saccharina latissima and Alaria esculenta. Journal of Applied Phycology 27(1):363-373. Siragusa S, Angelis M, Cagno DR, Rizello CG, Coda R, Gobbetti M (2007). Synthesis of y aminobutyric acid by lactic acid bacteria isolated from a variety of Italian cheeses. Applied and Environmental Microbiology 73:7283-7290. Sliburyte L, Skeryte I (2014). What we know about consumers’ color perception. Procedia Social and Behavorial Sciences 156:468-472. Smit A (2004). Medicinal and pharmaceutical uses of seaweed natural products: A review. Journal of Applied Phycology 16:245-262. Trail AC, Fleming HP, Young CT, McFeeters RF (1995). Chemical and sensory characterization of commercial sauerkraut. Journal of Food Quality 27695-7624. UC Davis (2018). Titratable acidity procedure. UC Davis-Fruit and vegetable. Available from: www.fruitandvegetable.ucdavis.edu/files/28698.pdf. Accessed 2018 June 20. Uchida M, Miyoshi T (2013). Algal Fermentation—The seed for a new fermentation industry of foods and related products. Japan Agricultural Research Quarterly 47(1):53-63. Uchida M, Murata M, Ishikawa F (2007) Lactic acid bacteria effective for regulating the growth of contaminant bacteria during the fermentation of Unidaria pinnatifida (Phaeophyta). Japanese Society of Fisheries Science 73: 694-704. United States Department of Agriculture (USDA) (2018). Food composition database-United States Department of Agriculture. https://ndb.nal.usda.gov/ndb/search/list?qlookup=11445. Accessed 2018 25 June. Wu Jian, Yuan YX, Zhang XW, Zhao J, Song X, Li Y, Li X, Sun R, Koornneef M, Mark GM, Wang XW (2008). Mapping QTLs for mineral accumulation and shoot dry biomass under different Zn nutritional conditions in Chinese cabbage (Brassica rapa L. ssp. Perkinensis). Plant and Soil 310(1-2):25-40. Xiong T, Guan Q, Song S, Hao M, Xie M (2012). Dynamic changes of lactic acid bacteria flora during Chinese sauerkraut fermentation. Food Control 25(1):178-181.

96
Xiong T, Xiao Li, Guan Q, Peng F, Xie M (2014). Starter culture fermentation of Chinese sauerkraut: Growth, acidification and metabolic analyses. Food Control 41:122-127. Xiong T, Li J, Liang F, Wang Y, Guan Q, Xie M (2016). Effects of salt concentration on Chinese sauerkraut frermentation. LWT Food Science and Technology 69:169-174.

97
APPENDICES Appendix A: Recruitment Notice
SEAWEED SAUERKRAUT TASTING
Are you interested in trying seaweed sauerkraut?
If you are at least 18 years old and like eating sauerkraut, please help evaluate seaweed sauerkraut as part of MS thesis research at the University of Maine. Testing will take about 15 minutes to complete. Participants will be provided with 3 dollars cash for tasting the seaweed sauerkraut and completing a survey. Testing will be held on: March 27, 2018. Testing will take place between the hours 11:00am-3:00pm at the Sensory Evaluation Center located in Hitchner hall (Room 158A and 158B). Please e-mail [email protected] for more information. If you do not like eating sauerkraut or seaweed, or have an allergy to seafood, we ask that you please do not participate.

98
Appendix B: Seaweed Sauerkraut Informed Consent Dear Seaweed Sauerkraut Consumer, You are invited to take part in a Master’s thesis project titled “Development and Evaluation of a Novel Fermented Sea Vegetable Product Using Commercially-important Maine Sea Vegetables” by Sarah Brochu and Denise Skonberg, in the School of Food and Agriculture at the University of Maine. The purpose of this research is to learn about consumer acceptability of seaweed sauerkraut. You must be at least 18 years of age to take part in this survey. Please do not participate if you do not like sauerkraut or seaweed or if you are allergic to seafood What Will You Be Asked to Do? If you decide to take part in this survey, you will be asked to answer a few questions about yourself. Then, you will be served four seaweed sauerkraut samples. It may take up to 15 minutes to answer all questions. Risks: The risks of this study are minimal, just the loss of your time and inconvenience. Risks are no greater than those associated with typical eating. Benefits: You may enjoy eating the different seaweed sauerkraut samples. The overall potential benefit of the research is the development of seaweed products with health benefits for consumers. Compensation: Upon completion of today’s test, you will receive 3 dollars for your completion of the survey. No compensation will be provided if you decide not to complete the test. Confidentiality: Your name will not be on any files that contain your answers to our questions. Data will be kept in the Sensory Evaluation Center’s locked office. All data will be destroyed by June 2019 or after the research is published, whichever comes first. Voluntary Participation is voluntary. If you choose to take part in this study, you may stop at any time, however compensation may not be granted. You may skip any questions you do not wish to answer. Contact Information If you have any questions about this study, please contact Sarah Brochu at (802) 917-3028 or [email protected] for more information. You may also reach the faculty advisor of this study at [email protected]. If you have any questions about your rights as a research participant, please contact Gayle Jones, Assistant to the University of Maine’s Protection of Human Subjects Review Board, at 581-1498 (or e-mail [email protected]. edu).

99
Appendix C: Seaweed Sauerkraut Questionnaire Thank you for taking the time to participate in our research. Please indicate your gender: o Male o Female o Would prefer not to say Please indicate your age range: o 18-24 o 25-31 o 32-38 o 39-45 o 46-52 o 53-59 o 60+ About how often do you consume sauerkraut? o Less than once per year o 1-4 times per year o 1-2 times per month o 1-2 times per week o 3+ times per week About how often do you consume seaweed? o Less than once per year o 1-4 times per year o 1-2 times per month o 1-2 times per week o 3+ times per week About how often do you eat foods containing probiotics? Probiotics are live bacteria that provide health benefits when consumed. o Less than once per year o 1-4 times per year o 1-2 times per month o 1-2 times per week o 3+ times per week Did you know that fermented foods, such as sauerkraut, contain probiotics that are associated with disease prevention and improved digestion? o Yes o No
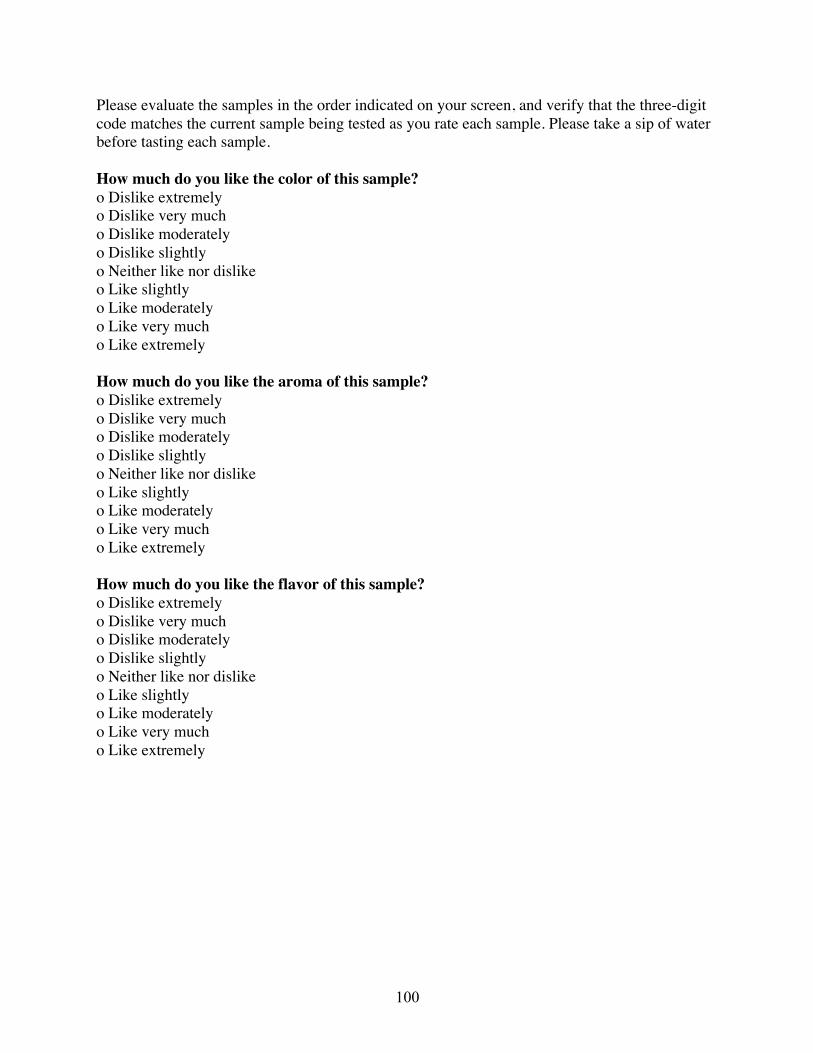
100
Please evaluate the samples in the order indicated on your screen, and verify that the three-digit code matches the current sample being tested as you rate each sample. Please take a sip of water before tasting each sample. How much do you like the color of this sample? o Dislike extremely o Dislike very much o Dislike moderately o Dislike slightly o Neither like nor dislike o Like slightly o Like moderately o Like very much o Like extremely How much do you like the aroma of this sample? o Dislike extremely o Dislike very much o Dislike moderately o Dislike slightly o Neither like nor dislike o Like slightly o Like moderately o Like very much o Like extremely How much do you like the flavor of this sample? o Dislike extremely o Dislike very much o Dislike moderately o Dislike slightly o Neither like nor dislike o Like slightly o Like moderately o Like very much o Like extremely

101
How much do you like the texture of this sample? o Dislike extremely o Dislike very much o Dislike moderately o Dislike slightly o Neither like nor dislike o Like slightly o Like moderately o Like very much o Like extremely Please rate the intensity of saltiness o Not nearly salty enough o Not salty enough o Just about right o Too salty o Much too salty Please rate the intensity of sourness: o Not nearly sour enough o Not sour enough o Just about right o Too sour o Much too sour How much do you like this sample overall? o Dislike extremely o Dislike very much o Dislike moderately o Dislike slightly o Neither like nor dislike o Like slightly o Like moderately o Like very much o Like extremely Is there anything else you would like to tell us about this sample? If you refer to other samples in this test, please use the sample’s three-digit code. Thank you very much for your time and opinions. Please raise the window slightly to let the staff know that you are done, and do not forget to pick up your incentive.

102
BIOGRAPHY OF THE AUTHOR
Sarah Brochu was born in Hardwick, Vermont on October 3, 1993. She was raised in
Hardwick, Vermont and graduated Hazen Union High School in 2012. She attended Maine
Maritime Academy and graduated in 2016 with a Bachelor’s degree in Marine Biology and a
minor in International Business and Logistics. She entered the Food Science and Human
Nutrition graduate program at the University of Maine in 2016. After receiving her degree, Sarah
will start working in industry in August as a Quality Assurance Manager at Hancock Gourmet
Lobster company. Sarah is a candidate for the Master of Science degree in Food Science and
Human Nutrition from the University of Maine in August 2018.


![Milk, Fermentation, And Fermented and Non-fermented [Compatibility Mode]](https://img.pdfslide.net/doc/110x75/55cf85df550346484b923a09/milk-fermentation-and-fermented-and-non-fermented-compatibility-mode.jpg)