Embed Size (px)
Citation preview

University of Southern Denmark
Development and Test of an Additive Manufacturing Maturity Model
Blichfeldt, Henrik; Knudsen, Mette Præst; Hannibal, Martin
Publication date:2019
Document version:Accepted manuscript
Citation for pulished version (APA):Blichfeldt, H., Knudsen, M. P., & Hannibal, M. (2019). Development and Test of an Additive ManufacturingMaturity Model. Paper presented at R&D Management Conference, Paris, France.
Go to publication entry in University of Southern Denmark's Research Portal
Terms of useThis work is brought to you by the University of Southern Denmark.Unless otherwise specified it has been shared according to the terms for self-archiving.If no other license is stated, these terms apply:
• You may download this work for personal use only. • You may not further distribute the material or use it for any profit-making activity or commercial gain • You may freely distribute the URL identifying this open access versionIf you believe that this document breaches copyright please contact us providing details and we will investigate your claim.Please direct all enquiries to [email protected]
Download date: 04. Oct. 2021
1
Development and Test of an Additive Manufacturing Maturity Model
Henrik Blichfeldti
Mette Præst Knudsenii Martin Hannibaliii
Paper prepared for the R&D Management Conference 2019
Paris, France. June 17th–21st 2019
The innovation challenge: Bridging research, industry & society
Track: R&D Management
Abstract
Firms are confronted with rising competitive pressure on both the manufacturing and innovation processes to meet the ever-increasing demand for customization and individualization. Despite this, only sparse research has combined literature from operations management and innovation management literature to investigate the interaction between them. This paper develops an Additive Manufacturing Maturity Model to investigate the diffusion of AM technology and the possible positive impact of adopting AM technology on the innovative capabilities of the firm. Based on a survey in Danish manufacturing firms, this paper presents a novel perspective on the role of additive manufacturing (AM) technologies in facilitating the integration of production, innovation, and market perspectives in the business processes of firms. The results demonstrate that around 25% of the firms use AM technology. Furthermore, the results demonstrate a positive impact of the level of maturity on AM use and innovation. The paper shows that the used potential of AM technology is an indicator of potential competitive advantage for a firm. Derived from the findings, the paper proposes a theoretical model that integrates the scope of AM applications with the business processes of the firm. In this way, the paper contributes to the literature in technology management and to the relationship between the AM technologies and their associated competitive potentials. Furthermore, this paper specifically contributes to the much needed, but still scarce and fragmented literature, on decision models of AM, through an integrative perspective from innovation and operation management literature. Keywords: Additive Manufacturing, 3D print, technology management, innovation, maturity model, manufacturing.
ii University of Southern Denmark, SDU Engineering Operations Management, [email protected]. ii University of Southern Denmark, Center for Integrative Innovation Management, [email protected] iii University of Southern Denmark, International Business and Entrepreneurship, [email protected]

2
1. Introduction
Globalization is pushing the boundaries of firms and force them to focus on finding ways to address
the growing competitive pressure arising from increased demand for customization and
individualization (Hu, 2013; Tseng & Piller, 2003). Firms and policy makers in developed countries
are concerned with maintaining manufacturing in the home country, while focusing on increasing the
innovative capabilities to push new solutions to the market (Gunday, Ulusoy, Kilic, & Alpkan, 2011).
The companies experience a pressure to reduce cost and increase productivity while meeting an
increased demand for improved quality and product innovation. These pressures puts the
manufacturing flexibility and speed at the front of the strategic agenda together with the demand for
innovative competencies (Brettel, Klein, & Friederichsen, 2016; Colotla et al., 2016).
While research has already focused on these potential solutions – flexibility, speed, and innovative
competencies – these have largely been addressed within their respective domains, manufacturing
and innovation management (Chatha & Butt, 2015). This article argues that a yet unexplored potential
can be found in the intersection between manufacturing studies and innovation management. Hence,
this article connects the prevailing models of the two fields to investigate the linkages and potential
synergies between innovation and manufacturing. Specifically, we do this by investigating the
utilization of innovative technologies that are relevant for promoting competitiveness in both domains
(Figure 1).
Figure 1: Research focus
3D printing technology is one such technology. Since the introduction in the 1980s, 3D printing
technologies have mainly been used for rapid prototyping (RPT) as part of the innovation process

3
(Oettmeier & Hofmann, 2016). The technology is well-known and mature, nevertheless, additive
manufacturing technology is fast developing to become a key enabling technology of this century
(Lipson & Kurman, 2013). Although often used interchangeably, additive manufacturing (AM)
utilize 3D printing technology. It is broadly accepted that AM has the potential to support the
companies’ need for building capabilities for innovation, manufacturing, and business activities to
improve their competitiveness (Baumers, Dickens, Tuck, & Hague, 2016; Berger, 2017; D'Aveni,
2013; Gambell et al., 2017; Küpper et al., 2017; Wohlers, 2015).
With the positive prospects on the utilization of 3D print for the company needs, it would be obvious
to assume that wide-spread adoption of the technology in industry can be observed. Some observe a
significant increase in interest in industrial printers and related print services (Wohlers, 2019).
CECIMO, a European AM association, state in their 2018 report that they see a development from
the earlier focus on rapid prototyping towards more industrial purposes (CECIMO, 2018). There are
however no studies, neither on European nor at national level (in Denmark) that document the rate of
adoption of the technology in industry. Several causes to a relatively low utilization of the technology
may be considered; lack of knowledge about the potential of the technology (what it can do for the
company?), lack of competence in using the technology across domains (how may it be used by the
company?), lack of managerial attention and willingness to invest in a technology that may be
considered merely a technology-substitution (how is this bringing something new to the company?).
In any case, we need to understand whether companies are in fact using these to their full potential –
and what the possible benefits can be – seen in an integrative perspective.
Following these introductory remarks, the research aim of this article unfolds in two:
First, we aim to develop a theoretical model for AM maturity, which integrates innovation and
operations management.
Second, we aim to investigate the maturity of Danish manufacturing firms and the effect of AM use
on their competitiveness factors.
This article contributes to both the literature on strategic innovation management and manufacturing
systems by developing an AM-maturity model for assessing a firm’s maturity in use of AM
technologies across multiple domains (innovation, tooling, and production). The model is based on
theoretical arguments drawing from the competence-based literature and integrates the perspectives

4
to assess the effect of AM-maturity on innovation and manufacturing performance. The results
demonstrate the expected positive effects of higher maturity on these performance measures.
2. From 3D printing to Additive Manufacturing – A Theoretical Underpinning
The three-dimensional print technology (3D print) has been under development for more than two
decades (Kruth, Leu, & Nakagawa, 1998; Levy, Schindel, & Kruth, 2003) and has previously been
used primarily for rapid prototyping and hence as support in the innovation process. Recently,
however, this perspective on 3D print has been considered too narrow as reflected in the possible
scope of applications of the underlying technology. The proposed terminology is now to talk of
Additive Manufacturing, which also emphasizes that products are built on a layer-by layer basis,
through a series of cross-sectional slices (Berman, 2012; Gibson, Rosen, & Stucker, 2015: 1). Both
Additive Manufacturing (AM) and 3D printing adhere to the definition by ASTM as: a process of
joining materials to make objects from 3D model data usually layer upon layer, as opposed to
subtractive manufacturing methodologies (ASTM International, 2012; Mellor, Hao, & Zhang, 2014).
Rapid prototyping (RPT) utilize the 3D print technology to speed up and value-add the design and
development phase (Niaki & Nonino, 2017b), whereas additive manufacturing has its focus on the
manufacturing of parts or products (Gibson et al., 2015). Different technologies and materials are
advantageous depending on how it is utilized. In addition, the use and implementation of various AM
technologies (FDM, SLA, SLS or Metal Binder Jetting) or choice of materials (plastics, composites,
metal) have significantly different demand for knowledge- and technology capabilities as well as
financing.
Based on this conception, it can be argued that 3D print is a technology, which can be characterized
as a capital good (e.g., machines, tools, structures, etc.) serving a particular purpose – in this case, the
printing of goods based on a digital drawing and using a layer-by-layer principle. The underlying
understanding of the technology follows Bekar et al. (2018: 1007), who formulates that a technology
refers to (i) the process of applying knowledge to practical uses; (ii) specific machines or processes
themselves; and, (iii) the knowledge of how to make things of economic value. The main point of
importance is that the technical knowledge is embodied in the capital good, which serves a specific
use case. The above widening of the scope from using 3D printing for rapid prototyping to additive
manufacturing reflects the potential and emerging multi-purpose use of the technology. 3D print may

5
accordingly not only be used for prototyping, but potentially also for other applications like
production or production support purposes (Berman, 2012).
The widening of the use of the technology across a company can more precisely be pointed at three
different domains. First, 3D printers have been used in Rapid Prototyping (RPT) to support the R&D
and innovative processes. Second, printing technologies can be applied to print tools for
manufacturing to support a more customized and flexible operations setup (Conner et al., 2014), and
third, additive manufacturing can be used to manufacture components or products as finished items
(Niaki & Nonino, 2017b). However, our understanding of the potential synergetic effects of multi-
purpose use in companies are yet to be explored and understood.
3. Literature Review
Through an extended literature review of more than 1.100 articles, we identified 170 relevant articles
from Web of Science, Scopus and other sources, which deal with aspects of additive manufacturing
beyond the actual development of the print technology. That is, we focus entirely on the adoption of
the technology within an industrial context. Much literature has focused on the potential of using 3D
print for prototyping and hence innovation purposes (Candi & Beltagui, in press; Rayna & Striukova,
2016). The dominating research areas as inspired by Niaki and Nonino (2017a) within the field of
Additive Manufacturing are; AM technology selection (Kengpol & O’Brien, 2001; Lan, Ding, &
Hong, 2005), supply chain management (Durach, Kurpjuweit, & Wagner, 2017; Oettmeier &
Hofmann, 2016), product design and production cost models (Mellor et al., 2014), manufacturing
system frameworks (Achillas, Aidonis, Iakovou, Thymianidis, & Tzetzis, 2015), environmental
aspects assessment (Ullah, Hashimoto, Kubo, & Tamaki., 2013), strategic challenges (Kruth et al.,
1998), open-source innovation and business and social impacts (Sanchez, Boudaoud, Muller, &
Camargo, 2014), and economics of AM (Weller, Kleer, Piller, & Hinke, 2014).
The application domains (innovation, tooling manufacturing and product/component manufacturing)
of Additive Manufacturing are most often analyzed independently of each other, although a few
examples of contributions that integrate across the different domains can be found. The term “bridge
manufacturing” has been introduced where AM is seen as a bridging technology between prototype
field test and small versus medium volume production (Berman, 2012). Companies will furthermore
have a potential for building competitiveness through integration between design and manufacturing,
requiring vertical integration in the values chain (Petrick & Simpson, 2015). Parts and product

6
manufacturing and manufacturing support (moulds for low volume) has been compared in the context
of the production portfolio (Achillas et al., 2015). Finally, the adoption of Additive Manufacturing in
both manufacturing and supply chain contexts based on the adoption terminology by Rogers (2003)
has been proposed (Schniederjans, 2017).
The literature review has shown a lack of an integrative perspective, where the relationships between
the application domains (innovation, manufacturing of tools and prats/products) and the adoption of
the technology can be investigated. A few contributions on adoption of AM and the bridge between
application domains are found, but the connection between technology maturity and the application
domains is still not researched. This gap will be investigated by development and test of the Additive
Manufacturing Maturity Model.
4. An Additive Manufacturing Maturity Model (AM-MM)
As has been made clear from the review of the literature, additive manufacturing is a multi-purpose
technology, but the potential from integrating uses across different domains has yet to be identified
and analyzed (Bellgran & Säfsten, 2012; Pour, Zanardini, Bacchetti, & Zanoni, 2015). An integrated
perspective would allow us to better understand the relationships between different applications of
AM technologies, and the AM maturity of the manufacturing companies. In reviewing the AM
literature, only a few theoretical frameworks emerge (Achillas et al., 2015; Conner et al., 2014; Pour
et al., 2015), and each of these deal with different elements and perspectives on AM.
The aim of a maturity model is to show the differences between immature and mature companies
with respect to e.g. the adoption of a certain technology – here AM technology. In an immature
company, the AM technology has not yet been adopted, and the company may in general also have a
very low knowledge about the technology including how it may be used in the processes of the
company. A characteristic of a maturity model is that it should distinguish between those companies
that have no knowledge and no use of the technology and those companies that have a mature or
advanced use and high technical capability in understanding the technology, its potential for
application across domains, and for being integrated fully into the processes of the firm.
In this article, we argue that an AM maturity model (AM-MM) should include the application
domains (innovation/prototyping; production support; production) and the knowledge and
competence of a firm of the technology. The least mature companies have no current use of the

7
technology and no real knowledge of the technology, whereas the most mature companies will have
applied the technology in all 3 domains and have rather advanced knowledge of the technology.
Application Domains
Innovation has been both argued and demonstrated to be a key competitive priority of firms. A body
of literature has demonstrated positive effects of innovation on economic performance (Camisón &
Villar-López, 2014; Junge, Severgnini, & Sørensen, 2016) despite many firms struggling to
successfully commercialize their technology (Simula, Valiauga, & Lehtimäki, 2014) and fail in
innovation (Panne, Beers, & Kleinknecht, 2003; Tranekjer, 2017).
To develop better products that better suit customer needs, rapid prototyping can deliver a fast
representation of different product forms and functions, which clients can test and provide feedback
to during the development process (Gibson et al., 2015: 1). In the innovation process, which may be
represented as unfolding in several stages from the early idea to concept development and on to
prototyping and validation (Frederiksen & Knudsen, 2017: figure 1), 3D printers as well as other
technologies like simulation tools may be utilized for testing and validating the innovative concept.
An additional benefit from adopting e.g. 3D print for innovation purposes was forcefully put forward
by Damanpour and Gopalakrishnan (2001), who argued that a firm’s competitiveness over time
depends on its ability to adopt new technologies i.e. a firm’s ability for process innovation, and to
develop product innovation. The adoption of 3D print (or other technologies) for the purpose of
supporting the business processes of the firm follow the definition of a process innovation as; new
elements introduced into an organization’s production or service operations (e.g., input materials,
task specifications, work and information flow mechanisms, and equipment) to produce a product or
render a service (Damanpour & Gopalakrishnan, 2001: 48), which follow from the original work of
Utterback and Abernathy (1975). Hence, besides the direct benefits of employing the 3D print
technology for testing and validating the innovative solution, the literature also argues synergies
between process and product innovation (see e.g. Gunday et al., 2011).
A manufacturing system is a sequence of operations, equipment, machines, people and procedures,
that can carry out operations (Groover, 2016). The manufacturing system aim to fulfill the customer
demand, based on input from market (customization), product innovations (R&D) and process

8
innovations (technology adoption) (Rothwell, 1994). A manufacturing system can be conceptualized
as a system in which the product is transformed from design to a market ready product through a
value creating process. The manufacturing system (MS) can deliver several competitive priorities,
often described as quality, delivery, cost (Ward, McCreery, Ritzman, & Sharma, 1998), flexibility,
performance, and innovativeness (Miltenburg, 2008). To deliver on these customer specified
priorities, the manufacturing system can be further divided into production systems (PS), parts
production systems (PPS), and assembly systems (AS) (Bellgran & Säfsten, 2012). There are multiple
ways of combining the production system components into a flexible setup resulting in new product
introduction, re-design and re-engineering of products. The most common manufacturing paradigm
builds on Design for Manufacturing (DFx) that focus on the design process to complete products
ready for manufacturing (Chu et al., 2016). The DFx approach is challenged by the increased demand
for adoption and adaptation to innovation. By introducing Manufacturing for Design (MFD), the
manufacturing paradigm becomes more agile towards design and complexity and can be realized
through hybrid manufacturing utilizing flexible production systems including additive manufacturing
(Chu et al., 2016).
The capabilities of both manufacturing and production systems are directly linked to innovation
through the manufacturing levers as human resources, process technologies and organizational
structures (Miltenburg, 2008).
Figure 2: The manufacturing system

9
Figure 2 illustrates the integration between R&D, the manufacturing system and market access
(Distribution to market). The underlying production systems enable flexibility, product performance,
and innovativeness (ability to introduce innovation to the system). The level of customization
capability depends on the level of human resources, process technologies and organizational
structures. It is our view that additive manufacturing technology has the potential impact to fulfill
MFD as it operates in different domains.
AM maturity level
A literature review specifically oriented towards maturity and readiness level for Additive
Manufacturing did not result in any contributions. A few maturity or readiness models were identified
but these relate either to product technology or manufacturing technology (Peters, 2015). These
models measure readiness on a scale, which is based on the fundamental technology readiness scaleiv.
Although, these models provide a framework for assessing the current maturity of either a single
product technology or manufacturing technology, they fail to include the maturity or the technology
capability of e.g. the manufacturing setup or other technology-based systems.
As there are no established maturity or readiness indexes available, inspiration has been found in
Moore’s “Chasm model” from 1991 (Moore, 1991), which provides a company categorization in
relation to adoption of new technology. Others have also applied the model to technology studies (see
e.g. Schniederjans, 2017; Sroufe, Curkovic, Montabon, & Melnyk, 2000).
The model
This article proposes that AM maturity is an important factor for understanding how well the firm is
equipped to strategically unleash the potential for competitive strength. We argue that maturity can
be seen as a combination of basic knowledge about the technology – getting to know about the
technology – and competence in using the technology – being competent in using the technology.
As a new technology is introduced on the market, the first information provides a basis for the
company to consider whether the technology is relevant for the firm or not. At the second level of
maturity, the firm has obtained some knowledge about the technology, but at this stage, the firm has
iv https://www.nasa.gov/directorates/heo/scan/engineering/technology/txt_accordion1.html

10
yet to put the technology into use, i.e. no investments have been made. The firm first engages into
trial and error to learn about the specific opportunities offered by the technology – a process of getting
acquainted with the technology. At the third level, the firm makes its first initial exploration and trials
with the technology. Over time, as a consequence of using and learning about the technology, the
firm’s maturity level increases. We therefore argue that maturity is related to the single technology,
here AM technology.
The theoretical model (Figure 3) integrates AM maturity in terms of knowledge about the technology
and the application or use domains (innovation (rapid prototyping), production support (direct
tooling) and part production (direct manufacturing). By adoption of the Chasm model (Moore, 1991),
we argue that the higher maturity level a company achieves combined with its activities in use
domains have a positive effect on the company competitiveness derived from AM technology. A
further insight from the Chasm model, is the expected distribution of firms across the different
knowledge and use levels.
Figure 3: The AM Maturity Model
The figure illustrates the adopters on the right-hand side, and the maturity model as the combination
of knowledge and domain use on the left-hand side. The lowest maturity level is seen in the lower
left-hand corner (the laggards; c.f. Moore), where the firms have no knowledge and no use. In the

11
upper right-hand corner, we see the most advanced users that have high knowledge and extended use,
which covers several use domains (the innovators).
5. Research Design
The data used to analyze the maturity model was collected as part of a national screening of
manufacturing companies in relation to their AM readinessv. The screening was carried out as a
combination of a survey and follow-up case studies. 2 pilot studies (one expert and a representative
company) were carried out prior to administering the survey to the survey population. The survey
was subsequently sent to the population of Danish manufacturing firms (NACE code 10-33) with
more than 20 employees. The population was further enlarged by adding 20 firms with a particular
association to 3D print and additive manufacturing that were not part of the original population.
Data was drawn (18-04-18) from the databases Orbis and Bisnode. Bisnode produced 2.503 Danish
manufacturing firms (NACE 10-33) with 20+ employees registered at a Danish address. Orbis
returned 2.017 firm meeting the same criteria. The two lists were merged to a gross list consisting of
2.957 firms. This list was subsequently cleaned for firms without a valid email and firms located in
Greenland or the Faroe Islands. This resulted in a total population for the survey of 2.334 Danish
manufacturing firms.
An invitation to participate was forwarded to the firms in the population in May 2018. In Mid-May
non-responding firms were called. We assumed that firms with no knowledge and no use of AM
technology would have a lower propensity to respond as a result of lower or no interest. For the
screening and the assessment of maturity it is however important that we try to ensure a fair and
representative representation in the final data set. We therefore sampled firms and contacted them by
phone. Two email reminders were sent to all firms; the last of these reminders was sent out in Mid-
June. The data collection ended June 22, 2018.
Representativeness of the data sample
The survey resulted in 314 responses equaling a response rate of 13.5%. The dataset was subsequently
cleaned for entries with missing data resulting in a final dataset for analysis of 286 firms (response
v This article acknowledges the funding obtained for the national screening by the Danish AM Hub (https://am-hub.dk/en/).

12
rate 12,4%). The data set was tested for and confirmed to be representative of the Danish population
of firms with 20+ employees on size and geography. The sample indicate a dominance of small to
small-medium sized firms, which is also the case for the entire population.
Size No. of
employees
Total population Distribution Total
responses
Share of sample
Small 20-49 1.265 54,2 140 48,9
Small-
medium
50-99 543 23,3 71 24,8
Medium 100-199 286 12,2 47 16,4
Large 200+ 240 10,3 28 9,8
Total 2.334 100 286 100
Table 1: Comparison of firm distribution – population and sample
The distribution of firms on geography is also representative of the general population of
manufacturing firms with 20+ employees, with 15% of the respondents located in the larger
Copenhagen area, 11% in the remaining parts of the Zealand region, and 33%, 18% and 23% in the
Mid-, North- and South-Jutland regions. In addition to these factors, the data set was also screened
for representativeness on industry. The data cover 23 NACE codes in all. The largest group of
respondents belongs to Manufacture of fabricated metal products, except machinery and equipment
(NACE-group 25). These represent 20% of the sample, and the second largest group of firms
represent 18% of the firms and belongs to Manufacture of machinery and equipment n.e.c. Both
groups match the distribution observed in the total population of Danish manufacturing firms.
Finally, we checked the level of technology intensiveness (EUROSTATs standard) of the firms as it
can be expected that the firm’s association with e.g. technology intensive industries have a higher
propensity to adopt new technology. 63% of the firms are within low to medium-low technology
intensiveness, which again corresponds well to the population of Danish manufacturing firms.
Variables and analytical approach
The model was tested with simple distributions and frequencies. To further understand the importance
of AM maturity for the firms, we further tested the relationship between AM maturity and the firm’s
ability to benefit from the technology in terms of innovation performance. Innovation performance is
measured using the variable Product Innovation, which was measured as a simple yes/no question:

13
Has your firm introduced products that were new to the firm (not updates or simple upgrades to
existing product program) in 2015, 2016 or 2017? The share of firms that are innovative is 71.3%.
We further distinguished between firms with product innovation and those where the products were
new to the market (i.e. radical innovation). The share of firms with radical innovation is 38.8% and
of the innovative firms 49.7% have performed radical innovation.
Similarly, for Process Innovation, we asked if the firm has introduced new technologies (besides AM
print technology) in 2015, 2016 or 2017. The share of firms with process innovation is 33.5%.
25% of the manufacturing companies in the data sample use AM technologies, either as an external
service (8%), has purchased own printer (6%) or as a combination (11%). This compounds to AM
ownership in 17% of the firms. Further, there is a clear relationship between the level of technology
intensity and the use of print technologies as high technology firms are also more prone to use AM
technology.
The preferred print technologies are dominated by the relatively simple FDM (Fused deposition)
technology, which is the technology also used by hobbyists. There is also some use of SLA (light
exposure of resin fluid) and SLS (laser sintering in powder) technologies, which are still fairly easy
to use technologies.
The main external motives for adopting the AM technology is the new potential market opportunities,
whereas pressure from customers and competitors is less significant. The internal motives for
adopting AM technology is significant for fast prototyping, quick validation of prototypes and
development purposes. Factors like time to market and fast part production are less important. This
observed R&D driven motivation and the predominant use of relatively simple AM technologies
focused on prototyping are in line with the trends described by Oettmeier and Hofmann (2016).
6. The AM Maturity Model - Findings
The manufacturing companies are organized into four main categories based on the AM maturity
model. The categories are:
1. Non-users with no AM awareness, neither competencies or knowledge.

14
2. Outsourcing the AM competencies to a services or technology provider, possessing application
knowledge.
3. In-house ownership or leasing of the technology, building both knowledge and competencies.
4. Combining AM technology ownership and outsourcing of specific tasks or services.
This categorization indicates a gradually increasing maturity level for the companies (the y-axis in
Figure 3). The second category illustrates the actual usage of AM technology in the three domains
(x-axis in Figure 3):
1. Product development (rapid prototyping).
2. Production support (direct tooling of molds, fixtures, supporting tools for production).
3. Parts production (direct manufacturing).
All cases using AM (either owning, leasing, or purchasing the service) have also assessed the used
potential of the technology on a scale from low-> medium-> high for each usage domain. We argue
that the used potential of the technology is an indicator of extensiveness of use and therefore of AM
competence.
It is our expectation that more extensive knowledge, more diverse use across domains and more
varied competence as developed through own use and through interaction with suppliers of prints
result in higher AM maturity. The higher competence and use variety translate into improved
competitiveness factors as seen in innovation performance and business performance.
Of the 286 cases, 214 (74.8%) did not use AM print technology and are accordingly placed in the
lower left-hand side of the corner. 24 firms (8.4%) purchase services from technology or service
providers, but do not own any printers. 48 firms (16.8%) owned their own technology (including a
sub-group, which also purchased services from technology providers) – see also the y-axis in Figure
4.
27 companies are active in only one usage domain (colored black in Figure 4), 25 companies are
active in two domains (colored red), and 20 companies are active in all three domains (colored green).
Figure 4 is therefore showing the firms (excluding the non-users) as a combination of AM technology
knowledge and use and the number of domains they are active in. The score next to the bubbles
illustrate the extent of use on average for the firms with that specific maturity level.

15
Figure 4: AM Maturity Model – Findings
As an example, in the box with Outsourcing and Product Development shows one black bubble
represented by 15 firms (20,8% of the firms; excluding the non-users. See also Table 2). These have
on average a relatively low utilization of the potential of the technology (1.33 on average). On the
other hand, 14 companies (19,4%) have the combination of Inhouse and Outsourcing combined with
Product Development & Production Support (two domains; marked with red color). These have a
much higher utilization of the technology with an average of 2,58.
The group of firms active in the product development and production support domains, who have the
AM technology in-house has been marked with a red color. The group of companies has been plotted
in the section between the In-house and the two relevant domains. In the Product development
domain, the companies on average score used potential of the technology to 2.2 (maximum score 3).
In the Production support domain, the average score is 1.2. It can therefore be seen that the companies

16
possessing their own AM printer and that are active in the two domains (Product development and
Production support) have a higher used potential of their technology within Product development
than in Production support.
Figure 4 shows that the highest level of used potential of the technology is found in the product
development domain. The parts production domain has in general a lower used potential of the
technology than the tooling domain.
Second, the more domains a firm is active in, the higher their level of used potential of the technology.
Companies active in all the domains have a significant higher level of used potential of the
technology, than those active in only two domains.
Third, the higher the maturity level of the company, the higher the level of used potential of the
technology. In other words, companies that both own and source AM technology competencies, has
an overall higher level of used potential of the technology compared to companies sourcing the AM
services or only printing on in-house AM printers. This indicates that companies seem to be able to
maximize the benefits through engaging in a mixed approach involving both own AM activities and
collaboration with external partners. The complexity in different AM technologies could explain that
the mixed approach has the highest potential.
Table 2 now illustrates the frequency of each combination of AM technology maturity. The table
shows that the most frequent patterns are:
Product development: 24 companies (33,3% of the categorized firms; excluding non-users). This
corresponds to the expected highest penetration of the technology as the technology was first and
foremost used for innovation purposes.
Product Development & Production Support: 21 companies (29,2% of the categorized firms;
excluding non-users). Based on the high use in product development and the expected evolutionary
path moving into tooling, it is also following our expectation about the increase in maturity.
Product development, Production Support & Parts Production: 20 companies (Represented by the
green lines; 27,8% of the categorized firms; excluding non-users). Perhaps most surprising that
almost 30% of the firms combine the use of AM technology for product development and tooling
with parts production. These firms will according to our model be the most mature firms; the

17
innovators. Especially, the 6 companies that both have own technology and outsourcing have a very
high utilization of the technology (average of 2,83).
In-house & out-
sourcing
In-house
Outsourcing Total Non-user
Product development 7 2 15 24 (33,3%)
214 (74.8%)
Production support 1 0 0 1 (1,4%)
Parts Production 1 0 1 2 (2,8%)
Product Development & Production Support 14 5 2 21
(29,2%)
Product development & Parts Production 3 0 1 4
(5,6%)
Production Support & Parts Production 0 0 0 0
(0,0%)
Product Development, Production Support & Parts Production 6 9 5 20
(27,8%)
Total 32 (44,4%)
16 (22,2%)
24 (33,3%)
72 214 286 Table 2: Distribution of firms on different maturity levels (following Figure 4)
AM Maturity and Effect on Business Model
In addition to tracking and classifying the sample firms in relation to AM maturity and domain use,
the data sample also us to analyze how AM technology has impacted the firm’s business model and
innovation performance. The responding manufacturing companies has been asked if their interaction
with AM technology have had influence on their business, e.g. change in business model or
development of such. The analysis points to a higher impact on the business model, the higher level
of AM maturity the companies hold. In the group with companies only sourcing AM technology,
29% have experienced a positive impact on their business model. In the group of companies that own
their own AM technology, 56% of the companies experience a positive impact on their business. At
the highest level of AM maturity (companies that both insource and outsource the AM technology),
63% of the companies experience a positive effect.
18
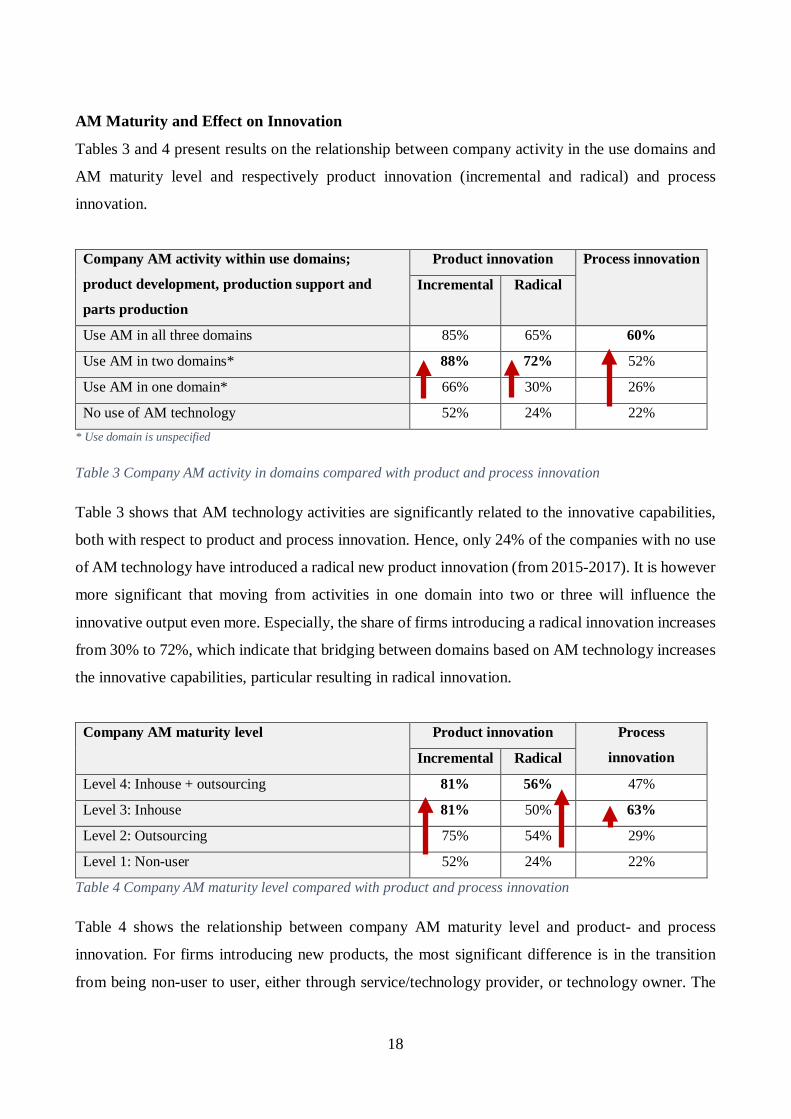
AM Maturity and Effect on Innovation
Tables 3 and 4 present results on the relationship between company activity in the use domains and
AM maturity level and respectively product innovation (incremental and radical) and process
innovation.
Company AM activity within use domains;
product development, production support and
parts production
Product innovation Process innovation
Incremental Radical
Use AM in all three domains 85% 65% 60%
Use AM in two domains* 88% 72% 52%
Use AM in one domain* 66% 30% 26%
No use of AM technology 52% 24% 22% * Use domain is unspecified
Table 3 Company AM activity in domains compared with product and process innovation
Table 3 shows that AM technology activities are significantly related to the innovative capabilities,
both with respect to product and process innovation. Hence, only 24% of the companies with no use
of AM technology have introduced a radical new product innovation (from 2015-2017). It is however
more significant that moving from activities in one domain into two or three will influence the
innovative output even more. Especially, the share of firms introducing a radical innovation increases
from 30% to 72%, which indicate that bridging between domains based on AM technology increases
the innovative capabilities, particular resulting in radical innovation.
Company AM maturity level Product innovation Process
innovation Incremental Radical
Level 4: Inhouse + outsourcing 81% 56% 47%
Level 3: Inhouse 81% 50% 63%
Level 2: Outsourcing 75% 54% 29%
Level 1: Non-user 52% 24% 22%
Table 4 Company AM maturity level compared with product and process innovation
Table 4 shows the relationship between company AM maturity level and product- and process
innovation. For firms introducing new products, the most significant difference is in the transition
from being non-user to user, either through service/technology provider, or technology owner. The

19
process innovative firms show a different pattern, and the change in process innovation is primarily
relevant when changing from outsourcing of the AM technology to investing in own technology. 29%
of the companies not owning AM technologies are also process innovative, whereas 63% of the
companies, who own their own AM technology also are process innovative. This indicates the
importance of building knowledge and competencies through ownership.
Therefore, we see that technology ownership supports (based on maturity level) the development of
incremental innovation, whereas integration across application domains using the technology
supports the highest level of radical innovation.
7. Discussion and Contribution
In contrast to additive manufacturing, subtractive manufacturing (Gibson et al., 2015) consists of
more traditional manufacturing process as drilling, grinding, milling, turning and cutting. Both
additive and subtractive processes are part of a manufacturing system (process level) that transforms
and adds value to products (Slack, Chambers, & Johnson, 2010). This paper has explored the role of
AM and 3D printing technology in bridging the different potential use domains – from product
development to parts production (and maybe later new uses – yet to be identified). Our findings
showed that AM is indeed a multi-purpose technology and the better utilization of the potential also
impacts the innovative capabilities and the business model. We therefore, find that the integrative
perspective holds great potential for further theorizing.
We propose an integrative conceptual framework (Figure 5), which draws on the distinct innovation
process model (Frederiksen & Knudsen, 2017) and manufacturing system (Bellgran & Säfsten, 2012)
to provide a multi-domain perspective on Additive Manufacturing. Based on the foundational
innovation model (on the top), we identify the use of additive manufacturing for rapid prototyping
(marked with (1)). The second and third domains for the use of AM is the support to the production
through tooling (marked with (3)) and the parts production (marked with (2)). We further anticipate
that the AM technology will allow the firm to capture input from the market – either from the
prototype tests and validation – or from user experience with the final parts. In both ways, the input
will serve as market feedback to the innovation process (marked with (4)). Finally, the impact of
using AM technology results on the business model was briefly analyzed – and was positive. This
impact may be further understood as effects in terms of business and service development by
providing customer solutions (marked with (5)).

20
Figure 5: Integrated Innovation and Manufacturing Perspective utilizing Additive Manufacturing as driver.
In more details, this model illustrates some interesting features. We expect that Rapid Prototyping (1)
in the innovation chain will combined with digital development provide shorter time-to-market,
higher potential for customization, customer integration in the development (concept and solution
phase. Specifically, digital testing (FMEA/FEA) and simulation tools will have cost reducing
potential. Additive manufacturing (2) of products and components will support product complexity,
use of advanced materials, less material waste, and flexibility in terms of customization. Additive
manufacturing of support tooling (3) such as grippers, molds and fixtures increase the manufacturing
flexibility and enable faster changeovers, small batch production and agility in the production setup.
In this case, AM is not the direct manufacturing process, but provides shorter lead-time on tooling

21
components. As additive manufacturing becomes an integrated manufacturing technology, a
feedback loop (4) to the design and development chain appears, as new opportunities within design,
materials and changeability becomes available (maybe a change from design for manufacturing to
manufacturing for design). For the competitive priorities (see figure 1), we expect that there will be
a potential for higher level of customization, customer integration in the development process, and
shorter lead-times in both development and manufacturing (5).
Contribution
This paper contributes to the literature on technology management in the analysis of the relationship
between AM technologies and their associated competitive potentials as moderated by increased
integration across the core processes of industrial firms. This article therefore identified the need for
a cross disciplinary and integrative approach by developing a maturity model of AM technology. The
findings on AM maturity and innovative capabilities provided the basis for a new model of an
integrative innovation and manufacturing perspective. We propose that the core mechanisms –
labelled 1 through 5 – are further conceptualized and tested empirically.
In a broader perspective, emerging technologies can potentially impact various level and functions in
the industrial value system, as conceptualized in “the coupling model of innovation” (Rothwell, 1994;
figure 3, p. 10). Particularly, we notice other emerging technologies with similar properties like
sensors, robotics, drones and Internet of Things, which may both contribute to and benefit from the
insights on industrial dynamics obtained in this study. This paper therefore contributes to the much
needed, but still scarce and fragmented literature, on decision models of AM (Oettmeier & Hofmann,
2016; Pour et al., 2015). We stress that this is only the first small step in assessing the potential of
AM in specific manufacturing contexts.
References
Achillas, C., Aidonis, D., Iakovou, E., Thymianidis, M., & Tzetzis, D. 2015. A methodological framework for the inclusion of modern additive manufacturing into the production portfolio of a focused factory. Journal of Manufacturing Systems, 37: 328-339.
ASTM International. 2012. Standard Terminology for Additive Manufacturing Technologies, Vol. F2792-12a. West Conshokocken, PA: ASTM International.
Baumers, M., Dickens, P., Tuck, C., & Hague, R. 2016. The cost of additive manufacturing: machine productivity, economies of scale and technology-push. Technological Forecasting and Social Change, 102: 193-201.

22
Bekar, C., Carlaw, K., & Lipsey, R. 2018. General purpose technologies in theory, application and controversy: A review. Journal of Evolutionary Economics, 28: 1005–1033.
Bellgran, M., & Säfsten, K. 2012. Production Development: Design and Operation of Production Systems London: Springer-Verlag London.
Berger, R. 2017. Additive Manufacturing – next generation AM: Roland Berger GmbH. Berman, B. 2012. 3-D printing: The new industrial revolution. Business Horizons, 55(2): 155-162. Brettel, M., Klein, M., & Friederichsen, N. 2016. The Relevance of Manufacturing Flexibility in the Context
of Industrie 4.0. Procedia CIRP, 41: 105-110. Camisón, C., & Villar-López, A. 2014. Organizational innovation as an enabler of technological innovation
capabilities and firm performance. Journal of Business Research, 67(1): 2891-2902. Candi, M., & Beltagui, A. in press. Effective use of 3D printing in the innovation process. Technovation, 80-
81: 63-73. CECIMO. 2018. Voice of the European Additive Manufacturing Industry. Brussels: European Association of
the Machine Tool Industry and Related Manufacturing Technologies. Chatha, K. A., & Butt, I. 2015. Themes of study in manufacturing strategy literature. International Journal
of Operations & Production Management, 35(4): 604-698. Chu, W.-S., Kim, M. S., Jang, K. H., Song, J. H., Rodrigue, H., Chun, D. M., Cho, Y. T., Kol, S. H., Cho, K.
J., Cha, S. W., Min, S., Jeong, S. H., Jeong, H., Lee, C. M., Chu, C. N., & Ahn, S. H. 2016. From Design for Manufacturing (DFM) to Manufacturing for Design (MFD) via Hybrid Manufacturing and Smart Factory: A Review and Perspective of Paradigm Shift. International Journal of Precision Engineering and Manufacturing-Green Technology, 3(2): 209-222.
Colotla, I., Fæste, A., Heidemann, A., Winther, A., Høngaard Andersen, P., Duvold, T., & Hansen, M. 2016. Winning the industry 4.0 race; How ready are Danish manufacturers?
Conner, B. P., Manogharan, G. P., Martof, A. N., Rodomsky, L. M., Rodomsky, C. M., Jordan, D. C., & Limperos, J. W. 2014. Making sense of 3-D printing: Creating a map of additive manufacturing products and services. Additive Manufacturing, 1-4: 64-76.
D'Aveni, R. A. 2013. 3D printing will change the world Harvard Business Review, 91(3): 22-22. Damanpour, F., & Gopalakrishnan, S. 2001. The Dynamics of the Adoption of Product and Process
Innovations in Organizations. Journal of Management Studies, 38(1): 45-65. Durach, C. F., Kurpjuweit, S., & Wagner, S. M. 2017. The impact of additive manufacturing on supply chains.
International Journal of Physical Distribution & Logistics Management, 47(10): 954-971. Frederiksen, M. H., & Knudsen, M. P. 2017. From Creative Ideas to Innovation Performance: The Role of
Assessment Criteria. Creativity and Innovation Management, 26(1): 60-74. Gambell, T., Blackwell, E., Dhawan, R., George, K., Marya, V., Singh, K., & Schmitz, C. 2017. The great re-
make: Manufacturing for modern times. Gibson, I., Rosen, D., & Stucker, B. 2015. Additive Manufacturing Technologies: 3D Printing, Rapid
Prototyping, and Direct Digital Manufacturing. New York: Springer New York. Groover, M. P. 2016. Automation, Production Systems, and Computer-Integrated Manufacturing (4th
edition, global edition ed.): Pearson. Gunday, G., Ulusoy, G., Kilic, K., & Alpkan, L. 2011. Effects of innovation types on firm performance.
International Journal of Production Economics, 133(2): 662-676. Hu, S. J. 2013. Evolving Paradigms of Manufacturing: From Mass Production to Mass Customization and
Personalization. Paper presented at the Forty Sixth CIRP Conference on Manufacturing Systems 2013, Setubal, Portugal.
Junge, M., Severgnini, B., & Sørensen, A. 2016. Product-Marketing Innovation, Skills, and Firm Productivity Growth. Review of Income and Wealth, 62(4): 724-757.
Kengpol, A., & O’Brien, C. 2001. The Development of a Decision Support Tool for the Selection of Advanced Technology to Achieve Rapid Product Development. International Journal of Production Economics, 69(2): 177–191.
Kruth, J. P., Leu, M. C., & Nakagawa, T. 1998. Progress in Additive Manufacturing and Rapid Prototyping. CIRP Annals, 47(2): 525-540.
Küpper, D., Heising, W., Corman, G., Wolfgang, M., Knizek, C., & Lukic, V. 2017. Get Ready for Industrialized Additive Manufacturing: The Boston Consulting Group.

23
Lan, H., Ding, Y., & Hong, J. 2005. Decision Support System for Rapid Prototyping Process Selection through Integration of Fuzzy Synthetic Evaluation and an Expert System. International Journal of Production Research 43(1): 169–194.
Levy, G. N., Schindel, R., & Kruth, J. P. 2003. Rapid Manufacturing and Rapid Tooling with Layer Manufacturing (Lm) Technologies, State of the Art and Future Perspectives. CIRP Annals, 52(2): 589-609.
Lipson, H., & Kurman, M. 2013. Fabricated: The new world of 3D printing: John Wiley & Sons. Mellor, S., Hao, L., & Zhang, D. 2014. Additive manufacturing: A framework for implementation.
International Journal of Production Economics, 149: 194-201. Miltenburg, J. 2008. Setting manufacturing strategy for a factory-within-a-factory. International Journal of
Production Economics, 113(1): 307-323. Moore, G. A. 1991. Crossing the Chasm. Marketing and Selling Technology Projects to Mainstream
Customers. New York, NY. : Harper Business. Niaki, M. K., & Nonino, F. 2017a. Additive manufacturing management: A review and future research agenda.
International Journal of Production Research, 55(5): 1419-1439. Niaki, M. K., & Nonino, F. 2017b. Impact of additive manufacturing on business competitiveness: A multiple
case study. Journal of Manufacturing Technology Management, 28(1): 56-74. Oettmeier, K., & Hofmann, E. 2016. Impact of additive manufacturing technology adoption on supply chain
management processes and components. Journal of Manufacturing Technology Management, 27(7): 944-968.
Panne, G. v. d., Beers, C. v., & Kleinknecht, A. 2003. Success and Failure of Innovation: A Literature Review. International Journal of Innovation Management, 07(03): 309-338.
Peters, S. 2015. A readiness level model for new manufacturing technologies. Production Engineering, 9(5-6): 647-654.
Petrick, I. J., & Simpson, T. W. 2015. 3D Printing Disrupts Manufacturing: How Economies of One Create New Rules of Competition. Research-Technology Management, 56(6): 12-16.
Pour, M. A., Zanardini, M., Bacchetti, A., & Zanoni, S. 2015. An Economic Insight into Additive Manufacturing System Implementation. Paper presented at the IFIP International Conference on Advances in Production Management Systems, Tokyo, Japan.
Rayna, T., & Striukova, L. 2016. From rapid prototyping to home fabrication: How 3D printing is changing business model innovation. Technological Forecasting & Social Change, 102: 214–224.
Rogers, E. M. 2003. Diffusion of Innovations (5th ed. ed.). New York, NY.: Free Press. Rothwell, R. 1994. Towards the Fifth-generation Innovation Process. International Marketing Review, 11(1):
7 -31. Sanchez, F. A. C., Boudaoud, H., Muller, L., & Camargo, M. 2014. Towards a Standard Experimental Protocol
for Open Source Additive Manufacturing. Virtual and Physical Prototyping 9(3): 151–167. Schniederjans, D. G. 2017. Adoption of 3D-printing technologies in manufacturing: A survey analysis.
International Journal of Production Economics 183: 287–298. Simula, H., Valiauga, P., & Lehtimäki, T. 2014. Technology versus product innovations - are they like apples
and oranges? A comparative study on commercialisation. International Journal of Technology Marketing, 10(1): 25-46.
Slack, N., Chambers, S., & Johnson, R. 2010. Operations Management Harlow: Financial Times Prentice Hall.
Sroufe, R., Curkovic, S., Montabon, F., & Melnyk, S. A. 2000. The new product design process and design for environment, "Crossing the chasm". International Journal of Operations & Production Management 20(2): 267-291.
Tranekjer, T. L. 2017. Open innovation: Effects from external knowledge sources on abandoned innovation projects. Business Process Management Journal, 23(5): 918-935.
Tseng, M. M., & Piller, F. T. 2003. The Customer Centric Enterprise: Advances in Mass Customization and Personalization (1st edition ed.): Springer
Ullah, A. M. M. S., Hashimoto, H., Kubo, A., & Tamaki., J. I. 2013. Sustainability Analysis of Rapid Prototyping: Material/ Resource and Process Perspectives. International Journal of Sustainable Manufacturing 3(1): 20–36.

24
Utterback, J. M., & Abernathy, W. J. 1975. A dynamic model of process and product innovation. Omega, 3(6): 639-656.
Ward, P. T., McCreery, J. K., Ritzman, L. P., & Sharma, D. 1998. Competitive Priorities in Operations Management. Decision Sciences, 29(4): 1035-1046.
Weller, C., Kleer, R., Piller, F. T., & Hinke, C. 2014. Economic Implications of 3D Printing: Market Structure Models Revisited. Paper presented at the Academy of Management, Philadelphia, Pennsylvania.
Wohlers, T. T. 2015. Wohlers report 2015: 3D Printing and Additive manufacturing State of the Industry Annual Worldwide Progress Report. Fort Collins, Colorado: Wohlers Associates.
Wohlers, T. T. 2019. Wohlers report 2019: 3D Printing and Additive Manufacturing - State of the Industry. Annual Worldwide Progress Report. Fort Collins, Colorado: Wohlers Associates.