Embed Size (px)
Citation preview
Louisiana State UniversityLSU Digital Commons
LSU Master's Theses Graduate School
2012
Development and utilization of molecular markersto study genetic diversity of smooth cordgrass andcold tolerance sugarcaneLina Bernaola AlvaradoLouisiana State University and Agricultural and Mechanical College, [email protected]
Follow this and additional works at: https://digitalcommons.lsu.edu/gradschool_theses
This Thesis is brought to you for free and open access by the Graduate School at LSU Digital Commons. It has been accepted for inclusion in LSUMaster's Theses by an authorized graduate school editor of LSU Digital Commons. For more information, please contact [email protected].
Recommended CitationBernaola Alvarado, Lina, "Development and utilization of molecular markers to study genetic diversity of smooth cordgrass and coldtolerance sugarcane" (2012). LSU Master's Theses. 3245.https://digitalcommons.lsu.edu/gradschool_theses/3245
DEVELOPMENT AND UTILIZATION OF MOLECULAR MARKERS TO STUDY GENETIC DIVERSITY OF SMOOTH
CORDGRASS AND COLD TOLERANCE IN SUGARCANE
A Thesis
Submitted to the Graduate Faculty of the Louisiana State University and
Agricultural and Mechanical College in partial fulfillment of the
requirements for the degree of Master of Science
In
The Department of Plant, Environmental & Soil Sciences
By
Lina Bernaola-Alvarado B.S., Universidad Nacional Mayor de San Marcos, Peru, 2003
May 2012

ii
“…Live your life each day as you would climb a
mountain. An occasional glance toward the summit
keeps the goal in mind, but many beautiful scenes are
to be observed from each new vantage point. Climb
slowly, steadily, enjoying each passing moment; and
the view from the summit will serve as a fitting
climax for the journey…”
(Harold V. Melchert)
iii
To my dear and loved parents, Flor and
David, for their constant and endless love, for
trusting my choices, and to whom I owe all
that I am and I dedicate this work.

iv
Acknowledgments
The last two years, I have had the satisfaction to know and interact with many people
who have offered me support and important advices for my professional growth. Thanks
to all and each one of you. I believe growth will inspire more growth.
Firstly, I would like to thank to my major adviser, Dr. Niranjan Baisakh, for giving me
the opportunity to pursue my master degree and for his continuous help during the
course of this investigation. Also, I am very grateful to my advisory committee members,
Dr. Stephen Harrison, Dr. Collins Kimbeng and Dr. Carrie Knott, for their
encouragement, and constructive suggestions during the preparation of the thesis.
A special thank to my colleagues in the Plant Stress Lab, especially Dr. RamanaRao
Venkata (thank you for all your help in the initial phase of my work), Dr. Arnold Parco,
and Jie Arro (thank you for help in AMOVA analysis), and Mary Liu (for generating
RAPD fingerprint). Also, thanks to all my friends in the School of Plant, Environmental,
and Soil Sciences for their personal support.
I am thankful to all my friends at LSU, especially Ramana, Jie (thank you for the jolly
time in the lab and for the Brendan James’s music!), Paulina (thank you for being a good
friend and the best roommate ever), Reddy, Dina, Maria, Carolina, Elena, Helbert, Belen,
Mauricio, Maria Carolina, Eduardo and Andres for their unconditional friendship. I will
always remember the jolly time I have spent with them. I would like to thank especially
to Jim, for being the most giving, loving and kind hearted guy I’ve ever met.
Thanks to my Peruvian friends around the globe for their constant emotional support
during these years that gave me the strength and calm when I most needed.
Finally, I wish to thank to my family: David, Flor, Annie, David, Hugo, Liz, Sara and
Rafael, who are a constant inspiration to me. Thank you for all and each one of the
wonderful moments that you give me, even to the unpleasant distance.
v
Table of Contents
Dedication …………………………………………………………………………..
Acknowledgments ………………………………………………………………….
List of Tables ………………………………………………………………………
List of Figures ……………………………………………………………………...
List of Abbreviations ………………………………………………………………
Abstract ……………………………………………………………………………..
Chapter I: General Introduction ………………………………………………… 1.1 Background of the Study …………………………………………... 1.2 Genetic Diversity and Genetic Markers …………………………...
Chapter II: Genetic Diversity and Identification of Genotype Specific Alleles of Spartina alterniflora Loisel Collections of Louisiana Using RAPD and SSR Markers ………………………………………
2.1 Introduction ………………………………………………………... 2.2 Materials and Methods …………………………………………….. 2.3 Results ……………………………………………………………… 2.4 Discussion …………………………………………………………..
Chapter III: Differential Expression of Genes and Genetic Diversity for Cold Stress Response of Sugarcane (Saccharum spp. Hybrids) …..
3.1 Introduction ………………………………………………………... 3.2 Materials and Methods …………………………………………….. 3.3 Results ……………………………………………………………… 3.4 Discussion …………………………………………………………...
Chapter IV: Conclusions …………………………………………………………..
References …………………………………………………………………………..
Vita ………………………………………………………………………………….
iii
iv
vi
vii
viii
ix
1 1 3
5 5 10 15 27
36 36 41 47 63
70
71
83
vi
List of Tables
2.1. List of the 13 smooth cordgrass accessions used in SSR and RAPD analysis …
2.2. List of RAPD primers used for genotyping of the 13 smooth cordgrass accessions ……………………………………………………………………….
2.3. Polymorphism information and comparison of RAPD and SSR markers in the 13 smooth cordgrass accessions………………………………………………...
2.4. Number of total fragments and polymorphism rate generated by the RAPD primers in the 13 smooth cordgrass accessions………………………………...
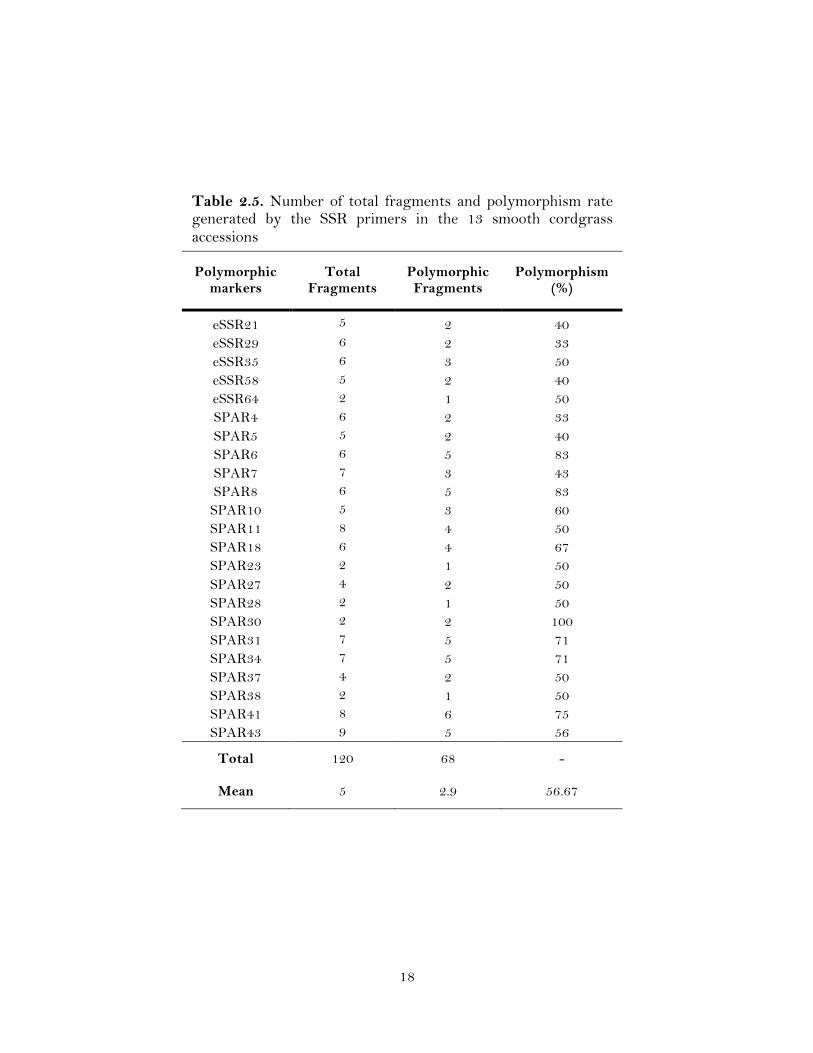
2.5. Number of total fragments and polymorphism rate generated by the SSR primers in the 13 smooth cordgrass accessions………………………………...
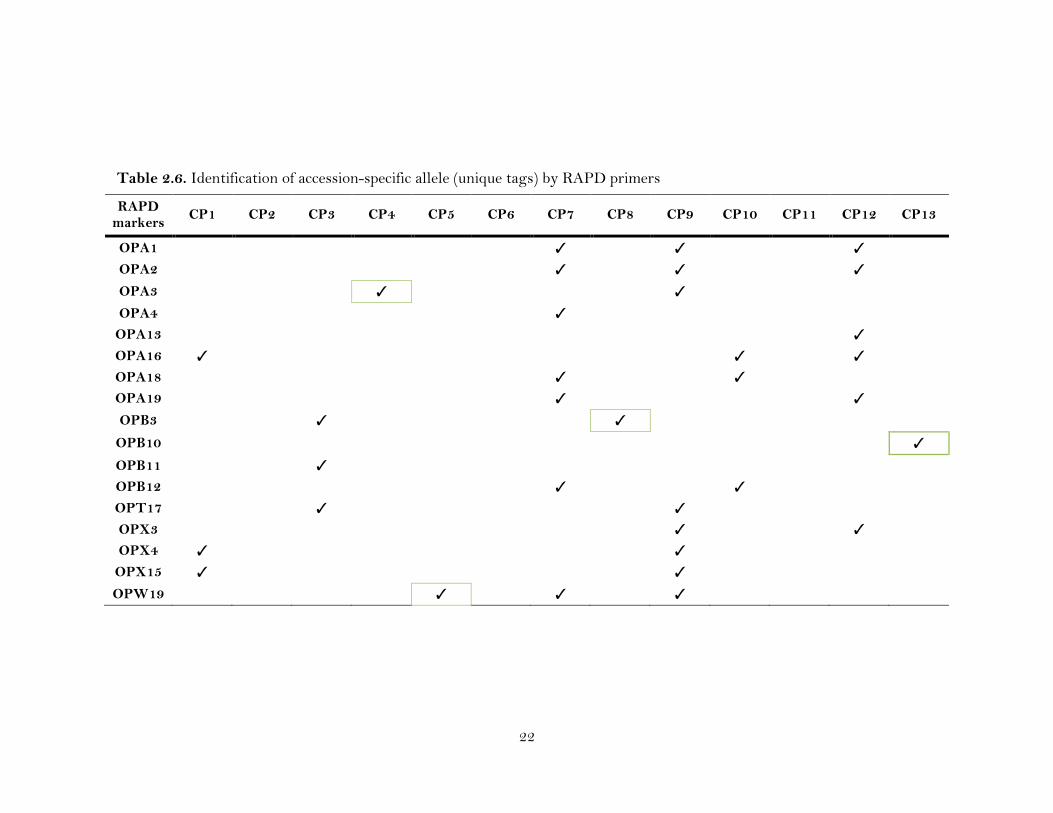
2.6. Identification of accession-specific allele (unique tags) by RAPD primers …….
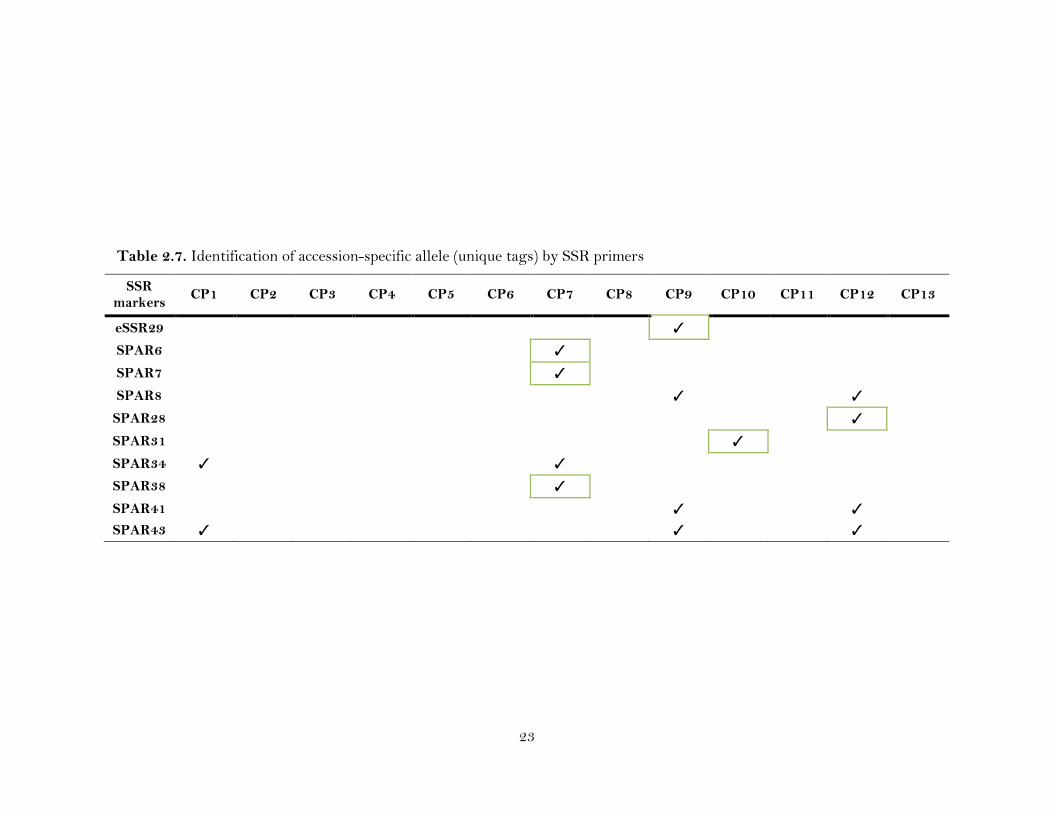
2.7. Identification of accession-specific allele (unique tags) by SSR primers ……….
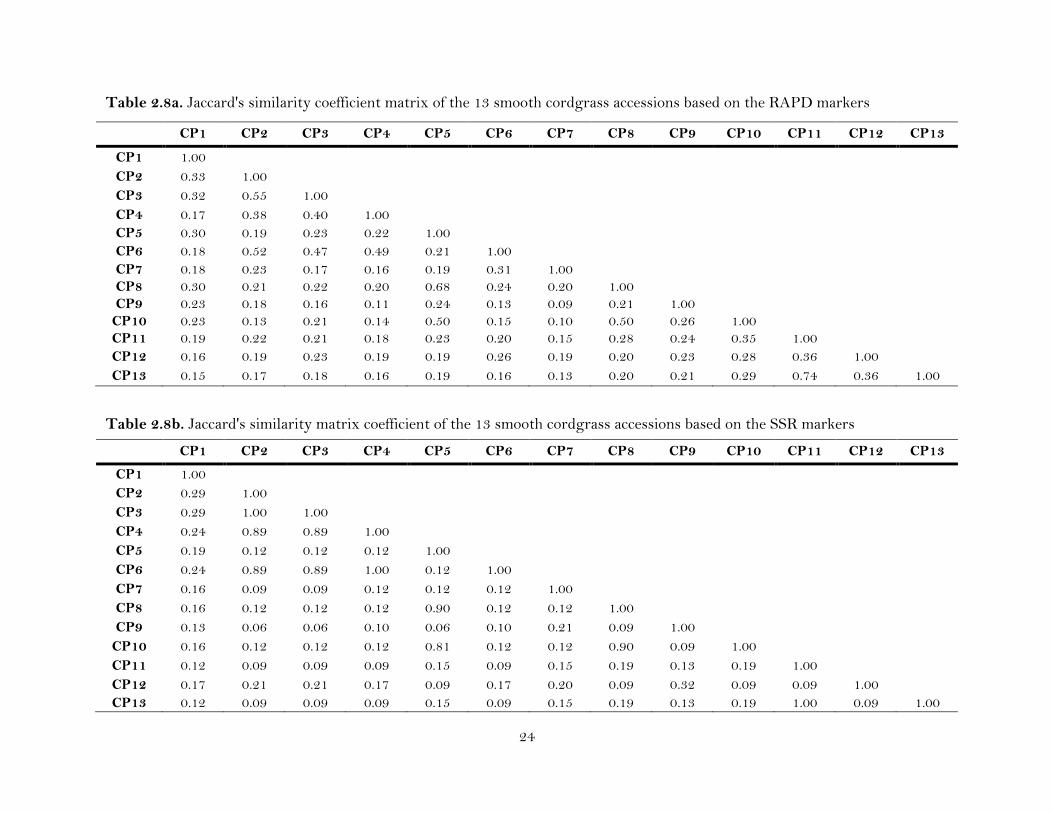
2.8a. Jaccard's similarity coefficient matrix of the 13 smooth cordgrass accessions based on the RAPD markers …………………………………………………...
2.8b. Jaccard's similarity matrix coefficient of the 13 smooth cordgrass accessions based on the SSR markers ……………………………………………………...
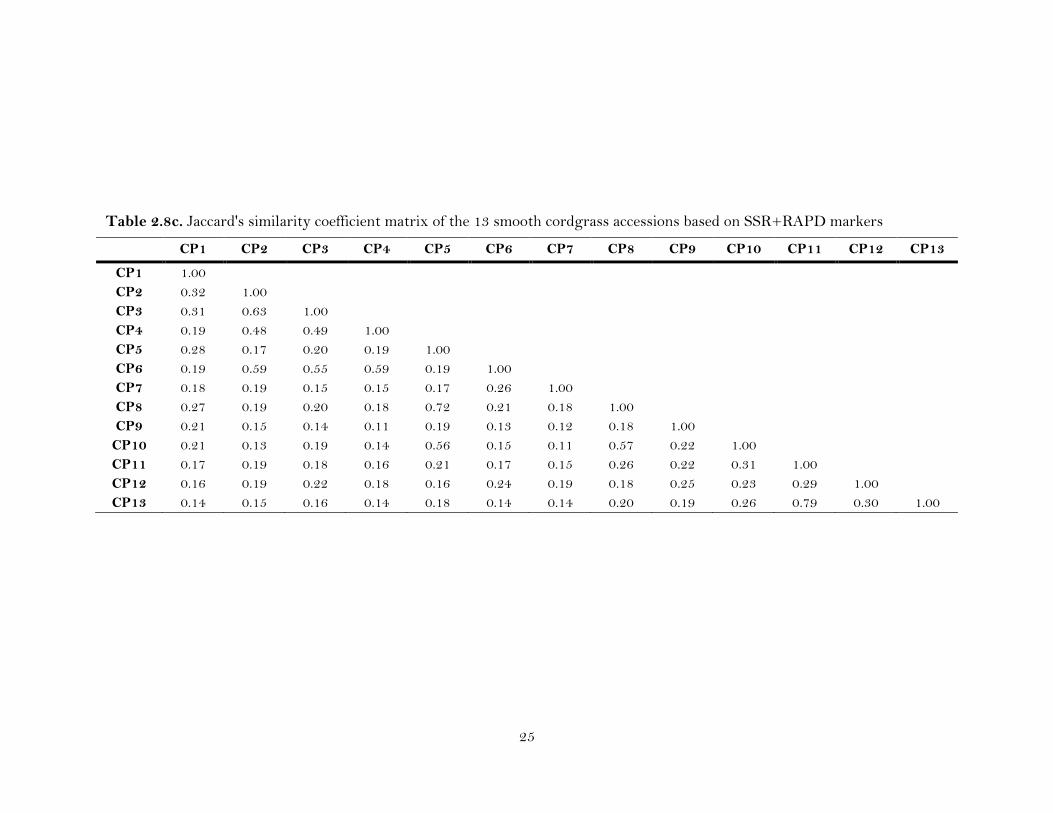
2.8c. Jaccard's similarity coefficient matrix of the 13 smooth cordgrass accessions based on SSR+RAPD markers ……………………………………
2.9. Analysis of molecular variance (AMOVA) for the 13 smooth cordgrass accessions ……………………………………………………………………….
3.1. Taxonomy of sugarcane ………………………………………………………...
3.2. Summary of the members of the genus Saccharum ……………………………..
3.3. Sequence of the primers used in cDNA synthesis and ACP-based PCR analysis ………………………………………………………………………….
3.4. Similarity search results of sugarcane DEGs against NCBI nr database ……...
3.5. Primer sequences designed from selected DEGs of ACP-cDNA library for use in (semi)quantitative RT-PCR analysis ………………………………………...
3.6. Primer sequences of 12 cold responsive eSSRs from the SUCEST database .…
3.7. Polymorphism characterization of the 11 eSSR markers ………………………
11
13
15
17
18
22
23
24
24
25
31
37
37
43
52-53
54
60
62
vii
List of Figures
2.1. Representative gels showing fragment amplification from the 13 smooth cordgrass accessions by gSSR (Spar4; upper), eSSR (eSSR58; middle), and RAPD (OPA1; bottom) primers. Lane 1-13 = CP1-CP13 as in Table 2.1………………………………………………………………………………..
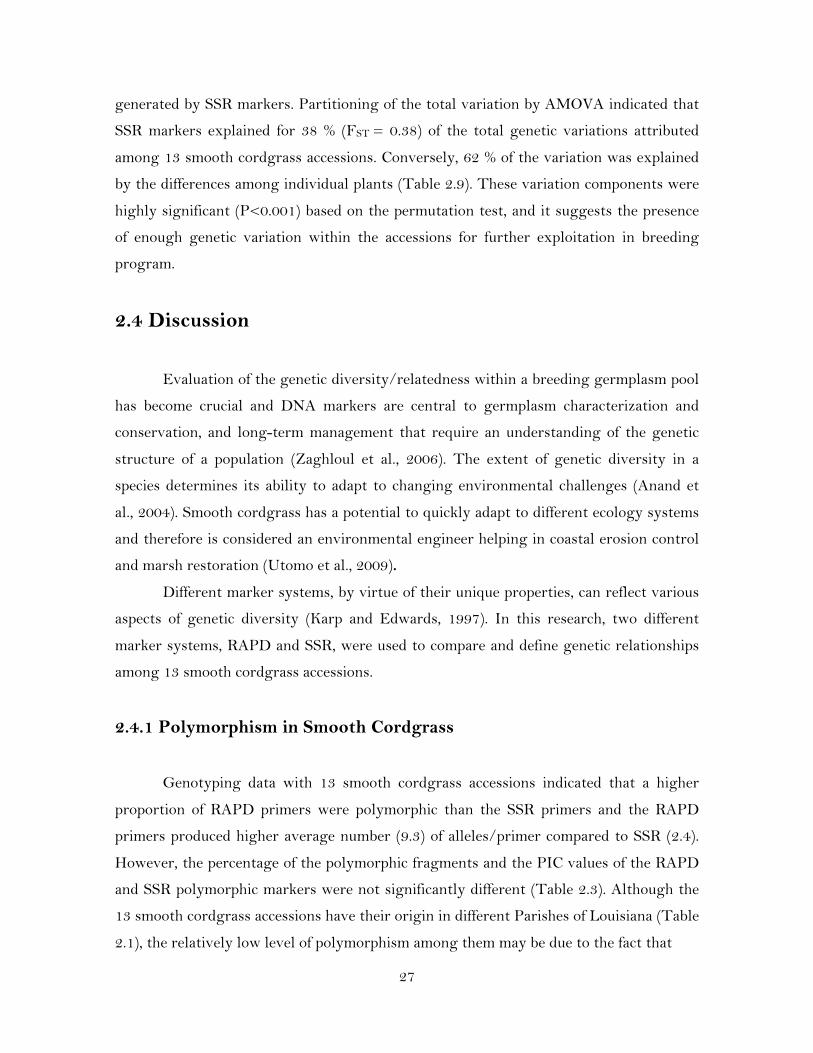
2.2. Cluster analysis of the 13 smooth cordgrass accessions with UPGMA based on Jaccard’s coefficient. A) Dendrogram for RAPD markers, B) Dendrogram for SSR markers, C) Dendrogram for RAPD+SSRs, and D) Dendrogram for five individual plants within each of the 13 accessions ………………………...
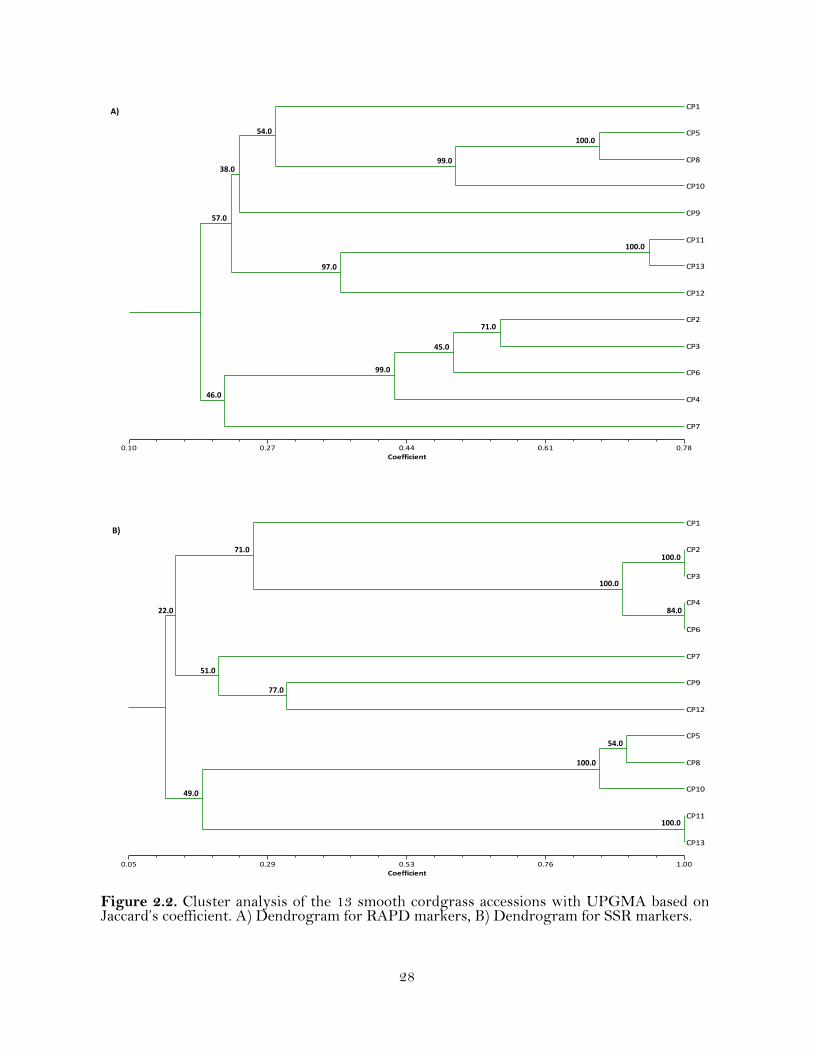
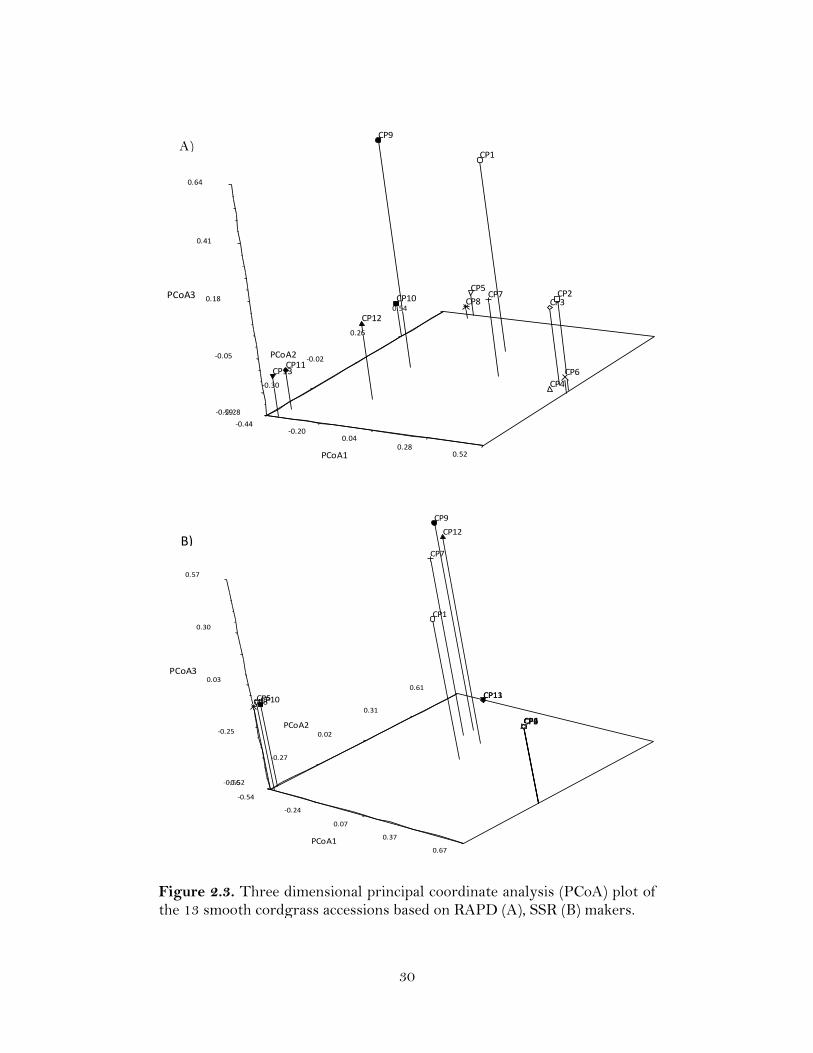
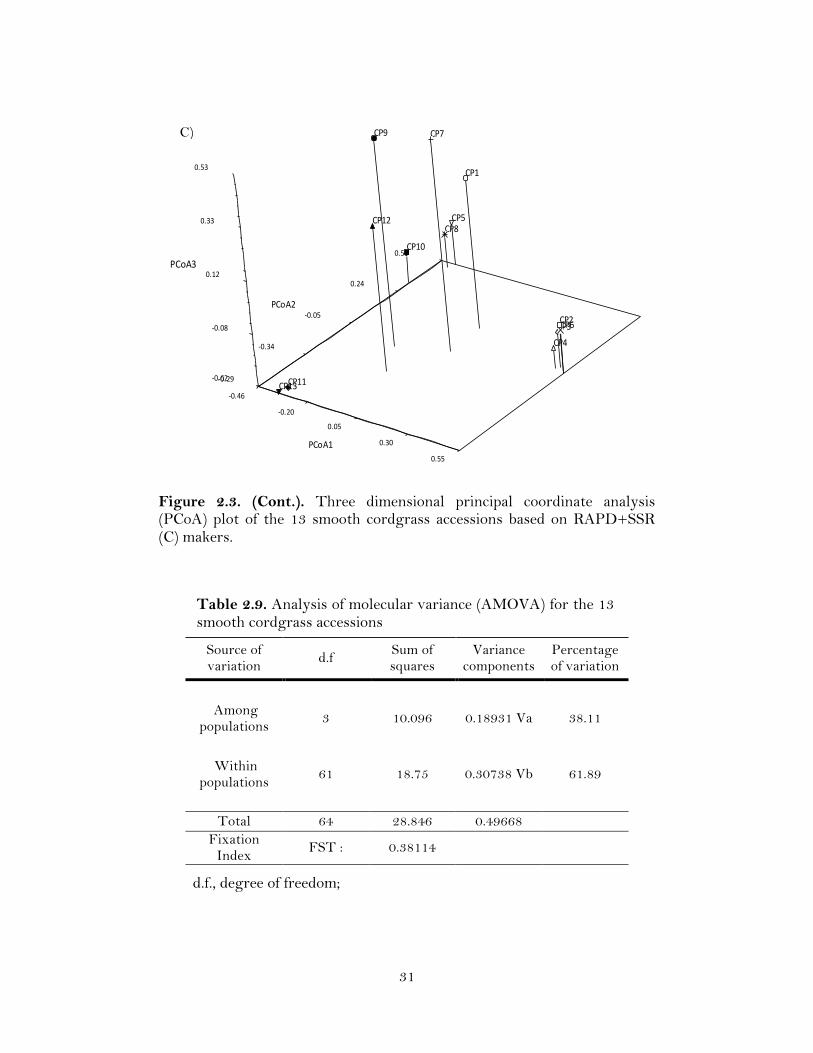
2.3. Three dimensional principal coordinate analysis (PCoA) plot of the 13 smooth cordgrass accessions based on RAPD (A), SSR (B), and RAPD+SSR (C) makers …………………………………………………………………………..
3.1. Structure of the annealing control primer (ACP) system ……………………...
3.2. Picture showing the cold tolerant (Ho02-144) and cold sensitive (L79-1002) sugarcane clone under 0 °C inside a growth chamber …………………………
3.3. Identification of the differentially expressed genes using ACP markers. Arrows indicate the upregulated genes after cold treatment. M: 1kb molecular marker, CR: control resistant, TR: treatment resistant, CS: control susceptible, TS: treatment susceptible …………………………………………
3.4. Semiquantitative reverse transcription (sqRT) PCR of five SuDEGs in sugarcane clones Ho02-144 and L79-1002. Sugarcane elongation factor was used as the internal control reference gene …………………………………….
3.5. Quantitative reverse transcription (qRT) PCR of four SuDEGs in sugarcane clones Ho02-144 and L79-1002. Sugarcane elongation factor was used as the internal control reference gene ………………………………………………...
3.6. Genotyping of the 64 sugarcane genotypes (48 sugarcane clones and 16 ancestral parental clones) using eSSR primers 2, 3, 6, and 11 …………………
3.7. Dendrogram showing cluster pattern of 48 sugarcane clones and 16 ancestral parental clones, based on genetic similarity indices obtained from the eSSR markers …………………………………………………………………………
3.8. Three dimensional principal coordinate analysis (PCoA) plot showing distribution of 64 sugarcane genotypes based on eSSR markers ……………...
19
28-29
30-31
40
48
51
55
57-58
61
64
65
viii
Abbreviations
AMOVA analysis of molecular variance
APS ammoniumperoxidisulfate
bp base pair
DEG differentially expressed gene
dNTP deoxynucleotidetriphosphate
EST expressed sequence tag
eSSR EST-derived simple sequence repeat
gSSR genomic simple sequence repeat
IPTG isopropyl β-D-1-thiogalactopyranoside
MAS marker-assisted selection
PCR polymerase chain reaction
RAPD random amplified polymorphism DNA
RT reverse transcription
Sq/q semiquantitative/quantitative
SSR simple sequence repeat
Ta annealing temperature
TAE tris acetate EDTA
TBE tris borate EDTA
TEMED tetramethyl-ethylenediamine
ix
Abstract
Smooth cordgrass (Spartina alterniflora Loisel) and sugarcane (Saccharum spp.
hybrids) are both grasses that belong to the family Poaceae and have significant impact
on Louisiana environment and economy. Coastal Louisiana accounts to ~80% of the
national wetland loss through natural and human interventions; (re)vegetation is
considered an important component of coastal restoration efforts. Smooth cordgrass, a
warm season marsh grass, is used as an ecosystem engineer to stabilize and restore
Louisiana coastal marshes. In this study, genetic diversity was determined among 13
elite smooth cordgrass accessions of Louisiana through 276 polymorphic markers
generated by 23 SSR and 32 RAPD primers. AMOVA results showed that sufficient
variation existed among smooth cordgrass accessions for further exploitation in
breeding program. A few genetic markers unique to specific smooth cordgrass
accession(s) were also developed. Sugarcane, the number one row crop in Louisiana, is
sensitive to cold; so cold tolerance is desirable to expand its cultivation in more
northern environments. Cold tolerance alleles of Saccharum spontaneum can be exploited
to develop sugarcane clones tolerant to low temperatures. To this end, forty
differentially expressed genes (DEGs; 29 up-regulated and 11 down-regulated) were
identified in a cold-tolerant clone Ho02-144 and a cold-sensitive clone L79-1002 under
cold stress, using annealing control primer system. Reverse-transcription PCR (RT-
PCR) analysis of the cold-responsive DEGs revealed distinctive expression profiles in
the tolerant and sensitive clone. Mining of the cold-responsive DEGs yielded 12
sequences with simple sequence repeats (SSRs), which were used to design eSSR
primers. Genotyping of 48 Louisiana sugarcane clones and 16 ancestral parents with
these eSSRs generated 170 polymorphic markers that could classify cultivated
sugarcane clones from their ancestral S. spontaneum clones at 0.23 similarity coefficient.
The cold responsive genes will be useful for breeding cold tolerant sugarcane either
through genetic engineering or selection through the use of gene-based markers.

1
Chapter I General Introduction
1.1 Background of the Study
Coastal wetlands of Louisiana are considered a national treasure for various
reasons: they protect multi-billion dollar oil and gas industries; provide nursery
grounds for fish and winter habitat for about one-half of the Mississippi Flyway
waterfowl population; and more importantly serve as a buffer from hurricanes and
storms (CWPPRA, 2012). Forty percent of the nation’s coastal marshes are in Louisiana
and at the same time 80% of the total wetland loss occurs in Louisiana due to human
and natural interventions (CWPPRA, 2012). Wetland restoration projects are being
implemented as the best alternative to improve water quality and alleviate degradation
of natural wetlands (Mitsch and Gosselink, 2000). Many of these restoration projects
require the utilization of native plants such as smooth cordgrass because it is the most
dominant intertidal saline marsh plant.
Smooth cordgrass, also called salt marshgrass, is a warm-season grass member
of family Poaceae that grows along the Atlantic and Gulf coasts of North America
(Valiela et al., 1978). This species is important as an ecosystem engineer in Louisiana for
stabilization and rescue of coastal marshes. This is due to its aggressive spreading
ability through rhizomes to form a dense canopy, and tolerance to extreme salinity and
other environmental stresses (Daehler and Strong, 1997; Walkup, 2011). Smooth
cordgrass grows out into the water at the seaward edge of a salt marsh, and
accumulates sediment and enables other habitat-engineering species, such as mussels, to
settle (Valiela et al., 1978). However, until recently, only two smooth cordgrass
cultivars (Vermilion and Bayshore) have been released commercially. “Vermilion” has
demonstrated superior growth characteristics and has performed well in highly
disturbed salt marshes, but its extensive use as a monoculture in the coastal habitat
restoration activities in Louisiana (Utomo et al., 2009) is a concern in terms of its
genetic vulnerability to biotic and abiotic stresses. Therefore, there is a need for
developing new genetically diverse smooth cordgrass cultivars for wetlands restoration
2
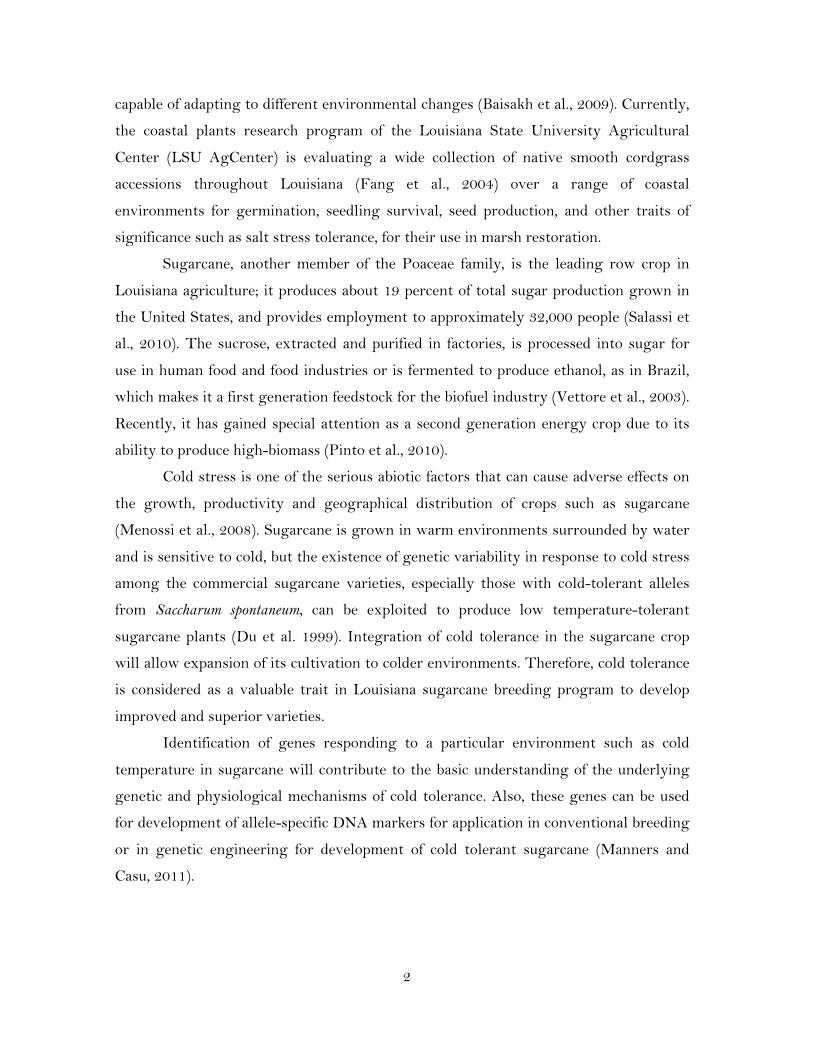
capable of adapting to different environmental changes (Baisakh et al., 2009). Currently,
the coastal plants research program of the Louisiana State University Agricultural
Center (LSU AgCenter) is evaluating a wide collection of native smooth cordgrass
accessions throughout Louisiana (Fang et al., 2004) over a range of coastal
environments for germination, seedling survival, seed production, and other traits of
significance such as salt stress tolerance, for their use in marsh restoration.
Sugarcane, another member of the Poaceae family, is the leading row crop in
Louisiana agriculture; it produces about 19 percent of total sugar production grown in
the United States, and provides employment to approximately 32,000 people (Salassi et
al., 2010). The sucrose, extracted and purified in factories, is processed into sugar for
use in human food and food industries or is fermented to produce ethanol, as in Brazil,
which makes it a first generation feedstock for the biofuel industry (Vettore et al., 2003).
Recently, it has gained special attention as a second generation energy crop due to its
ability to produce high-biomass (Pinto et al., 2010).
Cold stress is one of the serious abiotic factors that can cause adverse effects on
the growth, productivity and geographical distribution of crops such as sugarcane
(Menossi et al., 2008). Sugarcane is grown in warm environments surrounded by water
and is sensitive to cold, but the existence of genetic variability in response to cold stress
among the commercial sugarcane varieties, especially those with cold-tolerant alleles
from Saccharum spontaneum, can be exploited to produce low temperature-tolerant
sugarcane plants (Du et al. 1999). Integration of cold tolerance in the sugarcane crop
will allow expansion of its cultivation to colder environments. Therefore, cold tolerance
is considered as a valuable trait in Louisiana sugarcane breeding program to develop
improved and superior varieties.
Identification of genes responding to a particular environment such as cold
temperature in sugarcane will contribute to the basic understanding of the underlying
genetic and physiological mechanisms of cold tolerance. Also, these genes can be used
for development of allele-specific DNA markers for application in conventional breeding
or in genetic engineering for development of cold tolerant sugarcane (Manners and
Casu, 2011).
3
1.2 Genetic Diversity and Genetic Markers
Genetic diversity is the variation among genotypes within a population or
among populations, which is reflected by morphological, physiological and genetic
differences due to differences in allelic compositions (Frankham et al., 2002).
Understanding the genetic diversity or germplasm organization of important plant
species, such as smooth cordgrass and sugarcane, is important for more efficient
selection of improved cultivars and to maintain genetic gain, which is essential to the
success of a breeding program (Swanson, 1996). More emphasis is being given to
increasing the genetic base of the smooth cordgrass and sugarcane in Louisiana
breeding programs because there is concern of inbreeding depression and vulnerability
to environmental catastrophe in the way modern cultivars are bred. The genetic
diversity studies of these species will help breeders select diverse parents to generate
viable superior crops (Hamrick, 2004).
Genetic diversity studies have been made easier with the advent of DNA-based
molecular markers that demonstrated better selection efficiency for plant improvement.
DNA marker profiles provide reliable and direct strategies for assessing the genetic
variation within populations for population structure and genetic identification
(Morgante and Olivieri, 1993). The development of unique genetic markers to identify
individual varieties (genotype identification) and DNA fingerprinting will help to
preserve the integrity and purity of improved and released varieties.
Depending on the objectives, several different types of molecular marker
systems have been used for genetic diversity, population structure analysis, genotype
identification development as well as mapping and marker-assisted selection. Random
amplified polymorphic DNA (RAPD) markers are easy and could be used for genetic
diversity studies and subsequent genotype ID development through sequence
characterized amplified region (SCAR) markers (Ryan, 2003). On the other hand,
microsatellites or simple sequence repeats (SSRs) derived from both coding (eSSR) and
non-coding (gSSR) regions of the genome are highly informative, reproducible markers.
These have been successfully used in genetic mapping and development of markers for
marker-assisted selection of desirable traits in crops (Gupta and Varshney, 2000).
Another advantage of these genic eSSRs is their transferability across species that
4
makes them useful in comparative genomics (Varshney et al., 2005). Therefore, the
development of molecular markers will be useful for the research community engaged in
wetlands plants and sugarcane programs, especially when these can be targeted at
genomic regions known to contribute to the control of economically important,
genetically complex traits such as abiotic stress (such as cold and salt) tolerance
(Baisakh et al., 2009). Also, the characterization of the gene expression profiles under
stress is an important tool for the development of genic markers for their use in
breeding cold-tolerant sugarcane.
Given the importance of smooth cordgrass and sugarcane in Louisiana as
described above, the present investigation has been focused on these two grass species.
Chapter II describes the genetic diversity studies and development of unique genetic
tags of the elite smooth cordgrass accessions including three very recently registered
lines of smooth cordgrass (Knott et al., 2012). Chapter III encompasses gene expression
studies in sugarcane for identification of cold-responsive genes and subsequent
development of genic markers for characterization of the Louisiana sugarcane
germplasm.
5
Chapter II Genetic Diversity and Identification of Genotype Specific Alleles of Spartina
alterniflora Loisel Collections of Louisiana Using RAPD and SSR Markers
2.1 Introduction
Coastal Louisiana accounts for approximately 40% of the nation’s coastal
wetlands in the lower 48 states. Wetlands are areas where water covers the soil or is
near the surface of the soil (Fang, 2002). They improve the water quality by filtering
out pollutants and absorbing nutrients; act as storm buffer against hurricanes and
storms, as flood control devices by holding excess floodwaters during high rainfall, and
as habitat for fish and wildlife (CWPPRA, 2012). These wetlands are in jeopardy
because Louisiana loses about 3.5 million acres of wetlands, or about 75 to 91 square
kilometers per year, which is nearly 80% of the total coastal wetland loss (CWPPRA,
2012). If coastal wetland loss continues at this rate, by the year 2050 Louisiana would
lose an additional 2132 square kilometers of coast marshes, which will deprive to
Louisiana of fish, wildlife, and other environmental benefits (CWPPRA, 2012).
Smooth cordgrass (Spartina alterniflora Loisel) is a warm-season perennial grass
that belongs to the genus Spartina in the Poaceae family. Smooth cordgrass is found
along the Atlantic and Gulf coast of North America where it forms dense colonies,
especially in estuarine salt marshes (Valiela et al., 1978). The importance of this species
in Louisiana has been primarily for use in coastal erosion control and protection of
shorelines, canal banks, levees, and other areas of soil-water interface. These salt
marshes are meant to protect wetlands lost by the natural and/or human interventions
due to its vigorous spreading ability and strong underground rhizome growth (Duncan
and Duncan, 1987). The importance of smooth cordgrass as an environmental engineer
is based on its rapid growth, high capacity to tolerate various stresses, its great
adaptation to many soil types filtering heavy metals and toxic materials from the water
column (Walkup, 2011).
6
Coastal restoration projects in Louisiana rely heavily on the utilization and
reintroduction of native plants such as smooth cordgrass in order to offset the wetland
loss because it is the predominant marsh plant that determines the estuarine structure
and ecological function in these regions (Proffitt et al., 2003; Utomo et al., 2009; Knott
et al., 2012). Recently there is an increased interest of using smooth cordgrass in
restoration projects in Louisiana, which will increase in the following years because the
Coastal Wetlands Planning, Protection and Restoration Act (CWPPRA) has released a
project for vegetation of smooth cordgrass across the entire Louisiana coast (CWPPRA,
2012).
So far, two smooth cordgrass cultivars have been released by the Unites States
Department of Agriculture’s National Resources Conservation Service (USDA-NRCS)
for coastal restoration programs: Bayshore (Hamer et al., 1994) was released for the
Atlantic coast and Vermilion (CP8; Fine and Thomassie, 2000) was released for the Gulf
of Mexico coast. Vermilion has demonstrated superior growth characteristics and has
performed well in highly disturbed salt marshes. It is the only cultivar that has been
grown extensively for coastal restoration in Louisiana (USDA NRCS, 2006; Utomo et
al., 2009), which is a concern because the use of a single cultivar could have serious
repercussions in terms of genetic vulnerability to biotic and abiotic stresses. Therefore,
there is an increased demand for developing new genetically diverse smooth cordgrass
cultivars with ability to adapt to changing environment for wetlands restoration and
reclamation (Baisakh et al., 2009). The genetic diversity studies of Louisiana smooth
cordgrass will allow the researchers to develop strategies to generate viable marshland
systems and increase ecosystem functionality through development of improved smooth
cordgrass varieties (Utomo et al., 2009; Umamaheswari et al., 2010).
The knowledge on the understanding of the genetic diversity in germplasm
organization is important for more efficient selection of improved cultivars. Gene
expression studies in smooth cordgrass have resulted in identification of key genes
involved in its salt and heat stress responses (Baisakh et al., 2006; 2008; 2009). Being
extremely salt tolerant and a member of grass family that constitutes the majority of the
food crops, this grass has been proposed as a model halophyte for bioprospecting genes
to improve salt tolerance in cereal crops (Subudhi and Baisakh, 2011).

7
Louisiana State University Agricultural Center (LSU AgCenter) coastal plant
breeding program is the first and only program established in the state of Louisiana and
the United States, which is aimed at improving Louisiana native plants, and developing
certification standards of native plant varieties, modeled after agricultural systems.
Currently, the LSU AgCenter coastal plants breeding program is evaluating a wide
collection of smooth cordgrass accessions from South Louisiana (Fang, 2002) over a
range of coastal environments for germination, seedling survival, seed production, and
other traits of significance such as salt stress tolerance, for their use in restoration
activities. Thirteen of these accessions were germinated and selected under field
conditions for different agronomic traits (Ryan et al., 2007). Three elite derivatives of
these accessions, maintained as pure foundation material, were registered recently as
clonal varieties for use in marsh restoration (Knott et al., 2012) and three more are in
the registration pipeline.
DNA-based markers are extremely useful for a variety of purposes and their
efficacy is determined by the technology that is used to reveal DNA polymorphisms
based on the variation of nucleotide sequences (Mazur and Tingey, 1995). Neutral
markers such as amplified fragment length polymorphism (AFLP; Vos et al., 1995),
simple sequence repeats (SSR; Parida et al., 2006), expressed sequence tags (EST)-
derived SSR (eSSR; Baisakh et al., 2009), random amplification polymorphic DNA
(RAPD; Stiller and Denton, 1995), target region amplification polymorphism (TRAP;
Hu and Vick, 2003) and sequence-related amplification polymorphism (SRAP; Li and
Quiros, 2001) have been routinely used to screen populations for diversity and mapping
studies.
Random amplification polymorphic DNA (RAPD) markers are simple, quick,
easy to assay, and more importantly do not require sequence information of the target
for design of the primers. They are generally dominant markers with high genomic
abundance because of their random distribution throughout the genome (Williams et al.,
1990). In addition, RAPD assay requires low quantities of DNA for amplification by
polymerase chain reaction (PCR) and may facilitate more effective diversity analysis
(Karp and Edwards, 1997). On the other hand, microsatellites or simple sequence
repeats (SSRs) are short sequences (2-6 base motifs) of repetitive DNA found in the
coding and non-coding regions of the genome (Parida et al., 2006). The genomic SSR

8
markers (gSSR) are highly variable within a species and are often used for studying
polymorphism in different plant species. At the same time cDNA clones or expressed
sequence tags (EST) deposited in public databases such as GenBank, can be searched for
identification of SSRs, which are known as EST-derived SSRs (eSSR). The eSSR
markers allow tracking of the genetic loci controlling the useful traits without extensive
field evaluation because of the fact that they reside directly within the gene(s)
controlling the trait(s) of interest and they can be used as diagnostic markers for the
genes or to map them (Chen et al., 2006; Wen et al., 2010). SSRs are co-dominant
molecular markers that are being increasingly used due to their robustness,
reproducibility, uniform distribution, polymorphism, ease of use, and relatively simple
interpretation (Cholastova et al., 2011).
RAPD and SSR markers have been used to assess the genetic variability of
smooth cordgrass. Using RAPDs, O’Brien et al. (1999) observed that smooth cordgrass
could be classified into three geographic areas (New England, South Atlantic, and Gulf
coast). RAPD markers were used to test the hybrid status between the native and
introduced Spartina species in the greenhouse and in the field (Daehler and Strong
1997). The authors identified introgression and spread of hybrids as a risk to
conservation of S. foliosa in San Francisco Bay. Daehler et al. (1999), using RAPDs,
reported the spread of a dwarf ecotype of smooth cordgrass in San Francisco Bay. They
found that the ecological range of this ecotype is similar to that of S. patens, suggesting
that its absence in San Francisco Bay has allowed the dwarf ecotype of smooth
cordgrass to survive and spread. Ryan et al. (2007) evaluated the genetic diversity of
accessions collected from South Louisiana smooth cordgrass populations using RAPD
and AFLP markers. Cluster analysis showed natural variation among the collections
contributing to plant establishment from seed. Travis et al. (2002) characterized genetic
diversity of smooth cordgrass from restored wetland and undisturbed wetland sites, and
established that genetic diversity in restored populations is comparable to natural
populations. Likewise, the development and use of SSR markers has revealed important
findings in smooth cordgrass. Blum et al. (2004) and Sloop et al. (2005) developed
genomic SSR markers to ascertain the ecological and evolutionary origin among native
and invasive species of smooth cordgrass. Using SSRs, Blum et al. (2007) suggested
existence of genetic differences among smooth cordgrass populations from mid- and
9
southern Atlantic regions. Baisakh et al. (2009) proposed that EST-derived SSRs
(eSSRs) of smooth cordgrass were transferable across other species of Spartina and
could facilitate comparative genomic studies of Spartina species with different origin and
environmental adaptation. The eSSRs in combination with gSSRs have been used for
genetic diversity analysis, genome mapping, and evolutionary studies in Spartina (Blum
et al., 2004; Blum et al., 2007; Sloop et al., 2005; Baisakh et al. 2009).
Molecular investigations into the population structure, gene diversity and
genetic relatedness within and among smooth cordgrass accessions will be of immense
value to identify genetically diverse accessions as well as cataloging genetic fingerprints
of genotypes for maintaining and monitoring genetic integrity and purity of future
released accessions (Baisakh et al., 2009). The importance and use of genetic markers
unique to these lines for DNA fingerprinting will help preserve the genotype
identification (ID) of the released material. The knowledge of the ID of smooth
cordgrass plants is an important component of the seed certification to ensure identify
and purity of plant materials, which is essential in the development of a new foundation
plant production industry in Louisiana.
2.1.1 Research Objectives
With a long-term goal of developing genetic markers to facilitate breeding of
improved smooth cordgrass varieties for their use in coastal wetlands restoration, the
present study was undertaken with the following objectives:
To assess genetic diversity among and within a set of 13 smooth cordgrass elite
accessions using RAPD and SSR markers;
To identify a unique genetic tag for a particular clone/accession.
10
2.2 Materials and Methods
2.2.1 Plant Material
Thirteen smooth cordgrass CP (crossing plot) accessions (CP1, CP2, CP3, CP4,
CP5, CP6, CP7, CP8, CP9, CP10, CP11, CP12 and CP13) including six soon-to-be-
released varieties (Table 2.1) were used in this study. One of these accessions, Vermilion
(CP8; Fine and Thomassie, 2000) is used extensively in Louisiana coastal reclamation
and restoration projects along the Gulf coast. Seven accessions (CP1-CP7) were selected
from 126 accessions that were collected as seeds from different regions of South
Louisiana (Fang et al., 2004) in 1998, and grown in 1999. Based on the results of
germination, seedling survival, and seedling vigor tests, 20 accessions were selected for
preliminary field evaluation. In 2000, 20 plants per accession (400 plants) were field
evaluated at the LSU AgCenter’s Central Research Stations, Ben Hur, Baton Rouge, LA
(Ryan et al., 2007). In 2001, forty lines were selected based on their plant height, spread,
disease reaction, and plant vigor data in advanced field trial (Ryan et al., 2007). The
other five accessions (CP9-CP13) were developed in a crossing block through open-
pollination in 1999. All thirteen accessions were vegetatively maintained in a
greenhouse of the LSU AgCenter, Baton Rouge, LA. Five individual plants from each
accession were also vegetatively maintained inside the greenhouse for analysis with SSR
markers. The accessions show contrasting phenotypes with respect to different
agronomic traits including seedling vigor and spread, seed set etc (Knott et al., 2012).
2.2.2 DNA Isolation
Total genomic DNA was extracted from fresh, young leaves of five plants from
each of 13 smooth cordgrass accessions using the small scale CTAB protocol (Doyle and
Doyle, 1990). DNA quality and quantity was determined by agarose (1 % w/v) gel
electrophoresis and a ND-100 spectrophotometer (NanoDrop Technologies Inc.,
Wilmington, DE), respectively. Genomic DNA was resuspended at a 50 ng/µl working
concentration for use in RAPD and SSR analysis. The concentrated DNA stock and the
working DNA solution was stored at -20 oC and 4 oC, respectively.
11
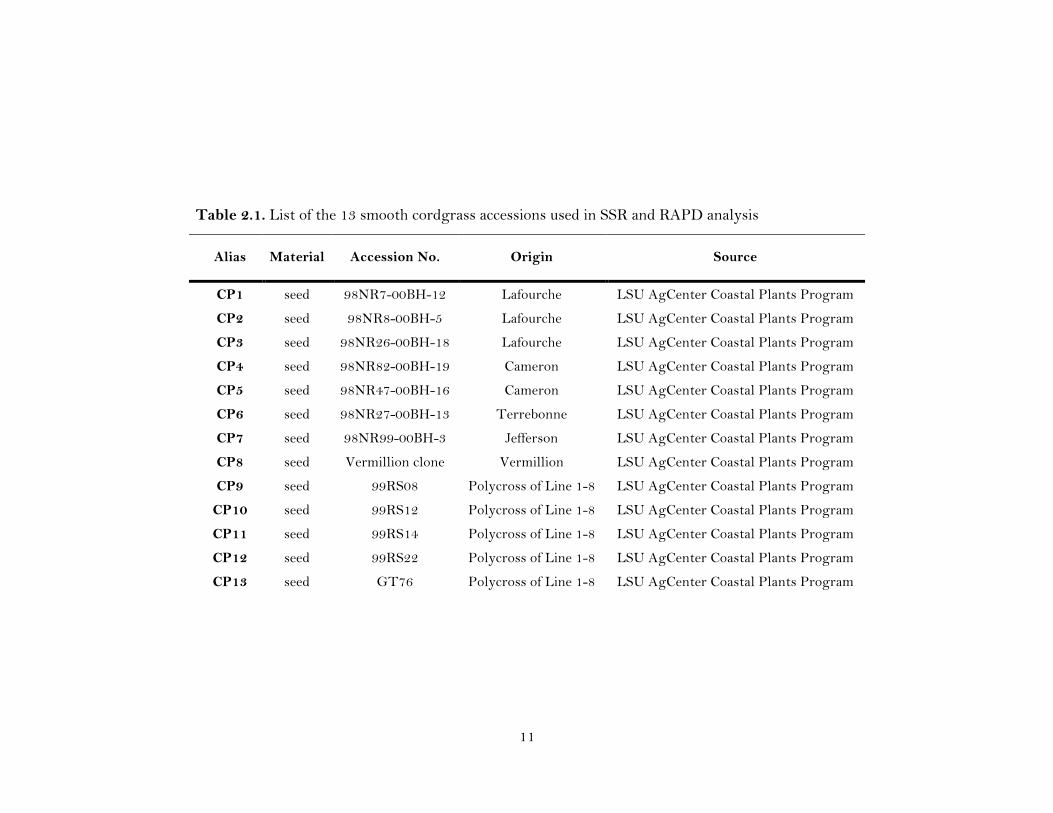
Table 2.1. List of the 13 smooth cordgrass accessions used in SSR and RAPD analysis
Alias Material Accession No. Origin Source
CP1 seed 98NR7-00BH-12 Lafourche LSU AgCenter Coastal Plants Program
CP2 seed 98NR8-00BH-5 Lafourche LSU AgCenter Coastal Plants Program
CP3 seed 98NR26-00BH-18 Lafourche LSU AgCenter Coastal Plants Program
CP4 seed 98NR82-00BH-19 Cameron LSU AgCenter Coastal Plants Program
CP5 seed 98NR47-00BH-16 Cameron LSU AgCenter Coastal Plants Program
CP6 seed 98NR27-00BH-13 Terrebonne LSU AgCenter Coastal Plants Program
CP7 seed 98NR99-00BH-3 Jefferson LSU AgCenter Coastal Plants Program
CP8 seed Vermillion clone Vermillion LSU AgCenter Coastal Plants Program
CP9 seed 99RS08 Polycross of Line 1-8 LSU AgCenter Coastal Plants Program
CP10 seed 99RS12 Polycross of Line 1-8 LSU AgCenter Coastal Plants Program
CP11 seed 99RS14 Polycross of Line 1-8 LSU AgCenter Coastal Plants Program
CP12 seed 99RS22 Polycross of Line 1-8 LSU AgCenter Coastal Plants Program
CP13 seed GT76 Polycross of Line 1-8 LSU AgCenter Coastal Plants Program
12
2.2.3 Genetic Fingerprinting
2.2.3.1 RAPD Analysis
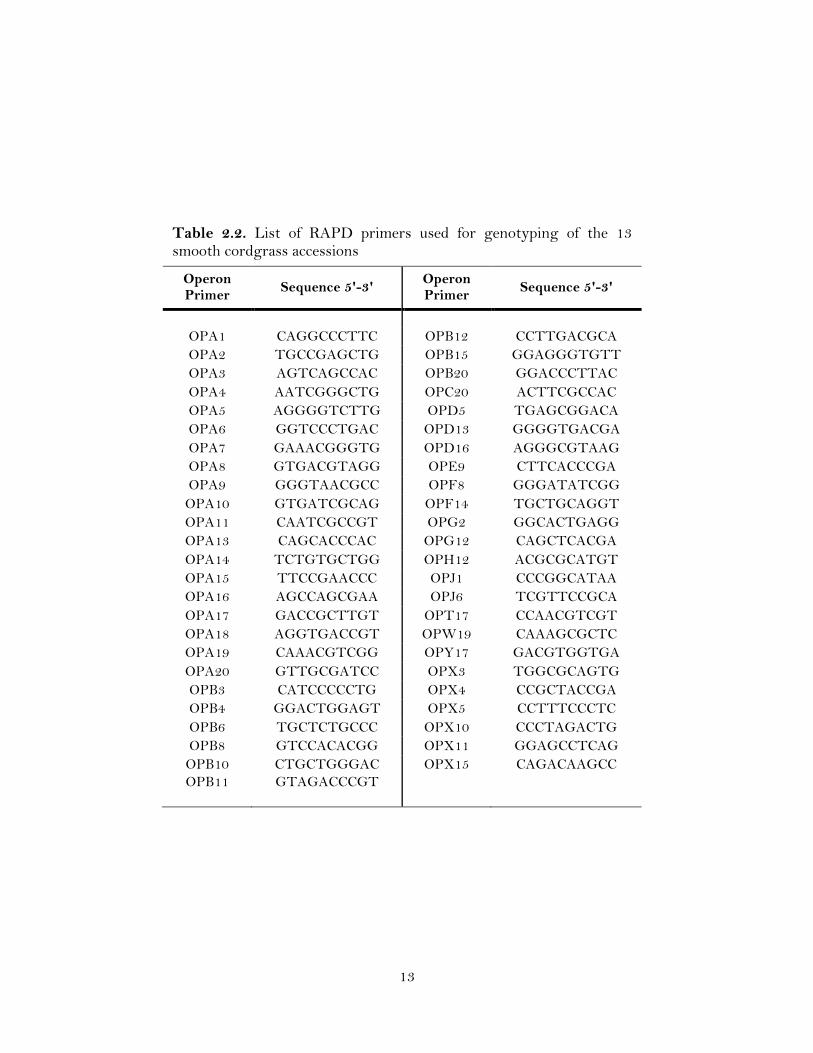
One hundred ng of genomic DNA was used as a template for polymerase chain
reaction (PCR) of the 13 smooth cordgrass accessions by forty-nine random primers
(Table 2.2) (Operon Technologies, Alameda, CA). All PCR reactions were conducted in
a final volume of 25 µl, containing 1X PCR buffer, 3 mM MgCl2, 0.2 mM dNTP mix,
0.5 µM of each primer, 1.0 U Taq DNA polymerase (Promega, Madison, WI) and
ddH2O. Amplifications were performed in a Thermocycler (BIORAD, Hercules, CA)
using a profile: (1) initial denaturation 94 oC, 3 min; (2) 45 cycles of 94 oC, 1 min; 36 oC,
1 min; 72 oC, 2 min; and (4) final extension 72 oC, 5 min. The amplified products were
resolved on a 1.5 % (w/v) agarose gel in 1X- TAE buffer following ethidium bromide
staining, and photographed using the KODAK Gel Logic 200 Imaging system (Kodak,
New Haven, CT).
2.2.3.2 SSR Analysis
Sixty one SSR primers (44 gSSR and 17 eSSR) were used to fingerprint the
smooth cordgrass accessions and five individual plants from each accession. The gSSR
markers were developed by Blum et al. (2004) and Sloop et al. (2005), and the eSSR
markers were developed by Baisakh et al. (2009). All PCR amplifications were carried
out in a 25 µl final reaction volume, containing 20 ng genomic DNA, 1X PCR buffer, 2.5
mM MgCl2, 0.2 mM dNTP mix, 0.5 µM of each primer, 1.0 U Taq DNA polymerase
(Promega, Madison, WI), and ddH2O. Amplifications were performed in a thermal
cycler (BIORAD, Hercules, CA) with the following amplification profile: (1) initial
denaturation 95 oC, 4 min; (2) 35 cycles of 94 oC, 45 s; Ta oC, 45 s; 72 oC, 1 min; and (4)
final extension 72 oC, 5 min. The amplified products were separated in a 4.5 % (w/v)
SFR agarose (Amresco, Solon, OH) gel in 1X- TAE buffer for 4.5 h at 110 V or 15 h at
45 V, and stained with ethidium bromide. Images were analyzed under UV light using
the KODAK Gel Logic 200 Imaging system (Kodak, New Haven, CT).
13
Operon Primer Sequence 5'-3' Operon
Primer Sequence 5'-3'
OPA1 CAGGCCCTTC OPB12 CCTTGACGCA OPA2 TGCCGAGCTG OPB15 GGAGGGTGTT OPA3 AGTCAGCCAC OPB20 GGACCCTTAC OPA4 AATCGGGCTG OPC20 ACTTCGCCAC OPA5 AGGGGTCTTG OPD5 TGAGCGGACA OPA6 GGTCCCTGAC OPD13 GGGGTGACGA OPA7 GAAACGGGTG OPD16 AGGGCGTAAG OPA8 GTGACGTAGG OPE9 CTTCACCCGA OPA9 GGGTAACGCC OPF8 GGGATATCGG
OPA10 GTGATCGCAG OPF14 TGCTGCAGGT OPA11 CAATCGCCGT OPG2 GGCACTGAGG OPA13 CAGCACCCAC OPG12 CAGCTCACGA OPA14 TCTGTGCTGG OPH12 ACGCGCATGT OPA15 TTCCGAACCC OPJ1 CCCGGCATAA OPA16 AGCCAGCGAA OPJ6 TCGTTCCGCA OPA17 GACCGCTTGT OPT17 CCAACGTCGT OPA18 AGGTGACCGT OPW19 CAAAGCGCTC OPA19 CAAACGTCGG OPY17 GACGTGGTGA OPA20 GTTGCGATCC OPX3 TGGCGCAGTG OPB3 CATCCCCCTG OPX4 CCGCTACCGA OPB4 GGACTGGAGT OPX5 CCTTTCCCTC OPB6 TGCTCTGCCC OPX10 CCCTAGACTG OPB8 GTCCACACGG OPX11 GGAGCCTCAG
OPB10 CTGCTGGGAC OPX15 CAGACAAGCC OPB11
GTAGACCCGT
Table 2.2. List of RAPD primers used for genotyping of the 13 smooth cordgrass accessions
14
2.2.4 Data Analysis
All visibly detectable polymorphic and monomorphic bands in the 13 accessions
of smooth cordgrass were scored for the presence (1) or absence (0) from the RAPD and
SSR profiles, and the data were converted into a binary matrix. The degree of
polymorphism for each RAPD and SSR marker was determined by measuring their
polymorphism information content (PIC), which was estimated using the formula
(Botstein et al., 1980): PIC = 2 fi (1- fi); where fi is the frequency of the amplified alleles
(bands present), and (1- fi) is the frequency of the null alleles (including no
amplification).
Pair-wise genetic similarity among individual accessions was analyzed for both
RAPD (GSRAPD) and SSR (GSSSR) markers using the Jaccard’s similarity coefficient of
the SIMQUAL module (Jaccard, 1908) of the Numerical Taxonomy System (NTSYSpc)
Version 2.2 software (Rohlf, 2005). The resultant matrix was employed for clustering
analysis to create a dendrogram (tree) based on the UPGMA (unweighted pair group
method with arithmetic means) with the SAHN module. Correlation between the two
matrices obtained with the RAPD and SSR marker types was estimated as a cophenetic
correlation coefficient (r) using the Mantel’s test of matrices comparison with 1000
permutations (Mantel, 1967). The MxComp module was used to compare the original
similarity matrix that was clustered with the cophenetic value matrix. Confidence for
each dendrogram was supported by a bootstrap analysis with 1000 iterations using
WinBoot software (Yap and Nelson, 1996).
Principal coordinate analysis (PCoA) was also performed to estimate the genetic
distance between each group of the accessions, based on the estimated similarities, using
the DCENTER, EIGEN and PROJ modules of the NTSYSpc program. To assess
variations among and within accessions of smooth cordgrass and the fixation index
(FST), an analysis of molecular variance (AMOVA) was performed using Arlequin v.3.5
(Excoffier et al., 2010), which allows the partition of the total variation into within- and
among- group variation components.
15
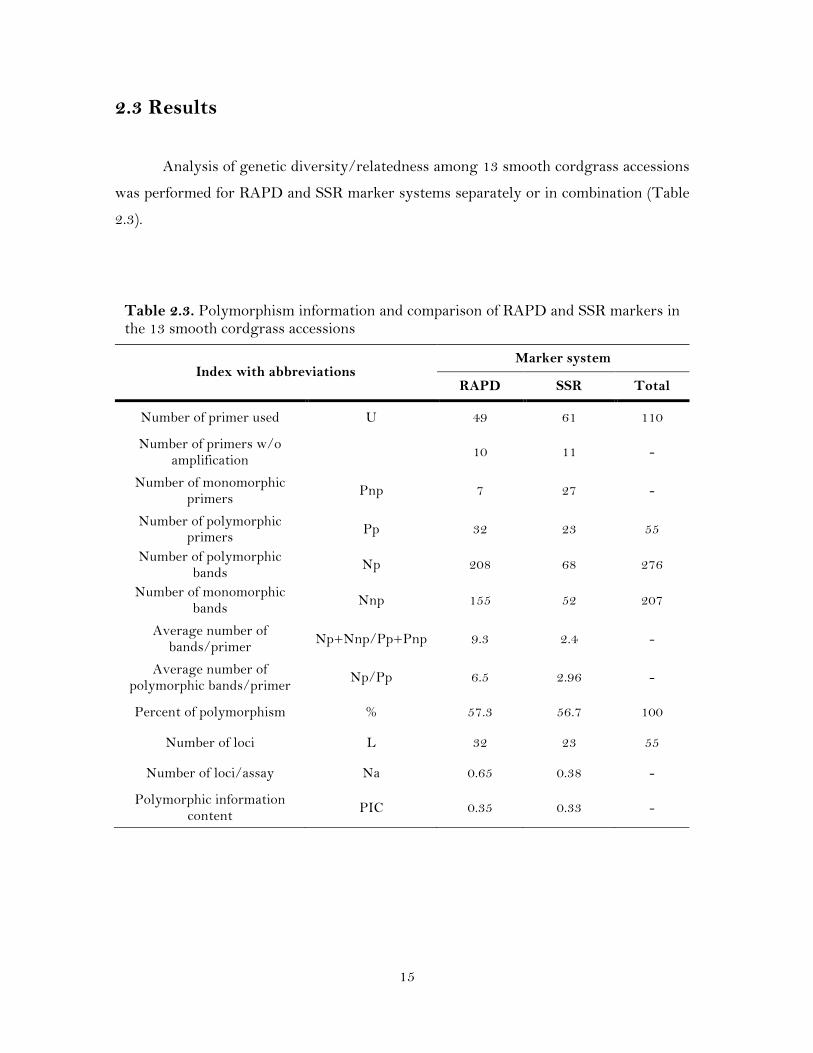
Table 2.3. Polymorphism information and comparison of RAPD and SSR markers in the 13 smooth cordgrass accessions
2.3 Results
Analysis of genetic diversity/relatedness among 13 smooth cordgrass accessions
was performed for RAPD and SSR marker systems separately or in combination (Table
2.3).
Index with abbreviations Marker system
RAPD SSR Total
Number of primer used U 49 61 110
Number of primers w/o amplification 10 11 -
Number of monomorphic primers Pnp 7 27 -
Number of polymorphic primers Pp 32 23 55
Number of polymorphic bands Np 208 68 276
Number of monomorphic bands Nnp 155 52 207
Average number of bands/primer Np+Nnp/Pp+Pnp 9.3 2.4 -
Average number of polymorphic bands/primer Np/Pp 6.5 2.96 -
Percent of polymorphism % 57.3 56.7 100
Number of loci L 32 23 55
Number of loci/assay Na 0.65 0.38 -
Polymorphic information content PIC 0.35 0.33 -
16
2.3.1 Level of Polymorphism by RAPD and SSR Markers
A total of 483 loci were amplified by 49 RAPD and 61 SSR primers, of which
276 (57.14%) were polymorphic. The number of loci per primer ranged from 5 to 25 for
RAPD (Table 2.4) and 2 to 9 for SSR (Table 2.5). The polymorphism of the 13 smooth
cordgrass accessions detected by RAPD markers was slightly higher than that detected
by SSR markers. Ten of the arbitrary RAPD primers did not result in reproducible
amplification, while the remaining 39 primers generated 363 fragments, with an average
of 9.3 fragments per primer (Table 2.3). Thirty two (65.3 %) out of the 39 primers were
polymorphic among the accessions that generated 208 (57.3 %) polymorphic loci (Table
2.3). Of the 61 SSR primers, eleven failed to amplify, while the remaining 50 primers
detected a total of 120 loci, with an average of 2.4 loci per primer (Table 2.3). Of these
120 bands, 68 (56.7 %) loci generated by 23 (37.7%) primer pairs were polymorphic
among the accessions (Table 2.3).
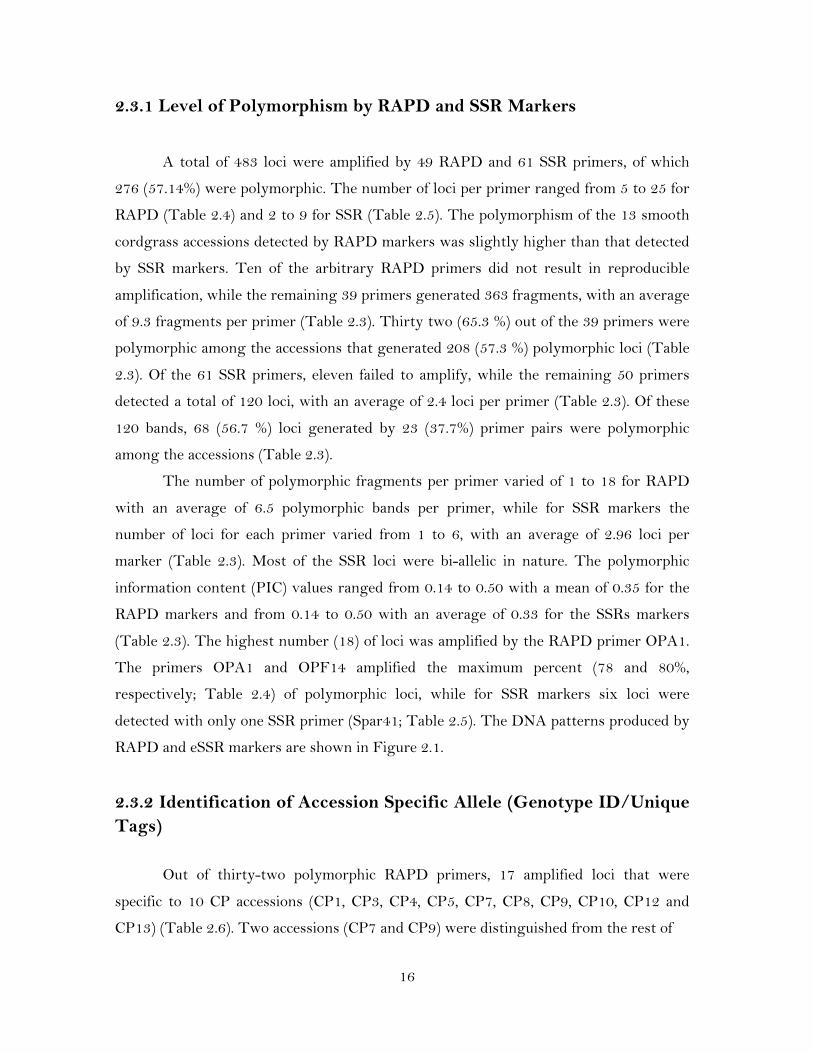
The number of polymorphic fragments per primer varied of 1 to 18 for RAPD
with an average of 6.5 polymorphic bands per primer, while for SSR markers the
number of loci for each primer varied from 1 to 6, with an average of 2.96 loci per
marker (Table 2.3). Most of the SSR loci were bi-allelic in nature. The polymorphic
information content (PIC) values ranged from 0.14 to 0.50 with a mean of 0.35 for the
RAPD markers and from 0.14 to 0.50 with an average of 0.33 for the SSRs markers
(Table 2.3). The highest number (18) of loci was amplified by the RAPD primer OPA1.
The primers OPA1 and OPF14 amplified the maximum percent (78 and 80%,
respectively; Table 2.4) of polymorphic loci, while for SSR markers six loci were
detected with only one SSR primer (Spar41; Table 2.5). The DNA patterns produced by
RAPD and eSSR markers are shown in Figure 2.1.
2.3.2 Identification of Accession Specific Allele (Genotype ID/Unique Tags)
Out of thirty-two polymorphic RAPD primers, 17 amplified loci that were
specific to 10 CP accessions (CP1, CP3, CP4, CP5, CP7, CP8, CP9, CP10, CP12 and
CP13) (Table 2.6). Two accessions (CP7 and CP9) were distinguished from the rest of
17
Table 2.4. Number of total fragments and polymorphism rate generated by the RAPD primers in the 13 smooth cordgrass accessions
RAPD Primer
Total Fragments
Polymorphic Fragments
Monomorphic Fragments
Polymorphism Rate (%)
OPA1 23 18 5 78 OPA2 13 7 6 54 OPA3 21 13 8 62 OPA4 25 14 11 56 OPA5 10 6 4 60 OPA7 11 6 5 55 OPA8 8 4 4 50
OPA13 9 4 5 44 OPA16 11 6 5 55 OPA17 8 4 4 50 OPA18 12 9 3 75 OPA19 13 9 4 69 OPA20 12 7 5 58 OPB3 12 7 5 58 OPB4 12 8 4 67 OPB6 11 6 5 55 OPB8 12 6 6 50
OPB10 9 4 5 44 OPB11 11 6 5 55 OPB12 12 8 4 67 OPB15 7 4 3 57 OPC20 10 6 4 60 OPF14 5 4 1 80 OPG2 7 1 6 14 OPH12 9 5 4 56 OPJ1 7 2 5 29 OPJ6 10 7 3 70
OPT17 10 5 5 50 OPX3 9 4 5 44 OPX4 11 7 4 64
OPX15 12 7 5 58 OPW19 11 4 7 36
Total
Mean
363
11
208
6.5
155
5
-
57.30
18
Table 2.5. Number of total fragments and polymorphism rate generated by the SSR primers in the 13 smooth cordgrass accessions
Polymorphic markers
Total Fragments
Polymorphic Fragments
Polymorphism (%)
eSSR21 5 2 40 eSSR29 6 2 33 eSSR35 6 3 50 eSSR58 5 2 40 eSSR64 2 1 50 SPAR4 6 2 33 SPAR5 5 2 40 SPAR6 6 5 83 SPAR7 7 3 43 SPAR8 6 5 83
SPAR10 5 3 60 SPAR11 8 4 50 SPAR18 6 4 67 SPAR23 2 1 50 SPAR27 4 2 50 SPAR28 2 1 50 SPAR30 2 2 100 SPAR31 7 5 71 SPAR34 7 5 71 SPAR37 4 2 50 SPAR38 2 1 50 SPAR41 8 6 75 SPAR43 9 5 56
Total
Mean
120
5
68
2.9
-
56.67

19
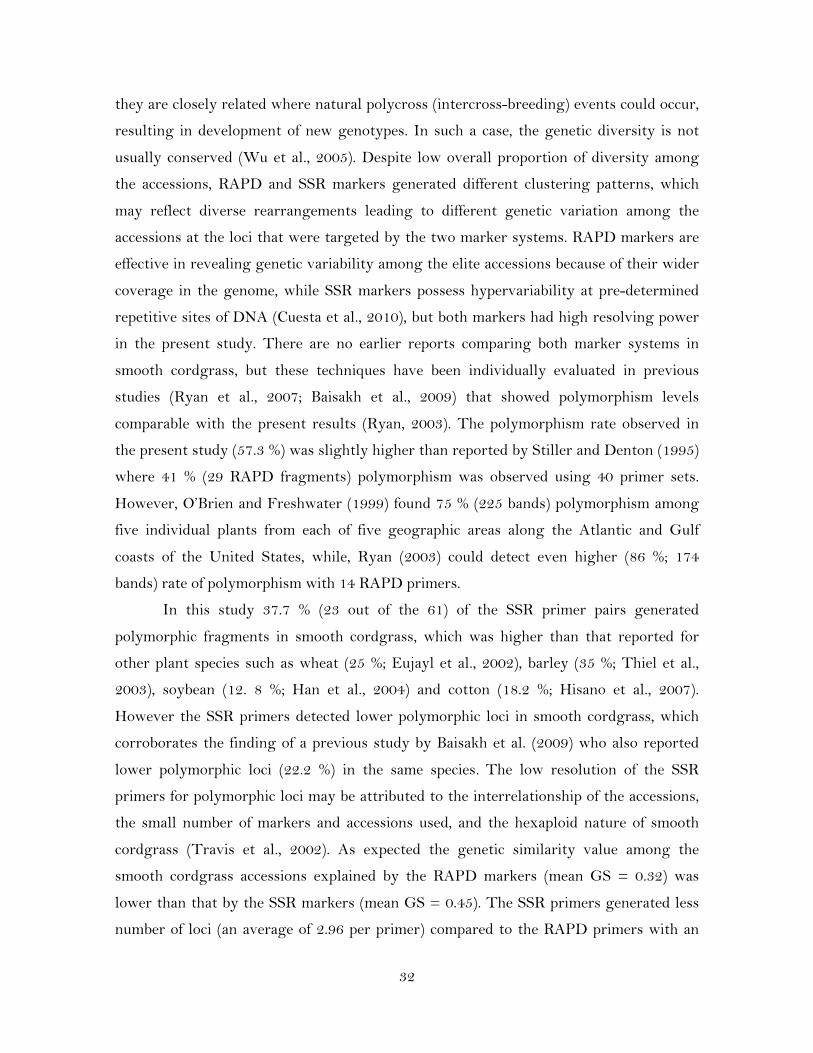
Figure 2.1. Representative gels showing fragment amplification from the 13 smooth cordgrass accessions by gSSR (Spar4; upper), eSSR (eSSR58; middle), and RAPD (OPA1; bottom) primers. Lane 1-13 = CP1-CP13 as in Table 2.1.
01 02 03 04 05 06 07 08 09 10 11 12 13
01 02 03 04 05 06 07 08 09 10 11 12 13
01 02 03 04 05 06 07 08 09 10 11 12 13
20
the accessions with a maximum number (9 and 12) of specific loci by seven (OPA1,
OPA2, OPA4, OPA18, OPA19, OPB12 and OPW19) and eight (OPA1, OPA2, OPA3,
OPT17, OPX3, OPX4, OPX15 and OPW19) primers, respectively, while three
accessions (CP1, CP3 and CP10) were distinguished by three primers each (OPA16,
OPX4, OPX15; OPB3, OPB11, OPT17; and OPA16, OPA18 and OPB12). The rest four
accessions (CP4, CP5, CP8 and CP13) amplified specific loci using only a single primer
(OPA3, OPW19, OPB3 and OPB10, respectively (Table 2.6).
Of the twenty-three polymorphic SSR primers, 10 (eSSR29, SPAR6, SPAR7,
SPAR8, SPAR28, SPAR31, SPAR34, SPAR38, SPAR41 and SPAR43) amplified loci
specific to five CP accessions (CP1, CP7, CP9, CP10 and CP12; Table 2.7). Six primers
(eSSR29, SPAR6, SPAR7, SPAR28, SPAR31 and SPAR38) amplified an allele specific
by four accessions (CP9, CP7, CP12, CP10). SPAR 34 produced alleles that are specific
to CP1, CP7, whereas SPAR8 and SPAR41 amplified identical alleles for CP9 and CP12.
SPAR43 amplified three alleles that were common to CP1, CP9, and CP12 (Table 2.7).
Three (CP7, CP9 and CP12) were separated from the rest of the accessions by
amplifying the maximum number (4) of specific loci by four primers (SPAR6, SPAR7,
SPAR34, SPAR38; eSSR29, SPAR8, SPAR41, SPAR43; and SPAR8, SPAR28, SPAR41
and SPAR43, respectively), while an allele specific to CP10 was amplified by a SSR
(SPAR31) primer (Table 2.7).
2.3.3 Genetic Similarity Based on RAPD and SSR Markers
The genetic similarities (GS) values, based on Jaccard’s coefficients, were
slightly different for RAPD and SSR markers among 13 accessions of smooth cordgrass.
GSRAPD ranged from 0.09 to 0.74. The similarity matrix indicated that the lowest
genetic similarity (0.09) was between the accessions CP7 and CP9, and the highest
similarity (0.74) was between CP13 and CP11 (Table 2.8a). GSSSR ranged from 0.06 to
1.00. The maximum genetic similarity (1.00) observed by SSR was between CP3 and
CP2, CP6 and CP4, and CP11 and CP13, while the lowest genetic similarity of 0.06 was
between CP9 and CP2, CP9 and CP3, and CP9 and CP5 (Table 2.8b). GSRAPD/SSR
ranged from 0.11 to 0.79 (Table 2.8c), with the maximum genetic similarity (0.79)
between CP11 and CP13, and the lowest genetic similarity (0.11) between CP4 and
21
CP9, and CP7 and CP10. GSSSR of the five individual plants from each of the 13
accessions of smooth cordgrass ranged from 0.03 to 1.00. The similarity matrix
indicated that the lowest GS (0.03) was between CP9 and CP2, and CP9 and CP3, while
the maximum GS observed by SSR was (1.00) between CP2 and CP3, CP2 and CP6, and
CP3 and CP6. The Mantel test resulted in a statistically significant positive correlation
coefficient (r = 0.86) between the similarity matrices produced by the RAPD and SSR
markers.
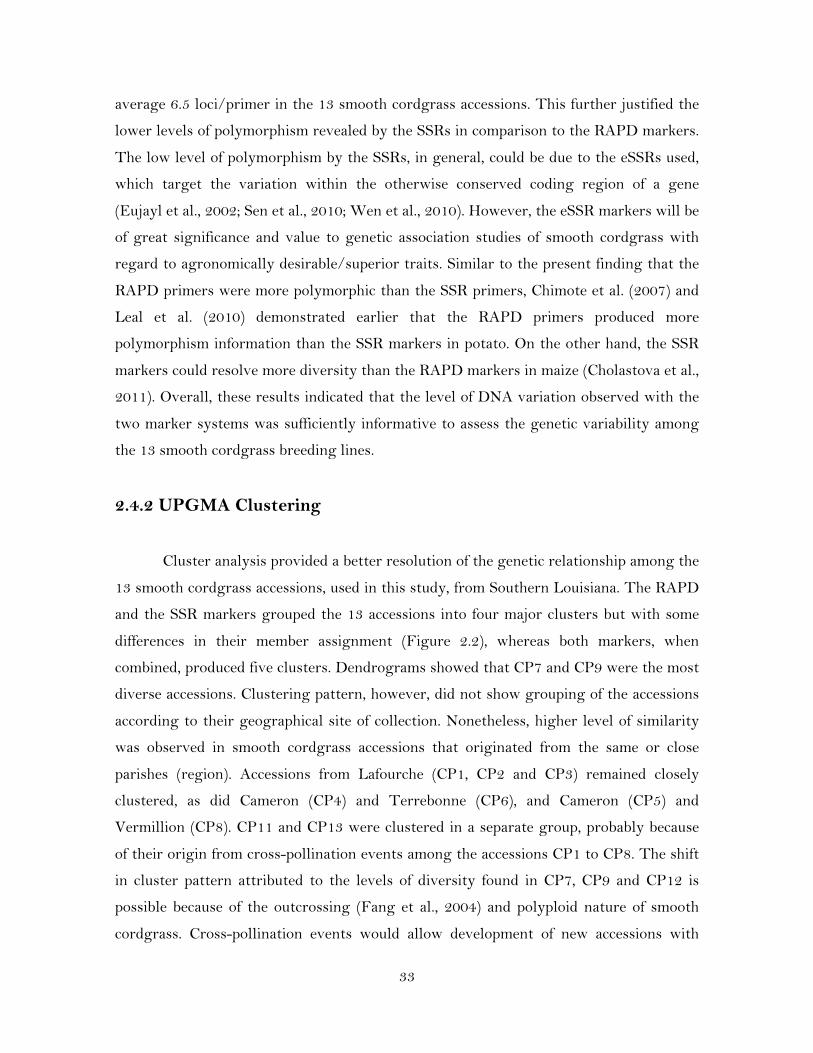
2.3.4 Cluster Analysis of the Smooth Cordgrass Accessions
Genetic similarity values generated by the RAPD and SSR polymorphic markers
were utilized to study and understand the genetic relationships among the 13 accessions
of smooth cordgrass by cluster analysis using the UPGMA method (Figure 2.2). The
cluster results indicated that the relationships among the accessions revealed by RAPD
markers were slightly different from that revealed by the SSR markers. The cluster
analysis of the accessions with RAPD markers (208 loci) resulted in four clusters at the
GS ≥ 0.19 (Figure 2.2). Five accessions (CP1, CP5, CP8, CP10 and CP9) formed one
Cluster (Cluster I); three accessions (CP11, CP13, and CP12) formed Cluster II; four
accessions (CP2, CP3, CP6, and CP4) formed Cluster III; and CP7 was the lone member
of Cluster IV. It can be observed from the dendrogram that within Cluster II, CP11 and
CP13 appeared to be closer to each other, with a similarity coefficient of 0.74 In
addition, it can be noted that CP7 and CP9 were the most diverse accessions within the
cluster analysis, with a similarity coefficient of 0.09.
Cluster analysis with SSR markers (68 Loci) separated the 13 accessions into
four Clusters (Figure 2.2). Five accessions (CP1, CP2, CP3, CP4, and CP6) formed the
Cluster I. Cluster II (CP7, CP9 and CP12) and Cluster III (CP5, CP8 and CP10)
consisted of three accessions each; and Cluster IV included CP11 and CP13.
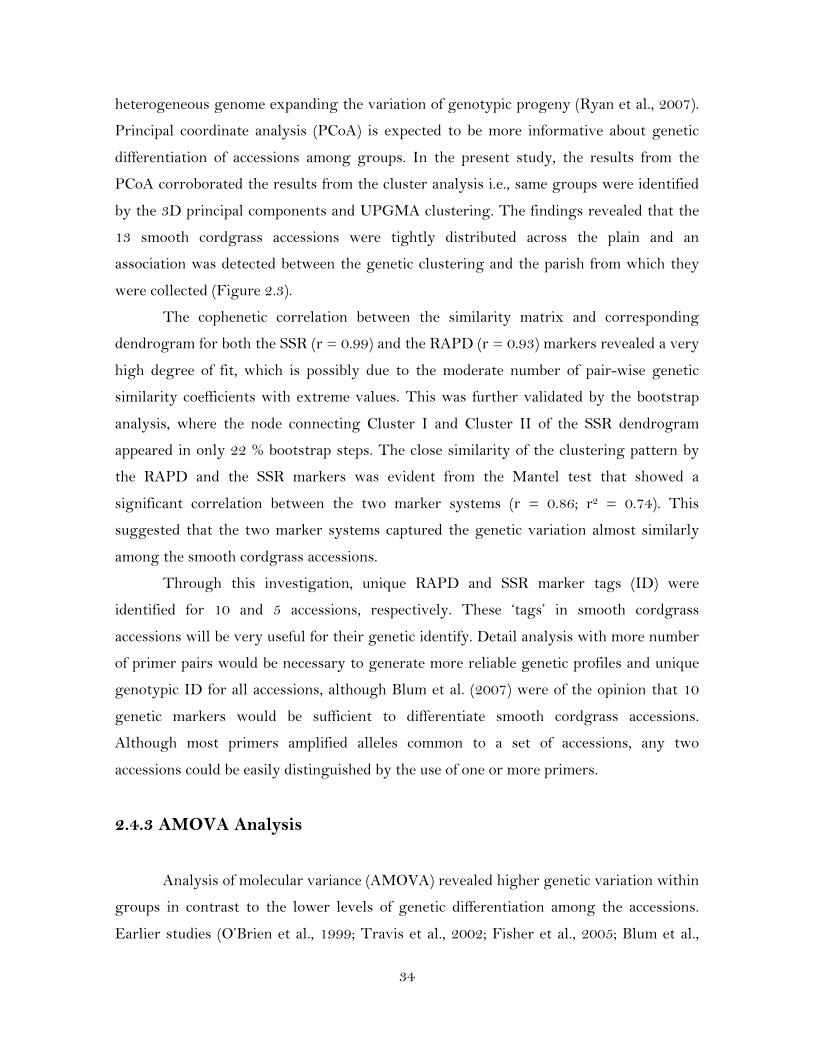
The RAPD and SSR data obtained for all 276 polymorphic loci were combined
to estimate genetic similarity and for UPGMA cluster analysis among the 13 accessions.
The Jaccard’s similarity coefficient values ranged from 0.11 to 0.79, and as seen in the
dendrogram the accessions were separated into five main clusters at GS > 0.20 (Figure
2.2). Cluster I was comprised of five accessions CP1, CP2, CP3, CP4, and CP6. Cluster
22
Table 2.6. Identification of accession-specific allele (unique tags) by RAPD primers
RAPD markers CP1 CP2 CP3 CP4 CP5 CP6 CP7 CP8 CP9 CP10 CP11 CP12 CP13
OPA1 ✓ ✓ ✓ OPA2 ✓ ✓ ✓ OPA3 ✓ ✓ OPA4 ✓
OPA13 ✓ OPA16 ✓ ✓ ✓ OPA18
✓ ✓ OPA19
✓ ✓ OPB3 ✓ ✓
OPB10 ✓
OPB11 ✓ OPB12 ✓
✓ OPT17 ✓ ✓ OPX3 ✓ ✓ OPX4 ✓ ✓
OPX15 ✓ ✓ OPW19 ✓ ✓ ✓
23
Table 2.7. Identification of accession-specific allele (unique tags) by SSR primers
SSR markers CP1 CP2 CP3 CP4 CP5 CP6 CP7 CP8 CP9 CP10 CP11 CP12 CP13
eSSR29 ✓ SPAR6 ✓ SPAR7 ✓ SPAR8 ✓ ✓
SPAR28 ✓ SPAR31 ✓ SPAR34 ✓ ✓ SPAR38 ✓ SPAR41 ✓ ✓ SPAR43 ✓ ✓ ✓
24
CP1 CP2 CP3 CP4 CP5 CP6 CP7 CP8 CP9 CP10 CP11 CP12 CP13
CP1 1.00 CP2 0.33 1.00 CP3 0.32 0.55 1.00 CP4 0.17 0.38 0.40 1.00 CP5 0.30 0.19 0.23 0.22 1.00 CP6 0.18 0.52 0.47 0.49 0.21 1.00 CP7 0.18 0.23 0.17 0.16 0.19 0.31 1.00 CP8 0.30 0.21 0.22 0.20 0.68 0.24 0.20 1.00 CP9 0.23 0.18 0.16 0.11 0.24 0.13 0.09 0.21 1.00
CP10 0.23 0.13 0.21 0.14 0.50 0.15 0.10 0.50 0.26 1.00 CP11 0.19 0.22 0.21 0.18 0.23 0.20 0.15 0.28 0.24 0.35 1.00 CP12 0.16 0.19 0.23 0.19 0.19 0.26 0.19 0.20 0.23 0.28 0.36 1.00 CP13 0.15 0.17 0.18 0.16 0.19 0.16 0.13 0.20 0.21 0.29 0.74 0.36 1.00
CP1 CP2 CP3 CP4 CP5 CP6 CP7 CP8 CP9 CP10 CP11 CP12 CP13
CP1 1.00 CP2 0.29 1.00 CP3 0.29 1.00 1.00 CP4 0.24 0.89 0.89 1.00 CP5 0.19 0.12 0.12 0.12 1.00 CP6 0.24 0.89 0.89 1.00 0.12 1.00 CP7 0.16 0.09 0.09 0.12 0.12 0.12 1.00 CP8 0.16 0.12 0.12 0.12 0.90 0.12 0.12 1.00 CP9 0.13 0.06 0.06 0.10 0.06 0.10 0.21 0.09 1.00
CP10 0.16 0.12 0.12 0.12 0.81 0.12 0.12 0.90 0.09 1.00 CP11 0.12 0.09 0.09 0.09 0.15 0.09 0.15 0.19 0.13 0.19 1.00 CP12 0.17 0.21 0.21 0.17 0.09 0.17 0.20 0.09 0.32 0.09 0.09 1.00 CP13 0.12 0.09 0.09 0.09 0.15 0.09 0.15 0.19 0.13 0.19 1.00 0.09 1.00
Table 2.8a. Jaccard's similarity coefficient matrix of the 13 smooth cordgrass accessions based on the RAPD markers
Table 2.8b. Jaccard's similarity matrix coefficient of the 13 smooth cordgrass accessions based on the SSR markers
25
CP1 CP2 CP3 CP4 CP5 CP6 CP7 CP8 CP9 CP10 CP11 CP12 CP13
CP1 1.00 CP2 0.32 1.00 CP3 0.31 0.63 1.00 CP4 0.19 0.48 0.49 1.00 CP5 0.28 0.17 0.20 0.19 1.00 CP6 0.19 0.59 0.55 0.59 0.19 1.00 CP7 0.18 0.19 0.15 0.15 0.17 0.26 1.00 CP8 0.27 0.19 0.20 0.18 0.72 0.21 0.18 1.00 CP9 0.21 0.15 0.14 0.11 0.19 0.13 0.12 0.18 1.00
CP10 0.21 0.13 0.19 0.14 0.56 0.15 0.11 0.57 0.22 1.00 CP11 0.17 0.19 0.18 0.16 0.21 0.17 0.15 0.26 0.22 0.31 1.00 CP12 0.16 0.19 0.22 0.18 0.16 0.24 0.19 0.18 0.25 0.23 0.29 1.00 CP13 0.14 0.15 0.16 0.14 0.18 0.14 0.14 0.20 0.19 0.26 0.79 0.30 1.00
Table 2.8c. Jaccard's similarity coefficient matrix of the 13 smooth cordgrass accessions based on SSR+RAPD markers
26
II comprised one accession CP7. Cluster III (CP5, CP8, and CP10) and Cluster IV (CP11,
CP13, and CP12) comprised of three accessions each. Cluster V was formed by a single
accession CP9, which showed low similarity (GS ~0.20) with other accessions.
Cluster analysis with the fingerprint data of 5 individual plants within each of the
13 accessions also resulted in four clusters at GS > 0.20. Four accessions, CP1, CP2, CP3,
and CP6, formed Cluster I. Cluster II (CP5, CP8 and CP10), Cluster III (CP4, CP12, and
CP7), and Cluster IV (CP9, CP11 and CP13) was composed of three accessions each.
Accessions CP2, CP3, and CP6 were genetically identical with a similarity coefficient of
1.00.
The clustering pattern of the accessions, genotyped with only SSR markers, was
similar to that when SSR and RAPD markers were combined together. However, the
RAPDs markers generated a slightly different dendrogram with some variation in the
clustering of smooth cordgrass accessions. The correlation between the matrices of
cophenetic correlation values was used to check the goodness of fit of the cluster analysis.
The goodness of fit of the UPGMA dendrogram was confirmed by the highly significant
correlation values for RAPD (r = 0.93), SSR (r = 0.99), and RAPD+SSR (r = 0.97). The
statistically significant, high cophenetic correlation coefficients (r) validated a good
representation of the relationship between the dendrogram clusters and the similarity
matrices.
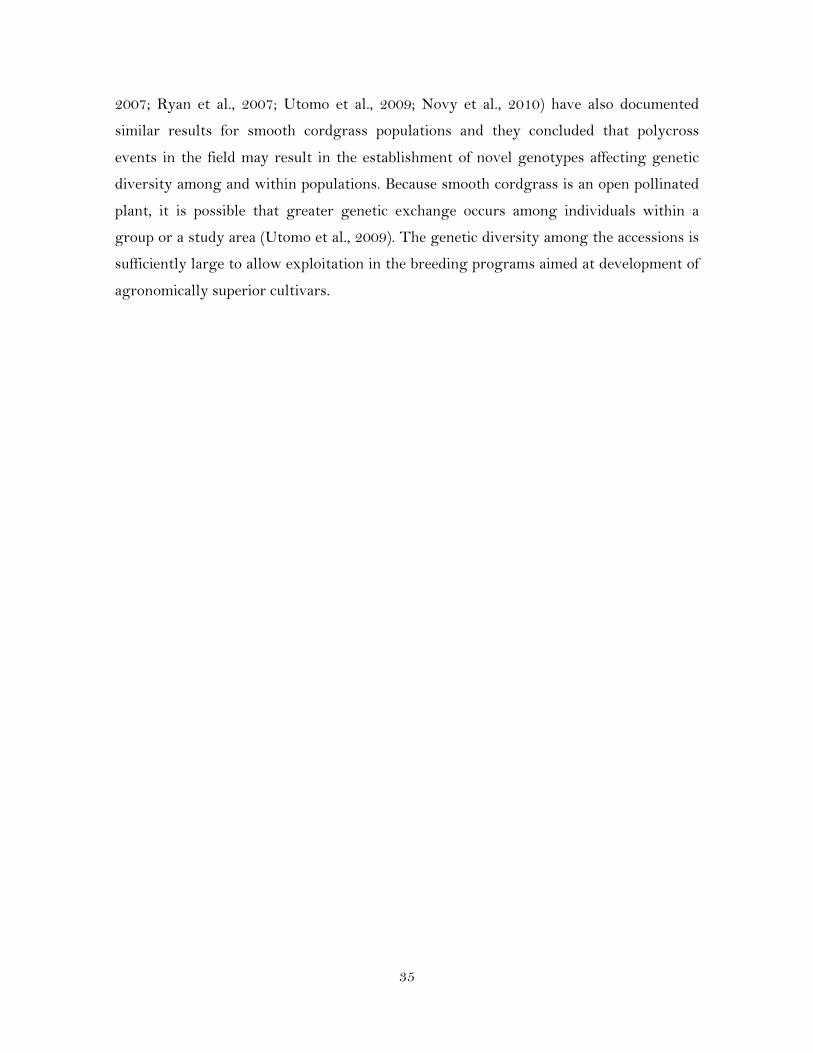
In order to generate a more comprehensive representation of the relationships
among the accessions, a principal coordinate analysis (PCoA) was performed with the
genetic similarity matrices generated by RAPD, SSR and RAPD+SSR markers in smooth
cordgrass. PCoA separated the accessions into groups similar to the ones obtained with
UPGMA cluster analysis (Figure 2.3). The three coordinates accounted for 7.13 % of the
variation with RAPD, 8.87 % with SSR, and 7.37 % with RAPD+SSR markers. 29.87 %
variation was observed among the five individual plants within each of the 13 accessions
as resolved through the SSR markers.
2.3.5 Analysis of Molecular Variance
Analysis of molecular variance (AMOVA) was performed to assess the variation
among and within the smooth cordgrass accessions, using the genetic distance matrix
27
generated by SSR markers. Partitioning of the total variation by AMOVA indicated that
SSR markers explained for 38 % (FST = 0.38) of the total genetic variations attributed
among 13 smooth cordgrass accessions. Conversely, 62 % of the variation was explained
by the differences among individual plants (Table 2.9). These variation components were
highly significant (P<0.001) based on the permutation test, and it suggests the presence
of enough genetic variation within the accessions for further exploitation in breeding
program.
2.4 Discussion
Evaluation of the genetic diversity/relatedness within a breeding germplasm pool
has become crucial and DNA markers are central to germplasm characterization and
conservation, and long-term management that require an understanding of the genetic
structure of a population (Zaghloul et al., 2006). The extent of genetic diversity in a
species determines its ability to adapt to changing environmental challenges (Anand et
al., 2004). Smooth cordgrass has a potential to quickly adapt to different ecology systems
and therefore is considered an environmental engineer helping in coastal erosion control
and marsh restoration (Utomo et al., 2009).
Different marker systems, by virtue of their unique properties, can reflect various
aspects of genetic diversity (Karp and Edwards, 1997). In this research, two different
marker systems, RAPD and SSR, were used to compare and define genetic relationships
among 13 smooth cordgrass accessions.
2.4.1 Polymorphism in Smooth Cordgrass
Genotyping data with 13 smooth cordgrass accessions indicated that a higher
proportion of RAPD primers were polymorphic than the SSR primers and the RAPD
primers produced higher average number (9.3) of alleles/primer compared to SSR (2.4).
However, the percentage of the polymorphic fragments and the PIC values of the RAPD
and SSR polymorphic markers were not significantly different (Table 2.3). Although the
13 smooth cordgrass accessions have their origin in different Parishes of Louisiana (Table
2.1), the relatively low level of polymorphism among them may be due to the fact that
28
!"#$$%&%#'(!"#! !"$% !"&& !"'# !"%(
))))))
)*+#)
)*+,)
)*+()
)*+#!)
)*+-)
)*+##)
)*+#.)
)*+#$)
)*+$)
)*+.)
)*+')
)*+&)
)*+%)
!"#$%
&&#$%
'$$#$%
()#$%
'$$#$%
&*#$%
!*#$%
"+#$%
*'#$%
&&#$%
"!#$%
,-!
!"#$$%&%#'(!"!# !"$% !"#& !"'( )"!!
******
*+,)*
*+,$*
*+,&*
*+,-*
*+,(*
*+,'*
*+,%*
*+,)$*
*+,#*
*+,.*
*+,)!*
*+,))*
*+,)&*
!""#"$
!""#"$
%&#"$
'!#"$
((#"$
)&#"$
!""#"$
!""#"$
&*#"$
''#"$
)!#"$
+,!
Figure 2.2. Cluster analysis of the 13 smooth cordgrass accessions with UPGMA based on Jaccard’s coefficient. A) Dendrogram for RAPD markers, B) Dendrogram for SSR markers.

29
!"#$$%&%#'(!"#$ !"%! !"$& !"'% !"&(
))))))
)*+#)
)*+,)
)*+%)
)*+$)
)*+')
)*+&)
)*+-)
)*+.)
)*+#!)
)*+##)
)*+#%)
)*+#,)
)*+()
!!"#$
%&"#$
'("#$
)#"#$
(##"#$
**"#$
(##"#$
(##"#$
+)"#$!("#$
&#"#$
,-!
!"#$$%&%#'()*+, )*,- )*./ )*01 +*))
22222222
2!3+4522!3+4,22!3+4-22!3+4.22!3+4/22!354522!354,22!354-22!354.22!354/22!3,4522!3,4,22!3,4-22!3,4.22!3,4/22!3/4522!3/4,22!3/4-22!3/4/22!3/4.22!3.4522!3.4/22!3.4-22!3.4.22!3.4,22!314522!314-22!314/22!314.22!314,22!3+)4522!3+)4.22!3+)4,22!3+)4/22!3+)4-22!3-4522!3-4/22!3-4.22!3-4,22!3-4-22!3+54522!3+54/22!3+54-22!3+54,22!3+54.22!304522!304-22!304.22!304,22!304/22!364522!364.22!364/22!364,22!364-22!3++4522!3++4.22!3++4,22!3++4/22!3++4-22!3+,4522!3+,4/22!3+,4,22!3+,4-22!3+,4.2
!"#$%
&$$#$%
"'#$%
&'#$%
"(#$%
&$$#$%
)"#$%
*+#$%
,*#$%
-.!
Figure 2.2. (Cont.). Cluster analysis of the 13 smooth cordgrass accessions with UPGMA based on Jaccard’s coefficient. C) Dendrogram for RAPD+SSRs, and D) Dendrogram for five individual plants within each of the 13 accessions.
30
12345678910111213
CP13
CP12
CP11
CP10
CP9
CP8CP7
CP6
CP5
CP4
CP3CP2
CP1
0.540.54
0.260.26
-‐0.02-‐0.02PCoA2PCoA2
-‐0.30-‐0.30
-‐0.28-‐0.28-‐0.59-‐0.59
-‐0.44-‐0.44
-‐0.05-‐0.05
-‐0.20-‐0.20
PCoA3PCoA3 0.180.18
0.410.41
PCoA1PCoA1
0.040.04
0.640.64
0.280.280.520.52
A)
12345678910111213
CP13
CP12
CP11CP10
CP9
CP8
CP7
CP6
CP5
CP4CP3CP2
CP1
0.610.61
0.310.31
0.020.02PCoA2PCoA2
-‐0.27-‐0.27
-‐0.56-‐0.56-‐0.52-‐0.52
-‐0.54-‐0.54
-‐0.25-‐0.25
PCoA3PCoA30.030.03
-‐0.24-‐0.24
0.300.30
0.570.57
PCoA1PCoA1
0.070.07
0.370.37
0.670.67
B)
Figure 2.3. Three dimensional principal coordinate analysis (PCoA) plot of the 13 smooth cordgrass accessions based on RAPD (A), SSR (B) makers.
31
Figure 2.3. (Cont.). Three dimensional principal coordinate analysis (PCoA) plot of the 13 smooth cordgrass accessions based on RAPD+SSR (C) makers.
Table 2.9. Analysis of molecular variance (AMOVA) for the 13 smooth cordgrass accessions
12345678910111213
CP13
CP12
CP11
CP10
CP9
CP8
CP7
CP6
CP5
CP4CP3CP2
CP1
0.530.53
0.240.24
PCoA2PCoA2-‐0.05-‐0.05
-‐0.34-‐0.34
-‐0.62-‐0.62-‐0.29-‐0.29
-‐0.46-‐0.46
-‐0.08-‐0.08
-‐0.20-‐0.20
PCoA3PCoA30.120.12
0.330.33
PCoA1PCoA1
0.050.05
0.530.53
0.300.30
0.550.55
Source of variation d.f Sum of
squares Variance
components Percentage of variation
Among
populations 3 10.096 0.18931 Va 38.11
Within
populations 61 18.75 0.30738 Vb 61.89
Total 64 28.846 0.49668
Fixation Index FST : 0.38114
d.f., degree of freedom;
C)
32
they are closely related where natural polycross (intercross-breeding) events could occur,
resulting in development of new genotypes. In such a case, the genetic diversity is not
usually conserved (Wu et al., 2005). Despite low overall proportion of diversity among
the accessions, RAPD and SSR markers generated different clustering patterns, which
may reflect diverse rearrangements leading to different genetic variation among the
accessions at the loci that were targeted by the two marker systems. RAPD markers are
effective in revealing genetic variability among the elite accessions because of their wider
coverage in the genome, while SSR markers possess hypervariability at pre-determined
repetitive sites of DNA (Cuesta et al., 2010), but both markers had high resolving power
in the present study. There are no earlier reports comparing both marker systems in
smooth cordgrass, but these techniques have been individually evaluated in previous
studies (Ryan et al., 2007; Baisakh et al., 2009) that showed polymorphism levels
comparable with the present results (Ryan, 2003). The polymorphism rate observed in
the present study (57.3 %) was slightly higher than reported by Stiller and Denton (1995)
where 41 % (29 RAPD fragments) polymorphism was observed using 40 primer sets.
However, O’Brien and Freshwater (1999) found 75 % (225 bands) polymorphism among
five individual plants from each of five geographic areas along the Atlantic and Gulf
coasts of the United States, while, Ryan (2003) could detect even higher (86 %; 174
bands) rate of polymorphism with 14 RAPD primers.
In this study 37.7 % (23 out of the 61) of the SSR primer pairs generated
polymorphic fragments in smooth cordgrass, which was higher than that reported for
other plant species such as wheat (25 %; Eujayl et al., 2002), barley (35 %; Thiel et al.,
2003), soybean (12. 8 %; Han et al., 2004) and cotton (18.2 %; Hisano et al., 2007).
However the SSR primers detected lower polymorphic loci in smooth cordgrass, which
corroborates the finding of a previous study by Baisakh et al. (2009) who also reported
lower polymorphic loci (22.2 %) in the same species. The low resolution of the SSR
primers for polymorphic loci may be attributed to the interrelationship of the accessions,
the small number of markers and accessions used, and the hexaploid nature of smooth
cordgrass (Travis et al., 2002). As expected the genetic similarity value among the
smooth cordgrass accessions explained by the RAPD markers (mean GS = 0.32) was
lower than that by the SSR markers (mean GS = 0.45). The SSR primers generated less
number of loci (an average of 2.96 per primer) compared to the RAPD primers with an
33
average 6.5 loci/primer in the 13 smooth cordgrass accessions. This further justified the
lower levels of polymorphism revealed by the SSRs in comparison to the RAPD markers.
The low level of polymorphism by the SSRs, in general, could be due to the eSSRs used,
which target the variation within the otherwise conserved coding region of a gene
(Eujayl et al., 2002; Sen et al., 2010; Wen et al., 2010). However, the eSSR markers will be
of great significance and value to genetic association studies of smooth cordgrass with
regard to agronomically desirable/superior traits. Similar to the present finding that the
RAPD primers were more polymorphic than the SSR primers, Chimote et al. (2007) and
Leal et al. (2010) demonstrated earlier that the RAPD primers produced more
polymorphism information than the SSR markers in potato. On the other hand, the SSR
markers could resolve more diversity than the RAPD markers in maize (Cholastova et al.,
2011). Overall, these results indicated that the level of DNA variation observed with the
two marker systems was sufficiently informative to assess the genetic variability among
the 13 smooth cordgrass breeding lines.
2.4.2 UPGMA Clustering
Cluster analysis provided a better resolution of the genetic relationship among the
13 smooth cordgrass accessions, used in this study, from Southern Louisiana. The RAPD
and the SSR markers grouped the 13 accessions into four major clusters but with some
differences in their member assignment (Figure 2.2), whereas both markers, when
combined, produced five clusters. Dendrograms showed that CP7 and CP9 were the most
diverse accessions. Clustering pattern, however, did not show grouping of the accessions
according to their geographical site of collection. Nonetheless, higher level of similarity
was observed in smooth cordgrass accessions that originated from the same or close
parishes (region). Accessions from Lafourche (CP1, CP2 and CP3) remained closely
clustered, as did Cameron (CP4) and Terrebonne (CP6), and Cameron (CP5) and
Vermillion (CP8). CP11 and CP13 were clustered in a separate group, probably because
of their origin from cross-pollination events among the accessions CP1 to CP8. The shift
in cluster pattern attributed to the levels of diversity found in CP7, CP9 and CP12 is
possible because of the outcrossing (Fang et al., 2004) and polyploid nature of smooth
cordgrass. Cross-pollination events would allow development of new accessions with
34
heterogeneous genome expanding the variation of genotypic progeny (Ryan et al., 2007).
Principal coordinate analysis (PCoA) is expected to be more informative about genetic
differentiation of accessions among groups. In the present study, the results from the
PCoA corroborated the results from the cluster analysis i.e., same groups were identified
by the 3D principal components and UPGMA clustering. The findings revealed that the
13 smooth cordgrass accessions were tightly distributed across the plain and an
association was detected between the genetic clustering and the parish from which they
were collected (Figure 2.3).
The cophenetic correlation between the similarity matrix and corresponding
dendrogram for both the SSR (r = 0.99) and the RAPD (r = 0.93) markers revealed a very
high degree of fit, which is possibly due to the moderate number of pair-wise genetic
similarity coefficients with extreme values. This was further validated by the bootstrap
analysis, where the node connecting Cluster I and Cluster II of the SSR dendrogram
appeared in only 22 % bootstrap steps. The close similarity of the clustering pattern by
the RAPD and the SSR markers was evident from the Mantel test that showed a
significant correlation between the two marker systems (r = 0.86; r2 = 0.74). This
suggested that the two marker systems captured the genetic variation almost similarly
among the smooth cordgrass accessions.
Through this investigation, unique RAPD and SSR marker tags (ID) were
identified for 10 and 5 accessions, respectively. These ‘tags’ in smooth cordgrass
accessions will be very useful for their genetic identify. Detail analysis with more number
of primer pairs would be necessary to generate more reliable genetic profiles and unique
genotypic ID for all accessions, although Blum et al. (2007) were of the opinion that 10
genetic markers would be sufficient to differentiate smooth cordgrass accessions.
Although most primers amplified alleles common to a set of accessions, any two
accessions could be easily distinguished by the use of one or more primers.
2.4.3 AMOVA Analysis
Analysis of molecular variance (AMOVA) revealed higher genetic variation within
groups in contrast to the lower levels of genetic differentiation among the accessions.
Earlier studies (O’Brien et al., 1999; Travis et al., 2002; Fisher et al., 2005; Blum et al.,
35
2007; Ryan et al., 2007; Utomo et al., 2009; Novy et al., 2010) have also documented
similar results for smooth cordgrass populations and they concluded that polycross
events in the field may result in the establishment of novel genotypes affecting genetic
diversity among and within populations. Because smooth cordgrass is an open pollinated
plant, it is possible that greater genetic exchange occurs among individuals within a
group or a study area (Utomo et al., 2009). The genetic diversity among the accessions is
sufficiently large to allow exploitation in the breeding programs aimed at development of
agronomically superior cultivars.

36
Chapter III Differential Expression of Genes and Genetic
Diversity for Cold Stress Response of Sugarcane (Saccharum spp Hybrids)
3.1 Introduction
Sugarcane (Saccharum spp hybrids), like other agricultural plants, has been grown
in many parts of the world for different purposes. It is used to satisfy human and animal
needs such as food, feed, fiber, fuel, and construction materials (D’Hont et al., 1998).
Sugarcane, being the main sugar-producing crop in the world, is considered an important
source of protein, carbohydrates and other nutrients. Sugarcane is a non-cereal grass
cultivated widely in tropical and subtropical regions of the world primarily for sugar and
sugar-derived ethanol, and recently has gained particular attention as a second
generation energy crop for cellulosic ethanol due to its high-biomass (Suman et al., 2011;
Pinto et al., 2010).
3.1.1 Taxonomy of Sugarcane
Sugarcane belongs to the complex genus Saccharum for its high degree of
polyploidy and interspecific origin (D’Hont et al., 1998). The Saccharum genus falls within
the grass family, Poaceae (Table 3.1; D’Hont et al., 1998), which also includes other
tropical grasses such as sorghum and maize (corn). Saccharum is composed of at least six
distinct species that includes S. spontaneum, S. robustum, S. officinarum, S. barberi, S. sinense,
and S. edule (Table 3.2; D’Hont et al., 1998). Saccharum spontaneum, also known as wild
cane, is a highly polymorphic with variable chromosome number (2n=40 to 128). This is
a disease-resistant species that produces little sugar and is also highly adapted to cold and
drought stress. On the other hand, Saccharum officinarum, otherwise known as the noble
cane, is a domesticated species with high sugar content and its chromosome number is
2n=80 (Cordeiro et al., 2007). Modern cultivars of sugarcane (Saccharum spp.) are hybrid
complexes derived from crosses between S. officinarum and S. spontaneum (Edmé et al.,
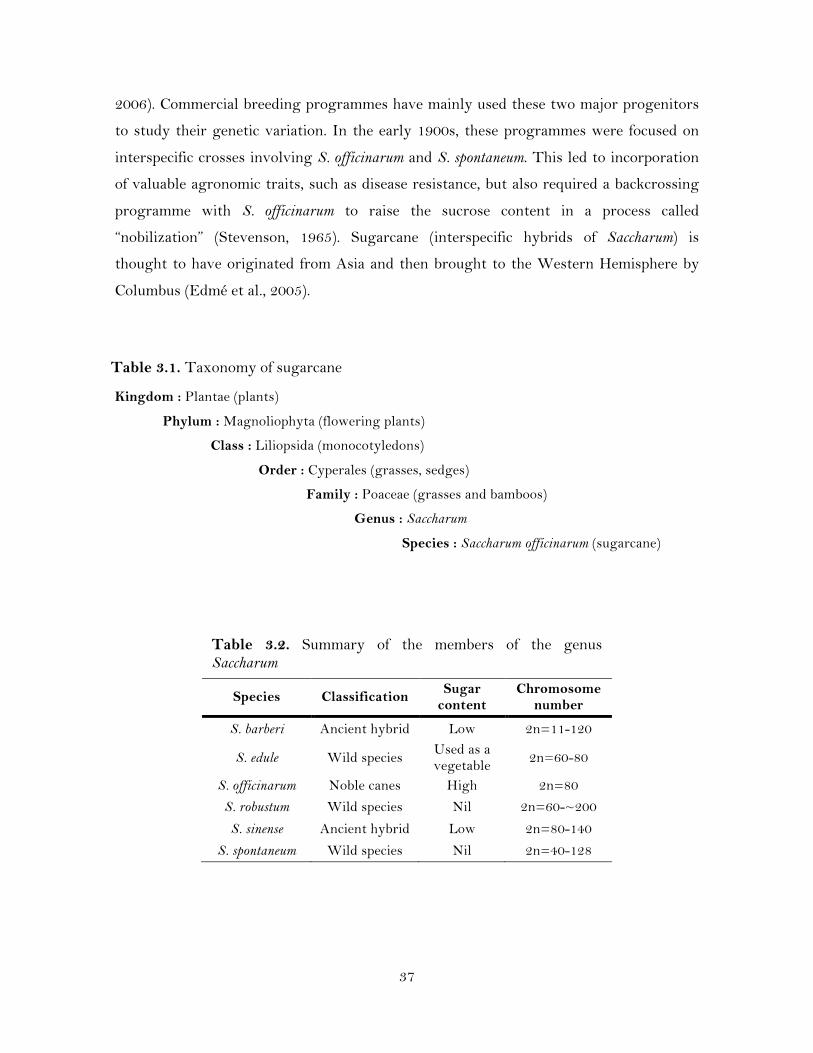
37
2006). Commercial breeding programmes have mainly used these two major progenitors
to study their genetic variation. In the early 1900s, these programmes were focused on
interspecific crosses involving S. officinarum and S. spontaneum. This led to incorporation
of valuable agronomic traits, such as disease resistance, but also required a backcrossing
programme with S. officinarum to raise the sucrose content in a process called
“nobilization” (Stevenson, 1965). Sugarcane (interspecific hybrids of Saccharum) is
thought to have originated from Asia and then brought to the Western Hemisphere by
Columbus (Edmé et al., 2005).
Kingdom : Plantae (plants)
Phylum : Magnoliophyta (flowering plants)
Class : Liliopsida (monocotyledons)
Order : Cyperales (grasses, sedges)
Family : Poaceae (grasses and bamboos)
Genus : Saccharum
Species : Saccharum officinarum (sugarcane)
Species Classification Sugar content
Chromosome number
S. barberi Ancient hybrid Low 2n=11-120
S. edule Wild species Used as a vegetable 2n=60-80
S. officinarum Noble canes High 2n=80
S. robustum Wild species Nil 2n=60-~200
S. sinense Ancient hybrid Low 2n=80-140
S. spontaneum Wild species Nil 2n=40-128
Table 3.1. Taxonomy of sugarcane
Table 3.2. Summary of the members of the genus Saccharum
38
3.1.2 Economic Importance
Sugarcane is the leading farm crop in Louisiana agriculture. Worldwide,
sugarcane is the main crop with an annual production of 1.69 billion tonnes of sugarcane
stalks (FAOSTAT, 2011; http://faostat.fao.org/). Sugarcane productivity differs widely
among different countries. USA occupies 11th place in sugarcane production (25 million
tonnes). Brazil is the largest producer with 719 million tonnes harvest in 2010 followed
by India (278 million tones), China (111 million tones), and Thailand (68 million tonnes
harvest; FAOSTAT, 2011). In USA, sugarcane occupies 5th place after maize, soybean,
wheat and sugar beet, with an annual production of more than 24 millions tons on 350 Ha
(FAOSTAT, 2011). In the United States, sugarcane is commercially grown in Florida,
Louisiana, Hawaii, and Texas. In Louisiana, sugarcane is grown in 23 Parishes with an
annual production of 14,000 tons with a cane yield ranging from 30 to 35 tons per acre
(NASS, 2011; http://www.nass.usda.gov/).
3.1.3 Cold Tolerance
The development and physiology of a plant is a well-coordinated program of gene
expression as a result of the interaction of its genome and its internal and external
environment (Kauffman et al., 2010). Sugarcane, being a (sub)tropical species, is sensitive
to low temperature (below 10 oC) and its growth and yield is affected when the growing
period coincides with a brief/prolonged cold period. Cold stress is one of the serious
abiotic factors that can cause adverse effects on the growth, productivity and
geographical distribution of crops such as sugarcane (Menossi et al., 2008). Because
sugarcane is normally grown in warm climate, it may not have developed the tactics to
avoid the effects of cold (Thomashow, 2001). However, genetic variability exists in
response to cold stress among the commercial sugarcane varieties (Du et al. 1999). In
Louisiana, sugarcane growing season coincides with infrequent freezing temperatures.
Therefore, Louisiana breeding program aims to incorporate cold tolerance as a valuable
trait in its strategy to develop improved sugarcane varieties. Integration of cold tolerance
in the sugarcane crop will allow expansion of its cultivation to colder regions.
39
3.1.4 Gene Expression Profiling
Differential gene expression is considered to be critical for the coordinated
development of new cells and tissues at a specific time, which is usually identified by
comparing cDNA copies of the steady-state mRNA populations under different
conditions (Casu et al., 2005). These cDNAs otherwise known as expressed sequence tags
(ESTs) represent the genes functioning at a specific time and tissue (Casu et al., 2004;
2005). Several molecular strategies such as representational difference analysis (RDA;
Lisitsyn et al., 1993), differential display (DD; Liang et al., 1992), serial analysis of gene
expression (SAGE; Velculescu et al., 1995), suppression subtractive hybridization (SSH;
Diatchenko et al., 1996), annealing control primer (ACP; Hwang et al., 2003), and cDNA
microarray have allowed the identification of differentially expressed genes (DEGs)
involved in stress responses.
In recent years ACP system has been used frequently to isolate DEGs in both
animals and plants (Kim et al., 2004; RamanaRao et al., 2011). The ACP method is an
innovative and improved tool for the specificity of PCR amplification. ACP has a unique
tripartite structure that contains a regulator between two different sequences, composed
of a polydeoxyinosine linker. This leads to formation of a bubble-like structure at specific
annealing temperatures and maximizes PCR specificity by preventing annealing of the
nontarget sequence to a template, and thus facilitates highly reproducible hybridization of
the primer to the target sequence (Hwang et al., 2003; Figure 3.1).
In sugarcane, SSH, cDNA microarrays, qRT-PCR, and SUSCEST data mining
have been used to study responses to cold (Nogueira et al., 2003; 2005), drought (Rocha
et al., 2007), and water deficit stress (Gupta et al., 2009). Nogueira et al. (2003), using
high-density filter arrays containing sugarcane ESTs, identified thirty-three genes that
were induced by low temperature (4 °C) stress. Nogueira et al. (2005) identified 26 non-
redundant genes encoding NAC domain proteins in sugarcane, and using RNA gel-blot
analysis they found that SsNAC23 was strongly induced by chilling stress in addition to
water stress and herbivory. The identification of genes regulated under cold-stress and
the study of their functional importance is necessary to develop cold-tolerant varieties.
With a long term goal of developing gene-based markers to facilitate the breeding of cold
tolerant sugarcane cultivars, the present study was started with the following objectives.
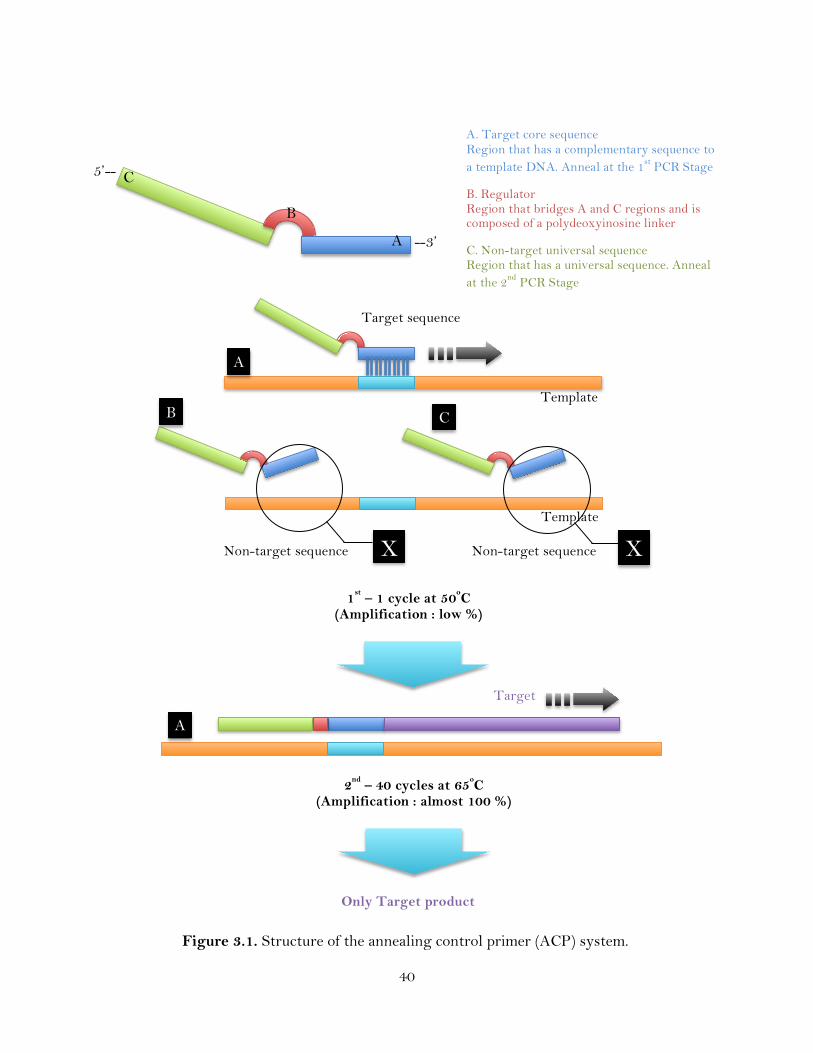
40
1st – 1 cycle at 50oC (Amplification : low %)
Target sequence
Template
Template
A
C B
X Non-target sequence X Non-target sequence
Target
A
2nd – 40 cycles at 65oC (Amplification : almost 100 %)
Only Target product
A
C
B
--3’
5’--
A. Target core sequence Region that has a complementary sequence to a template DNA. Anneal at the 1st PCR Stage
B. Regulator Region that bridges A and C regions and is composed of a polydeoxyinosine linker
C. Non-target universal sequence Region that has a universal sequence. Anneal at the 2nd PCR Stage
Figure 3.1. Structure of the annealing control primer (ACP) system.
41
3.1.5 Research Objectives
To identify and isolate differentially expressed genes (DEGs) from a cold tolerant
sugarcane clone in comparison to a cold sensitive clone through gene fishing
technique;
To identify the DEGs that are up/down-regulated under cold stress in the cold
tolerant sugarcane clone;
Study the genetic diversity among commercial sugarcane cultivars of Louisiana
using SSR markers derived from known cold responsive DEGs.
3.2 Materials and Methods
3.2.1 Plant Material, Treatment and RNA Isolation
Two sugarcane cultivars, which have previously been classified as tolerant (Ho02-
144) and sensitive (L79-1002) to cold stress, were used in this study. First-stubble plants
were established in the greenhouse at the Sugar Research Station, St. Gabriel, LA. One
month-old stubbles were exposed to cold stress during one week at a temperature of 0 oC
inside a growth chamber (Shel Lab, Cornelius, OR) maintained at 14 h day/10 h night
cycle. Control plants (no cold stress) were maintained in the greenhouse under natural
light regime. Young leaf samples were collected from both clones at different time
intervals 0 h (control), 24 h, 48 h, and 72 h after initiation of cold stress. All tissue
samples were immediately frozen in liquid nitrogen and stored at -80 oC for further RNA
isolation.
Total RNA was isolated from frozen leaf tissues of unstressed and cold-treated
sugarcane clones using RNeasy Plant Mini Kit (Qiagen, Valencia, CA). The total RNA
was quantified using a ND-1000 spectrophotometer (NanoDrop Technologies,
Wilmington, DE). An aliquot of 3 µg RNA extracted from leaf tissues at different
concentrations was pooled and stored at -80 oC for use in first strand cDNA preparation.
42
3.2.2 First-Strand cDNA Synthesis
First-strand cDNA was synthesized from 3 µg of the pooled total RNA of cold-
stressed and control leaf tissue of sensitive and tolerant clones using a Gene Fishing
DEG premix kit (Seegene, Rockville, MD) as described by RamanaRao et al. (2011).
Three µg of RNA was mixed with (dT)15-ACP1 primer in a final volume of 9.5 µl and was
incubated at 80 oC for 3 min followed by ice-chilling for 2 min. Reverse transcription was
performed for 90 min at 42 oC in a final reaction volume of 20 µl containing 4 µl of 5X
reaction buffer (Promega, Madison, WI), 5 µl of 2 mM dNTP mix, 2 µl of 10 µM cDNA
synthesis primer, oligo(dT)15-ACP1 (Seegene, Rockville, MD), 0.5 µl of RNasin RNase
Inhibitor 20 U/µl (Promega, Madison, WI), and 1 µl of Moloney murine leukemia virus
reverse transcriptase 200 U/µl (Promega, Madison, WI). First-strand cDNAs were 5X-
diluted by the addition of 80 µl of nuclease-free water.
3.2.3 ACP-based Gene Fishing PCR
Second-strand cDNA synthesis and the next two PCR round were conducted in a
single tube following RamanaRao et al. (2011). Second-strand cDNA synthesis was
conducted at 50 oC (low stringency) during the first-stage PCR in a final reaction volume
of 20 µl containing 3 µl (~50 ng) of the diluted first-strand cDNA, 10 µl of 2X SeeAmp
ACP master mix (Seegene, Rockville, MD), 2 µl of 5 µM arbitrary ACPs (Table 3.3), and
1 µl of 10 µM oligo(dT)15-ACP2. The first-stage PCR profile for second-strand synthesis
was one cycle of 94 oC for 1 min, followed by 50 oC for 3 min, and 72 oC for 1 min. The
second-stage PCR amplification profile was 40 cycles of 94 oC for 40 s, followed by 65 oC
for 40 s, 72 oC for 40 s, and a 5 min final extension at 72 oC. The amplified PCR products
were resolved in a 2 % agarose gel (Amresco, Solon, OH), stained with ethidium bromide,
and visualized under UV and documented in a Kodak Gel Logic200 system (Carestream
Health Inc, Rochester, NY). The differentially expressed genes (DEGs) were identified
based on their intensity or presence/absence, and were cut and extracted from the gel
using the QIAquick gel extraction kit (Qiagen, Valencia, CA).
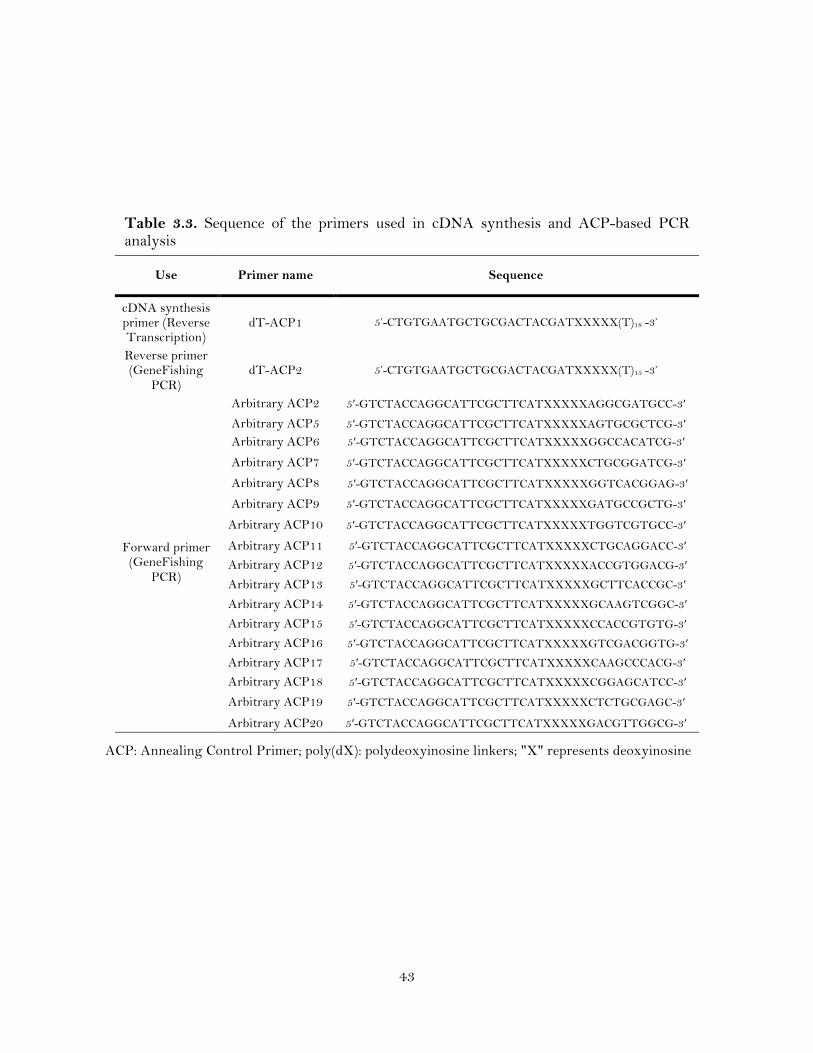
43
ACP: Annealing Control Primer; poly(dX): polydeoxyinosine linkers; "X" represents deoxyinosine
Table 3.3. Sequence of the primers used in cDNA synthesis and ACP-based PCR analysis
Use Primer name Sequence
cDNA synthesis primer (Reverse Transcription)
dT-ACP1 5’-CTGTGAATGCTGCGACTACGATXXXXX(T)18 -3’
Reverse primer (GeneFishing
PCR) dT-ACP2 5’-CTGTGAATGCTGCGACTACGATXXXXX(T)15 -3’
Forward primer (GeneFishing
PCR)
Arbitrary ACP2 5′-GTCTACCAGGCATTCGCTTCATXXXXXAGGCGATGCC-3′
Arbitrary ACP5 5′-GTCTACCAGGCATTCGCTTCATXXXXXAGTGCGCTCG-3′ Arbitrary ACP6 5′-GTCTACCAGGCATTCGCTTCATXXXXXGGCCACATCG-3′
Arbitrary ACP7 5′-GTCTACCAGGCATTCGCTTCATXXXXXCTGCGGATCG-3′
Arbitrary ACP8 5′-GTCTACCAGGCATTCGCTTCATXXXXXGGTCACGGAG-3′
Arbitrary ACP9 5′-GTCTACCAGGCATTCGCTTCATXXXXXGATGCCGCTG-3′
Arbitrary ACP10 5′-GTCTACCAGGCATTCGCTTCATXXXXXTGGTCGTGCC-3′
Arbitrary ACP11 5′-GTCTACCAGGCATTCGCTTCATXXXXXCTGCAGGACC-3′ Arbitrary ACP12 5′-GTCTACCAGGCATTCGCTTCATXXXXXACCGTGGACG-3′ Arbitrary ACP13 5′-GTCTACCAGGCATTCGCTTCATXXXXXGCTTCACCGC-3′
Arbitrary ACP14 5′-GTCTACCAGGCATTCGCTTCATXXXXXGCAAGTCGGC-3′
Arbitrary ACP15 5′-GTCTACCAGGCATTCGCTTCATXXXXXCCACCGTGTG-3′ Arbitrary ACP16 5′-GTCTACCAGGCATTCGCTTCATXXXXXGTCGACGGTG-3′ Arbitrary ACP17 5′-GTCTACCAGGCATTCGCTTCATXXXXXCAAGCCCACG-3′ Arbitrary ACP18 5′-GTCTACCAGGCATTCGCTTCATXXXXXCGGAGCATCC-3′
Arbitrary ACP19 5′-GTCTACCAGGCATTCGCTTCATXXXXXCTCTGCGAGC-3′
Arbitrary ACP20 5′-GTCTACCAGGCATTCGCTTCATXXXXXGACGTTGGCG-3′
44
3.2.4 Cloning and Analysis of cDNA
The DEG products were cloned using the pGEM-T Easy cloning kit (Promega,
Madison, WI) following the manufacturer’s instructions and the method described earlier
(Baisakh et al. 2006). The ligated products were transformed into competent Escherichia
coli DH5α cells; plated onto LB agar containing 100 µg/ml ampicillin, 1 mM isopropyl-β-
D-thiogalactopyranoside (IPTG), and 2% X-gal; and incubated at 37 oC overnight. White
colonies were picked up and grown overnight on LB liquid media supplemented with 100
µg/ml ampicillin. Plasmid DNA was isolated using a GeneJETTM Plasmid Miniprep Kit
(Fermentas, Glen Burnie, MD) and tested for the presence and size of inserts by PCR
using M13 universal primers. Plasmids with an insert size more than 300 bp were
sequenced with T7 primer in an ABI 3730x1 genetic analyzer (High-Throughput
Genomics Unit, Washington State University, WA).
The Vector sequence and the poly(A) tail was cleaned manually from the DNA
sequences. Then, functional annotation of the DEGs was performed by comparing the
sequences against the nonredundant nucleotide and protein database at the National
Center for Biotechnology Information (NCBI) using the Basic Local Alignment Search
Tool (BLASTN and BLASTX) (http://www.ncbi.nlm.nih.gov/BLAST). Sequence match
exceeding 50 nucleotides and more than 90% identity were considered significant and
used for further analysis. The functional classification of the DEGs was done using online
Gene Ontology (GO) resource (http://www.geneontology.org/).
3.2.5 Transcript Analysis of DEGs by Semi-quantitative Reverse Transcription Polymerase Chain Reaction
The expression pattern of five DEGs was validated by semi-quantitative reverse
transcription polymerase chain reaction (sqRT-PCR) following the method described
earlier (RamanaRao et al., 2011). Gene-specific primers were designed using Primer3Plus
web resource (http://www.bioinformatics.nl/cgi-bin/primer3plus/primer3plus.cgi), with
the annealing temperature (Ta) of each primer optimized to 58 oC. The elongation factor
gene (SoEF1α; GenBank Acc. # EF581011) from S. officinarum was used as an
45
endogenous reference gene. All the primers were synthesized by Integrated DNA
technologies (IDT Inc, Coralville, IA).
First-strand cDNA was synthesized with 1 µg of the total RNA isolated from leaf
tissues from the control (0 h) and cold-stressed plants of both L79-1002 and Ho02-144 at
24 h, 48 h, 72 h, using the iScript cDNA synthesis kit (Bio-Rad, Hercules, CA) according
to the manufacture’s instructions. One µl of the first-strand cDNA was amplified using
DEG-specific primers following the method of Baisakh et al. (2006) with the following
PCR profile: initial denaturation 95 oC, 3 min; 35 cycles of 95 oC, 1 min; 58 oC, 1 min; 72 oC, 1 min; and final extension 72 oC, 5 min. The amplification products were separated on
2 % agarose/EtBr (Amresco, Solon, OH) gels and analyzed under UV light using the Gel
Logic 200 Imaging system (Kodak, New Haven, CT). The PCR was repeated twice to
verify the reproducibility of the results.
3.2.6 Quantitative Reverse Transcription Polymerase Chain Reaction of DEGs
The relative abundance of five target genes, which represented up- and down-
regulation in ACP-PCR, quantitative real-time RT-PCR (qRT-PCR) was performed with
the same cDNA samples that were used for sqRT-PCR following the method described
earlier (Baisakh et al., 2008). Real-time RT-PCR analysis was carried out in triplicate in a
20 µl final reaction volume, containing 2 µl of first-strand cDNA, 10 µl of iQ SYBR
Green Supermix (Bio-Rad, Hercules, CA), 0.4 or 0.2 µM of each primer, and nuclease-free
water in a MyiQ real-time PCR analysis system (Bio-Rad, Hercules, CA). Real Time PCR
cycling condition was: initial denaturation at 95 oC, 30 sec; 40 cycles of 95 oC, 10 sec, and
60 oC, 30 sec; and a melt curve analysis with 71 cycles of 60 oC, 30 sec. The relative
expression of the mRNA (ratio) was calculated as ratio using the 2-ΔΔCt method (Pfaffl,
2001), where ΔCt = Ctcontrol – Ctstressed, and – ΔΔCt = ΔCtreference gene – ΔCttarget gene. The
elongation factor (SoEF1α) gene from S. officinarum (GenBank Acc. # EF581011) was
used as an endogenous reference gene.
46
3.2.7 Mining of Expressed Sequence Tags and Development of eSSR Markers
The FASTA sequences of sugarcane cold responsive ESTs (Nogueira et al., 2005)
were retrieved from the SUCEST (Sugarcane Expressed Sequence Tag) database
(Vettore et al., 2001) and mined to find all perfect SSR motifs using SSRIT (Simple
Sequence Repeat Identification Tool; http://www.gramene.org/microsat). A total of 12
primer pairs (eSSRs) flanking the SSR motifs were designed using the Primer3Plus portal
(http://www.bioinformatics.nl/cgi-bin/primer3plus/primer3plus.cgi) with default
parameters and a product size range of 150-200 bp. A M13 tail
(CACGACGTTGTAAAACGAC) was added to the 5’ end of all forward primers to
facilitate labeling of products during the PCR reaction. All primers were synthesized by
Integrated DNA technologies (IDT Inc, Coralville, IA).
3.2.8 Genotyping of Louisiana Sugarcane Cultivars Using eSSR Markers
Forty eight Louisiana sugarcane commercial clones, two clones of S. officinarum
and 14 clones of S. spontaneum were genotyped with 12 eSSR primers derived from the
genes responsive to cold tolerance. Genomic DNA isolated previously in the sugarcane
genetics laboratory was used for PCR. The annealing temperature of each primer pair
was determined using a temperature gradient ranging from 50 to 60 oC on a
Thermocycler (BIO-RAD). PCR reactions were performed in a final volume of 10 µl
containing 2 ng DNA, 1X PCR buffer, 2.5 mM MgCl2, 0.2 µM dNTP mix, 0.4 unit of Taq
DNA polymerase (Promega, Madison, WI), 0.75 µM of each primer, and ddH2O. PCR
conditions used were: initial denaturation at 95 oC for 5 min; 36 cycles of 95 oC for 45 sec,
50-60 oC for 45 sec, 72 oC for 1 min; and final extension at 72 oC for 5 min. PCR products
were detected by excitation of the fluorescence added during PCR reaction through
IRDye700/IRDye800-labeled primers for multiplexing, and were run on a 6.5% LI-COR
KBPlus polyacrylamide gel using a LI-COR Model 4300 DNA analyzer (LI-COR
Biosciences, Lincoln, NE). The gels were pre-run for 25 min. The PCR products were
denatured at 95 oC for 5 min and then quickly cooled on ice, and 0.2 µl sample were

47
loaded with a Hamilton multi-channel pipette (Hamilton, Reno, NV) in 25 cm gels. The
samples were electrophoresed at 1500 V, 40 W, 40 mA, and 45oC for 3 hours. Gel images
were saved as TIFF (tagged image file format) files for further analysis.
3.2.9 Polymorphism and Genetic Diversity Analysis
Bands were scored for presence (1) and absence (0) in an Excel spreadsheet
program. The polymorphism information content (PIC) value was calculated by using the
formula: PIC = 2 fi (1- fi), where fi is the frequency of the amplified alleles (bands
present), and (1- fi) is the frequency of the null alleles (including no amplification;
Botstein et al., 1980). The estimate of eSSR-based genetic similarity (GS) and the cluster
analysis among the 64 clones of sugarcane species was based on Jaccard’s similarity
coefficient (Jaccard, 1908) using the unweighted pair group method with arithmetic
means (UPGMA) in the NTSYSpc version 2.2 program (Rohlf, 2005). Principal
Coordinate Analysis (PCoA) was also used to validate the cluster distribution of the
sugarcane clones.
3.3 Results
3.3.1 Effect of Cold Stress on Saccharum spp. Hybrids
The effect of cold stress was apparent in the cold tolerant (Ho092-144) and the
cold sensitive (L79-1002) clone from the loss of chlorophyll (Figure 3.2). After one week
under 0 °C the plants were transferred to the greenhouse under normal growth
conditions. In Ho02-144 new tillers started to emerge after two weeks but the sensitive
clone did not produce any new tiller inside the greenhouse. The leaves and stems of the
sensitive clone withered with time leading to the death of the plant.
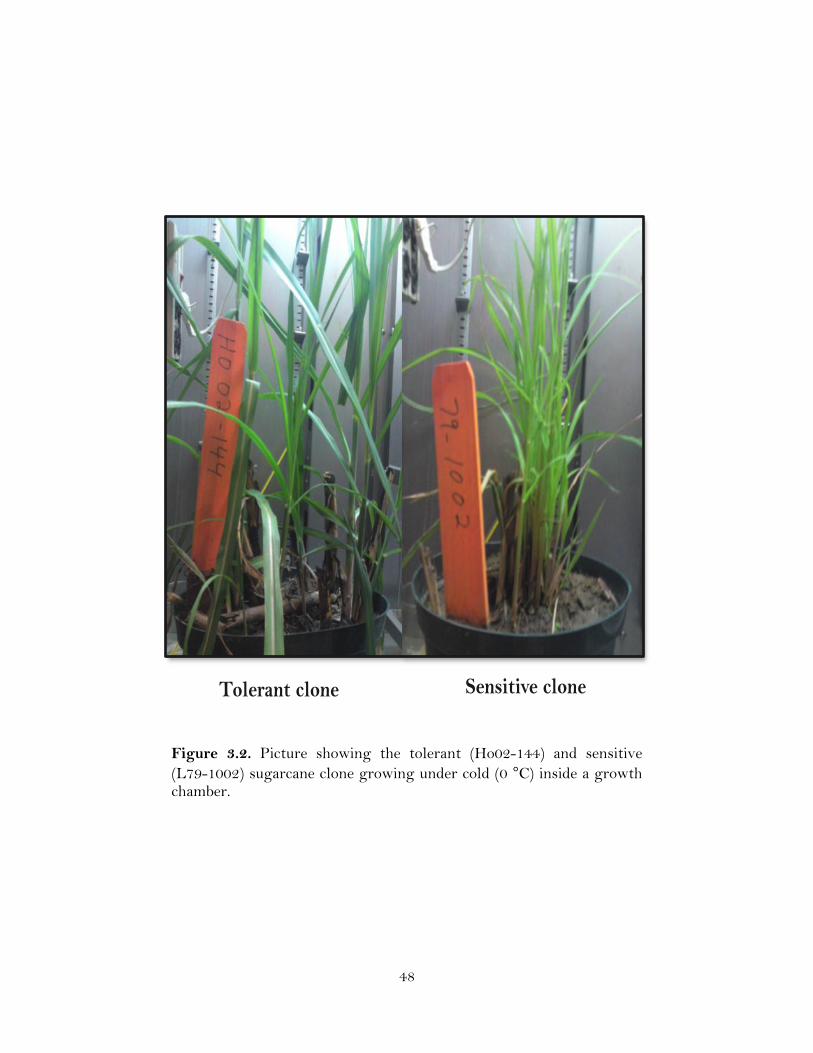
48
Figure 3.2. Picture showing the tolerant (Ho02-144) and sensitive (L79-1002) sugarcane clone growing under cold (0 °C) inside a growth chamber.
Tolerant clone Sensitive clone
Cold stress at 0oC
49
3.3.2 Differentially Expressed Genes Under Cold Stress in Two Sugarcane Clones
To study the molecular response of sugarcane to cold stress, RNA isolated from
cold-treated (24 h, 48 h, 72 h) and untreated (control) leaf tissues of a cold tolerant clone
(Ho02-144) and cold sensitive clone (L79-1002) were subjected to ACP analysis using 17
primers and two anchored oligo (dT) primers (Figure 3.3 and Table 3.3). A total of 27,
and 13 DEG fragments showed a differential expression pattern between cold-treated
and untreated plants of Ho02-144 and 79-1002, respectively. Of these forty DEGs, 11
exhibited lower signal intensity (downregulated genes) under cold-stress and the
remaining twenty-nine exhibited increased signal intensity (upregulated genes), which
were selected for further analysis.
3.3.3 Functional Annotation of the Differentially Expressed Genes
The sugarcane differentially expressed genes were named as SuDEGs followed by
the clone number. The putative biological functions of the 29 cold-responsive SuDEGs
were assigned after comparing their sequences against the GenBank database
(www.nbci.nlm.nih.gov) (Table 3.4). These DEGs belonged to different gene families
related to biological processes or molecular function as was determined from annotation
of their gene ontology (GO; Table 3.4). Similarity search of the SuDEG sequences
(Query) with those in the database (subject) revealed four different classes of genes. The
first class consisted of 15 DEGs that showed matches to oxidative and cold-responsive
genes that were previously identified in other organisms. These included Cyclophilin
(CyP), 14-3-3-like protein (GF14-6), calcium transporter 1 (TRPV6), heat shock protein
23 (hsp23), cell division protease (FTSH-5), mitochondrial heat shock protein 60 (hsp60),
a putative DEAD box ATP-dependent RNA helicase (ddx), a putative phenoloxidase
activating factor (ppaf), a vitamin C defective 2 (VTC2) gene, cytochrome P450-related
protein (CytP450), and NADP dehydrogenase quinone 1 (NDH1) (Table 3.4). The
second class included four DEGs, which were not previously designated as being
expressed under cold stress. Among these were a thylakoid assembly4 protein (THA4),
which is involved in transport in thylakoid membrane (Walker et al., 1999), an UDP-
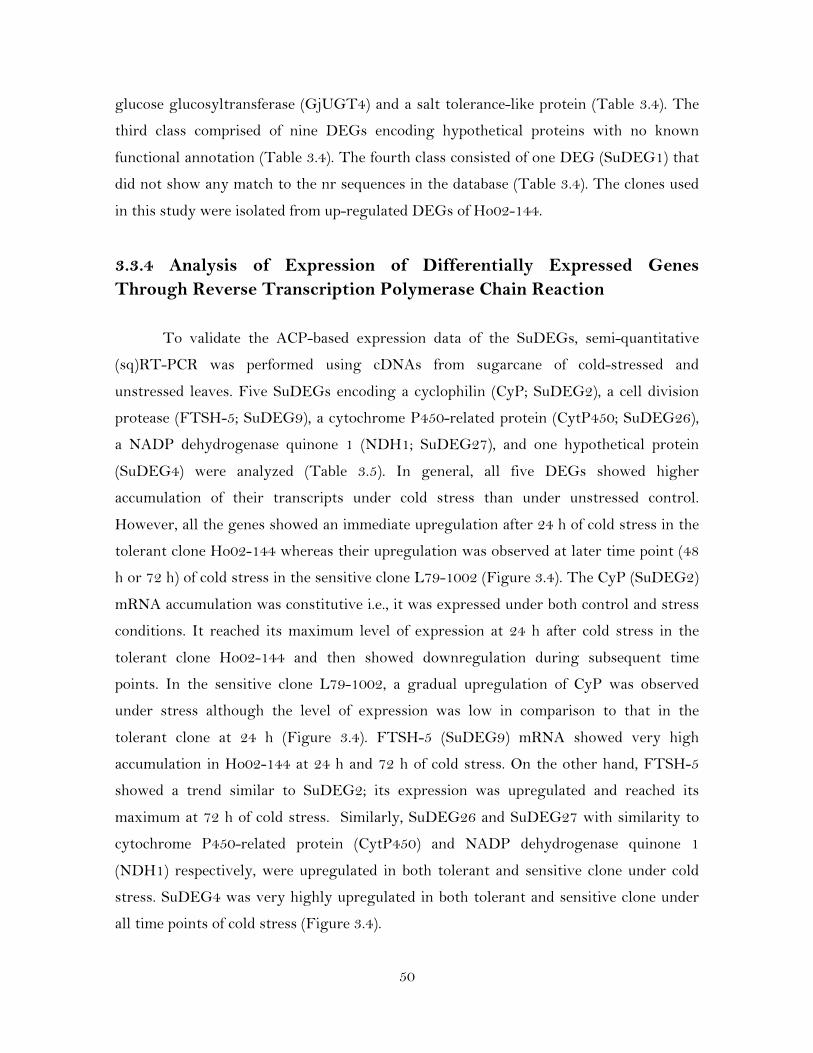
50
glucose glucosyltransferase (GjUGT4) and a salt tolerance-like protein (Table 3.4). The
third class comprised of nine DEGs encoding hypothetical proteins with no known
functional annotation (Table 3.4). The fourth class consisted of one DEG (SuDEG1) that
did not show any match to the nr sequences in the database (Table 3.4). The clones used
in this study were isolated from up-regulated DEGs of Ho02-144.
3.3.4 Analysis of Expression of Differentially Expressed Genes Through Reverse Transcription Polymerase Chain Reaction
To validate the ACP-based expression data of the SuDEGs, semi-quantitative
(sq)RT-PCR was performed using cDNAs from sugarcane of cold-stressed and
unstressed leaves. Five SuDEGs encoding a cyclophilin (CyP; SuDEG2), a cell division
protease (FTSH-5; SuDEG9), a cytochrome P450-related protein (CytP450; SuDEG26),
a NADP dehydrogenase quinone 1 (NDH1; SuDEG27), and one hypothetical protein
(SuDEG4) were analyzed (Table 3.5). In general, all five DEGs showed higher
accumulation of their transcripts under cold stress than under unstressed control.
However, all the genes showed an immediate upregulation after 24 h of cold stress in the
tolerant clone Ho02-144 whereas their upregulation was observed at later time point (48
h or 72 h) of cold stress in the sensitive clone L79-1002 (Figure 3.4). The CyP (SuDEG2)
mRNA accumulation was constitutive i.e., it was expressed under both control and stress
conditions. It reached its maximum level of expression at 24 h after cold stress in the
tolerant clone Ho02-144 and then showed downregulation during subsequent time
points. In the sensitive clone L79-1002, a gradual upregulation of CyP was observed
under stress although the level of expression was low in comparison to that in the
tolerant clone at 24 h (Figure 3.4). FTSH-5 (SuDEG9) mRNA showed very high
accumulation in Ho02-144 at 24 h and 72 h of cold stress. On the other hand, FTSH-5
showed a trend similar to SuDEG2; its expression was upregulated and reached its
maximum at 72 h of cold stress. Similarly, SuDEG26 and SuDEG27 with similarity to
cytochrome P450-related protein (CytP450) and NADP dehydrogenase quinone 1
(NDH1) respectively, were upregulated in both tolerant and sensitive clone under cold
stress. SuDEG4 was very highly upregulated in both tolerant and sensitive clone under
all time points of cold stress (Figure 3.4).

51
ACP11 primer
DEG26
M C-R T-R C-S T-S
M C-R T-R C-S T-S
ACP12 primer
DEG27
ACP5 primer
DEG2
M C-R T-R C-S T-S
ACP6 primer ACP7 primer
M C-R T-R C-S T-S M C-R T-R C-S T-S
Figure 3.3. Identification of differentially expressed genes using gene fishing technique. Arrows show the upregulated genes after cold treatment. ACP: primers used, M: 1kb molecular marker, CR: control resistant, TR: treatment resistant, CS: control susceptible, TS: treatment susceptible.

52
Table 3.4. Similarity search results of sugarcane DEGs against NCBI nr database
Query (Clone) Similarity (Gene or protein) Blast Hit Length
(bp) Ontology (GO) Query coverage
Maxima identity E-value
SuDEG2 Cyclophilin (CyP) (Saccharum officinarum) GQ246462 166 Biological process,
molecular function 83% 97% 2.00E-58
SuDEG22
Cyclophilin (CyP) (Saccharum officinarum) GQ246462 173 Biological process,
molecular function 78% 97% 2.00E-61
SuDEG3 14-3-3-like protein GF14-6 (Zea mays) NM_001111880 149 Molecular function 53% 95% 9.00E-27
SuDEG5 Calcium transporter 1 (TRPV6) (Sus scrofa) FJ268731 71
Biological process, Cellular component
& molecular function 39% 100% 2.00E-04
SuDEG15 Calcium transporter 1 (TRPV6) (Sus scrofa) FJ268731 140
Biological process, Cellular component
& molecular function 23% 96% 4.00E-05
SuDEG8 Heat shock protein hsp23 (Medicago sativa) JN103424 159 Biological process,
molecular function 17% 100% 6.00E-04
SuDEG21 Heat shock protein hsp23 (Medicago sativa) JN103424 135 Biological process,
molecular function 51% 100% 2.00E-14
SuDEG25 Heat shock protein hsp23 (Medicago sativa) JN103424 117 Biological process,
molecular function 59% 100% 9.00E-16
SuDEG9 Cell division protease (FTSH-5) (Arabidopsis thaliana) NP_568604 306 Molecular function 20% 96% 4.00E-03
SuDEG11 Mitochondrial heat shock protein 60 (Tigriopus japonicus) EU306562 82 Cellular component
& molecular function 34% 100% 2.00E-04
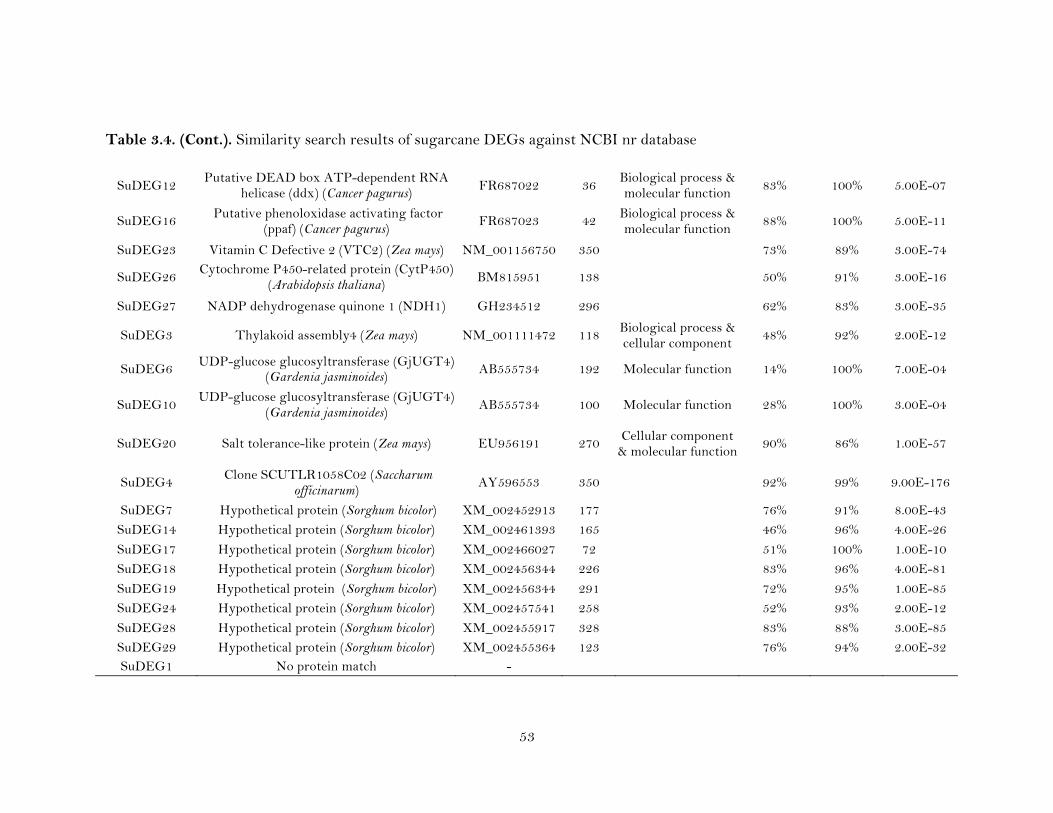
53
Table 3.4. (Cont.). Similarity search results of sugarcane DEGs against NCBI nr database
SuDEG12 Putative DEAD box ATP-dependent RNA helicase (ddx) (Cancer pagurus) FR687022 36 Biological process &
molecular function 83% 100% 5.00E-07
SuDEG16 Putative phenoloxidase activating factor (ppaf) (Cancer pagurus) FR687023 42 Biological process &
molecular function 88% 100% 5.00E-11
SuDEG23 Vitamin C Defective 2 (VTC2) (Zea mays) NM_001156750 350 73% 89% 3.00E-74
SuDEG26 Cytochrome P450-related protein (CytP450) (Arabidopsis thaliana) BM815951 138 50% 91% 3.00E-16
SuDEG27 NADP dehydrogenase quinone 1 (NDH1) GH234512 296 62% 83% 3.00E-35
SuDEG3 Thylakoid assembly4 (Zea mays) NM_001111472 118 Biological process & cellular component 48% 92% 2.00E-12
SuDEG6 UDP-glucose glucosyltransferase (GjUGT4) (Gardenia jasminoides) AB555734 192 Molecular function 14% 100% 7.00E-04
SuDEG10 UDP-glucose glucosyltransferase (GjUGT4) (Gardenia jasminoides) AB555734 100 Molecular function 28% 100% 3.00E-04
SuDEG20 Salt tolerance-like protein (Zea mays) EU956191 270 Cellular component & molecular function 90% 86% 1.00E-57
SuDEG4 Clone SCUTLR1058C02 (Saccharum officinarum) AY596553 350 92% 99% 9.00E-176
SuDEG7 Hypothetical protein (Sorghum bicolor) XM_002452913 177 76% 91% 8.00E-43 SuDEG14 Hypothetical protein (Sorghum bicolor) XM_002461393 165 46% 96% 4.00E-26 SuDEG17 Hypothetical protein (Sorghum bicolor) XM_002466027 72 51% 100% 1.00E-10 SuDEG18 Hypothetical protein (Sorghum bicolor) XM_002456344 226 83% 96% 4.00E-81 SuDEG19 Hypothetical protein (Sorghum bicolor) XM_002456344 291 72% 95% 1.00E-85 SuDEG24 Hypothetical protein (Sorghum bicolor) XM_002457541 258 52% 93% 2.00E-12 SuDEG28 Hypothetical protein (Sorghum bicolor) XM_002455917 328 83% 88% 3.00E-85 SuDEG29 Hypothetical protein (Sorghum bicolor) XM_002455364 123 76% 94% 2.00E-32 SuDEG1 No protein match -
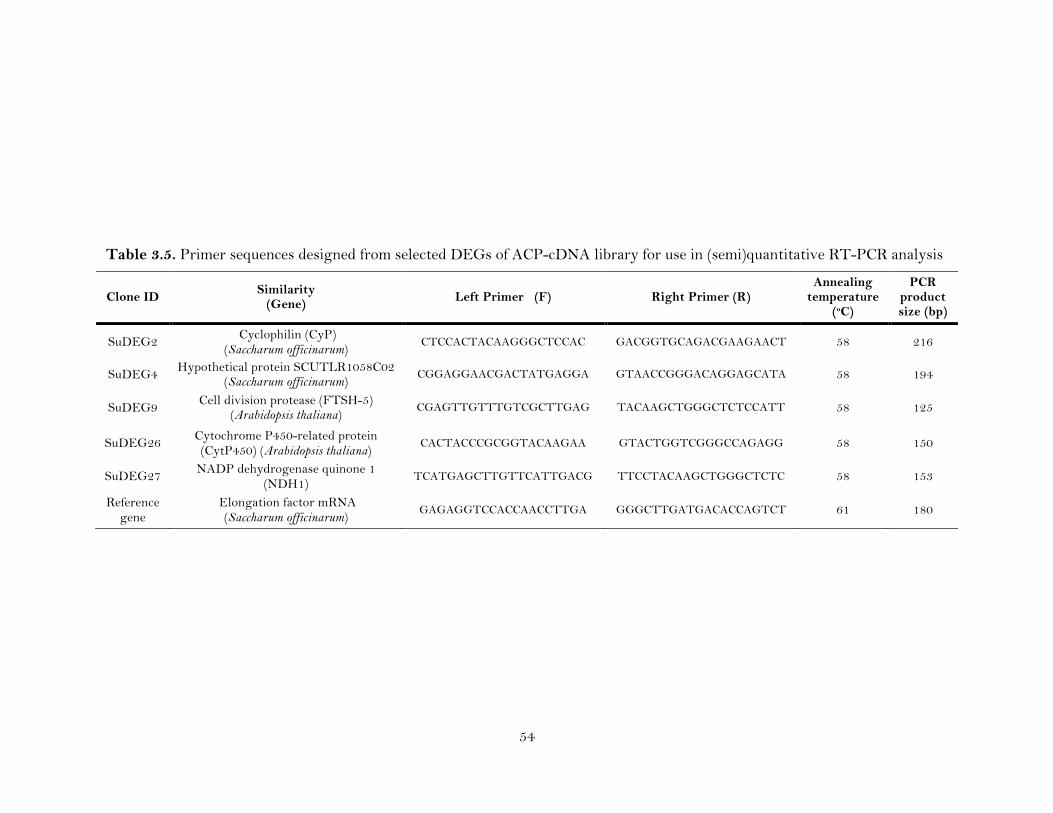
54
Clone ID Similarity (Gene) Left Primer (F) Right Primer (R)
Annealing temperature
(oC)
PCR product size (bp)
SuDEG2 Cyclophilin (CyP) (Saccharum officinarum)
CTCCACTACAAGGGCTCCAC GACGGTGCAGACGAAGAACT 58 216
SuDEG4 Hypothetical protein SCUTLR1058C02 (Saccharum officinarum)
CGGAGGAACGACTATGAGGA GTAACCGGGACAGGAGCATA 58 194
SuDEG9 Cell division protease (FTSH-5) (Arabidopsis thaliana)
CGAGTTGTTTGTCGCTTGAG TACAAGCTGGGCTCTCCATT 58 125
SuDEG26 Cytochrome P450-related protein (CytP450) (Arabidopsis thaliana)
CACTACCCGCGGTACAAGAA GTACTGGTCGGGCCAGAGG 58 150
SuDEG27 NADP dehydrogenase quinone 1 (NDH1)
TCATGAGCTTGTTCATTGACG TTCCTACAAGCTGGGCTCTC 58 153
Reference gene
Elongation factor mRNA (Saccharum officinarum)
GAGAGGTCCACCAACCTTGA GGGCTTGATGACACCAGTCT 61 180
Table 3.5. Primer sequences designed from selected DEGs of ACP-cDNA library for use in (semi)quantitative RT-PCR analysis
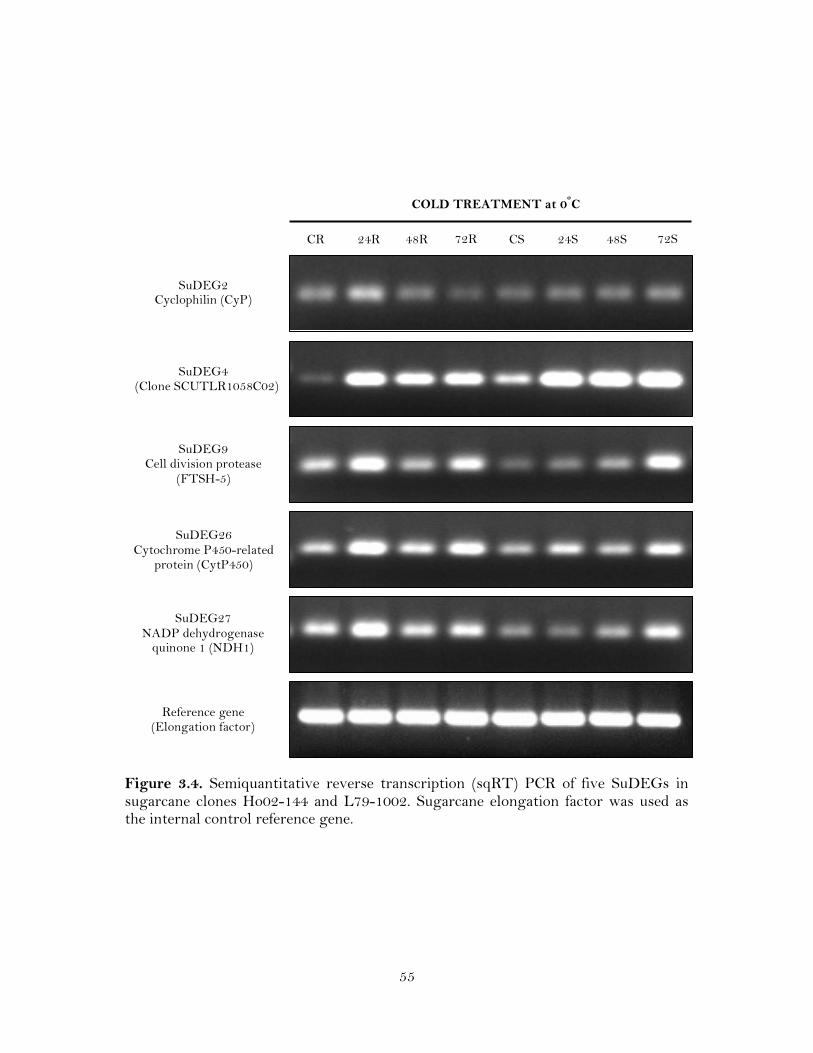
55
CR 24R 48R 72R CS 24S 48S 72S
COLD TREATMENT at 0oC
Reference gene (Elongation factor)
SuDEG27 NADP dehydrogenase
quinone 1 (NDH1)
SuDEG26 Cytochrome P450-related
protein (CytP450)
SuDEG9 Cell division protease
(FTSH-5)
SuDEG4 (Clone SCUTLR1058C02)
SuDEG2 Cyclophilin (CyP)
Figure 3.4. Semiquantitative reverse transcription (sqRT) PCR of five SuDEGs in sugarcane clones Ho02-144 and L79-1002. Sugarcane elongation factor was used as the internal control reference gene.
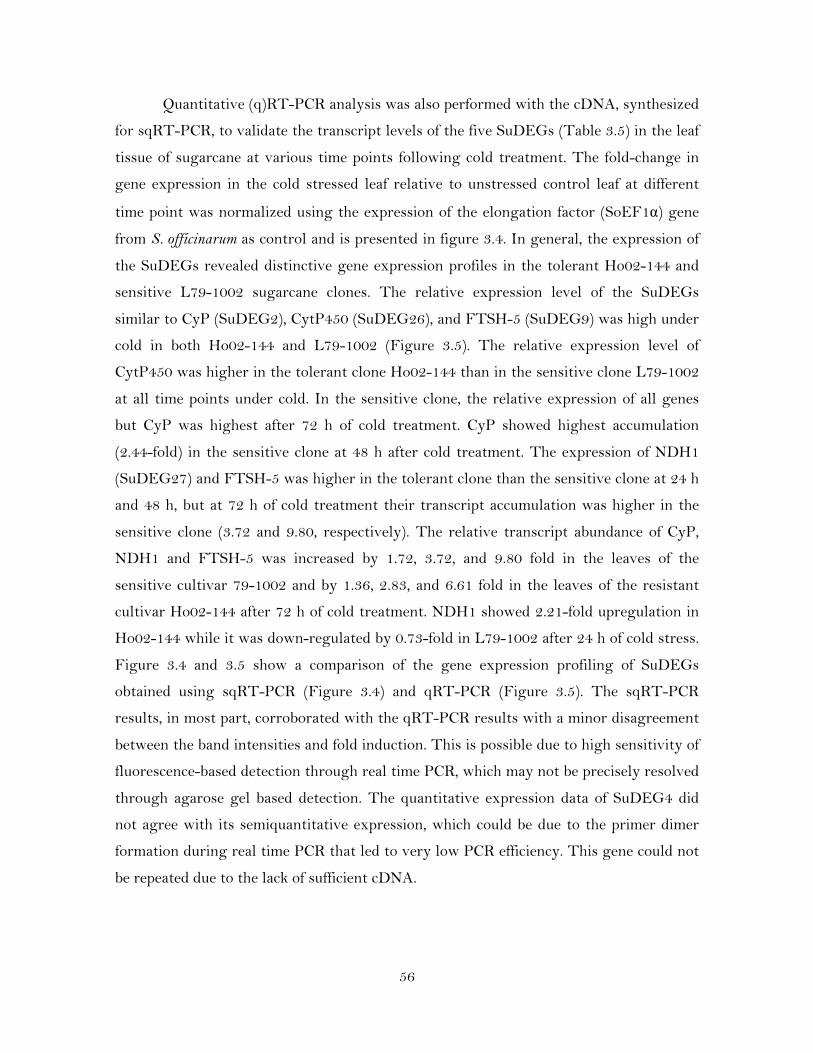
56
Quantitative (q)RT-PCR analysis was also performed with the cDNA, synthesized
for sqRT-PCR, to validate the transcript levels of the five SuDEGs (Table 3.5) in the leaf
tissue of sugarcane at various time points following cold treatment. The fold-change in
gene expression in the cold stressed leaf relative to unstressed control leaf at different
time point was normalized using the expression of the elongation factor (SoEF1α) gene
from S. officinarum as control and is presented in figure 3.4. In general, the expression of
the SuDEGs revealed distinctive gene expression profiles in the tolerant Ho02-144 and
sensitive L79-1002 sugarcane clones. The relative expression level of the SuDEGs
similar to CyP (SuDEG2), CytP450 (SuDEG26), and FTSH-5 (SuDEG9) was high under
cold in both Ho02-144 and L79-1002 (Figure 3.5). The relative expression level of
CytP450 was higher in the tolerant clone Ho02-144 than in the sensitive clone L79-1002
at all time points under cold. In the sensitive clone, the relative expression of all genes
but CyP was highest after 72 h of cold treatment. CyP showed highest accumulation
(2.44-fold) in the sensitive clone at 48 h after cold treatment. The expression of NDH1
(SuDEG27) and FTSH-5 was higher in the tolerant clone than the sensitive clone at 24 h
and 48 h, but at 72 h of cold treatment their transcript accumulation was higher in the
sensitive clone (3.72 and 9.80, respectively). The relative transcript abundance of CyP,
NDH1 and FTSH-5 was increased by 1.72, 3.72, and 9.80 fold in the leaves of the
sensitive cultivar 79-1002 and by 1.36, 2.83, and 6.61 fold in the leaves of the resistant
cultivar Ho02-144 after 72 h of cold treatment. NDH1 showed 2.21-fold upregulation in
Ho02-144 while it was down-regulated by 0.73-fold in L79-1002 after 24 h of cold stress.
Figure 3.4 and 3.5 show a comparison of the gene expression profiling of SuDEGs
obtained using sqRT-PCR (Figure 3.4) and qRT-PCR (Figure 3.5). The sqRT-PCR
results, in most part, corroborated with the qRT-PCR results with a minor disagreement
between the band intensities and fold induction. This is possible due to high sensitivity of
fluorescence-based detection through real time PCR, which may not be precisely resolved
through agarose gel based detection. The quantitative expression data of SuDEG4 did
not agree with its semiquantitative expression, which could be due to the primer dimer
formation during real time PCR that led to very low PCR efficiency. This gene could not
be repeated due to the lack of sufficient cDNA.
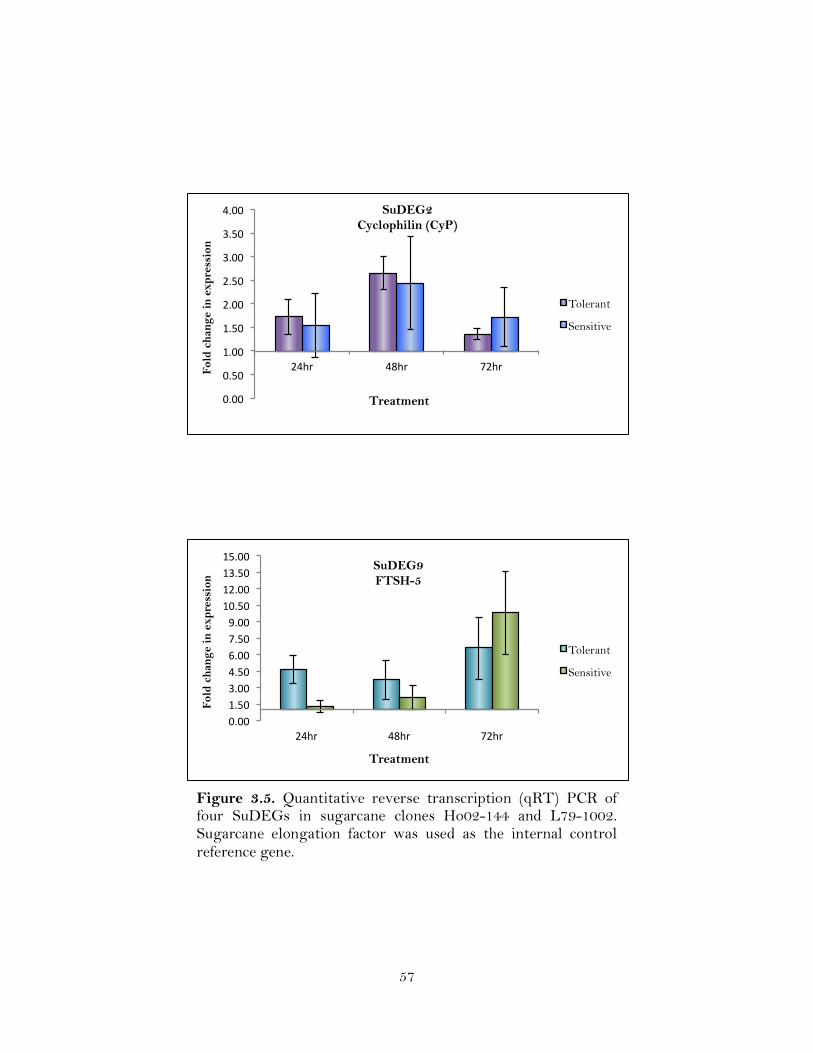
57
Figure 3.5. Quantitative reverse transcription (qRT) PCR of four SuDEGs in sugarcane clones Ho02-144 and L79-1002. Sugarcane elongation factor was used as the internal control reference gene.
!"!!#
!"$!#
%"!!#
%"$!#
&"!!#
&"$!#
'"!!#
'"$!#
("!!#
&()*# (+)*# ,&)*#Fold
cha
nge
in e
xpre
ssio
n
Treatment
SuDEG2 Cyclophilin (CyP)
Tolerant
Sensitive
!"!!#$"%!#&"!!#'"%!#("!!#)"%!#*"!!#$!"%!#$+"!!#$&"%!#$%"!!#
+',-# '.,-# )+,-#
Fold
cha
nge
in e
xpre
ssio
n
Treatment
SuDEG9 FTSH-5
Tolerant
Sensitive
58
Figure 3.5. (Cont.). Quantitative reverse transcription (qRT) PCR of four SuDEGs in sugarcane clones Ho02-144 and L79-1002. Sugarcane elongation factor was used as the internal control reference gene.
!"!!#
$"%!#
&"!!#
'"%!#
("!!#
)"%!#
*"!!#
$!"%!#
+',-# '.,-# )+,-#
Fold
cha
nge
in e
xpre
ssio
n
Treatment
SuDEG26 CytP450
Tolerant
Sensitive
!"!!#
$"!!#
%"!!#
&"!!#
'"!!#
("!!#
)"!!#
%'*+# ',*+# -%*+#
Fold
cha
nge
in e
xpre
ssio
n
Treatment
SuDEG27 NDH1
Tolerant
Sensitive
59
3.3.5 SSR Mining of Cold Responsive ESTs
Out of one hundred and fifty cold-responsive ESTs of sugarcane that were mined
for all perfect SSR motifs, twelve SSR containing ESTs were selected and used to design
eSSR markers (Table 3.6). Similarity search resulted in only one out of 12 SSR-ESTs
with no known function i.e., matching to “hypothetical protein”. Gene ontology analysis
assigned five sequences (NAC1, NAC23, glycine-rich RNA-binding protein 2, UDP-
forming alpha-1,4-glucan-protein synthase, and CBL-interacting protein kinase 24) to
both biological process and cellular component categories, while nuclear factor
interleukin 3 regulated-like protein was assigned to both cellular component and
molecular function categories. The remaining four (polyubiquitin 10, aquaporin PIP2-6,
luminal-binding protein 3 precursor, and conserved peptide upstream open reading frame
5) were assigned to biological process (Table 3.6).
3.3.6 Estimation of Polymorphism by eSSR Markers in Sugarcane
Twelve eSSR primer pairs derived from cold-responsive ESTs were used to
fingerprint a set of 48 commercial sugarcane hybrids, 14 S. spontaneum and two S.
officinarum clones for studying their genetic diversity. Figure 3.6 shows representative
gel images of the PCR profile obtained from these genotypes using eSSR primer 2, 3, 6,
and 11. Eleven out of the 12 eSSR primers produced scorable bands among these
genotypes, whereas one primer (eSSR8) failed to amplify. Due to the complex genome of
sugarcane, most of the eSSRs produced more than two amplified products, which were
considered to be dominant alleles. The eSSR primers amplified a total of 186 alleles with
a range from one (eSSR4) to 71 (eSSR1), and 170 alleles were polymorphic (92 %; Table
3.7). The eSSR1 amplified the highest (69) number of polymorphic alleles while eSSR4
amplified only one allele. The polymorphism information content (PIC) of the eSSRs
ranged from 0.11 (eSSR12) to 0.39 (eSSR4) with an average of 0.20 (Table 3.7). The mean
PIC value of the eSSRs with dinucleotide motifs (0.23) and tetranucleotide motifs (0.21)
were almost comparable, which was higher than the eSSRs with trinucleotides (0.14). In
general, the eSSR primers, as expected, showed low level of polymorphism among the 64
genotypes.
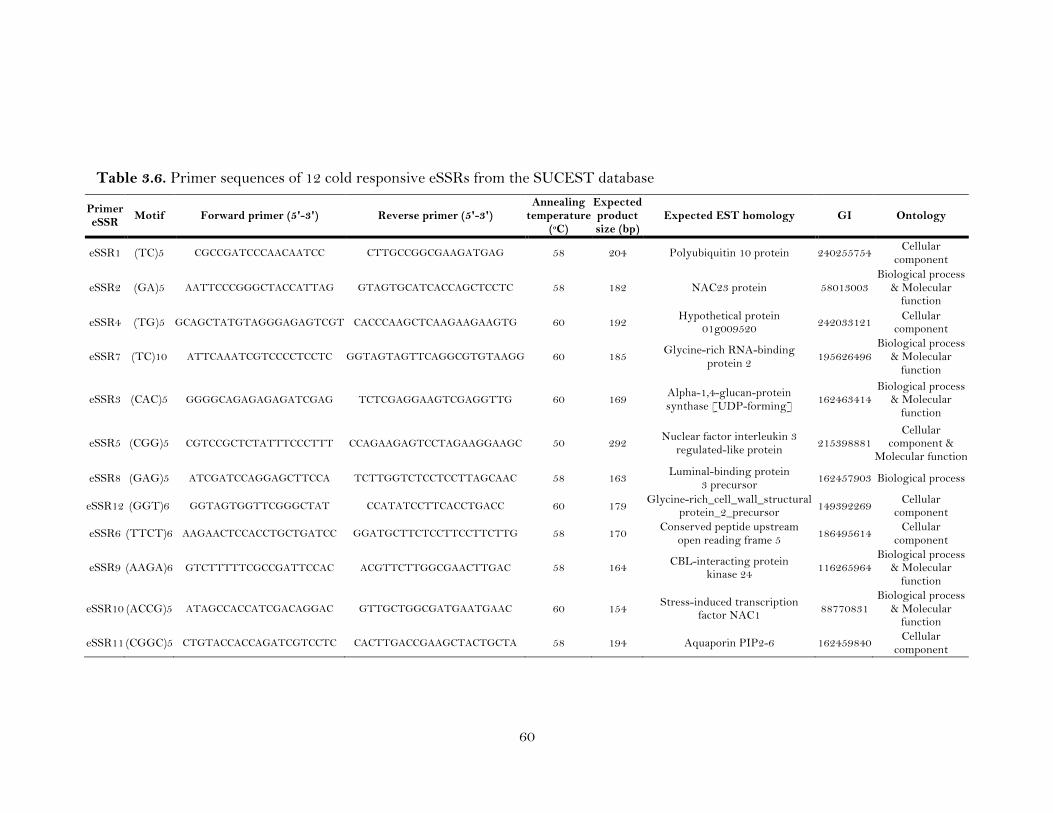
60
Table 3.6. Primer sequences of 12 cold responsive eSSRs from the SUCEST database
Primer eSSR Motif Forward primer (5'-3') Reverse primer (5'-3')
Annealing temperature
(oC)
Expected product size (bp)
Expected EST homology GI Ontology
eSSR1 (TC)5 CGCCGATCCCAACAATCC CTTGCCGGCGAAGATGAG 58 204 Polyubiquitin 10 protein 240255754 Cellular component
eSSR2 (GA)5 AATTCCCGGGCTACCATTAG GTAGTGCATCACCAGCTCCTC 58 182 NAC23 protein 58013003 Biological process
& Molecular function
eSSR4 (TG)5 GCAGCTATGTAGGGAGAGTCGT CACCCAAGCTCAAGAAGAAGTG 60 192 Hypothetical protein 01g009520 242033121 Cellular
component
eSSR7 (TC)10 ATTCAAATCGTCCCCTCCTC GGTAGTAGTTCAGGCGTGTAAGG 60 185 Glycine-rich RNA-binding protein 2 195626496
Biological process & Molecular
function
eSSR3 (CAC)5 GGGGCAGAGAGAGATCGAG TCTCGAGGAAGTCGAGGTTG 60 169 Alpha-1,4-glucan-protein synthase [UDP-forming] 162463414
Biological process & Molecular
function
eSSR5 (CGG)5 CGTCCGCTCTATTTCCCTTT CCAGAAGAGTCCTAGAAGGAAGC 50 292 Nuclear factor interleukin 3 regulated-like protein 215398881
Cellular component &
Molecular function
eSSR8 (GAG)5 ATCGATCCAGGAGCTTCCA TCTTGGTCTCCTCCTTAGCAAC 58 163 Luminal-binding protein 3 precursor 162457903 Biological process
eSSR12 (GGT)6 GGTAGTGGTTCGGGCTAT CCATATCCTTCACCTGACC 60 179 Glycine-rich_cell_wall_structural protein_2_precursor 149392269 Cellular
component
eSSR6 (TTCT)6 AAGAACTCCACCTGCTGATCC GGATGCTTCTCCTTCCTTCTTG 58 170 Conserved peptide upstream open reading frame 5 186495614 Cellular
component
eSSR9 (AAGA)6 GTCTTTTTCGCCGATTCCAC ACGTTCTTGGCGAACTTGAC 58 164 CBL-interacting protein kinase 24 116265964
Biological process & Molecular
function
eSSR10 (ACCG)5 ATAGCCACCATCGACAGGAC GTTGCTGGCGATGAATGAAC 60 154 Stress-induced transcription factor NAC1 88770831
Biological process & Molecular
function
eSSR11 (CGGC)5 CTGTACCACCAGATCGTCCTC CACTTGACCGAAGCTACTGCTA 58 194 Aquaporin PIP2-6 162459840 Cellular component
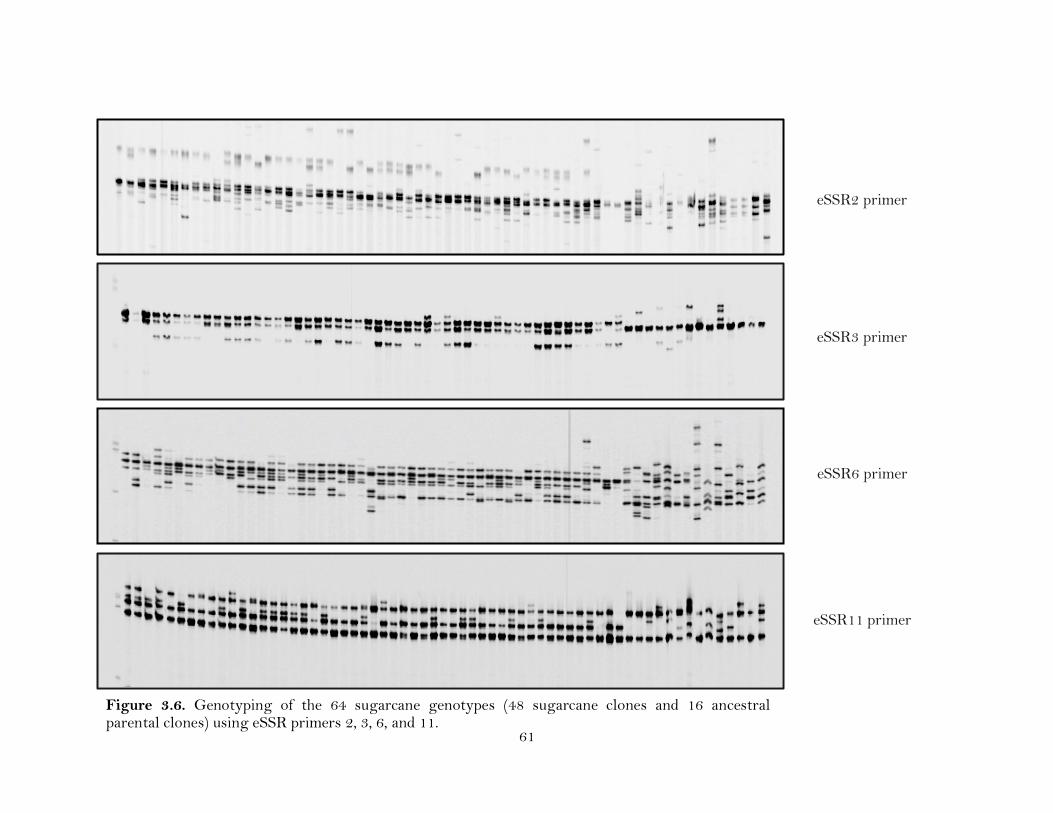
61
Figure 3.6. Genotyping of the 64 sugarcane genotypes (48 sugarcane clones and 16 ancestral parental clones) using eSSR primers 2, 3, 6, and 11.
eSSR2 primer
eSSR6 primer
eSSR3 primer
eSSR11 primer
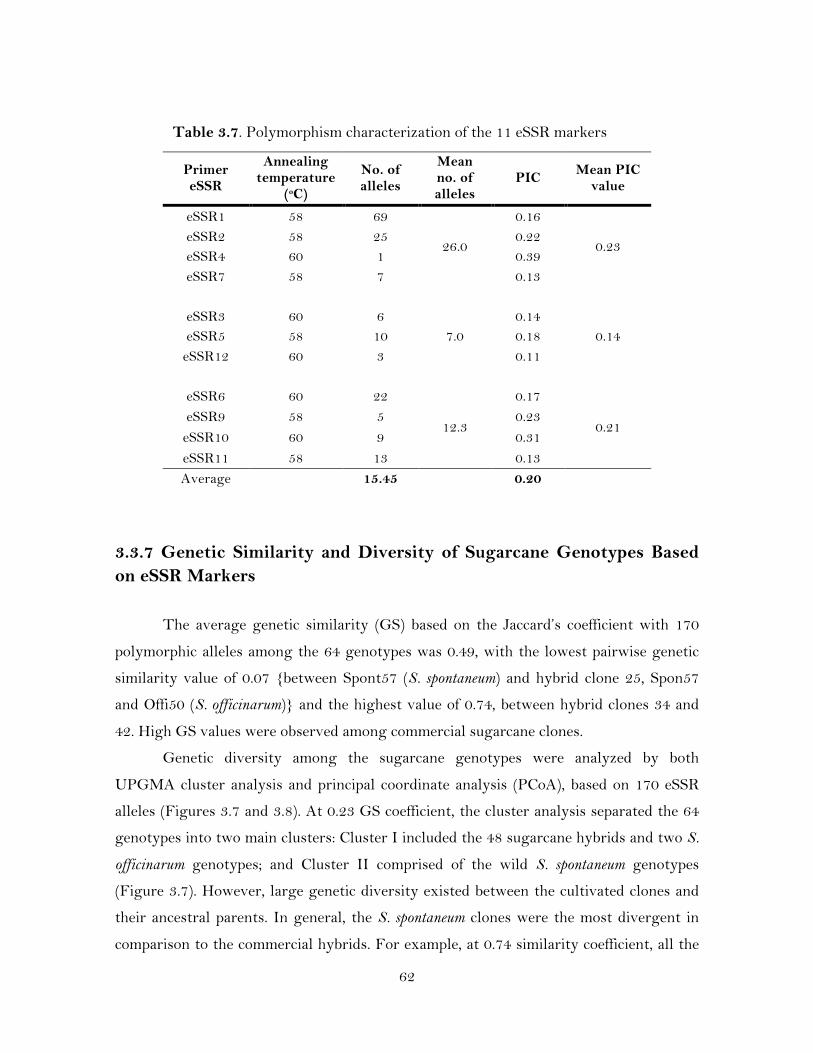
62
Table 3.7. Polymorphism characterization of the 11 eSSR markers
Primer eSSR
Annealing temperature
(oC)
No. of alleles
Mean no. of alleles
PIC Mean PIC value
eSSR1 58 69
26.0
0.16
0.23 eSSR2 58 25 0.22 eSSR4 60 1 0.39 eSSR7 58 7 0.13
eSSR3 60 6
7.0 0.14
0.14 eSSR5 58 10 0.18 eSSR12 60 3 0.11
eSSR6 60 22
12.3
0.17
0.21 eSSR9 58 5 0.23
eSSR10 60 9 0.31 eSSR11 58 13 0.13 Average
15.45
0.20
3.3.7 Genetic Similarity and Diversity of Sugarcane Genotypes Based on eSSR Markers
The average genetic similarity (GS) based on the Jaccard’s coefficient with 170
polymorphic alleles among the 64 genotypes was 0.49, with the lowest pairwise genetic
similarity value of 0.07 {between Spont57 (S. spontaneum) and hybrid clone 25, Spon57
and Offi50 (S. officinarum)} and the highest value of 0.74, between hybrid clones 34 and
42. High GS values were observed among commercial sugarcane clones.
Genetic diversity among the sugarcane genotypes were analyzed by both
UPGMA cluster analysis and principal coordinate analysis (PCoA), based on 170 eSSR
alleles (Figures 3.7 and 3.8). At 0.23 GS coefficient, the cluster analysis separated the 64
genotypes into two main clusters: Cluster I included the 48 sugarcane hybrids and two S.
officinarum genotypes; and Cluster II comprised of the wild S. spontaneum genotypes
(Figure 3.7). However, large genetic diversity existed between the cultivated clones and
their ancestral parents. In general, the S. spontaneum clones were the most divergent in
comparison to the commercial hybrids. For example, at 0.74 similarity coefficient, all the
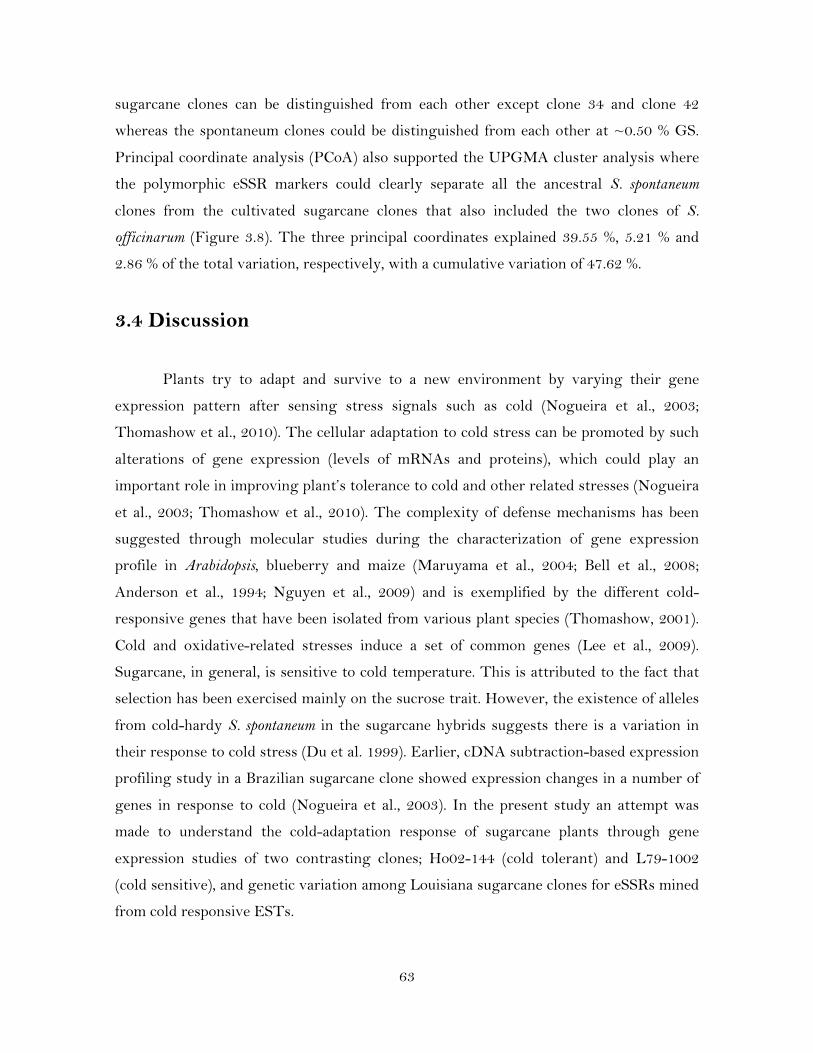
63
sugarcane clones can be distinguished from each other except clone 34 and clone 42
whereas the spontaneum clones could be distinguished from each other at ~0.50 % GS.
Principal coordinate analysis (PCoA) also supported the UPGMA cluster analysis where
the polymorphic eSSR markers could clearly separate all the ancestral S. spontaneum
clones from the cultivated sugarcane clones that also included the two clones of S.
officinarum (Figure 3.8). The three principal coordinates explained 39.55 %, 5.21 % and
2.86 % of the total variation, respectively, with a cumulative variation of 47.62 %.
3.4 Discussion
Plants try to adapt and survive to a new environment by varying their gene
expression pattern after sensing stress signals such as cold (Nogueira et al., 2003;
Thomashow et al., 2010). The cellular adaptation to cold stress can be promoted by such
alterations of gene expression (levels of mRNAs and proteins), which could play an
important role in improving plant’s tolerance to cold and other related stresses (Nogueira
et al., 2003; Thomashow et al., 2010). The complexity of defense mechanisms has been
suggested through molecular studies during the characterization of gene expression
profile in Arabidopsis, blueberry and maize (Maruyama et al., 2004; Bell et al., 2008;
Anderson et al., 1994; Nguyen et al., 2009) and is exemplified by the different cold-
responsive genes that have been isolated from various plant species (Thomashow, 2001).
Cold and oxidative-related stresses induce a set of common genes (Lee et al., 2009).
Sugarcane, in general, is sensitive to cold temperature. This is attributed to the fact that
selection has been exercised mainly on the sucrose trait. However, the existence of alleles
from cold-hardy S. spontaneum in the sugarcane hybrids suggests there is a variation in
their response to cold stress (Du et al. 1999). Earlier, cDNA subtraction-based expression
profiling study in a Brazilian sugarcane clone showed expression changes in a number of
genes in response to cold (Nogueira et al., 2003). In the present study an attempt was
made to understand the cold-adaptation response of sugarcane plants through gene
expression studies of two contrasting clones; Ho02-144 (cold tolerant) and L79-1002
(cold sensitive), and genetic variation among Louisiana sugarcane clones for eSSRs mined
from cold responsive ESTs.
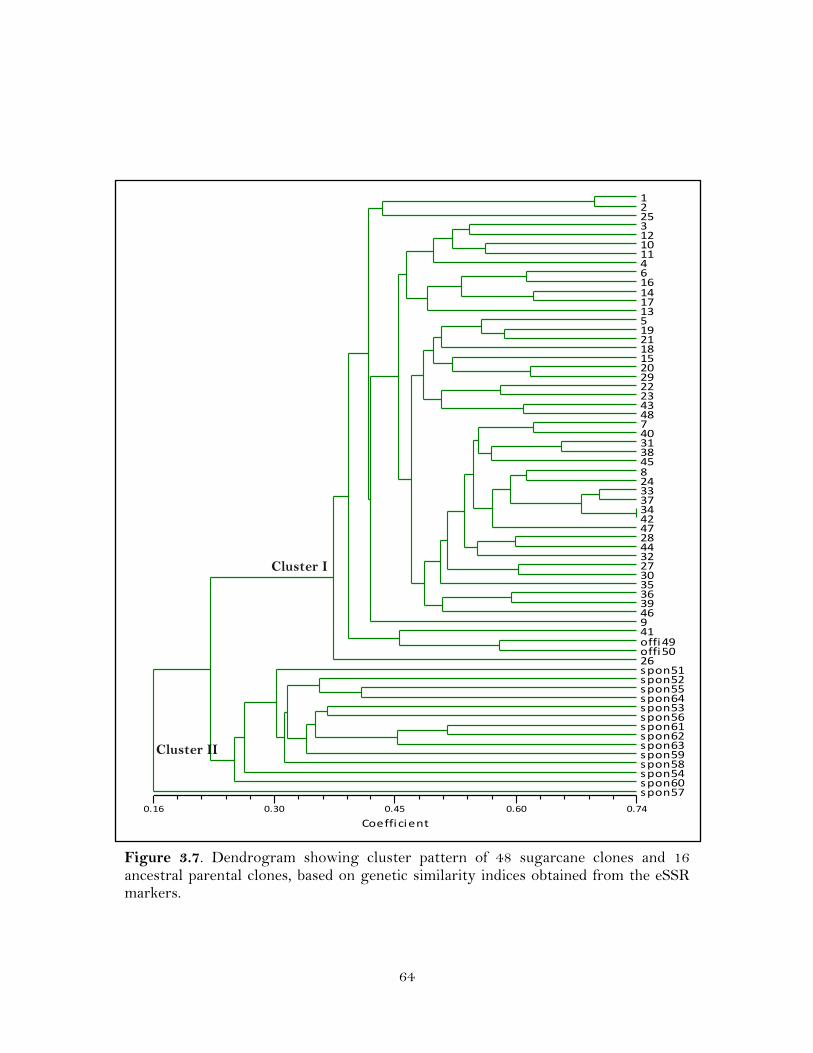
64
Figure 3.7. Dendrogram showing cluster pattern of 48 sugarcane clones and 16 ancestral parental clones, based on genetic similarity indices obtained from the eSSR markers.
Coefficient0.16 0.30 0.45 0.60 0.74
1 2 25 3 12 10 11 4 6 16 14 17 13 5 19 21 18 15 20 29 22 23 43 48 7 40 31 38 45 8 24 33 37 34 42 47 28 44 32 27 30 35 36 39 46 9 41 offi49 offi50 26 spon51 spon52 spon55 spon64 spon53 spon56 spon61 spon62 spon63 spon59 spon58 spon54 spon60 spon57
Cluster I
Cluster II
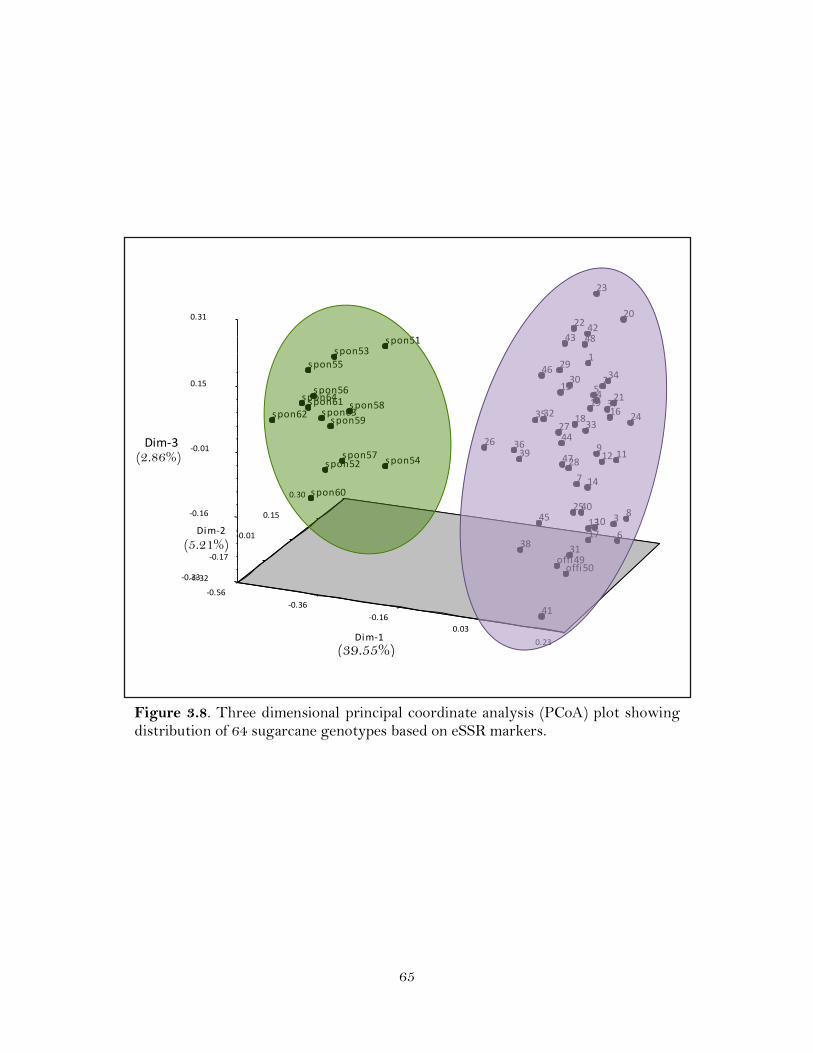
65
Figure 3.8. Three dimensional principal coordinate analysis (PCoA) plot showing distribution of 64 sugarcane genotypes based on eSSR markers.
spon64spon63spon62
spon61
spon60
spon59spon58
spon57
spon56
spon55
spon54
spon53
spon52
spon51
offi50offi49
48
47
46
45
44
4342
41
40
39
38
37
36
35
34
3332
31
3029
28
2726
25
24
23
22
21
20
1918
17
16
15
14
13
12 11
10
9
8
7
6
54
3
2
1
0.300.30
0.150.15
Dim-‐2Dim-‐2 -‐0.01-‐0.01
-‐0.17-‐0.17
-‐0.32-‐0.32-‐0.33-‐0.33
-‐0.56-‐0.56
-‐0.16-‐0.16
-‐0.36-‐0.36
Dim-‐3Dim-‐3 -‐0.01-‐0.01
Dim-‐1Dim-‐1
-‐0.16-‐0.16
0.150.15
0.310.31
0.030.03
0.230.23(39.55%)
(2.86%)
(5.21%)
66
3.4.1 Cold-responsive Genes in Sugarcane
A total of 40 SuDEGs (differentially expressed genes; 29 - upregulated, 11 -
downregulated) were identified by the use of an annealing control primer (ACP) based
gene fishing technique from Ho02-144 and L79-1002 when exposed to 0 °C up to 72 h.
Eleven of these DEGs represented cold-induced genes identified in other plants.
SuDEG2 and SuDEG22, coding for cyclophilin (CyP) proteins (Table 3.4), are
ubiquitous proteins that occur in diverse organisms and are involved in protein folding.
CyPs play an essential role as molecular chaperones under various stresses (Marivet et
al., 1994; Godoy et al., 2000). CyP gene was constitutively expressed at different time in
sugarcane leaf by cold stress, but higher transcript accumulation was observed in the
tolerant clone in comparison to the sensitive clone. This observation is consistent with
that of Marivet et al. (1994) where higher amounts of CyPs in bean could facilitate the
correct folding in the maturation processes of induced proteins under stress and were
assumed to have defensive functions (Godoy et al., 2000). CyP2 was shown to be involved
not only in the protein folding, but also in refolding of denatured proteins under cold
stress in tobacco (Ruan et al., 2011).
Cell division proteases (FTSH) are also known to be induced under various stress
conditions (Cui et al., 2005). In the present study, SuDEG9 was identified as a putative
FTSH-5, which was significantly increased after 24 h of cold exposure. The enhanced
expression of this protein in the tolerant clone under cold stress suggested that such
proteins involved in the photosynthesis apparatus are implicated in protecting the
photosystem from damage associated with cold stress (Liu et al., 2010). In the present
study, the observation that the tolerant clone retained higher chlorophyll when compared
to the sensitive clone could be explained by the protection and biogenesis of chloroplast
due to overaccumulation of FTSH-5 gene in the tolerant clone (Jin et al., 2011).
The differential expression of SuDEG26 and SuDEG27 with protein identity to
cytochrome P450-related protein (CytP450) and NADP dehydrogenase quinone 1
(NDH1), respectively suggested that genes involved in anthocyanin biosynthesis and
cyclic electron flow around PSI are regulated under cold stress. It is possible that
sugarcane NDH1 is induced in response to oxidative stress generated by cold stress (Mi
et al., 1993).
67
Heat shock proteins are involved in the common physiological response of plants
to temperature stress (Colinet et al., 2009). Heat shock proteins are molecular chaperones
that are known to stabilize other proteins in response to low temperature (Bengyella and
Pranab, 2011). In this study four ESTs (SuDEG8, SuDEG11; SuDEG21 and SuDEG25)
showing similarity to heat shock proteins (Hsp23, mitochondrial Hsp60) were
upregulated after cold treatment in the tolerant cultivar (Table 3.4).
Nakamura et al. (2004) observed that cold and salt stress induced accumulation of
ATP-dependent RNA helicase (HVD1), a member of the DEAD box family, in barley. In
sugarcane, the EST (SuDEG12) similar to HVD1 was induced after cold exposure in the
tolerant cultivar. RNA helicase activity could play an important role as a regulator of
CBF genes that are necessary for survival of plants under cold stress by using ATP
hydrolysis as the source of energy (Nakamura et al., 2004).
The observations that tolerant and sensitive sugarcane clones responded
differentially to cold stress at the level of mRNAs might suggest an operation of different
signal cascades for activation of downstream cold-responsive genes and existence of
superior alleles in the resistant clones.
3.4.2 Genetic Diversity Analysis
Microsatellite markers based on the expressed sequence tags (EST-SSR) have
become markers of choice for the sugarcane scientific community not only for its ease of
use, but also because of their inexpensive development and amenability to
highthroughout operation (Da Silva et al., 2001). Because eSSRs are derived from the
transcripts with a putative function, they are useful for functional diversity assay in
natural populations or germplasm collections. The eSSRs can often be used as anchor
markers for comparative mapping and evolutionary studies, and could prove useful for
marker-assisted selection, especially when the markers reside in the genes responsible for
a phenotypic trait (Varshney et al., 2005). Moreover, their cross transferability across
different species could facilitate tracking of the ancestral Saccharum species-specific alleles
in the commercial sugarcane hybrids. In this study, 12 cold responsive EST sequences
harboring SSR motifs were used to design the eSSRs (Table 3.6).

68
Twelve eSSR markers were used to establish the genetic diversity among 64
genotypes that included 48 commercial sugarcane clones, 14 S. spontaneum and two S.
officinarum clones. Ninety-two percent of the markers showed polymorphism among the
sugarcane genotypes, which is higher than previous studies reported with the genomic
and genic SSR markers of sugarcane (15 %, Pinto et al., 2006; 72 %, Aitken et al., 2005),
The high level of polymorphism associated with the eSSRs in sugarcane genotypes could
be due to high rate of replication slippage by large allelic diversity among and within the
parental genotypes used to produce the commercial hybrids. S. spontaneum showed the
most diversity, which further conformed to the finding of Suman et al. (2011). As
compared with S. spontaneum, GS value was higher among sugarcane hybrids. These
results corroborated earlier observations by Alwala et al. (2006) affirming that genetic
diversity is, in general, low among cultivated sugarcane because of few parental clones
involved in the development of the foundation clones through nobilization in breeding
programs (Alwala et al., 2006). S. officinarum and S. spontaneum showed only 7 %
similarity to each other, which reflected the distinctness of these two species.
The cluster analysis generated a dendrogram that showed a clear separation
between cultivated sugarcane clones and ancestral parent clones (Figure 3.7). In
sugarcane (Oliveira et al., 2009) and wheat (Chabane et al., 2007) the EST-derived
microsatellites could distinguish the genotypes in accordance with their ancestral
relationships. The grouping of the commercial hybrids with S. officinarum in Cluster I is
expected because most of the modern cultivars have inherited the major part of the
genome of S. officinarum during nobilization events (D’Hont et al., 1998). Similar results
have been obtained earlier by the use of gene-based TRAP markers (Alwala et al. 2006;
Suman et al., 2011). Thus genic markers seem to be useful to assess genetic diversity and
discriminate between different species of sugarcane.
The average polymorphic information content (PIC) value of the eSSR primers
was low (0.20). Low PIC (0.23) was also obtained in sugarcane by Cordeiro et al. (2001),
which is due to the conserved sequences of the transcribed regions within the same genus
(Chabane et al., 2007). Another reason for the low PIC level could be due to low
frequency of transmission of the diverged sequence differences between S. officinarum
versus S. spontaneum and cultivated sugarcane varieties (Berding and Roach, 1997).
However, the present results demonstrated that eSSR markers were able to produce

69
adequate polymorphism for their use as molecular markers in sugarcane genetic diversity
studies.
70
Chapter IV Conclusions
Molecular markers (RAPD and SSR) were found to be an appropriate means to
assess genetic diversity in the smooth cordgrass accessions where the RAPD
markers were more discriminative than the SSR markers.
Similar levels of polymorphism were observed for both the marker systems with
minor difference between dendrograms generated by each of the marker systems.
Sufficient genetic diversity existed among the individuals to explore breeding
interventions for genetic improvement of smooth cordgrass.
Seventeen RAPD and 10 SSR primers amplified loci that were specific to 10 and
five smooth cordgrass accessions, respectively. These unique genotype IDs of the
smooth cordgrass accessions will be very useful for maintaining genetic identity
and purity of the varieties.
The results of this study suggested that multiple genes were induced in response
to cold stress in sugarcane.
Distinctive gene expression profiles were observed in the tolerant and sensitive
sugarcane clone. Further studies will increase our understanding of the complex
signaling cascade of the metabolic pathways that play key roles in cold stress
tolerance of sugarcane.
The polymorphic eSSR markers developed in this study demonstrated their
usefulness to classify Louisiana sugarcane clones from their ancestral genotypes
based on the distribution of cold-responsive alleles.
71
References Aitken KS, Jackson PA, McIntyre CL (2005) A combination of AFLP and SSR markers
provides extensive map coverage and identification of homo(eo)logous linkage groups in a sugarcane cultivar. Theoretical and Applied Genetic 110: 789-801
Alwala S, Suman A, Arro JA, Veremis JC, and Kimbeng CA (2006) Target Region
Amplification Polymorphism (TRAP) for Assessing Genetic Diversity in Sugarcane Germplasm Collections. Crop Science 46: 448-455
Anand A, Rao CS, Eganathan P, Kumar NA, Swaminathan MS (2004) Saving an
endangered Taxon: Syzygium travancoricum Gamble: A case study focussing on its genetic diversity, and reintroduction. Physiology and Molecular Biology of Plants, 10: 233-242
Anderson MD, Prasad TK, Martin BA, Stewart CR (1994) Differential gene
expression in chilling acclimated maize seedlings and evidence for the involvement of abscisic acid in chilling tolerance. Plant Physiology 105: 331–339
Baisakh N, Subudhi P, Parami NP (2006) cDNA-AFLP analysis reveals differential
gene expression in response to salt stress in a halophyte Spartina alterniflora Loisel. Plant Science 170: 1141-1149
Baisakh N, Subudhi P, Varadwaj P (2008) Primary response to salt stress in a
halophyte, smooth cordgrass (Spartina alterniflora Loisel.). Functional and Integrative Genomics 8: 287-300
Baisakh N, Subudhi P, Arumuganathan K, Parco P, Harrison S, Knott C, Materne
M (2009) Development and interspecific transferability of genic microsatellite markers in Spartina spp. with different genome size. Aquatic Botany 91: 262-266
Bell DJ, Rowland LJ, Polashock JJ, Drummond FA (2008) Suitability of EST-PCR
Markers Developed in Highbush Blueberry for Genetic Fingerprinting and Relationship Studies in Lowbush Blueberry and Related Species. Journal of the American Society for Horticultural Science 133(5): 701-707
Bengyella L and Pranab R (2011) Switching between Heat Shock Proteins and Cold
Inducible Proteins under Temperature Fluctuation in Solanum tuberosum L. Cultivars in In Vivo Condition. British Biotechnology Journal 1(3): 101-112
Berding N, Roach BT (1997) Germplasm collection, maintenance, and use, in: DJ. Heinz
72
(Ed.). Sugarcane Improvement through Breeding. Elsevier. Amsterdam, pp. 143-210 Blum MJ, Sloop CM, Ayres DR, Strong DR (2004) Characterization of microsatellite
loci in Spartina species (Poaceae). Molecular Ecology Notes 4, 39–42 Blum MJ, Jun Bando K, Katz M, Strong DR (2007) Geographic structure, genetic
diversity and source tracking of Spartina alterniflora. Journal of Biogeography 34: 2055-2069
Botstein D, White R, Skolnick M, Davis R (1980) Construction of a genetic linkage
map in human using restriction fragment length polymorphisms. The American Journal of Human Genetics 32: 314–331
Casu RE, Dimmock CM, Chapman SC, Grof CPL, McIntyre CL, Bonnett GD,
Manners JM (2004) Identification of differentially expressed transcripts from maturing stem of sugarcane by in silico analysis of stem expressed sequence tags and gene expression profiling. Plant Molecular Biology 54: 503–517
Casu RE, Manners JM, Bonnett GD, Jackson PA, McIntyre CL, Dunne R, Chapman
SC, Rae AL and Grof CPL (2005) Genomics approaches for the identification of genes determining important traits in sugarcane. Field Crops Research 92: 137-147
Chabane K, Abdalla O, Sayed H, Valkoun J (2007) Assessment of EST-microsatellites
markers for discrimination and genetic diversity in bread and durum wheat landraces from Afghanistan. Genetic Resources and Crop Evolution 54: 1073-1080
Chen C, Zhou P, Choi Y, Huang S, Gmitter FJr (2006) Mining and characterizing
microsatellites from citrus ESTs. Theoretical Applied Genetics 112: 1248–1257 Chimote VP, Pattanayak D, Naik PS (2007) Molecular and morphological divergence
studies in Indian potato varieties. Indian Journal of Biotechnology 6: 216-223 Cholastova T, Soldanova M, Pokorny R (2011) Random amplified polymorphic DNA
(RAPD) and simple sequence repeat (SSR) marker efficiency for maize hybrid identification. African Journal of Biotechnology 10(24): 4794-4801
Colinet H, Lee SF, and Hoffmann A (2009) Temporal expression of heat shock genes
during cold stress and recovery from chill coma in adult. The FEBS Journal 277: 174-185
Cordeiro G, Casu R, McIntyre C, Manners J, Henry R (2001) Microsatellite markers
from sugarcane (Saccharum spp.) ESTs cross transferable to Erianthus and sorghum.
73
Plant Science 160: 1115–1123 Cordeiro G, Amouyal O, Eliott F, Henry R (2007) Sugarcane. In: Genome Mapping
and Molecular Breeding in Plants, Volume 3, Pulses, Sugar and Tuber Crops, C. Kole (ed.), Springer-Verlag, Berlin Heidelberg. pp. 175-203
Cuesta C, Ordas RJ, Rodriguez A, Fernandez B (2010) PCR-based molecular markers
for assessment of somaclonal variation in Pinus pinea clones micropropagated in vitro. Biologia Plantarum 54(3): 435-442
Cui S, Huang F, Wang J, Ma X, Cheng Y, Liu J (2005) A proteomic analysis of cold
stress responses in rice seedlings. Proteomics 5: 3162-3172 CWPPRA, (2012) Coastal Wetlands Planning, Protection and Restoration Act. Available
at http://lacoast.gov/new/Pubs/Report_data/Caring.aspx Daehler C, Strong D (1997) Hybridization between introduced Smooth Cordgrass
(Spartina alterniflora; Poaceae) and Native California Cordgrass (S. foliosa) in San Francisco Bay, California, USA. American Journal of Botany 84: 607-611
Daehler C (1999) Inbreeding depression in smooth cordgrass (Spartina alterniflora,
Poaceae) invading San Francisco Bay. American Journal of Botany 86, 131–139 Da Silva J (2001) Preliminary analysis of microsatellite markers derived from sugarcane
expressed sequence tags (ESTs). Genetics and Molecular Biology 24(1-4): 155-159 Diatchenko L, Lau Y-F, Campbell AP, Chenchik A, Moqadam F, Huang B,
Lukyanov S, Lukyanov K, Gurskaya N, Sverdlov E, Siebert PD (1996) Suppression subtractive hybridization: A method for generating differentially regulated or tissue-specific cDNA probes and libraries. Proceedings of the National Academy Science USA 93: 6025-6030
D’Hont A, Ison D, Alix K, Roux C, Glaszmann C (1998) Determination of basic
chromosome numbers in the genus Saccharum by physical mapping of ribosomal RNA genes. Genome 41: 221-225
Doyle JJ, Doyle JL (1990) Isolation of plant DNA from fresh tissue. Focus 12:13-15 Duncan WH, Duncan MB (1987) The Smithsonian guide to seaside plants of the Gulf
and Atlantic coasts Smithsonian Institute, Washington, D.C Du YC, Nose A, and Wasano K (1999) Thermal characteristics of C4 photosynthetic
74
enzymes from leaves of three sugarcane species differing in cold sensitivity. Plant and Cell Physiology 40: 298-304
Edmé SJ, Comstock JC, Miller JD, Tai PYP (2005) Determination of DNA content
and genome size in field grown sugarcane interspecific hybrids and genotypes. J Am Society Sugar cane Technology 5: 1-7. Published online: www.assct.org/journal/journal.htm
Edmé SJ, Glynn NG, Comstock JC (2006) Genetic segregation of microsatellite
markers in Saccharum officinarum and S. spontataneum. Heredity 97: 366-375 Eujayl I, Sorrells M, Baum M, Wolters P, Powell W (2002) Isolation of EST-derived
microsatellite markers for genotyping the A and B genomes of wheat. Theoretical Applied Genetics 104: 399–407
Excoffier L, Lischer HEL (2010) Arlequin suite ver 3.5: A new series of programs to
perform population genetics analysis under Linux and Windows. Molecular Ecology Resources 10: 564-567
Fang X (2002) Reproductive biology of smooth cordgrass (Spartina alterniflora). M.S.
Thesis, Louisiana State University, USA Fang X, Subudhi PK, Venuto BC, Harrison SA (2004) Mode of pollination, pollen
germination, and seed set in smooth cordgrass (Spartina alterniflora, Poaceae). International Journal of Plant Sciences 165: 395-401
FAOSTAT (2011) Food and Agriculture Organization of the United Nations. Statistics
Division 2012 (http://faostat.fao.org/site/567/DesktopDefault.aspx?PageID=567) Fine G, Thomassie G (2000) ‘Vermilion’ smooth cordgrass, USDA-NRCS Golden
Meadow Plant Materials Center. Galliano, LA. pp. 1p Finkl CW, Khalil SM (2005) Saving America’s wetland: strategies for restoration of
Louisiana’s coastal wetlands and barrier islands. Journal of Coastal Research Special Issue 44
Fisher AJ, DiTomaso JM, Gordon TR (2005) Intraspecific groups of Claviceps purpurea
associated with grass species in Willapa Bay, Washington, and the prospects for biological control of invasive Spartina alterniflora. Biological Control 34: 170-179
Frankham R, Ballou JD, Briscoe DA (2002) Introduction to conservation genetics.
Cambridge University Press
75
Godoy AV, Lazzaro AS, Casalongué CA, San Segundo B (2000) Expression of a Solanum tuberosum cyclophilin gene is regulated by fungal infection and abiotic stress conditions. Plant Science 152: 123-134
Gupta PK, Varshney RK (2000) The development and use of microsatellite markers for
genetic analysis and plant breeding with emphasis on bread wheat. Euphytica 113: 163-185
Gupta V, Raghuvanshi S, Gupta A, Saini N, Gaur A, Khan MS, Gupta RS, Singh J,
Duttamajumder SK, Srivastava S, Suman A, Khurana JP, Kapur R, Tyagi AK (2009) The water-deficit stress- and red-rot-related genes in sugarcane. Functional & Integrative Genomics 10(2): 207–214
Hamer DW, Miller CF, Duell RW (1994) Registration of ‘Bayshore’ smooth cordgrass.
Crop Science 34: 300-301 Hamrick J (2004) Response of forest trees to global environmental change. Forest Ecology
and Management 197: 323–335 Han Z, Guo W, Song X, Zhang T (2004) Genetic mapping of EST-derived
microsatellites from the diploid Gossypium arboretum in allotetraploid cotton. Molecular Genetics and Genomics 272: 308–327
Hisano H, Sato S, Isobe S, Sasamoto S, Wada T, Matsuno A, Fujishiro T, Yamada
M, Nakayama S, Nakamura Y, Watanabe S, Harada K, Tabata S (2007) Characterization of the soybean genome using EST-derived microsatellite markers. DNA Research 14: 271–281
Hu J, Vick BA (2003) Target Region Amplification Polymorphism: A Novel Marker
Technique for Plant Genotyping. Plant Molecular Biology Reporter 21: 289-294 Hwang IT, Kim YJ, Kim SH, Kwak ChI, Gu YY, Chun JY (2003) Annealing control
primer system for improving specificity of PCR amplification. BioTechniques 35: 1180-1184
Jaccard P (1908) Nouvelles rescherches sur la distribution florale. Bulletin Societe
Vaudoise des Sciences Naturelles 44: 223-270 Jin Y, Zhang C, Yang H, Yang Y, Huang Ch, Tian Y, Lu X (2011) Proteomic analysis
of cold stress responses in tobacco seedlings. African Journal of Biotechnology 10(82) 18991-19004
76
Karp A, Edwards K (1997) DNA markers: a global overview. In Caetano-Anolles, G., and Gresshoff, P. M. (eds.). DNA Markers: Protocols, Applications, and Overviews. Wiley-Liss, Inc. Nueva York USA. 364 p
Kauffman JM (2010) Investigation Cold Hardiness and Management Practices of Warm-
season Putting Green Species in the Transition Zone. PhD dissertation, University of Tennessee
Kim YJ, Kwak ChI, Gu YY, Hwang IT, Chun JY (2004) Annealing control primer
system for identification of differentially expressed genes on agarose gels. BioTechniques 36: 424-434
Knott CA, Materne MD, Utomo H, Subudhi PK, Baisakh N, Harrison SA (2012)
Registration of smooth cordgrass cultivars ‘LA11-101’, ‘LA11-102’, and ‘LA11-103’. Journal of Plant Registrations (in press)
Leal AA, Mangolin CA, do Amaral Junior AT, Goncalves LSA, Scapim CA, Mott
AS, Eloi IBO, Cordoves V, da Silva MFP (2010) Efficiency of RAPD versus SSR markers for determining genetic diversity among popcorn lines. Genetics and Molecular Research 9(1): 9-18
Lee YH, Bhattarai G, Kim JC, Kim TI, Lee NH, Lee JC, Yi HK, Jhee EC (2009)
Oxidative stress resistance through blocking Hsp60 translocation followed by SAPK/JNK inhibition in aged human diploid fibroblasts. Cell Biochemistry and Function 27: 35-39
Li G and Quiros CF (2001) Sequence-related amplified polymorphism (SRAP), a new
marker system based on a simple PCR reaction: its application to mapping and gene tagging in Brassica. Theoretical and Applied Genetics 103: 455-461
Liang P, Pardee AB (1992) Differential display of eukaryotic messenger RNA by means
of the polymerase chain reaction. Science 257: 957-971 Liu X, Yu F, Rodermel S (2010) An Arabidopsis Pentatricopeptide Repeat Protein,
SUPRESSOR OF VARIEGATION7, is Required for FtsH-Mediated Chloroplast Biogenesis. Plant Physiology 154: 1588-1601
Lisitsyn N, Lisitsyn N, Wigler M (1993) Cloning the difference between two complex
genomes. Science 259: 946-951 Manners JM, Casu RE (2011) Transcriptome Analysis and Functional Genomics of
Sugarcane. Tropical Plant Biology 4: 9-21
77
Mantel NA (1967) The detection of disease clustering and a generalized regression approach. Cancer Research 27: 209-220
Marivet J, Margis-Pinheiro M, Frendo P, Burkard G (1994) Bean cyclophilin gene
expression during plant development and stress conditions. Plant Molecular Biology 26: 1181-1189
Maruyama, K, Sakuma Y, Kasuga M, Ito Y, Seki M, Goda H, Shimada Y, Yoshida S,
Shinozaki K, Yamaguchi-Shinozaki K (2004) Identification of cold-inducible downstream genes of the Arabidopsis DREB1A/CBF3 transcriptional factor using two microarray systems. The Plant Journal 38: 982–993
Mazur B, Tingey S (1995) Genetic mapping and introgression of genes with agronomic
importance. Current Opinion in Biothechnology 6: 175-182 Menossi M, Silva-Filho MC, Vincentz M, Van-Sluys M, and Souza GM (2008)
Sugarcane Functional Genomics: Gene Discovery for Agronomic Trait Development. International Journal of Plant Genomics 1-11
Mi H, Endo T, Schreiber U, Ogawa T, and Asada K (1993) NAD(P)H Dehydrogenase-
Dependent Cyclic Electron Flow around Photosystem I in the Cyanobacterium Synechocystis PCC 6803: a Study of Dark-Starved Cells and Spheroplasts. Plant Cell Physiology 35(2): 163-173
Mitsch W, Gosselink JG (2000) Wetlands 3rd edition. John Wiley & Sons, New York.
920 pp Morgante M, Olivieri A (1993) PCR-amplified microsatellites as markers in plant
genetics. The Plant Journal 3(1): 175-182 Nakamura T, Muramoto Y, Yokota S, Ueda A, Takabe T (2004) Structural and
transcriptional characterization of a salt-responsive gene encoding putative ATP-dependent RNA helicase in barley. Plant Science 167: 63-70
NASS (2011) National Agriculture Statistics Service (http://www.nass.usda.gov/) NCBI (2011) National Center for Biotechnology Information. Basic Local Alignment
Search Tool (BLAST) (http://blast.ncbi.nlm.nih.gov/Blast.cgi) Nogueira FTS, De Rosa Jr VE, Menossi M, Ulian EC, and Arruda P (2003) RNA
Expression Profiles and Data Mining of Sugarcane Response to Low Temperature. Plant Physiology 132: 1811-1824
78
Nogueira FTS, Schlogl PS, Camargo SR, Fernandez JH, De Rosa VE, Pompermayer P, Arruda P (2005) SsNAC23, a member of the NAC domain protein family, is associated with cold, herbivory and water stress in sugarcane. Plant Sciences 169: 93–106
Nguyen HT, Leipner J, Stamp P, Guerra-Peraza O (2009) Low temperature stress in
maize (Zea mays L.) induces genes involved in photosynthesis and signal transduction as studied by suppression subtractive hybridization. Plant Physiology and Biochemistry 47: 116-122
Novy A, Smouse PE, Hartman JM, Struwe L, Honig J, Miller C, Alvarez M, Bonos S
(2010) Genetic Variation of Spartina alterniflora in the New York Metropolitan Area and its Relevance for Marsh Restoration. Wetlands 30: 603-608
O’Brien DL, Freshwater DW (1999) Genetic diversity within tall forms Spartina
alterniflora Loisel. along the Atlantic and Gulf coasts of the United States. Wetlands 19: 352-358
Oliveira KM, Pinto LR, Marconi TG, Mollinari M, Ulian EC, Chabregas SM, Falco
MC, Burnquist W, Garcia AAF, and Souza AP (2009) Characterization of new polymorphic functional markers for sugarcane. Genome 52: 191-209
Parida S, Kumar KAR, Dalal V, Singh NK, Mohapatra T (2006) Unigene derived
microsatellite markers for the cereal genome. Theoretical and Applied Genetics 112: 808-817
Pinto LR, Oliveira KM, Marconi T, Garcia AAF, Ulian EC, and Souza AP (2006)
Characterization of novel sugarcane expressed sequence tag microsatellites and their comparison with genomic SSRs. Plant Breeding 125: 378-384
Pinto LR, Garcia AAF, Pastina MM, Teixeira LHM, Bressiani JA, Ulian EC, Bidoia
MAP, Souza AP (2010) Analysis of genomic and functional RFLP derived markers associated with sucrose content, fiber and yield QTLs in a sugarcane (Saccharum spp.) commercial cross. Euphytica 172: 313-327
Proffitt CE, Travis SE, Edwards KR (2003) Genotype and elevation influence Spartina
alterniflora colonization and growth in a created salt marsh. Ecological Applications 13: 180-192
RamanaRao M, Weindorf D, Breitenbeck G, Baisakh N (2011) Differential
Expression of the Transcripts of Spartina alterniflora Loisel (Smooth Cordgrass)
79
Induced in Response to Petroleum Hydrocarbon. Molecular Biotechnology DOI 10.1007/s12033-011-9436-0
Rocha FR, Papini-Terzi FS, Nishiyama MY Jr, Vêncio RZ, Vicentini R, Duarte RD,
de Rosa VE, Jr VF, Barsalobres C, Medeiros AH, Rodrigues FA, Ulian EC, Zingaretti SM, Galbiatti JA, Almeida RS, Figueira AV, Hemerly AS, Silva-Filho MC, Menossi M, Souza GM (2007) Signal transduction-related responses to phytohormones and environmental challenges in sugarcane. BMC Genomics 13: 8–71
Rohlf FJ (2005) Getting Started Guide: Numerical Taxonomy and Multivariate Analysis
System Version 2.2. Applied Biostatistics Inc., Port Jefferson, New York, pp: 22 Ruan SL, Ma HS, Wang SH, Fu YP, Xin Y, Liu WZ, Wang F, Tong JX, Wang SZ,
Chen HZ (2011) Proteomic identification of OsCYP2, a rice cyclophilin that confers salt tolerance in rice (Oryza sativa L.) seedlings when overexpressed. BMC Plant Biology 11(34): 1-15
Ryan A (2003) Agronomic and Molecular Characterization of Louisiana Native Spartina
Alterniflora Accessions. Dissertation Thesis for the degree of PhD. Louisiana State University, USA
Ryan A, Venuto B, Subudhi P, Harrison S, Shadow R, Fang X, Materne M, Utomo
H (2007) Identification and genetic characterization of smooth cordgrass for coastal wetland restoration. Journal of Aquatic Plant Management 45: 99–109
Salassi M, Deliberto MA, Legendre B (2010) Economic importance of Louisiana
Sugarcane production in 2009. Available at (http://www.lsuagcenter.com/MCMS/RelatedFiles/%7B258803AE-09BB-40B2-BFB2-2BCE140D6A08%7D/2009+Summary.pdf)
Sen S, Skaria R, Muneer A (2010) Genetic Diversity Analysis in Piper Species
(Piperaceae) Using RAPD Markers. Molecular Biotechnology 46: 72-79 Sloop C, McGray H, Blum M, Strong D (2005) Characterization of 24 additional
microsatellite loci in Spartina species (Poaceae). Conservation Genetics 6: 1049-1052 Stevenson GC (1965) Genetics and breeding of sugarcane. Longmans, Green and Co
Ltd, London Stiller J, Denton A (1995) One hundred years of Spartina alterniflora (Poaceae) in
Willapa Bay, Washington: random amplified polymorphic DNA analysis of an
80
invasive population. Molecular Ecology 4: 355-363 Subudhi PK, Baisakh N (2011) Spartina alterniflora Loisel., a halophyte grass model to
dissect salt stress tolerance. In Vitro Cellular and Developmental Biology-Plant 47(4): 441-457
Suman A, Ali K, Arro J, Parco AS, Kimbeng CA, Baisakh N (2011) Molecular
Diversity Among Members of the Saccharum Complex Assessed Using TRAP Markers Based on Lignin-Related Genes. Bioenergy Research DOI: 10.1007/s12155-011-9123-9
Swanson T (1996) Global values of biological diversity: the public interest in the
conservation of plant genetic resources for agriculture. Plant Genetic Resources Newsletter 105: 1-7
Thiel T, Michalek W, Varshney R, Graner A (2003) Exploiting EST databases for the
development of cDNA derived microsatellite markers in barley (Hordium L.). Theoretical and Applied Genetics 106: 411-422
Thomashow MF (2001) So what’s new in the field of plant cold acclimation? Lots! Plant
Physiology 125: 89-93 Thomashow MF (2010) Molecular Basis of Plant Cold Acclimation: Insights Gained
from Studying the CBF Cold Response Pathway. Plant Physiology 154: 571-577 Travis S, Proffitt C, Lowenfeld R, Mitchell T (2002) A comparative assessment of
genetic diversity among differently-aged populations of Spartina alterniflora on restored versus natural wetlands. Restoration Ecology 10: 37-42
Umamaheswari D, Paramathma M, Manivannan N (2010) Molecular genetic diversity
analysis in seed sources of Jatropha (Jatropha curcas L) using ISSR markers. Electronic Journal of Plant Breeding 1(3): 268-278
USDA, NRCS (2006) The PLANTS database. National Plant Data Center, Baton Rouge,
Louisiana. http://plants.usda.gov Utomo H, Wenefrida I, Materne M, Harrison S (2009) Genetic diversity and
population genetic structure of saltmarsh Spartina alterniflora from four coastal Louisiana basins. Aquatic Botany 90: 30-36
Valiela I, Teal JM, Deuser WG (1978) The nature of growth forms in the salt marsh
grass Spartina alterniflora. American Naturalist 112: 461-470
81
Varshney RK, Graner A, Sorrells ME (2005) Genic microsatellite markers: features and applications. Trends Biotechnology 23:48–55
Velculescu VE, Zhang L, Vogelstein B, Kinzler KW (1995) Serial analysis of gene
expression. Science 270: 484-487 Vettore AL, da Silva FR, Kemper EL, Arruda P (2001) The libraries that made
SUCEST. Genetics and Molecular Biology 24: 1–7 Vettore AL, da Silva FR, Kemper EL, Souza GM, da Silva AM et al., (2003) Analysis
and functional annotation of an expressed sequence tag collection for tropical crop sugarcane. Genome Research 13: 2725-2735
Walker MB, Roy LM, Coleman E, Voelker R, Barkan A (1999) The Maize tha4 Gene
Functions in Sec-Independent Protein Transport in Chloroplasts and is related to hcf106, tatA, and tatB. The Journal of Cell Biology 147(2): 267-275
Walkup CJ (2011) Spartina alterniflora. In: Fire Effects Information System. U.S.
Department of Agriculture, Forest Service, Rocky Mountain Research Station, Fire Sciences Laboratory (Producer). Available: (http://www.fs.fed.us/database/feis/)
Wen M, Wang H, Xia Z, Zou M, Lu Ch, Wang W (2010) Development of EST-SSR
and genomic-SSR markers to assess genetic diversity in Jatropha curcas L. Biomedical Research Notes 3: 1-8
Williams J, Kubelik A, Livak K, Rafalski J (1990) DNA polymorphisms amplified by
arbitrary primers are useful as genetic markers. Nucleic Acids Research 18: 6531-6535
Wu W, Zheng YL, Chen L, Wei YM, Yang RW, Yan ZH (2005) Evaluation of genetic
relationships in the genus Houttuynia Thunb. In China based on RAPD and ISSR markers. Biochemical Systematics and Ecology 33, 1141-1157
Yap I, Nelson R (1996) WinBoot: A program for performing bootstrap analysis of binary
data to determine the confidence limits of UPGMA-based dendrograms. International Rice Research Instititute (IRRI). Manila, Philippines, 22p
Zaghloul M, Hamrick J, Moustafa A, Kamel W, El-Ghareeb R (2006) Genetic
Diversity Within and Among Sinai Populations of Three Ballota Species (Lamiaceae). Journal of Heredity 97(1): 45-54
82
Vita
Lina was born in Lima, Peru. In 2003, she completed her bachelor degree in
biological sciences at the Universidad Nacional Mayor de San Marcos, Lima, Peru. Her
professional experience as well as her passion into the world of plants began in 2004,
when she joined to the International Potato Center in Lima to perform her undergraduate
thesis under the supervision of Dr. Marc Ghislain. She completed her undergraduate
thesis thanks to the scholarship obtained by the International Potato Center to conduct
research on the characterization of the resistance to the late blight in potato. Based on her
results, she received the title of Biologist with major in cellular biology and genetics in
2008. In 2009, she worked as a research assistant at National Institute of Agricultural
Research in the department of molecular biology and plant genetic resource conservation
for one year on modified genetically organisms in maize.
In 2010, Lina joined Louisiana State University in Baton Rouge, Louisiana, to
pursue her graduate studies. During this time, she has had the opportunity to learn new
molecular techniques, as well as, surviving to graduate school. Her thesis research
involves utilization of molecular markers in assessing genetic diversity in smooth
cordgrass and sugarcane. She recently has attended and presented a poster at the
International Annual Meetings in San Antonio, Texas, and has been awarded in the
category of poster competition. She is also an active member of Crop Science Society of
America. She is currently a candidate for the degree of Master of Science in the area of
agronomy and crop sciences, which will be awarded in May 2012.
Lina is an avid lover of shopping. She also enjoys traveling, food, photography and
good company.