Embed Size (px)
Citation preview
STRUCTURE OF CHEMICAL COMPOUNDS,
METHODS OF ANALYSIS AND PROCESS CONTROL
DEVELOPMENT AND VALIDATION OF A METHOD
FOR QUANTITATIVE DETERMINATION OF KEMANTANE DRUG
SUBSTANCE BY GAS CHROMATOGRAPHY
A. V. Tolkacheva,1,2 L. N. Grushevskaya,1 N. I. Avdyunina,1 B. M. Pyatin,1
V. I. Prokof’eva,2 and L. M. Gaevaya1
Translated from Khimiko-Farmatsevticheskii Zhurnal, Vol. 47, No. 12, pp. 42 – 47, December, 2013.
Original article submitted October 29, 2013.
A new technique for quantitative determination of the active ingredient in pharmaceutical drug substance
kemantane (5-hydroxyadamantan-2-one) using gas chromatography with a flame-ionization detector
(GC-FID) was developed and validated. The chromatographic separation was performed on a WCOT fused
silica capillary column (CP-WAX 52 CB, 50 m � 0.32 mm, 1.2-mm-thick layer of stationary phase). The opti-
mum parameters of the chromatographic system and robustness factors of the technique were determined. The
technique was validated with respect to the main parameters. Several batches of pharmaceutical kemantane
drug substance were analyzed.
Keywords: kemantane, 5-hydroxyadamantan-2-one, pharmaceutical drug substance, quantitative determina-
tion of active ingredient, GC-FID, GC chromatography, adamantane derivatives, validation, oximation, titra-
tion in non-aqueous medium.
Kemantane (I), 5-hydroxyadamantan-2-one, is a struc-
tural derivative of adamantane. Studies of the pharmacologi-
cal activity of I at Zakusov State Institute of Pharmacology,
Russian Academy of Medical Sciences (ZSIP RAMS),
showed that it possesses anti-Parkinson’s and immunotropic
activity and is capable of relieving alcohol abstinence syn-
drome. Also, it has high cerebrovascular activity and en-
hances blood flow to ischemic tissue [1, 2]. The high phar-
macological activity of I indicated that further research on
the pharmaceutical development of I as a drug substance was
advisable.
A method for quantitative determination of I drug sub-
stance was proposed earlier. It consisted of oximation of the
ketone by hydroxylamine hydrochloride in the presence of an
EtOH solution of N,N-diphenylguanidine, a strong base that
removed HCl from hydroxylamine hydrochloride [3]. The
excess of hydroxylamine was titrated with an EtOH solution
of HClO4
(0.2 M) in the presence of bromophenol blue indi-
cator. The color of the indicator near the equivalence point
was compared with that of a blank sample consisting of a so-
lution of hydroxylamine hydrochloride and EtOH in order to
increase the accuracy of the end-point determination during
titration of the test sample. It was necessary to observe rigor-
ously the order of addition of the components because of the
danger of forming acetals and ketals. A control test was car-
ried out in parallel. Later, changes in the ratios of used re-
agents were introduced and potentiometry was proposed for
determining the titration end-point.
The oximation method gave reproducible results if the
aforementioned conditions were rigorously observed. How-
ever, it had serious drawbacks such as long reagent prepara-
tion times, complications in determining the equivalence
point, and the presence in I of impurities containing ketones
and reacting with hydroxylamine under the titration condi-
tions.
664
0091-150X/14/4712-0664 © 2014 Springer Science+Business Media New York
Pharmaceutical Chemistry Journal, Vol. 47, No. 12, March, 2014 (Russian Original Vol. 47, No. 12, December, 2013)
1Zakusov State Institute of Pharmacology, Russian Academy of Medical
Sciences, Moscow, 125315 Russia.2
Sechenov First Moscow State Medical University, Moscow, 119991 Russia
The goal of the present work was to find a more specific,
accurate, and reproducible method for quantitative determi-
nation of I drug substance. For this, we developed a tech-
nique for quantitative determination of I using gas chroma-
tography (GC) and also compared the drug substance analyt-
ical results obtained by the GC technique with those from
oximation.
EXPERIMENTAL PART
We studied samples of I drug substance and its technical
impurities adamantan-2-one (IV) and adamantane-2,6-dione
(II), which were prepared by the Drug Synthesis Technology
Group at ZSIP RAMS. 1-Adamantaneethanol (III) (Aldrich
Chem. Co., CAS No. 6240-11-5) was used as an internal
standard for developing the technique.
I drug substance is characterized visually as a white or
almost white crystalline powder. It is readily soluble in H2O,
EtOH (95%), and CHCl3
and difficultly soluble in hexane
and petroleum ether. The technical impurities (II and IV) are
white crystalline compounds that are readily soluble in
MeOH and CHCl3, soluble in EtOH and H
2O, and moder-
ately soluble in hexane. The internal standard III is a white
crystalline powder with a cream tint that is poorly soluble in
H2O and readily soluble in EtOH.
Compound I was analyzed quantitatively by oximation
using the following procedure. The drug (~0.15 g, accurate
weight) was dissolved in hydroxylamine hydrochloride solu-
tion (8 mL), treated accurately with diphenylguanidine solu-
tion (0.05 M, 40 mL), stirred, left to stand protected from
light for 30 min, and titrated with alcoholic HClO4
(0.2 M).
The titration end-point was determined by potentiometry.
A control test was carried out in parallel.
One milliliter of alcoholic HClO4
(0.2 M) corresponded
to 0.03324 g of C10
H14
O2, which should be at least 98.5%
and less than 101.0% calculated as the dry substance.
Preparation of hydroxylamine hydrochloride solu-
tion. Hydroxylamine hydrochloride (7.0 g) was dissolved in
H2O (20 mL) in a 200-mL volumetric flask. The solution
volume was adjusted to the mark using EtOH (95%).
Preparation of diphenylguanidine solution (0.05 M).
Diphenylguanidine (5.3 g, pure, MRTU 6-09-4811–67) was
dissolved in EtOH (95%) (200 mL) in a 500-mL volumetric
flask. The solution volume was adjusted to the mark with the
same solvent and stirred.
Preparation of bromophenol blue solution. Bromophenol
blue (1 g) was dissolved in EtOH (95%) (100 mL).
Preparation of alcoholic HClO4
(0.2 M). HClO4
solution
(20.52 mL, 65%) was placed into a 1-L volumetric flask, ad-
justed to the mark with EtOH (95%), and stirred.
HClO4
solution titration. Diphenylguanidine (~0.4 g, ac-
curate weight, pure, MRTU 6-09-4811–67) was dried at
105°C to constant weight, dissolved in anhydrous EtOH
(25 mL), and titrated with the prepared HClO4
solution in the
presence of one drop of bromophenol blue solution until the
violet color turned yellow.
The calibration coefficient was calculated using the first
method, where T = 0.04276.
The potentiometric titration end-point was determined on
a SevenEasy S20-K instrument (Mettler Toledo) with an
Inlab 413 universal electrode.
An alternative technique for quantitative determination
of the active ingredient in kemantane drug substance was de-
veloped and validated on a GC with a flame-ionization de-
tector (Varian GC-450, Netherlands) and an autosampler
(Varian PAL Autosampler, Netherlands). The signal and ob-
Development and Validation of a Method for Quantitative Determination 665
O
O
O
O
OH
OH
IV
III
II
I
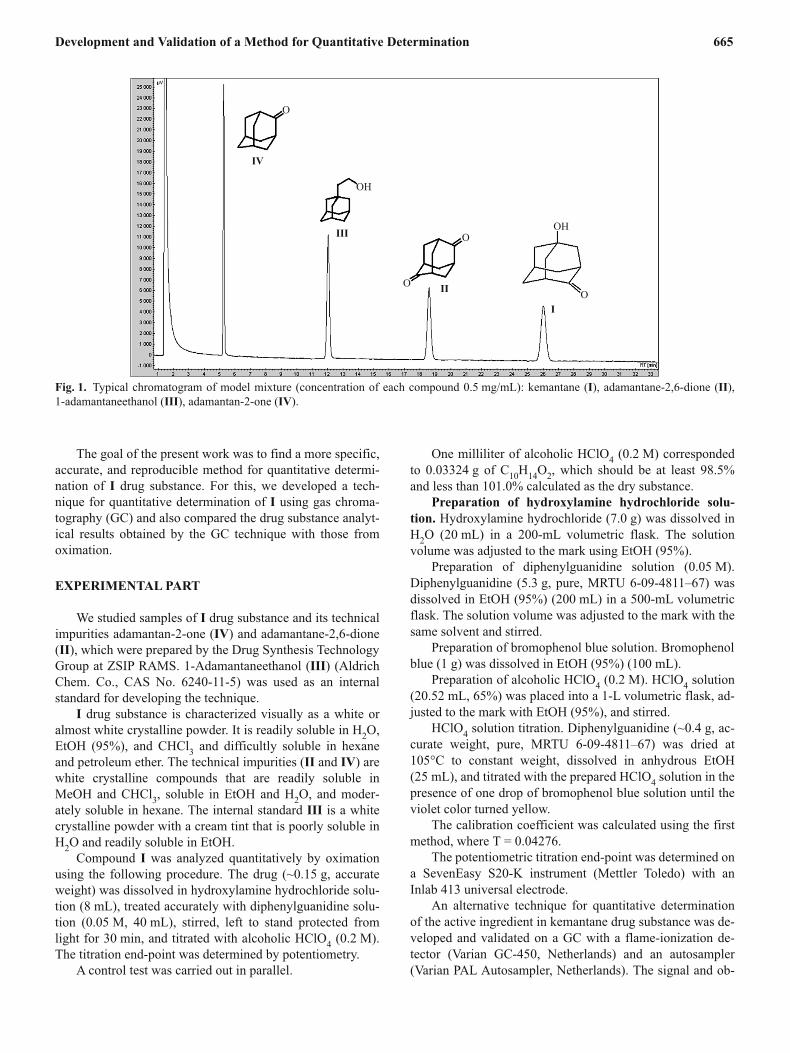
Fig. 1. Typical chromatogram of model mixture (concentration of each compound 0.5 mg/mL): kemantane (I), adamantane-2,6-dione (II),
1-adamantaneethanol (III), adamantan-2-one (IV).
tained results were processed using the Galaxie program
(Galaxie Chromatography Data System, version
1.9.302.952).
The technique for quantitative determination of I in the
drug substance by GC was developed using samples of I
drug substance with various contents of technical impurities.
Both nonpolar (hexane, EtOAc) and weakly polar sol-
vents (MeOH, EtOH, H2O) were examined as the solvent for
sample preparation. EtOH (95%) was used as the solvent be-
cause of the solubility of the analyzed compounds (I, III, and
possible accompanying technical impurities II and IV) and
also the influence of the solvent on the chromatographic sep-
aration.
RESULTS AND DISCUSSION
The following conditions were chosen as a result of the
studies: fused silica capillary column CP-WAX 52 CB
(50 m � 0.32 mm) with polyethyleneglycol stationary phase
(1.2 �m); vaporizer temperature 220°C; thermostat tempera-
ture 200°C; detector temperature 230°C; carrier gas (N2)
flow rate 5 mL/min; purge gas (N2) flow rate 25 mL/min; H
2
flow rate 30 mL/min; air flow rate 300 mL/min; flow divi-
sion 1:40.
Under these conditions, I and its technical impurities
were completely separated (Fig. 1).
The internal standard method was proposed for quantita-
tive determination of I in the drug substance.
The choice of standard was based on satisfying the fol-
lowing requirements. It should have a chemical structure
similar to that of the determined compound. It should appear
in the chromatogram as a well resolved peak.
Compound III was chosen as the internal standard be-
cause it structure was similar to that of the determined com-
666 A. V. Tolkacheva et al.
0 0.2 0.4 0.6 0.8 1.0 1.2
4000
3000
2000
1000
0
1
2
y x= 4343.5 – 0.8812
y x= 3513.2 – 11.747
R2
= 0.9999
R2
= 0.9999
S, mV · min
C, mg/mL
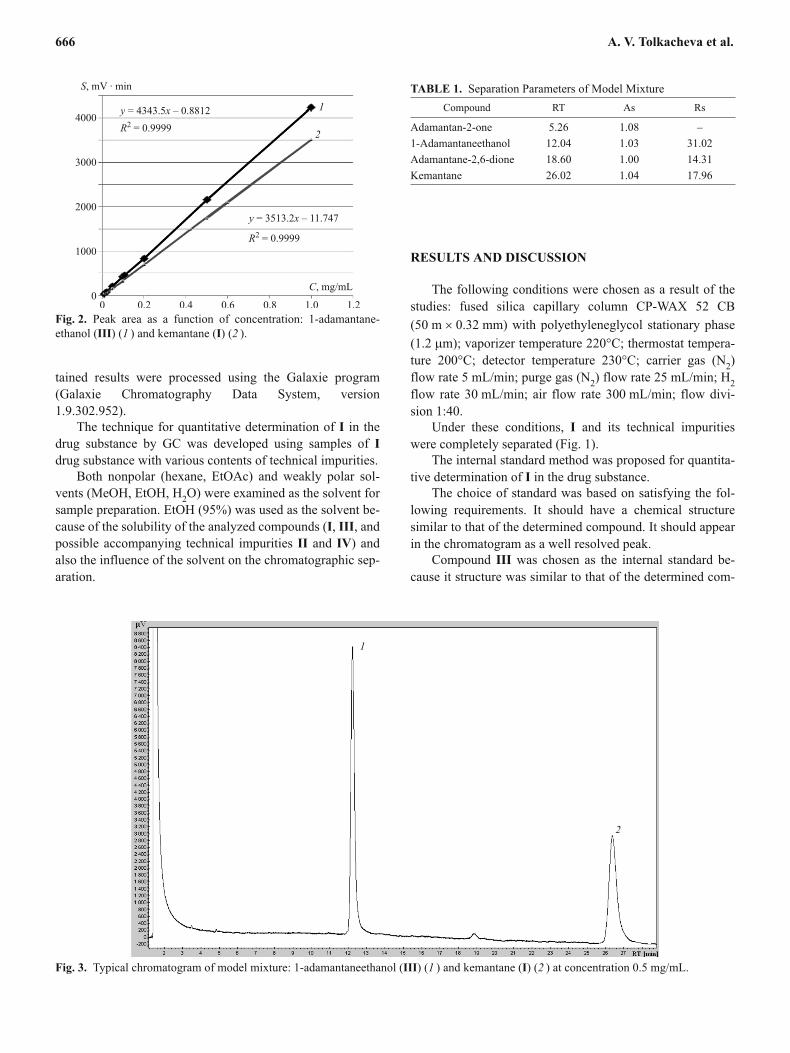
Fig. 2. Peak area as a function of concentration: 1-adamantane-
ethanol (III) (1 ) and kemantane (I) (2 ).
TABLE 1. Separation Parameters of Model Mixture
Compound RT As Rs
Adamantan-2-one 5.26 1.08 –
1-Adamantaneethanol 12.04 1.03 31.02
Adamantane-2,6-dione 18.60 1.00 14.31
Kemantane 26.02 1.04 17.96
1
2
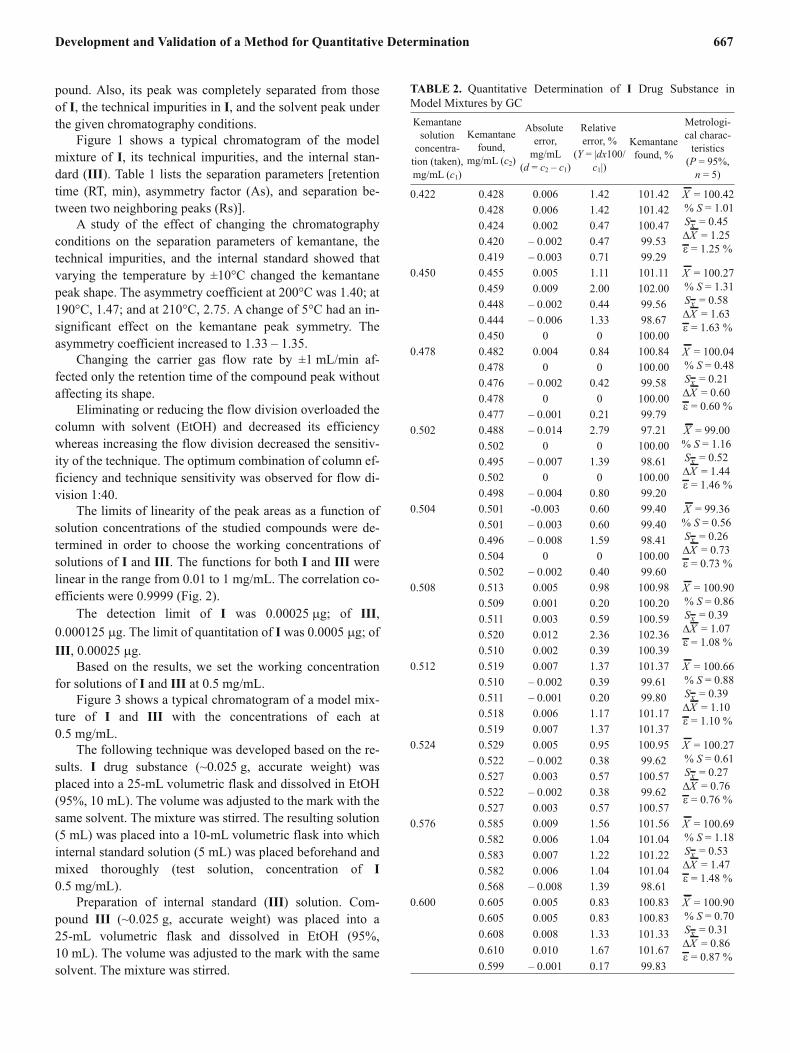
Fig. 3. Typical chromatogram of model mixture: 1-adamantaneethanol (III) (1 ) and kemantane (I) (2 ) at concentration 0.5 mg/mL.
pound. Also, its peak was completely separated from those
of I, the technical impurities in I, and the solvent peak under
the given chromatography conditions.
Figure 1 shows a typical chromatogram of the model
mixture of I, its technical impurities, and the internal stan-
dard (III). Table 1 lists the separation parameters [retention
time (RT, min), asymmetry factor (As), and separation be-
tween two neighboring peaks (Rs)].
A study of the effect of changing the chromatography
conditions on the separation parameters of kemantane, the
technical impurities, and the internal standard showed that
varying the temperature by ±10°C changed the kemantane
peak shape. The asymmetry coefficient at 200°C was 1.40; at
190°C, 1.47; and at 210°C, 2.75. A change of 5°C had an in-
significant effect on the kemantane peak symmetry. The
asymmetry coefficient increased to 1.33 – 1.35.
Changing the carrier gas flow rate by ±1 mL/min af-
fected only the retention time of the compound peak without
affecting its shape.
Eliminating or reducing the flow division overloaded the
column with solvent (EtOH) and decreased its efficiency
whereas increasing the flow division decreased the sensitiv-
ity of the technique. The optimum combination of column ef-
ficiency and technique sensitivity was observed for flow di-
vision 1:40.
The limits of linearity of the peak areas as a function of
solution concentrations of the studied compounds were de-
termined in order to choose the working concentrations of
solutions of I and III. The functions for both I and III were
linear in the range from 0.01 to 1 mg/mL. The correlation co-
efficients were 0.9999 (Fig. 2).
The detection limit of I was 0.00025 �g; of III,
0.000125 �g. The limit of quantitation of I was 0.0005 �g; of
III, 0.00025 �g.
Based on the results, we set the working concentration
for solutions of I and III at 0.5 mg/mL.
Figure 3 shows a typical chromatogram of a model mix-
ture of I and III with the concentrations of each at
0.5 mg/mL.
The following technique was developed based on the re-
sults. I drug substance (~0.025 g, accurate weight) was
placed into a 25-mL volumetric flask and dissolved in EtOH
(95%, 10 mL). The volume was adjusted to the mark with the
same solvent. The mixture was stirred. The resulting solution
(5 mL) was placed into a 10-mL volumetric flask into which
internal standard solution (5 mL) was placed beforehand and
mixed thoroughly (test solution, concentration of I
0.5 mg/mL).
Preparation of internal standard (III) solution. Com-
pound III (~0.025 g, accurate weight) was placed into a
25-mL volumetric flask and dissolved in EtOH (95%,
10 mL). The volume was adjusted to the mark with the same
solvent. The mixture was stirred.
Development and Validation of a Method for Quantitative Determination 667
TABLE 2. Quantitative Determination of I Drug Substance in
Model Mixtures by GC
Kemantane
solution
concentra-
tion (taken),
mg/mL (c1)
Kemantane
found,
mg/mL (c2)
Absolute
error,
mg/mL
(d = c2 – c1)
Relative
error, %
(Y = |dx100/
c1|)
Kemantane
found, %
Metrologi-
cal charac-
teristics
(P = 95%,
n = 5)
0.422 0.428 0.006 1.42 101.42 X = 100.42
% S = 1.01
Sx = 0.45
�X = 1.25
� = 1.25 %
0.428 0.006 1.42 101.42
0.424 0.002 0.47 100.47
0.420 – 0.002 0.47 99.53
0.419 – 0.003 0.71 99.29
0.450 0.455 0.005 1.11 101.11 X = 100.27
% S = 1.31
Sx = 0.58
�X = 1.63
� = 1.63 %
0.459 0.009 2.00 102.00
0.448 – 0.002 0.44 99.56
0.444 – 0.006 1.33 98.67
0.450 0 0 100.00
0.478 0.482 0.004 0.84 100.84 X = 100.04
% S = 0.48
Sx = 0.21
�X = 0.60
� = 0.60 %
0.478 0 0 100.00
0.476 – 0.002 0.42 99.58
0.478 0 0 100.00
0.477 – 0.001 0.21 99.79
0.502 0.488 – 0.014 2.79 97.21 X = 99.00
% S = 1.16
Sx = 0.52
�X = 1.44
� = 1.46 %
0.502 0 0 100.00
0.495 – 0.007 1.39 98.61
0.502 0 0 100.00
0.498 – 0.004 0.80 99.20
0.504 0.501 -0.003 0.60 99.40 X = 99.36
% S = 0.56
Sx = 0.26
�X = 0.73
� = 0.73 %
0.501 – 0.003 0.60 99.40
0.496 – 0.008 1.59 98.41
0.504 0 0 100.00
0.502 – 0.002 0.40 99.60
0.508 0.513 0.005 0.98 100.98 X = 100.90
% S = 0.86
Sx = 0.39
�X = 1.07
� = 1.08 %
0.509 0.001 0.20 100.20
0.511 0.003 0.59 100.59
0.520 0.012 2.36 102.36
0.510 0.002 0.39 100.39
0.512 0.519 0.007 1.37 101.37 X = 100.66
% S = 0.88
Sx = 0.39
�X = 1.10
� = 1.10 %
0.510 – 0.002 0.39 99.61
0.511 – 0.001 0.20 99.80
0.518 0.006 1.17 101.17
0.519 0.007 1.37 101.37
0.524 0.529 0.005 0.95 100.95 X = 100.27
% S = 0.61
Sx = 0.27
�X = 0.76
� = 0.76 %
0.522 – 0.002 0.38 99.62
0.527 0.003 0.57 100.57
0.522 – 0.002 0.38 99.62
0.527 0.003 0.57 100.57
0.576 0.585 0.009 1.56 101.56 X = 100.69
% S = 1.18
Sx = 0.53
�X = 1.47
� = 1.48 %
0.582 0.006 1.04 101.04
0.583 0.007 1.22 101.22
0.582 0.006 1.04 101.04
0.568 – 0.008 1.39 98.61
0.600 0.605 0.005 0.83 100.83 X = 100.90
% S = 0.70
Sx = 0.31
�X = 0.86
� = 0.87 %
0.605 0.005 0.83 100.83
0.608 0.008 1.33 101.33
0.610 0.010 1.67 101.67
0.599 – 0.001 0.17 99.83
The injected sample volume was 1 �L. The test solution
was chromatographed under the conditions described above
to produce at least four chromatograms.
The content of I (X, %) was calculated using the follow-
ing formula:
XS K C
S C
x st
st x
(%) %�
� �
�
�100 ,
where Sx
is the peak area of I in the test solution (mV � min);
Sst, the peak area of the internal standard (III) in the test so-
lution (mV � min); Cst, the concentration of the internal stan-
dard (III) in the test solution (mg/mL); Cx, the concentration
of I in the test solution (mg/mL); and K, a calibration coeffi-
cient.
The calibration coefficient was calculated for model
mixtures of I and III.
The technique for preparing the model mixtures for cal-
culating the calibration coefficient was analogous to that for
preparing samples for analyzing batches of I. The formula
for calculating the calibration coefficient was
KS C
S C
st kem
kem st
�
�
�
,
where Sst
is the peak area of III (mV � min); Skem
, the peak
area of I (mV � min); Cst, the solution concentration of III
(mg/mL); and Ckem
, the solution concentration of I (mg/mL).
The validation characteristics were the accuracy and pre-
cision (repeatability and intralaboratory precision). They
were evaluated using model mixtures of I and III. Table 2
presents the analytical results.
Table 2 shows that the relative error of the result of a sin-
gle determination was less than 3% and of five repeated de-
terminations less than 1% with a relative error of the mean of
less than 1.7%. The results in Table 2 confirmed that the cho-
sen technique parameters provided the required accuracy and
precision for the developed analytical technique.
The chromatography system was optimized using the rel-
ative retention time (RRT) of I to that of the internal standard
(III) and also the number (N) of theoretical plates, the asym-
metry factor (As), and the relative standard deviation (varia-
tion coefficient) (RSD). Data for the optimization of the
chromatography system were obtained by analyzing model
mixtures of I and III with concentrations of each at
0.5 mg/mL.
Table 3 presents the results of the calculation and the ac-
ceptability criteria of these parameters.
Batches of I drug substance were analyzed using the
techniques described above for quantitative determination of
I (oximation and GC methods).
Table 4 presents results for quantitative determination of
I by oximation; Table 5, by the GC method.
Tables 4 and 5 show that the results for quantitative de-
termination of several samples of I by the oximation and GC
methods differed significantly. For example, 100.05% of I
was found in sample 1 by the oximation method; 97.10%, by
the GC method. The values obtained for sample 3 were
103.81 and 99.20%, respectively.
Apparently, such results are explained by the low speci-
ficity of the oximation method. The presence in I drug sub-
stance of technical impurity II interferes with the quantita-
tive determination. The contents of this impurity in samples
1, 2, and 3 were greater than 2.5% at 2.82, 2.74, and 2.96%,
respectively, whereas it was 1.47% in sample 4.
The GC technique did not have this drawback. In our
opinion, this was its advantage despite the higher relative er-
668 A. V. Tolkacheva et al.
TABLE 3. Chromatographic System Optimum Parameters
Model
mixture
No.
Optimum parameter
RRT As N RSD, %
1 2.15 0.02 1.50 0.09 20351 1571 0.96
2 2.15 0.01 1.58 0.02 19507 1345 0.44
3 2.15 0.01 1.55 0.17 18562 1872 0.33
Acceptability
criteria
2.15 0.02 Less
than 1.6
At least
10,000
Less
than 2%
TABLE 4. Quantitative Determination of I Drug Substance
Batches by Oximation
Parameter
Expt. No.
1 2 3 4
Result, % 99.30 100.46 102.74 100.03
100.18 100.66 104.11 102.35
100.38 100.08 104.49 99.94
99.64 100.79 103.58 98.86
100.75 100.22 104.12 99.98
Metrological
characteris-
tics,
P = 95%,
n = 5
X = 100.05
S = 0.67
Sx = 0.33
�X = 0.92
� = 0.92 %
X = 100.44
S = 0.087
Sx = 0.13
�X = 0.36
� = 0.36 %
X = 103.81
S = 0.68
Sx = 0.30
�X = 0.83
� = 0.80 %
X = 100.23
S = 1.28
Sx = 0.57
�X = 1.58
� = 1.58 %
TABLE 5. Quantitative Determination of I Drug Substance
Batches by GC
Parameter
Expt. No.
1 2 3 4
Result, % 96.62 101.75 97.46 99.48
97.01 100.20 100.07 99.42
98.81 100.24 100.72 99.66
95.94 100.60 98.53 100.08
Metrological
characteris-
tics,
P = 95%,
n = 4
X = 97.10
S = 1.23
Sx = 0.61
�X = 1.94
�X = 2.0 %
X = 100.70
S = 0.72
Sx = 0.36
�X = 1.14
�X = 1.13 %
X = 99.20
S = 1.48
Sx = 0.74
�X = 2.35
�X = 2.37 %
X = 99.66
S = 0.30
Sx = 0.15
�X = 0.48
�X = 0.48 %
ror of a determination. It allowed it to be chosen for quantita-
tive determination of kemantane.
Thus, we developed a technique for quantitative determi-
nation of I drug substance using GC. It was shown using
intralaboratory reproducibility results that the GC technique
was comparable to the previously developed oximation
method and was more specific and accurate.
The developed GC technique was validated. The tech-
nique was specific, linear, sensitive, accurate, and precise.
Optimum parameters for the chromatography system and
conditions providing precise results (technique robustness
factors) were proposed.
The developed GC technique can be used for routine
quantitative analysis of I in the drug substance in both the
pharmaceutical and chemical industries. It is planned to in-
clude it in the draft FSP for kemantane drug substance.
REFERENCES
1. R. S. Mirzoyan, T. S. Gan'shina, D. V. Maslennikov, et al., Eksp.
Klin. Farmakol., 75(6), 27 – 30 (2012).
2. D. V. Maslennikov, N. I. Avdyunina, and B. M. Pyatin, in: Ab-
stracts of Papers of the IVth Convention of Russian Pharmacolo-
gists [in Russian], Kazan (2012), p. 129.
3. M. Yu. Volkova, S. V. Merinova, O. B. Stepanenko, and
B. M. Pyatin, USSR Pat. No. 1,482,392, MKI4 A61K31 / 00,
G 01 No. 31 / 00, Nov. 30, 1993, “Method of quantitative deter-
mination of 1-hydroxy-4-adamantanone and methyl-tert-butyl-
ketone” [in Russian]; Byull. Izobret., No. 43-44 (1993).
Development and Validation of a Method for Quantitative Determination 669
![INTRODUCTION - catalogimages.wiley.com · for quantitative measurement has been introduced [1]. Examples of this technique are the high-performance liquid chromatography--diode array](https://img.pdfslide.net/doc/110x75/5f880283ccea46796116df6f/introduction-for-quantitative-measurement-has-been-introduced-1-examples-of.jpg)