Embed Size (px)
Citation preview
J Young Pharm Vol 2 / No 2 183
and specific angiotensin II antagonist acting on the AT1 receptor subtype. Its empirical formula is C24H29N5O3, its molecular weight is 435.5. Valsartan is a white fine powder. It is soluble in ethanol and methanol and slightly soluble in water. It is available as tablets for oral administration, containing 40 mg, 80 mg, 160 mg, or 320 mg of valsartan.
According to current good manufacturing practices, all drugs must be tested with a stability-indicating assay method before release. Stress testing of the drug substance can help identify the likely degradation products, which can in turn help establish the degradation pathways and the intrinsic stability of the molecule and validate the stability-indicating power of the analytical procedures used. The nature of the stress testing will depend on the individual drug substance and the type of drug product involved. Keeping into the view of susceptibility of valsartan under variety of conditions, it was felt that a HPLC method of analysis that separates the
INTRODUCTION
Valsartan is chemically described as N-(1-oxopentyl)-N-[[2′-(1H-tetrazol-5-yl) [1,1′-biphenyl]-4-yl]methyl]-L-valine [Figure 1]. Valsartan is a nonpeptide, orally active,
Pharmaceutical Analysis
Development and Validation of a Specific Stability Indicating High Performance Liquid Chromatographic Method for Valsartan
Rao KS, Jena N, Rao MEB
Roland Institute of Pharmaceutical Sciences, Berhampur-760010, Orissa, India
Address for correspondence: Dr. K. Srinivasa Rao; E-mail: [email protected]
ABSTRACT
A stability-indicating HPLC assay method has been developed and validated for valsartan in bulk drug and pharmaceutical dosage forms. An isocratic RP-HPLC was achieved on Waters 2695 using Symmetry C18 (250mm × 4.6mm × 5µ) column with the mobile phase consisting of 0.02 mM sodium dihydrogen ortho-phosphate, pH adjusted to 2.5 using ortho-phosphoric acid (solvent A), and acetonitrile (solvent B) in the ratio of 58:42 %v/v. The stress testing of valsartan was carried out under acidic, alkaline, oxidative, thermal, and photolytic conditions. Valsartan was well resolved from its degradation products. The proposed method was validated as per ICH guidelines. The method was found to be suitable for the quality control of valsartan in bulk and pharmaceutical dosage forms as well as the stability-indicating studies.
Key words: Assay, stress studies, validation, valsartan
DOI: 10.4103/0975-1483.63166
Figure 1: Chemical structure of valsartan
184 J Young Pharm Vol 2 / No 2
drug from the degradation products formed under ICH suggested conditions (hydrolysis, oxidation, photolysis, and thermal stress)[1] would be of general interest. These studies provide valuable information on drug’s inherent stability and help in the validation of analytical methods to be used in stability studies.[2] A survey on literature reveals that a very few methods were developed for the estimation of valsartan in biological fluids and marketed formulations.[3-10]
The literature has demonstrated that a stability-indicating LC method for determination of valsartan in the presence of its impurities and degradation products generated from forced decomposition studies was developed.[11] Nevertheless, in that reported study, the retention time of valsartan was obtained at 27 min. However, in our present method the retention time of valsartan was achieved at 9.3 min. Thus, the aim of our study was to develop a simple, selective, economic, specific stability indicating the LC method that can be used to determine the related substances and also the assay of bulk samples of valsartan. This paper deals with the development of stability indicating the analytical method using the samples generated from forced degradation studies.
EXPERIMENTAL DETAILS
Materials
Gift sample of valsartan was received from analytical research and development laboratory of International Speciality Product, Hyderabad, India. HPLC grade acetonitrile was purchased from Fischer Scientific, India. Analytical reagent grade sodium dihydrogen ortho-phosphate was purchased from S.D. Fine Chem. Limited, India, and hydrogen peroxide were purchased from Qualigens Fine Chemicals, India. High pure water was prepared by using Millipore Milli Q plus purification system. Valzar® commercial formulations were purchased from the local market.
Instrumentation
The LC system, used for method development, forced degradation studies, and method validation was Waters 2695 series (manufactured by Waters Technologies, USA) LC system with a diode array detector. The output signal was monitored and processed using Empower software (designed by Waters Technologies, USA) on lenovo computer (Digital Equipment Co.).
Chromatographic conditions
The chromatographic column used was Waters using Symmetry C18 (250mm × 4.6mm × 5µ). The mobile
phase consists of a mixture of 0.02 mM sodium dihydrogen ortho-phosphate, pH adjusted to 2.5 using ortho-phosphoric acid (solvent A), and acetonitrile (solvent B) in 58: 42 ratio. The mobile phase was pumped from the solvent reservoir to the column at a flow rate of 1 ml/min for 20 min. The column temperature was maintained at 23 ± 1 °C. The eluate was monitored at 250 nm using the PDA detector. The injection volume was 10 (μl). Mobile phase was used as diluent during the standard and test samples preparation.
Preparation of standard solutions
Stock solution of valsartan was prepared by dissolving 25 mg of valsartan in 25 ml of volumetric flask containing 20 ml acetonitrile. The solution was sonicated for about 20 min and then made up to volume with acetonitrile. Aliquots of the standard stock solution of valsartan were transferred using A-grade bulb pipettes into 10 ml volumetric flasks and the solutions were made up to volume with mobile phase to give final concentrations of 1,5,50,100,150, and 200 µg/ml.
Preparation of valsartan tablets for assay
Twenty tablets were weighed, finely powdered, and an accurately weighed sample of powdered tablets equivalent to 25 mg of valsartan was treated with acetonitrile and phosphate buffer (pH 2.5) in a 25 ml volumetric flask using ultra sonicator. This solution was filtered through 0.45 µm filter paper. Suitable aliquot of the filtered solution was added to a volumetric flask and made up to volume with mobile phase to yield a starting concentration of 0.1 mg/ml.
Forced degradation studies
In order to determine whether the analytical method and assay were stability-indicating, valsartan tablets and valsartan active pharmaceutical ingredient (API) powder were stressed under various conditions to conduct forced degradation studies. Intentional degradation was attempted to stress conditions acid hydrolysis (using 0.75N, 1.5N HCl), base hydrolysis (using 1.5N NaOH), oxidative degradation (using 3.0%, 10% H2O2), photolytic degradation (UV cabinet, an overall illumination of ≥210 Wh/m2 at room temperature with UV radiation at 320–400 nm), and thermal treatment (heated at 50°C, 80°C for 2 h) to evaluate the ability of the proposed method to separate valsartan from its degradation products. Valsartan at a concentration of 0.5 mg/ml was used in all the degradation studies. After completion of the
Rao, et al. J Young Pharm. 2010;2(2): 183-189
J Young Pharm Vol 2 / No 2 185
degradation processes, the solutions were neutralized and diluted with mobile phase.
Acid and alkaline degradation
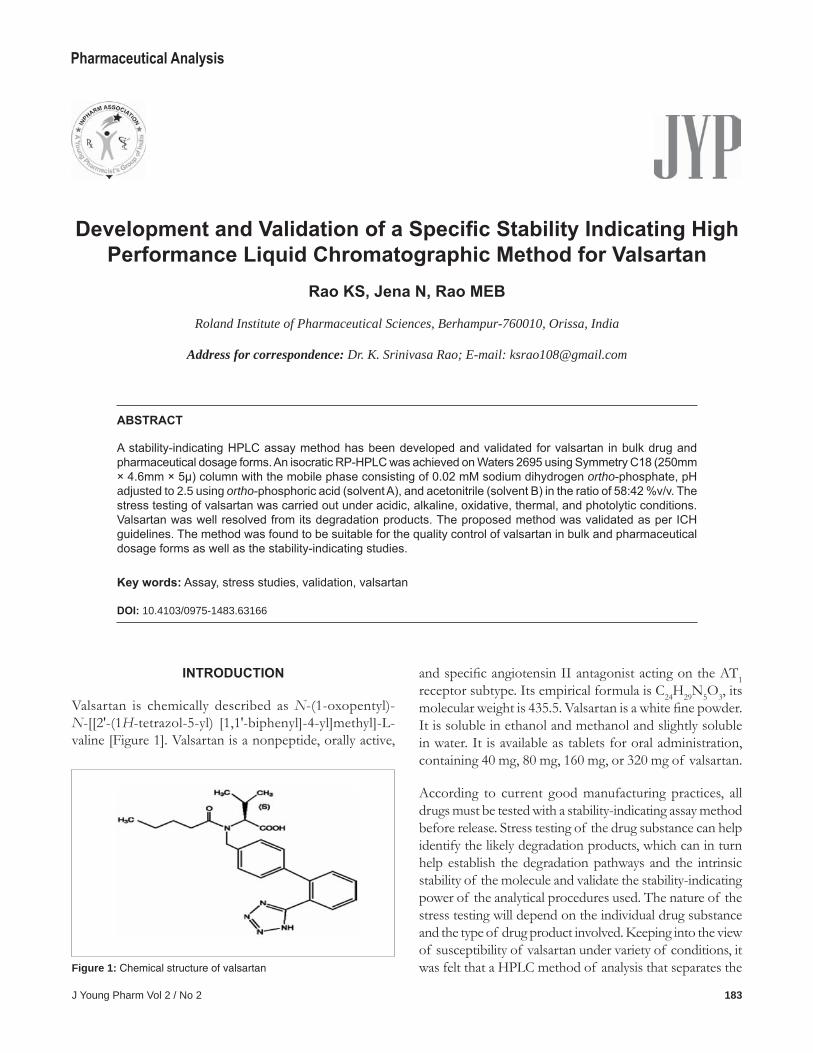
Forced degradation in acidic media was performed by taking an aliquot of stock solution in a 10 ml volumetric flask and diluted up to the mark with HCl (0.75 N, 1.5 N) to obtain a final concentration of 100 mcg/ml. The flask was kept aside at room temperature for 2 h and neutralized. Appropriate aliquot was taken from the above solution and diluted with mobile phase to obtain a final concentration of 10 mcg/ml. Similarly, forced degradation in alkaline media was performed using 1.5 N NaOH. The representative chromatograms for acid and alkaline degradation studies are shown in Figures 2 and 3, respectively.
Oxidative degradation
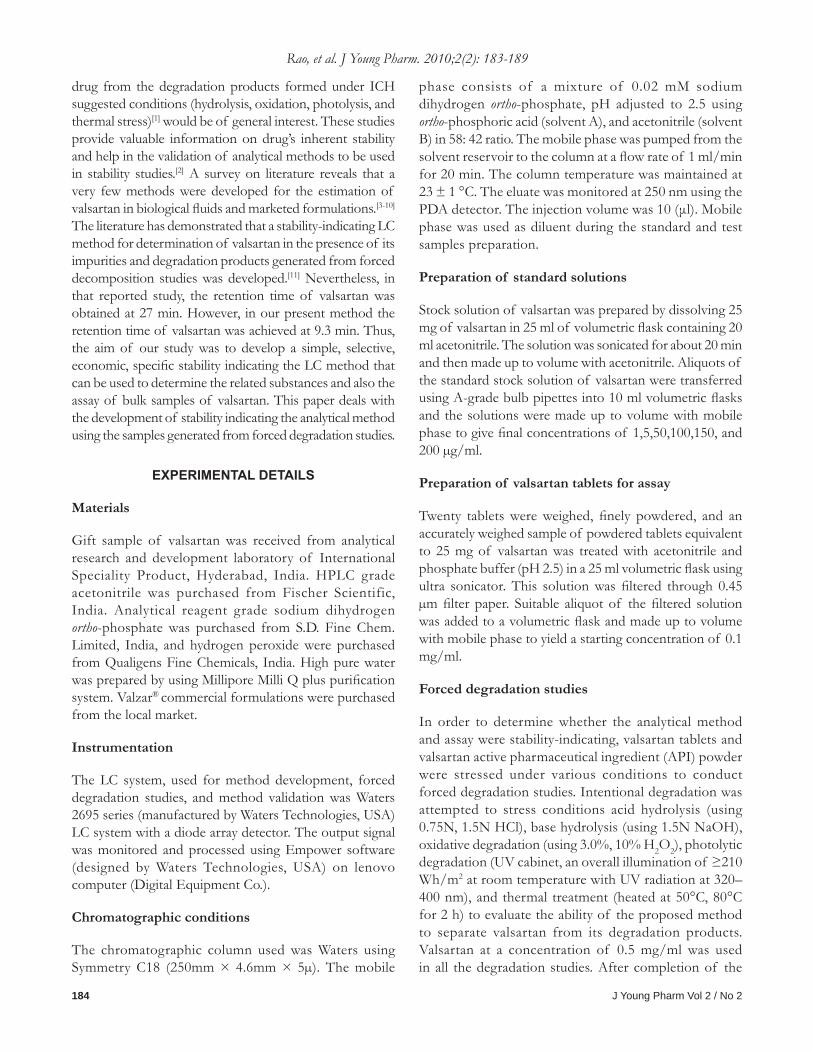
Oxidative degradation was performed by taking an aliquot of stock solution in a 10 ml volumetric flask and diluted up to the mark with hydrogen peroxide (3.0%, 10%) to obtain a final concentration of 100 mcg/ml. The flask was kept aside at room temperature for 2 h. Appropriate aliquot was taken from the above solution and diluted with mobile phase to obtain a final concentration of 10 mcg/
ml. The representative chromatogram is shown in Figure 4.
Photo stability
Valsartan-API, tablet powder, and solutions of both were prepared and exposed to light to determine the effects of light irradiation on the stability of valsartan in solution and in the solid state. Approximately 50 mg of valsartan-API powder was spread on a glass dish in a layer that was less than 2 mm thickness and a solution of API (1 mg/ml) was prepared in mobile phase. Tablet powder was also prepared in the same way. All samples for photo-stability testing were placed in a light cabinet and exposed to light for 2 h resulting in an overall illumination of ≥210 Wh/m2 at 25 °C with UV radiation at 320-400 nm. Control samples, which were protected with aluminum foil, were also placed in the light cabinet and exposed concurrently. Following removal from the light cabinet, all samples were prepared for analysis as previously described. The representative chromatogram is shown in Figure 5.
Thermal stress studies
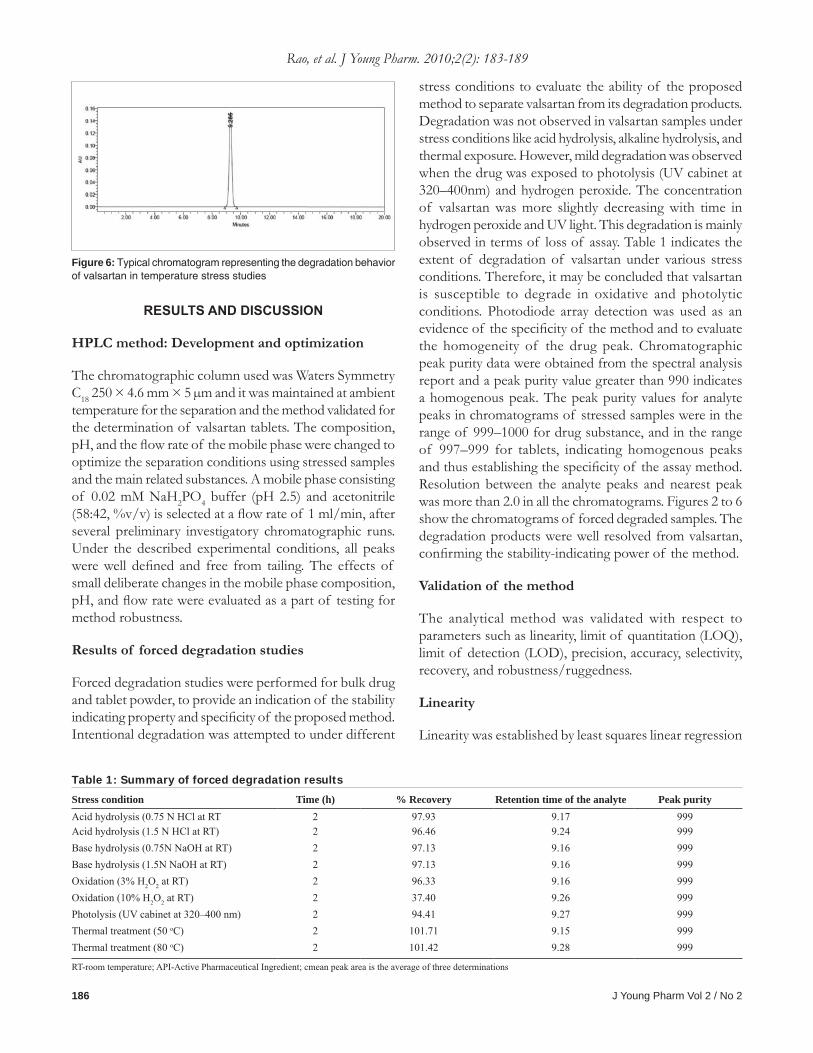
For thermal stress, valsaratan-API, tablet powder, and solutions of both were prepared and exposed to a controlled temperature oven at 50oC and 80oC for 2 h. The representative chromatogram is shown in Figure 6.
Stability indicating LC method for valsartan
Figure 2: Typical chromatogram representing the degradation behavior of valsartan in acid hydrolysis
Figure 3: Typical chromatogram representing the degradation behavior of valsartan in alkaline hydrolysis
Figure 4: Typical chromatogram representing the degradation behavior of valsartan in oxidative hydrolysis
Figure 5: Typical chromatogram representing the degradation behavior of valsartan in liquid state photo-stability
186 J Young Pharm Vol 2 / No 2
Figure 6: Typical chromatogram representing the degradation behavior of valsartan in temperature stress studies
RESULTS AND DISCUSSION
HPLC method: Development and optimization
The chromatographic column used was Waters Symmetry C18 250 × 4.6 mm × 5 µm and it was maintained at ambient temperature for the separation and the method validated for the determination of valsartan tablets. The composition, pH, and the flow rate of the mobile phase were changed to optimize the separation conditions using stressed samples and the main related substances. A mobile phase consisting of 0.02 mM NaH2PO4 buffer (pH 2.5) and acetonitrile (58:42, %v/v) is selected at a flow rate of 1 ml/min, after several preliminary investigatory chromatographic runs. Under the described experimental conditions, all peaks were well defined and free from tailing. The effects of small deliberate changes in the mobile phase composition, pH, and flow rate were evaluated as a part of testing for method robustness.
Results of forced degradation studies
Forced degradation studies were performed for bulk drug and tablet powder, to provide an indication of the stability indicating property and specificity of the proposed method. Intentional degradation was attempted to under different
stress conditions to evaluate the ability of the proposed method to separate valsartan from its degradation products. Degradation was not observed in valsartan samples under stress conditions like acid hydrolysis, alkaline hydrolysis, and thermal exposure. However, mild degradation was observed when the drug was exposed to photolysis (UV cabinet at 320–400nm) and hydrogen peroxide. The concentration of valsartan was more slightly decreasing with time in hydrogen peroxide and UV light. This degradation is mainly observed in terms of loss of assay. Table 1 indicates the extent of degradation of valsartan under various stress conditions. Therefore, it may be concluded that valsartan is susceptible to degrade in oxidative and photolytic conditions. Photodiode array detection was used as an evidence of the specificity of the method and to evaluate the homogeneity of the drug peak. Chromatographic peak purity data were obtained from the spectral analysis report and a peak purity value greater than 990 indicates a homogenous peak. The peak purity values for analyte peaks in chromatograms of stressed samples were in the range of 999–1000 for drug substance, and in the range of 997–999 for tablets, indicating homogenous peaks and thus establishing the specificity of the assay method. Resolution between the analyte peaks and nearest peak was more than 2.0 in all the chromatograms. Figures 2 to 6 show the chromatograms of forced degraded samples. The degradation products were well resolved from valsartan, confirming the stability-indicating power of the method.
Validation of the method
The analytical method was validated with respect to parameters such as linearity, limit of quantitation (LOQ), limit of detection (LOD), precision, accuracy, selectivity, recovery, and robustness/ruggedness.
Linearity
Linearity was established by least squares linear regression
Table 1: Summary of forced degradation results
Stress condition Time (h) % Recovery Retention time of the analyte Peak purityAcid hydrolysis (0.75 N HCl at RT 2 97.93 9.17 999Acid hydrolysis (1.5 N HCl at RT) 2 96.46 9.24 999Base hydrolysis (0.75N NaOH at RT) 2 97.13 9.16 999Base hydrolysis (1.5N NaOH at RT) 2 97.13 9.16 999Oxidation (3% H2O2 at RT) 2 96.33 9.16 999Oxidation (10% H2O2 at RT) 2 37.40 9.26 999Photolysis (UV cabinet at 320–400 nm) 2 94.41 9.27 999Thermal treatment (50 oC) 2 101.71 9.15 999Thermal treatment (80 oC) 2 101.42 9.28 999
RT-room temperature; API-Active Pharmaceutical Ingredient; cmean peak area is the average of three determinations
Rao, et al. J Young Pharm. 2010;2(2): 183-189
J Young Pharm Vol 2 / No 2 187
Stability indicating LC method for valsartan
analysis of the calibration curve. The constructed calibration curves were linear over the concentration range of 1–200 μg/ml. Peak areas of valsartan was plotted against their respective concentrations and linear regression analysis performed on the resultant curve. Correlation coefficient (n=3) was found to be more than 0.999 with %RSD values being less than 2% across the concentration ranges studied. Typically, the regression equation was
y = 17905x + 1137 (R = 0.9999)
Limit of Detection and Limit of Quantitation
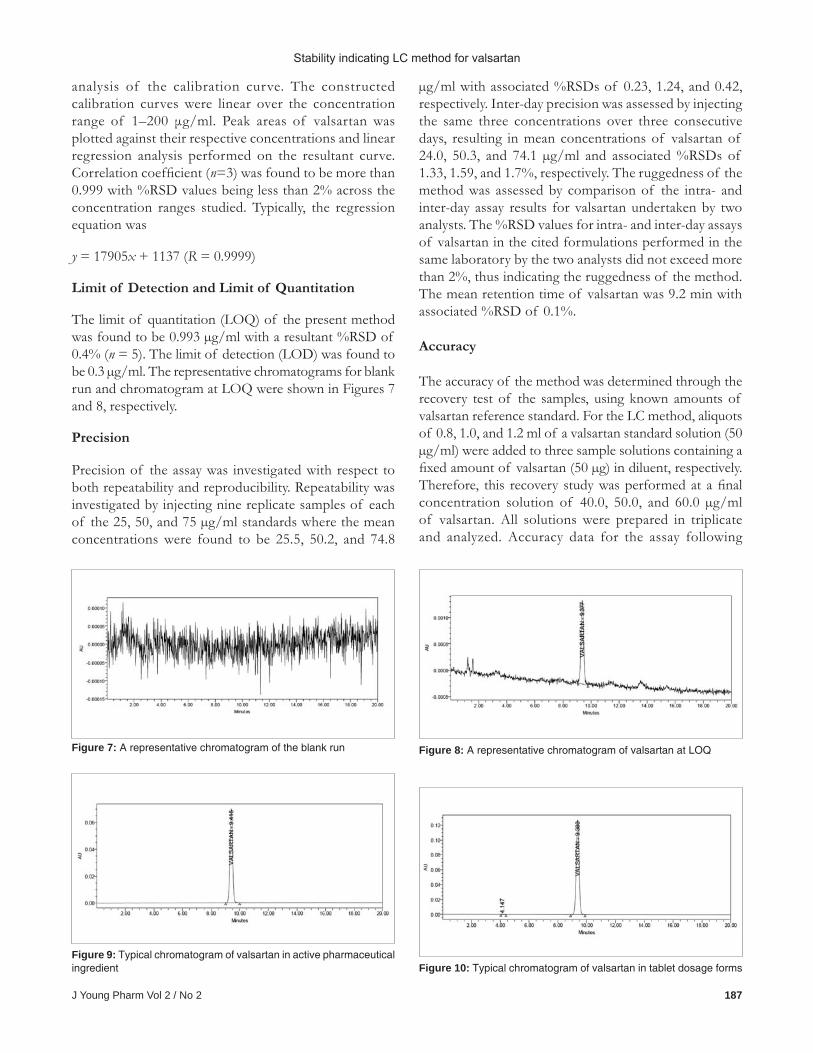
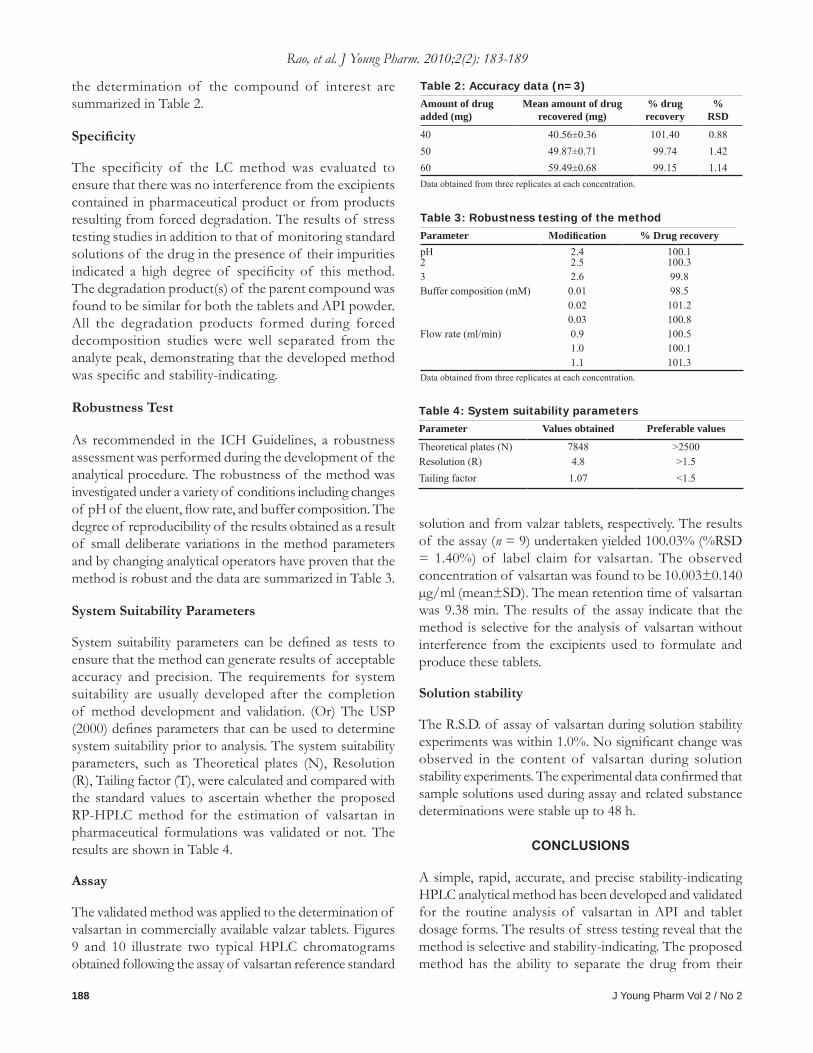
The limit of quantitation (LOQ) of the present method was found to be 0.993 µg/ml with a resultant %RSD of 0.4% (n = 5). The limit of detection (LOD) was found to be 0.3 µg/ml. The representative chromatograms for blank run and chromatogram at LOQ were shown in Figures 7 and 8, respectively.
Precision
Precision of the assay was investigated with respect to both repeatability and reproducibility. Repeatability was investigated by injecting nine replicate samples of each of the 25, 50, and 75 µg/ml standards where the mean concentrations were found to be 25.5, 50.2, and 74.8
µg/ml with associated %RSDs of 0.23, 1.24, and 0.42, respectively. Inter-day precision was assessed by injecting the same three concentrations over three consecutive days, resulting in mean concentrations of valsartan of 24.0, 50.3, and 74.1 µg/ml and associated %RSDs of 1.33, 1.59, and 1.7%, respectively. The ruggedness of the method was assessed by comparison of the intra- and inter-day assay results for valsartan undertaken by two analysts. The %RSD values for intra- and inter-day assays of valsartan in the cited formulations performed in the same laboratory by the two analysts did not exceed more than 2%, thus indicating the ruggedness of the method. The mean retention time of valsartan was 9.2 min with associated %RSD of 0.1%.
Accuracy
The accuracy of the method was determined through the recovery test of the samples, using known amounts of valsartan reference standard. For the LC method, aliquots of 0.8, 1.0, and 1.2 ml of a valsartan standard solution (50 µg/ml) were added to three sample solutions containing a fixed amount of valsartan (50 µg) in diluent, respectively. Therefore, this recovery study was performed at a final concentration solution of 40.0, 50.0, and 60.0 µg/ml of valsartan. All solutions were prepared in triplicate and analyzed. Accuracy data for the assay following
Figure 7: A representative chromatogram of the blank run Figure 8: A representative chromatogram of valsartan at LOQ
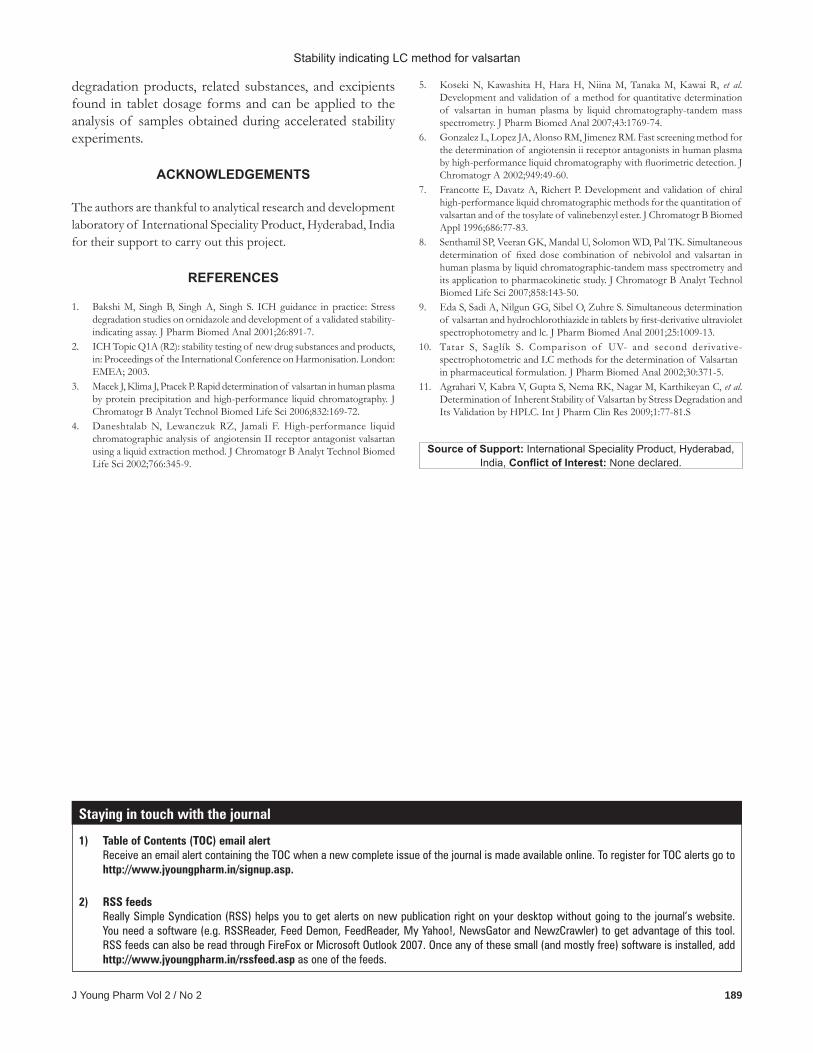
Figure 9: Typical chromatogram of valsartan in active pharmaceutical ingredient Figure 10: Typical chromatogram of valsartan in tablet dosage forms
188 J Young Pharm Vol 2 / No 2
the determination of the compound of interest are summarized in Table 2.
Specificity
The specificity of the LC method was evaluated to ensure that there was no interference from the excipients contained in pharmaceutical product or from products resulting from forced degradation. The results of stress testing studies in addition to that of monitoring standard solutions of the drug in the presence of their impurities indicated a high degree of specificity of this method. The degradation product(s) of the parent compound was found to be similar for both the tablets and API powder. All the degradation products formed during forced decomposition studies were well separated from the analyte peak, demonstrating that the developed method was specific and stability-indicating.
Robustness Test
As recommended in the ICH Guidelines, a robustness assessment was performed during the development of the analytical procedure. The robustness of the method was investigated under a variety of conditions including changes of pH of the eluent, flow rate, and buffer composition. The degree of reproducibility of the results obtained as a result of small deliberate variations in the method parameters and by changing analytical operators have proven that the method is robust and the data are summarized in Table 3.
System Suitability Parameters
System suitability parameters can be defined as tests to ensure that the method can generate results of acceptable accuracy and precision. The requirements for system suitability are usually developed after the completion of method development and validation. (Or) The USP (2000) defines parameters that can be used to determine system suitability prior to analysis. The system suitability parameters, such as Theoretical plates (N), Resolution (R), Tailing factor (T), were calculated and compared with the standard values to ascertain whether the proposed RP-HPLC method for the estimation of valsartan in pharmaceutical formulations was validated or not. The results are shown in Table 4.
Assay
The validated method was applied to the determination of valsartan in commercially available valzar tablets. Figures 9 and 10 illustrate two typical HPLC chromatograms obtained following the assay of valsartan reference standard
Rao, et al. J Young Pharm. 2010;2(2): 183-189
solution and from valzar tablets, respectively. The results of the assay (n = 9) undertaken yielded 100.03% (%RSD = 1.40%) of label claim for valsartan. The observed concentration of valsartan was found to be 10.003±0.140 µg/ml (mean±SD). The mean retention time of valsartan was 9.38 min. The results of the assay indicate that the method is selective for the analysis of valsartan without interference from the excipients used to formulate and produce these tablets.
Solution stability
The R.S.D. of assay of valsartan during solution stability experiments was within 1.0%. No significant change was observed in the content of valsartan during solution stability experiments. The experimental data confirmed that sample solutions used during assay and related substance determinations were stable up to 48 h.
CONCLUSIONS
A simple, rapid, accurate, and precise stability-indicating HPLC analytical method has been developed and validated for the routine analysis of valsartan in API and tablet dosage forms. The results of stress testing reveal that the method is selective and stability-indicating. The proposed method has the ability to separate the drug from their
Table 4: System suitability parametersParameter Values obtained Preferable values
Theoretical plates (N) 7848 >2500Resolution (R) 4.8 >1.5Tailing factor 1.07 <1.5
Table 2: Accuracy data (n=3)Amount of drug added (mg)
Mean amount of drug recovered (mg)
% drug recovery
% RSD
40 40.56±0.36 101.40 0.8850 49.87±0.71 99.74 1.4260 59.49±0.68 99.15 1.14Data obtained from three replicates at each concentration.
Table 3: Robustness testing of the methodParameter Modification % Drug recoverypH 2.4 100.12 2.5 100.33 2.6 99.8Buffer composition (mM) 0.01 98.5
0.02 101.20.03 100.8
Flow rate (ml/min) 0.9 100.51.0 100.11.1 101.3
Data obtained from three replicates at each concentration.
J Young Pharm Vol 2 / No 2 189
Source of Support: International Speciality Product, Hyderabad, India, Conflict of Interest: None declared.
Stability indicating LC method for valsartan
degradation products, related substances, and excipients found in tablet dosage forms and can be applied to the analysis of samples obtained during accelerated stability experiments.
ACKNOWLEDGEMENTS
The authors are thankful to analytical research and development laboratory of International Speciality Product, Hyderabad, India for their support to carry out this project.
REFERENCES
1. Bakshi M, Singh B, Singh A, Singh S. ICH guidance in practice: Stress degradation studies on ornidazole and development of a validated stability-indicating assay. J Pharm Biomed Anal 2001;26:891-7.
2. ICH Topic Q1A (R2): stability testing of new drug substances and products, in: Proceedings of the International Conference on Harmonisation. London: EMEA; 2003.
3. Macek J, Klima J, Ptacek P. Rapid determination of valsartan in human plasma by protein precipitation and high-performance liquid chromatography. J Chromatogr B Analyt Technol Biomed Life Sci 2006;832:169-72.
4. Daneshtalab N, Lewanczuk RZ, Jamali F. High-performance liquid chromatographic analysis of angiotensin II receptor antagonist valsartan using a liquid extraction method. J Chromatogr B Analyt Technol Biomed Life Sci 2002;766:345-9.
5. Koseki N, Kawashita H, Hara H, Niina M, Tanaka M, Kawai R, et al. Development and validation of a method for quantitative determination of valsartan in human plasma by liquid chromatography-tandem mass spectrometry. J Pharm Biomed Anal 2007;43:1769-74.
6. Gonzalez L, Lopez JA, Alonso RM, Jimenez RM. Fast screening method for the determination of angiotensin ii receptor antagonists in human plasma by high-performance liquid chromatography with fluorimetric detection. J Chromatogr A 2002;949:49-60.
7. Francotte E, Davatz A, Richert P. Development and validation of chiral high-performance liquid chromatographic methods for the quantitation of valsartan and of the tosylate of valinebenzyl ester. J Chromatogr B Biomed Appl 1996;686:77-83.
8. Senthamil SP, Veeran GK, Mandal U, Solomon WD, Pal TK. Simultaneous determination of fixed dose combination of nebivolol and valsartan in human plasma by liquid chromatographic-tandem mass spectrometry and its application to pharmacokinetic study. J Chromatogr B Analyt Technol Biomed Life Sci 2007;858:143-50.
9. Eda S, Sadi A, Nilgun GG, Sibel O, Zuhre S. Simultaneous determination of valsartan and hydrochlorothiazide in tablets by first-derivative ultraviolet spectrophotometry and lc. J Pharm Biomed Anal 2001;25:1009-13.
10. Tatar S, Saglík S. Comparison of UV- and second derivative- spectrophotometric and LC methods for the determination of Valsartan in pharmaceutical formulation. J Pharm Biomed Anal 2002;30:371-5.
11. Agrahari V, Kabra V, Gupta S, Nema RK, Nagar M, Karthikeyan C, et al. Determination of Inherent Stability of Valsartan by Stress Degradation and Its Validation by HPLC. Int J Pharm Clin Res 2009;1:77-81.S
Staying in touch with the journal
1) Table of Contents (TOC) email alert Receive an email alert containing the TOC when a new complete issue of the journal is made available online. To register for TOC alerts go to
http://www.jyoungpharm.in/signup.asp.
2) RSS feeds Really Simple Syndication (RSS) helps you to get alerts on new publication right on your desktop without going to the journal’s website.
You need a software (e.g. RSSReader, Feed Demon, FeedReader, My Yahoo!, NewsGator and NewzCrawler) to get advantage of this tool. RSS feeds can also be read through FireFox or Microsoft Outlook 2007. Once any of these small (and mostly free) software is installed, add http://www.jyoungpharm.in/rssfeed.asp as one of the feeds.