Embed Size (px)
Citation preview

Development and Validation of an Automated Essay Scoring Framework by Integrating
Deep Features of English Language
by
Syed Muhammad Fahad Latifi
A thesis submitted in partial fulfillment of the requirements for the degree of
Doctor of Philosophy
in
Measurement, Evaluation and Cognition
Department of Educational Psychology
University of Alberta
©Syed Muhammad Fahad Latifi, 2016

ii
Abstract
Automated scoring methods have become an important topic for the assessments of 21st
century skills. Recent development in computational linguistics and natural language processing
has given rise to more rational based methods for the extraction and modeling of language
features. The language features from Coh-Metrix are based on theoretical and empirical
foundations from psycholinguistics, discourse processing, corpus linguistics, and computing
science. The primary purpose of this research was to study the effectiveness of Coh-Metrix
features for the development and validation of three-staged automated essay scoring (AES)
framework, using essay samples that were collected in a standardized testing situation. A second
purpose of this study was to evaluate: 1) the scoring concordance and discrepancy between an
AES framework and gold-standard, 2) features informedness as a function of dimensionality
reduction, 3) two distinct machine learning methods, and 4) the scoring performance relative to
human raters and current state-of-the-art in AES. This study was conducted using the methods
and processes from data sciences, however, the foundational methodology comes from the field
of machine learning and natural language processing. Moreover, the human raters were
considered the “gold standard” and, hence, the validation process relies primarily on the
evaluation of scores produced by the AES framework with the scores produced by the human
raters. The finding from this study clearly suggests the value and effectiveness of Coh-Metrix
features for the development of automated scoring framework. The measures of concordance
confirm that the features which were used for the development of scoring models had reliably
captured the construct of writing quality, and no systematic pattern of discrepancy was found in
the machine scoring. However, the studied features had varying degree of informedness across

iii
essay types and the ensemble-based machine learning consistently performed better. On
aggregate, the AES framework was found superior than the studied state-of-the-art in machine
scoring. Finally, the limitations of this study were described and the directions of future research
were discussed.
Key words: automated scoring, feature extraction, essay evaluation, machine learning, large-
scale assessment
iv
To my father (in memoriam) and my mother
As if they were rubies and coral. So which of the favors of your Lord would you deny? (Ar-Rahman, 55:58-59)
v
Acknowledgements
I like to thank all great minds with whom I worked during my stay at Center for Research
in Applied Measurement and Evaluation (CRAME) at the University of Alberta.
Especially, I want to thank my research supervisor and mentor Dr. Mark J. Gierl for his
advice, encouragement, and greatly contributing towards the completion of my graduate
studies. I also thank him for his open door policy and sharing his countless hours for discussion
and refining this study. I also thank him for showing trust in my abilities and supporting my
interdisciplinary endeavors. I cannot thank him enough.
I would also like to thank the members of my doctoral committee, Drs. Lai, Bulut,
Cormier, and Babenko for their expertise and advice. I would like to thank Dr. Mark D. Shermis
for being my external examiner and providing his insightful feedback on this study.
I also wish to thank all CRAMERs, specially Drs. Hollis, Amin, Man-Wai, Qi Guo, Mary,
Paolina, Paul, Karen, and Maria for the insightful discussion and collaboration.

vi
Table of Contents
Abstract ............................................................................................................................................................................... ii
Acknowledgements ........................................................................................................................................................ v
List of Tables ..................................................................................................................................................................... x
List of Figures .................................................................................................................................................................. xii
Chapter One: Introduction ........................................................................................................................................... 1
Background of Problem ........................................................................................................................................... 2
Purpose of Study ........................................................................................................................................................ 3
Significance of Study ................................................................................................................................................. 4
Organization of Dissertation .................................................................................................................................. 5
Chapter Two: Literature Review ................................................................................................................................. 6
Building blocks of Automated Scoring System ............................................................................................... 6
Section One: Deep Features of Language ......................................................................................................... 7
1. Latent semantic analysis. ................................................................................................................................ 8
2. Situation model. .............................................................................................................................................. 12
3. Text easability. ................................................................................................................................................. 16
4. Referential cohesion. ..................................................................................................................................... 19
5. Lexical diversity. .............................................................................................................................................. 22
6. Connectives. ..................................................................................................................................................... 23
7. Syntactic complexity and pattern density. ............................................................................................ 24
8. Word information........................................................................................................................................... 26
9. Text descriptives. ............................................................................................................................................ 29
Section summary. ................................................................................................................................................ 30
Section Two: Machine Learning Algorithms .................................................................................................. 30
Types of score prediction algorithms. ......................................................................................................... 30
Rationale for selecting learning algorithms. ............................................................................................. 31
Overview of random forest decision-tree induction. ............................................................................ 32
Overview of sequential minimal optimization. ........................................................................................ 33

vii
Section summary. ................................................................................................................................................ 35
Section Three: Validation of the Essay Scoring Model .............................................................................. 36
Validity coefficients. ........................................................................................................................................... 37
Agreement measures and discrepancy analysis. ..................................................................................... 37
Distributional measures. ................................................................................................................................... 38
Chapter Summary .................................................................................................................................................... 38
Chapter Three: Method .............................................................................................................................................. 41
Participants ................................................................................................................................................................ 41
ASAP competition. .............................................................................................................................................. 41
Characteristics of Essay Data ............................................................................................................................... 42
Framework for Automated Scoring .................................................................................................................. 43
Stage 1: Data Preprocessing for Feature Extraction and Reduction .................................................... 44
Feature selection and reduction. ................................................................................................................... 45
Stage 2: Development and Evaluation of Automated Scoring Models .............................................. 45
Model development. ......................................................................................................................................... 46
Model evaluation. ............................................................................................................................................... 46
Procedure and outcome. .................................................................................................................................. 47
Stage 3: Score Classification and Validation ................................................................................................. 47
Validity coefficients. ........................................................................................................................................... 48
Agreement measures and discrepancy analysis. ..................................................................................... 48
Distributional measures. ................................................................................................................................... 49
Procedure of comparison. ............................................................................................................................... 50
Chapter Four: Results .................................................................................................................................................. 51
Section One: Findings from the Full-Feature Profile (FPF) ........................................................................ 51
Agreement analysis. ........................................................................................................................................... 51
Distributional analysis. ...................................................................................................................................... 54
Score-point discrepancy analysis. ................................................................................................................. 56
Section Two: Findings from the Reduced-Feature Profile (FPR) ............................................................. 59
Feature analysis. .................................................................................................................................................. 59
Agreement analysis. ........................................................................................................................................... 64

viii
Distributional analysis. ...................................................................................................................................... 66
Score-point discrepancy analysis. ................................................................................................................. 66
Section Three: Comparison of Study results ................................................................................................. 70
Comparison with two human raters. ........................................................................................................... 70
Comparison with state-of-art AES system. ................................................................................................ 75
Comparison with commercial AES Vendor1. ............................................................................................ 76
Comparison with commercial AES Vendor2. ............................................................................................ 79
Visual comparisons............................................................................................................................................. 83
Section Four: Chapter Summary ........................................................................................................................ 85
Chapter Five: Discussion and Conclusion ........................................................................................................... 89
Restatement of Research Questions and Summary of Methods .......................................................... 92
Summary of Results ................................................................................................................................................ 95
Research question 1: To what extent are the deep language features effective for the
development of automated scoring framework? How does its performance concord with
two human raters? Is there a systematic pattern in scoring discrepancy?.................................... 96
Research question 2: What proportion of features can be reliably integrated without
compromising the validity of prediction? Which features are most informative? How does
the dimensionality reduction affect the score predictability? ............................................................ 98
Research question 3: To what extend do the two machine learning methods differ in their
scoring performance? Does the essay-type affect their performance? Which learning
method is better? .............................................................................................................................................. 100
Research question 4: Given the answers to questions 1, 2 and 3, how does the performance
of the scoring framework relate to the current gold-standard? How does it relate to the
current state-of-the-art? ................................................................................................................................ 101
Limitations ................................................................................................................................................................ 103
Directions of Future Research ........................................................................................................................... 105
Conclusion ................................................................................................................................................................ 107
References..................................................................................................................................................................... 108
Appendix A: Example of Referential Cohesion................................................................................................ 119
Appendix B: Essay Prompts .................................................................................................................................... 120
B1: Essay Prompt # 1 ............................................................................................................................................ 120

ix
B2: Essay Prompt # 2 ............................................................................................................................................ 121
B3: Essay Prompt # 3 ............................................................................................................................................ 122
B4: Essay Prompt # 4 ............................................................................................................................................ 125
B5: Essay Prompt # 5 ............................................................................................................................................ 128
B6: Essay Prompt # 6 ............................................................................................................................................ 130
B7: Essay Prompt # 7 ............................................................................................................................................ 133
B8: Essay Prompt # 8 ............................................................................................................................................ 134
Appendix C: Letter from Research Ethics Board ............................................................................................. 135
Appendix D: Agreement and Distributional Measures for the State-of-the-art AES systems ...... 136
Appendix E: Tables of values for Graphs ........................................................................................................... 138

x
List of Tables
Table 1. Characteristics of the Dataset .................................................................................................................. 42
Table 2. Agreement Measures of the AES Framework Developed using Full-feature Profile (FPF) ... 52
Table 3. Distributional Measures of the AES Framework Developed using Full-feature Profile (FPF)
.............................................................................................................................................................................. 54
Table 4. Absolute Score Scale Discrepancy percentages(%) between Human raters, and AES models
using Full-feature Profile (FPF) .................................................................................................................. 56
Table 5. Directional Score Scale Discrepancy percentages(%) between Human raters, and AES
models using Full-feature Profile (FPF) ................................................................................................... 58
Table 6. Details of Feature Profiles ......................................................................................................................... 59
Table 7. Analysis of Reduced-feature profile Contribution in percentage (%) ......................................... 60
Table 8. Analysis of Reduced-feature profile Usage in percentage (%) ...................................................... 63
Table 9. Agreement Measures of the AES Framework Developed using Reduced-feature Profile
(FPR) .................................................................................................................................................................... 64
Table 10. Distributional measures of the AES Framework Developed using Reduced-feature Profile
(FPR) .................................................................................................................................................................... 66
Table 11. Absolute Score Scale Discrepancy percentages(%) between Human raters, and AES
models using Reduced-feature Profile (FPR) ......................................................................................... 67
Table 12. Directional Score Scale Discrepancy percentages(%) between Human raters, and AES
models using Reduced-feature Profile (FPR) ......................................................................................... 69
Table 13. Agreement characteristics between Human raters on the Validation Samples ................... 71

xi
Table 14A. Performance Deltas of this study with Human Raters (StudyResults − H1H2Results) using
Full-feature Profile (FPF) .............................................................................................................................. 72
Table 14B. Performance Deltas of this study with Human Raters (Study Results − H1H2 Results) using
Reduced-feature Profile (FPR)..................................................................................................................... 74
Table 15. Results of AES scoring evaluations of Commercial AES Vendor1 (MM) .................................. 76
Table 16A. A Performance Deltas of this study with Commercial AES Vendor1 (StudyResults –
Vendor1Results) using Full-feature Profile (FPF) ...................................................................................... 77
Table 16B. A Performance Deltas of this study with Commercial AES Vendor1 (StudyResults −
Vendor1Results) using Reduced-feature Profile (FPR)............................................................................. 78
Table 17. Results of AES scoring evaluations of Commercial AES Vendor2 (MI) .................................... 79
Table 18A. A Performance Deltas of this study with Commercial AES system-2 (StudyResults −
Vendor2Results) using Full-feature Profile (FPF) ...................................................................................... 80
Table 18B. A Performance Deltas of this study with Commercial AES system-2 (StudyResults −
Vendor2Results) using Reduced-feature Profile (FPR)............................................................................. 80
Table 19. Performance Summary of this study in relation to AES Vendors and two human raters . 86
xii
List of Figures
Figure 1. Conceptual representation of sequential minimum optimization. ............................................ 34
Figure 2. The contribution of feature-categories used for the development of scoring models. ....... 61
Figure 3. The plot of Exact+ Adjacent agreements for the scoring models............................................... 81
Figure 4. A comparison of Exact agreements of the study. ............................................................................. 82
Figure 5. A comparison of Kappa of the study .................................................................................................... 83
Figure 6. A comparison of Quadratic weighted kappa values. ...................................................................... 84
Figure 7. A comparison of Pearson correlation values. .................................................................................... 85

1
Chapter One: Introduction
Writing is one of the most powerful method for assessing 21st century skills such as
critical thinking, problem solving, communication, creativity, and innovation (Foltz, 2016;
Harmes, Welsh, & Winkelman, 2016). Considerable resources are now being channeled towards
measuring writing ability as evidence of academic skill acquisition. As a result, there is an
increased demand to develop efficient assessment systems that can measure the higher-order
thinking and writing skills of students (Harmes, Welsh, & Winkelman, 2016; Shermis &
Hamner, 2013). However, such assessments often require long-written responses, and
consequently, they are difficult to score in an efficient, economical, and objective manner.
One possible solution to address these problems is the technology of automated essay
scoring (AES). AES employs the techniques from computing science and computational
linguistics for building the computer models to score student-produced responses (Brew &
Leacock, 2013). AES software consists of a computer program that builds the scoring models
from pre-scored essays, using natural language processing (NLP) and machine learning
approaches, and then uses these models to grade new sets of essays (Bennett & Zhang, 2016;
Schultz, 2013). AES offers many exciting benefits for writing assessments, such as improving the
quality of scoring, reducing time for score reporting, minimizing cost and coordination efforts
for human raters, and the possibility of providing immediate feedback to students on their
writing performance (Foltz, 2016; Gierl, Latifi, Lai, Boulais, & De Champlain, 2014; Myers, 2003;
Weigle, 2013; Williamson, 2013). Most large-scale assessments require that written responses be
included as a fundamental component of the assessment task. As a result, AES will become a

2
more important process for assessments of the future by permitting writing skills to be
evaluated, even when large numbers of students are examined.
Background of Problem
The early idea of scoring students’ writing skills using computers was proposed by Ellis
Page in 1966 (see Page, 1966) with his AES program called Project Essay Grade. However, it was
not until the early 1990s when the advancement in automated scoring technology was
resurrected (Keith, 2003), followed by the rapid revolution in technological innovation when
assessment professionals began to embrace and integrate these technologies into student
assessment. This rapid growth in use of learning technologies has also given rise to
commercialization and technology proprietorship, and AES is no exception.
A recent comparative study by Shermis (2014) highlights the current state of the art in
AES technologies. Shermis (2014) studied the validation of proprietary AES systems using the
essays from three grade levels. Eight commercial vendors and one research-team competed to
develop the best score prediction models using essay samples that were collected from evenly
distributed male and female writers from diverse ethnicities. Based on the results from this
competition, Shermis concluded that the average performance of most AES systems closely
mirrors that of the human raters. However, the technical details on the components of AES
programs were not disclosed, the results from this study demonstrated that commercial AES
programs have different procedures but produce comparable results for scoring the same type
of essays. The AES programs differed in how they extracted and modeled the features of an
essay language. Although some commercial vendors (e.g., ETS, Vintage Learning, and others)
provide a general description of their AES systems, the literature lacks the technical details about

3
the underlying algorithms and the scoring systems for most commercially-available AES systems
(Elliot & Klobucar, 2013; Wilson & Andrada, 2016).
Because the information about many AES systems is lacking, the acceptance and
progress on AES research is obstructed in at least three ways. First, researchers have limited
opportunities to study AES technologies because the systems are protected by trademarks and
intellectual copyright (Shermis & Margan, 2016, p. 327). Second, proprietary systems conceal our
understanding about the computational mechanism of assigning weights to the elements of
writing (i.e., text features) that are used for predicting the essay scores (Wilson & Andrada, 2016,
p. 681). Third, it is challenging for test publishers and program directors to publically explain,
rationalize, and defend the AES technology (Bennett & Zhang, 2016, p. 147). In sum, the current
AES literature contains an incomplete account of the rationale, computational basis, and
mechanism for extracting and modeling the features of an essay language. Hence, more
research is needed to fill these gaps.
Purpose of Study
The purpose of this research was to develop and validate a transparent automated essay
scoring framework by integrating deep features of English language (e.g., cohesion relations,
text easability, world knowledge, latent semantic analysis, situation models, readability and deep
discourse characteristics of essay). More specifically, my research questions were as follows:
1) To what extent are the deep language features effective for the development of
automated scoring framework? How does its performance concord with two human raters? Is
there a systematic pattern in scoring discrepancy?
4
2) What proportion of features can be reliably integrated without compromising the
validity of prediction? Which features are most informative? How does the dimensionality
reduction affect the score predictability?
3) To what extend do the two machine learning methods differ in their scoring
performance? Does the essay-type affect their performance? Which learning method is better?
4) Given the answers to questions 1, 2 and 3, how does the performance of the
scoring framework relate to the current gold-standard? How does it relate to the current state-
of-the-art?
Significance of Study
The research questions in this study were motivated to address four different but inter-
related topics that correspond to the design and application of operational automated scoring
system. This study uncovers the opportunities and issues in: 1) extracting the deep features of
written language, 2) identifying the best representative features, 3) evaluating the AES
performance as a function of essay types, and 4) investigating the validity of machine scoring as
a function of machine learning algorithms. Further, this study also addresses the gap in the
current literature by presenting the open-architecture of machine scoring available to academic
and assessment researchers and practitioners who may wish to implement and automate the
scoring of student-produced written responses. Finally, this study has used large datasets
containing real essay samples from students who wrote the exams under standardized testing
conditions, which are evenly distributed between male and female writers from diverse
ethnicities.

5
Organization of Dissertation
This document is organized into five chapters. Chapter One, the current chapter, is an
introduction to AES along with a brief description of the literature and a description of the
problem to be investigated. Chapter Two provides the framework of this study by reviewing the
relevant literature on study design, and by reviewing the relevant concepts and procedures on
deep language features extraction and supervised machine learning that were evaluated as part
of the study design. Chapter Two is organized into three subsections. Section one describes nine
classes of features using the computational linguistics and automated essay evaluation
literature. Section two provides a review of supervised and unsupervised approaches in the
context of automated essay evaluation and described two machine learning algorithms that
were used in this study. Section three presents a review of validation methods from AES
literature that use the human raters as gold standard and had presented the basis of validating
the outcomes from this study. Chapter Three explains the methods, study design, characteristics
of essay dataset, scoring and machine learning procedures, and validation criteria for the AES
framework of this study. Chapter Four describes the results along with the interpretation and
discussion of the study outcomes. Finally, in Chapter Five, a summary and conclusion of the
study along with the limitations and potential future directions for further research are provided.

6
Chapter Two: Literature Review
Building blocks of Automated Scoring System
The automated essay scoring framework of this study relies on three major sub-systems,
or modules. Module one extracts the features of writings from the input essays. Module two
employs the machine learning approaches to iteratively learn and map the human scoring
behavior by integrating the features from module one. Module three evaluates the validity of
machine scores by conducting error analyses. This study followed the same design for
developing the AES framework. That is, for module one, the deep features of language were
extracted using the computational linguistics environment of Coh-Metrix (McNamara, Graesser,
McCarthy, & Cai, 2014). For module two, two independent machine learning algorithms were
employed to iteratively learn and integrate the deep features of essays. For module three, eight
validity coefficients were computed for evaluating the validity of AES scores.
The literature review of this chapter takes the same modular approach and describes the
AES framework of this study by reviewing relevant concepts and procedures on deep language
features extraction, supervised machine learning approaches, and validation of computerized
scoring. Hence, this chapter is organized into three main sections. Section one describes nine
classes of deep features using the computational linguistics and automated essay evaluation
literature. Each class of features is organized into sub-sections for better organization and flow.
Section two provides a review of supervised and unsupervised approaches in the context of
automated essay evaluation and presents the rationale for selecting the supervised machine
learning approaches for this study. This section also describes two machine learning algorithms
that were used for essay scoring. Section three provides a review of the validation methods in

7
AES literature that uses the human raters as gold standard and presents the basis of validating
the outcomes from this study. This chapter concludes by summarizing the literature directly
related to this study.
Section One: Deep Features of Language
Feature extraction is the first and most important step in any AES system. It is the
process of objectively transforming the text into feature scores. The feature scores are then used
to build the model for predicting the essay scores. For example, a feature score misspelling can
be computed for an essay by counting the proportion of misspelled words. Similarly, various
feature scores of length can be computed by counting the words at phrase, sentence, paragraph,
and passage levels. Both misspelling and length are examples of surface-level features. However,
the surface-level features (e.g., word length, sentence length, and etc.) are often challenged by
the educational community because their rationale and empirical relation with human scores
and with other features of writing quality are not well defined (Attali, 2013; Perelman, 2014).
However, within the realm of feature extraction, some features could have more face validity
with commonly used rubrics and thus are more predictive of essay quality (Shermis, 2014b).
Recent advances in computational linguistics and NLP have given rise to a more rational
approach for extracting features of language that go beyond the surface-level features.
Therefore, the essays can be analyzed for deep features of language which contribute as proxies
for the number of higher-order associations (e.g., easability, narrativity, diversity; see following
sections for description) in the essay text. For example, a large corpus of English textbooks can
be used to learn about the underlying semantic structure of the language which compares the
essay-text with the examples of real life language-use in the corpus.
8
The extraction of deep features from text involves the identification of relative levels of
mental models, semantic structure, pragmatics, world knowledge, and rhetorical structure
(Graesser, 2004; Kaplan, 2010; McNamara, Graesser, McCarthy, & Cai, 2014). Deep feature
extraction requires the integration and use of psycholinguistics methods, discourse processing,
computing algorithms, and cognitive sciences for identifying the cues of deep features in the
given text. This study had extracted deep features using a computational linguistics environment
of Coh-Metrix. Coh-Metrix is a large collection of software sub-systems which computes the
range of language and discourse measures that are based on empirical and theoretical
foundations of text feature extraction (Graesser, McNamara, & Kulikowich, 2011; McNamara,
Graesser, McCarthy, & Cai, 2014).
In this section, the literature is reviewed for nine broad classes of Coh-Metrix features.
Hence, this section is organized as nine sub-sections: Latent Semantic Analysis, Situation Model,
Text Easability, Referential Cohesion, Lexical Diversity, Connectives, Syntactic Complexity and
Pattern Density, Word Information, and Text Descriptives. Each sub-section presents the
fundamental concepts and procedure for extracting indices of deep features in the English
language. Since the concepts are interlinked among the nine sub-sections, they are organized
for better flow and coherence.
1. Latent semantic analysis. Originally proposed as an automatic mechanism for
information retrieval (Deerwester, Dumais, Landauer, Furnas, & Harshman, 1990; Dumais, Furnas,
Landauer, Deerwester, & Harshman, 1988), Latent Semantic Analysis (LSA) is a mathematical
method for describing the meaning of words using the contexts around the word. The central
concept of LSA is that two words are similar in meaning to the extent that there are similar

9
words surrounding these target words. LSA has been validated in several studies and found a
candidate mechanism to explain verbal meaning (Landauer, 2011). For example, LSA has been
used as an essay grader (Foltz, 1996), as a major feature extractor mechanism for scoring the
essays for high-stakes tests (Landauer, Foltz, & Laham, 2003), and as a natural language
interpreter for automated interaction with students (Graesser, Jeon, & Dufty, 2008).
LSA assumes that there is some underlying, or latent, structure in word usage that is
partially invisible due to variability in writers’ word choices in documents (e.g., sentences,
paragraphs, or passages). Most applications of LSA treat each paragraph as a separate
document based on the intuition that the information within a paragraph tends to be coherent
and related for discovering hidden concepts (Wiemer-Hastings, 2006). LSA computes conceptual
similarity between two words or documents as a Cosine (or Euclidean) distance measure.
Conceptually, LSA applies linear algebra techniques on a large representative corpus of text to
estimate the indices of semantics that typically vary between 0 (low cohesion) and 1 (McNamara,
Graesser, McCarthy, & Cai, 2014). The computational framework of LSA is presented next.
Foundations of LSA. To begin, the LSA method scans the large corpus of text (e.g., more
than 10 million word tokens) and constructs a high-dimensional matrix ( ) that represents the
occurrence of words in documents, such that, the value of each cell in represents the number
of times the word occurred in the corresponding documents. The resulting matrix has all the
words in the corpus as rows , and all the documents in the corpus as columns , as a result the
x word-by-document matrix of frequencies is constructed. Further, to reduce the effect of
high frequency words (e.g., the, and, is, etc.), the frequency values in each cell of can be
weighted using a weighting procedure, which assigns a low weight to words occurring often in

10
the documents (Martin & Berry, 2007). However, the resulting is a sparse matrix (i.e., most cell
values are zero) and most dimensions in the matrix represent random associations or other
irrelevant factors in the corpus. Usually for large corpus, has about 1% or less nonzero values
(Berry & Browne, 2005; Martin & Berry, 2007, p.39) which makes it less informative for capturing
the underlying semantic structure of the language. Nevertheless, the matrix decomposition
methods are available that can compress the high-dimensional sparse matrix into a reduced but
more meaningful -dimensional matrix (Berry & Browne, 2005; Berry & Fierro, 1996; Golub &
Reinsch, 1970; Kolda & O'leary, 1998).
As the next step, LSA uses a popular matrix decomposition technique called singular
value decomposition (SVD) which reconfigures the word-by-document matrix , such that is
linearly decomposed into the product of three -dimensional matrices: the word-word co-
occurrence matrix , the document-document co-occurrence matrix , and the diagonal matrix
of singular values (i.e., eigenvalues). Both and have orthonormal columns, whereas matrix
contains the eigenvalues of input matrix (Deerwester, Dumais, Landauer, Furnas, &
Harshman, 1990; Dumais, 2004; Golub & Reinsch, 1970; Wiemer-Hastings, 1999).
Mathematically, the SVD components of can be shown as in equation 1:
( ) , ( )
where the dimensions of matrices can be stated as, is a number of words, is the number of
documents, and is the parameter of semantic space that describes the best least square
approximation to . Each column in (or row in transposed ) is a -dimensional vector
representing the meaning of the word (or document). The diagonal matrix is sorted in
descending order of eigenvalue magnitude, such that the highest eigenvalue appears at

11
and lowest eigenvalue appears at . In the beginning, is initialized to the rank of matrix
and the multiplication of , , and can exactly reconstruct the original matrix . However, in
practice, the matrices are never multiplied. Rather, only the most significant dimension of
matrices are identified that can give the best squared approximation of using a matrix of rank
(Rosario, 2000, p.3; Wiemer-Hastings, 2006). Studies have demonstrated that the between 50
and 500 can reliably capture the most informative patterns of co-occurrence across corpus and
can reveal the inductive semantic structure of the words and the documents (Berry, Dumais, &
O'Brien, 1995; Wiemer-Hastings, 1999; Graesser, McNamara, & Kulikowich, 2011). Detailed
mathematical description of LSA is beyond the scope of this study and details can be found
elsewhere (see for example: Eckart & Young, 1936; Golub & Reinsch, 1970).
Operationalization of LSA. Coh-Metrix operationalizes LSA using the Touchstone
Applied Science Associates (TASA) corpus of academic textbooks, which it uses to construct the
semantic space. TASA is composed of 37,651 text excerpts that contain over 12 million word
tokens from a broad range of genres (e.g., business, language arts, science, etc.). The semantic
space is then used by the Coh-Metrix to estimate eight LSA measures of text cohesion and
semantic overlap between documents (i.e., paragraph and sentences). These measures are
computed as means and standard deviations of LSA similarity among adjacent sentences, all
sentences in a paragraph, adjacent paragraphs, and as the ratio between LSA given/new among
all sentences. While the names of other LSA measures of cohesion are self-explanatory, the LSA
Given-New ratio, G/(N+G), is computed using the text constituents (i.e., sentences or noun-
phrases) as a proxy for how much given (text constituents overlap within existing text) versus
new (text constituents that are never seen before) information exists in each sentence of a

12
document compared with the content of the prior text information (Hempelmann, et al., 2005;
McCarthy, et al., 2012). When text contains more given information and less new information,
then the cohesion ratio approaches 1(high), and when there is less given information then it
approaches 0 (low).
Applications of LSA. The LSA methods can be used as the mathematical system of
computational modeling of human thinking process (Foltz, Steeter, Lochbaum, & Landauer,
2013) and their accuracy has been tested in a variety of morphological applications in
educational and non-educational domains, including the automated essay evaluation systems.
The authors of Coh-Metrix have shown that their LSA measures reliably capture the world
knowledge in language and can also better estimate given versus new information. In sum, the
LSA indices of Coh-Metrix use the data-driven statistical approaches and extract deeper
diagnostics information about writing quality.
2. Situation model. The situation model can be seen as world knowledge features that
are activated when a given context appears in a writer’s mind during comprehension of a
narrative or expository text generation process (Singer & Leaon, 2007). These features are the
inferred mental representation of verbally described situations that move beyond the explicit
text of language and are encoded in the meaning representation because language is now used
as the element of knowledge about how to construct a mental representation of the described
situation. A text can include the context-specific causal mechanism (e.g., as in science or
business) and the context-specific inferences are needed to construct the situation model under
unique constrains of the context and by referring to other multilevel theoretical framework

13
about the context (McNamara, Graesser, McCarthy, & Cai, 2014, p.52; Van Dijik & Kintsch, 1983;
Zwaan & Radvansky, 1998).
For example, the word “stock” will be highly associated with words of the same
functional context (i.e., stock market) such as “securities”, “bonds”, “capital” and “index”. These
words are not synonyms or hypernyms of the word “stock”. As mentioned earlier, LSA treats
word meaning in a different way than the ways words are treated in thesaurus or dictionary. LSA
taps meaning by considering the naturalistic arrangement of words in a large representative
corpus, thereby moving beyond the text and into the mind of writer for tapping the situation
model (McNamara, Graesser, McCarthy, & Cai, 2014). However, the degree to which LSA can tap
understanding in a situation model is unknown (McNamara, Graesser, McCarthy, & Cai, 2014;
Shapiro, & McNamara, 2000).
Foundations of situation model. Researchers in discourse processing and cognitive
science (e.g., Zwaan & Radvansky, 1998) proposed five dimensions as the building blocks of the
situation model. They are causation, intentionality, temporality, space, and protagonists. These
dimensions of the situation model can be identified by capturing the discontinuity in text
coherence on one or more of these dimensions. For example, the use of adverbs, transitional
phrases, connectives, or other forms of signaling terms (i.e., particles) conveys to the writer that
there is a discontinuity. Coh-Metrix adopted the same mechanism for modeling dimensions of
the situation model using particles. The particles are language-units that are associated with the
discourse processing. For example, different set of particles are associated with causation (e.g.,
later, therefore, because), intentional (e.g., such that, so that, in order to), temporal (e.g., after,
before, later), and spatial (beside, upon, beneath) cohesion. However, some particles can be

14
conjunctions, transitional adverbs, and other forms of connectives and may be applicable to
more than one type of dimension of situation model (Graesser, McNamara, & Kulikowich, 2011;
Graesser, McNamara, Louwerse, & Cai, 2004).
Operationalization of situation model. Coh-Metrix provides eight measures related to
the situation model understanding. They are operationalized by computing the ratio of cohesion
particles to the relative frequency of verbs that signal the state changes, actions, processes, and
events, corresponding to the dimensions of situation model. It includes three measures for
causation, two for intentionality, two for space, one for time, and none for the protagonist
dimension.
Causation and Intentionality. The casual dimension refers to how the comprehender
keeps track of causal information during comprehension of narrative or expository text
generation process. The intentional dimension refers to the actions of animate agent as part of
plans in pursuit of goals (McNamara, Graesser, McCarthy, & Cai, 2014; Zwaan & Radvansky,
1998). Coh-Metrix uses the WordNet, a lexicon of conceptual-semantic and lexical relations
(Miller, Beckwith, Fellbaum, Gross, & Miller, 1990), for classifying verbs into the categories of
casual and intentional verbs. Coh-Metrix taps these elements of causal and intentional
information by computing incidence scores for i) causal verbs that reflect changes of state (e.g.,
break, freeze, impact, hit), ii) causal verbs particles of causal connectives (e.g., in order to,
therefore, because), and iii) intentional verbs (e.g., contact, talk, walk). Coh-Metrix also computes
two ratio measures to reflect the number of causal and intentional events expressed in the text.
They are computed by taking a ratio of causal particles to causal verbs, and the ratio of
intentional particles to intentional verbs.

15
Time and Space. The temporal dimension refers to the description of the events that took
place both relative to one another and relative to the time at which they were narrated using
semantics of temporal information of language (Zwaan & Radvansky, 1998). Temporality in Coh-
Metrix is observed by tracking the consistency of tense (i.e., absolute location of events in time
as shown by the inflectional form of verb – e.g., past and present) and aspect (i.e., duration of an
event within a particular tense – e.g., perfective and progressive) across the sentences in the text.
Coh-Metrix computes the consistency (repetition) score between tense and aspect across
sentences of the text, and the repetition score for tense is averaged with the repetition score for
aspect for computing the overall index of temporality of text. Researchers believe that spatial
information is forced into a temporal format (Zwaan & Radvansky, 1998), meaning they are
difficult to separate. However, Coh-Metrix measures aspect of spatial information using two
corpus-based indices of referential cohesion of verb overlap, one using WordNET and other
using TASA.
Applications of situation model. The world knowledge is a distinctive component of
text comprehension and interpretation and is frequently tested using essays (Myers, 2003). It
also represents the characteristics of text that affects the human scoring of an examinee’s essay
(Baker & O‘Neil, 1996) thereby serving as an important aspect of written text. Measures from
situation model can serve as features of world knowledge that reflect on stylistic and mechanical
aspects of writing (Streeter, Bernstein, Foltz, & DeLand, 2011). In sum, the Coh-Metrix’s features
of situation model can provide a better approximation of the students’ competency on the
complex construct of world knowledge.

16
3. Text easability. The construct of Text Easability involves evaluating the text on
multiple linguistic characteristics that can be used to identify sources of difficulty in written text.
The Coh-Metrix provides eight most informative components (Graesser, McNamara, &
Kulikowich, 2011) that are aligned with theories of text difficulty and discourse comprehension
(McNamara, Graesser, McCarthy, & Cai, 2014). These components are Narrativity, Syntactic
Simplicity, Word Concreteness, Referential Cohesion, Deep Cohesion, Verb Cohesion, Connectivity,
and Temporality.
Foundations and operationalization of easability. Each component of difficulty is
reported using z-score and percentile score based on the relative frequencies of component
cues in the text. The higher score indicates that the text is likely to be easier to read and the
lower score reflects that the text is likely to be difficult, relative to the other text in the given
dataset. Next, the eight components of text easability are described briefly.
i) Narrativity provides the information about whether the text is closely affiliated with
everyday oral conversation such that the reader of the text is able to understand it
by using the world knowledge (i.e., events, places, familiar things and structures).
The feature of writing that contributes to narrativity involves characteristics of
words, sentences, and connections between sentences that are affiliated with
everyday oral conversation.
ii) Syntactic simplicity reflects the degree to which the sentences are less challenging
for the reader to process. That is, the sentences that contain fewer words and use
simpler more familiar syntactic structures are easier to process, than the sentences
with more words and complex unfamiliar syntactic structures (Nelson, Perfetti, Liben,

17
& Liben, 2012). The simplicity scores are higher when sentences have simple familiar
words, and lower when sentences contain words with unfamiliar syntactic structures.
iii) Word concreteness provides the measures of difficulty in processing and
understanding the word by reading it. For example, words that invoke the mental
image are concrete and easier to process (e.g., road, sedan, wheel) than the words
that represents the abstract concept (e.g., sad, grief, courage) which are visually
difficult to represent. The concreteness score is estimated using the relative
frequency of content words that are concrete as opposed to being abstract
(Graesser, McNamara, & Kulikowich, 2011).
iv) Referential cohesion explains the degree of co-reference connections in the text, and
is measured using the relative frequency of content words that overlap across
sentences in the text. Text with high referential cohesion has higher connections
that tie the ideas together and thus is typically easier to understand (McNamara,
Graesser, McCarthy, & Cai, 2014).
v) Deep cohesion reflects the degree to which the causal and logical relationship is
present in the text. It is measured by assessing text for causal (e.g., then, therefore,
otherwise) and logical (e.g., besides, however, similarly) connectives. Text with high
cohesion helps the reader form a deeper and more coherent understanding of the
causal event, actions and process in the text (McNamara, Graesser, McCarthy, & Cai,
2014).
18
vi) Verb cohesion provides measures of overlapping verbs in the text, and is measured
by assessing text for repeated verbs. The component of connectivity explains the
degree to which the text contains connectives to express the relations in the text.
vii) Connectivity is measured using the relative frequencies of additive (also, and, too,
etc.), comparative (alternatively, whereas, than, etc.), and adversative (e.g., but, still,
besides, etc.) connectives.
viii) Temporal cohesion reflects the degree to which the text is easier to process and
understand due to the temporal cues in the text. It is measured using the relative
frequencies of the temporal cues that are extracted using the morphemes
associated with the main verb or helping verb that signal tenses (i.e., past, present,
future) and aspect (i.e., completed, in progress) in the text (Graesser, McNamara, &
Kulikowich, 2011).
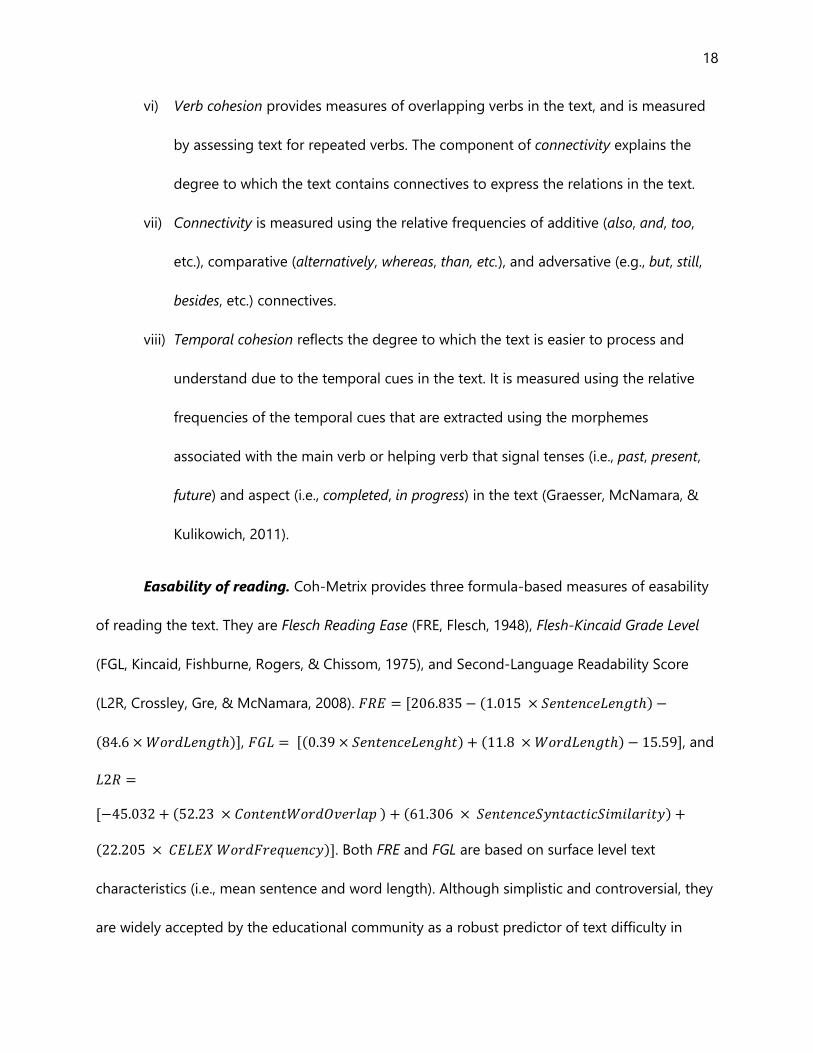
Easability of reading. Coh-Metrix provides three formula-based measures of easability
of reading the text. They are Flesch Reading Ease (FRE, Flesch, 1948), Flesh-Kincaid Grade Level
(FGL, Kincaid, Fishburne, Rogers, & Chissom, 1975), and Second-Language Readability Score
(L2R, Crossley, Gre, & McNamara, 2008). [ ( )
( )], [( ) ( ) ], and
[ ( ) ( )
( )]. Both FRE and FGL are based on surface level text
characteristics (i.e., mean sentence and word length). Although simplistic and controversial, they
are widely accepted by the educational community as a robust predictor of text difficulty in

19
relation to the grade level or reading ability of the reader (McNamara, Graesser, McCarthy, &
Cai, 2014). However, the formula for L2R goes beyond the surface-level characteristics and
incorporates other proxies of cognitive operations underlying the reading process (Crossley,
Greenfield, & McNamara, 2008).
Applications of easability. The overall quality of essays can be evaluated on the aspect
of essay easability using measures of narrativity, syntactic structure, concreteness, co-reference,
causal relationship, verb-overlap, connectives, temporal cues, and readability. These measures of
easability components can be used to describe the broad construct of sentence structure which
carries features such as syntactic variety, sentence complexity, usage, readability, stylistics, and
mechanics of essay text. In sum, the Coh-Metric features of easability and readability brought
multiple sources of information to the score prediction model about the relative difficulty
associated with processing and understanding the text.
4. Referential cohesion. Referential cohesion of text reflects the degree of co-reference
connections (i.e., overlap) between sentences, clauses, and prepositions. The text with high
referential overlap carries the linguistic cues and connections that aid the reader in
understanding and following the text. Coh-Metrix extracts indices of referential overlap for noun
overlap, argument overlap, stem overlap, and content-word overlap. Each type of overlap is
measured on local and global co-reference. Local co-reference is measured by assessing the
overlap between adjacent sentences, whereas global co-reference is measured by assessing the
overlap between all sentences of the text. The noun, argument, and stem overlaps are measured
as mean binary indices (i.e., whether or not an overlap exists between sentences pair), whereas

20
the content word overlap is measured as the mean and standard deviation of exact proportion of
overlapping words between sentences.
Foundations and computation of referential cohesion. The measure of noun overlap
reflects the proportion of sentences in a text for which there are overlapping nouns. The noun
should strictly be in the same morphological form between sentences. For example, as shown in
Table A1 in Appendix A, the word cell is not morphologically equivalent to word cells, thus there
is no noun overlap between sentences S2 and S3, whereas there is a noun overlap between
sentences S3 and S4 for the same word. Both local and global noun overlaps can be computed.
The mean local noun overlap is computed by averaging the number of sentences that have a
noun overlap with a preceding sentence (i.e., adjacent sentence), whereas the mean global noun
overlap is measured by averaging the number of noun overlaps of each sentence with every
other sentence.
The measure of argument overlap extends the noun overlap by including both noun and
pronouns to detect the overlap between sentences. It occurs when there is an overlap between a
noun in one sentence and the same noun (either in the singular or plural form) in another
sentence. It also occurs when there are matching personal pronouns (e.g., he, she) between
sentences. As shown in Table A1 of Appendix A, there is an argument overlap between
sentences S1 and S2 even though they share a different morphological form of the word cell
(i.e., cell vs. cells). The computational steps for the mean local argument overlap and the mean
global argument overlap are similar to their noun overlap counterpart.
The stem overlap extends the measure of argument overlap by matching core
morphological form (i.e., lemmatized form, e.g., walk is a lemma form of walking) of content

21
words (i.e., noun, verbs, adjectives, adverbs) between sentences. The mean local stem overlap
occurs when the noun in one sentence is matched with the lemmatized content word in the
adjacent sentence. Similarly, the mean global stem overlap is measured by averaging the number
of overlap between pair of each sentence with every other sentence.
Finally, the content word overlap is measured using the mean and standard deviation of
the overlapping words in sentence pairs. For both local and global overlaps, if the sentence pair
has fewer words with four overlapping words, then the proportion is greater than the proportion
when a sentence pair has many words and two overlapping words. Four measures reflect this
overlap, i.e., the mean and standard deviation for local- and for global- content word overlaps.
These measures are useful when the length of sentences is a principal concern and requires a
close linguistics evaluation (McNamara, Graesser, McCarthy, & Cai, 2014).
Applications of referential cohesion. The features of referential cohesion can be
defined as the degree to which the words in sentences reflect the sequential dependencies in
the given essays. These features can approximate the organization, focus, development, and
uniformity of vocabulary in the written text. The cohesiveness of essays has typically been
discussed in the context of vocabulary usage, and is assessed either by referring to the well-
formed corpus or by employing the NLP-based procedures for identifying the vocabulary usages
(Burstein et al., 2013). In sum, the features of referential cohesion carry information about the
cohesiveness of ideas in the text, and act as the proxies of organization of ideas in the score
prediction model. High values on these features indicate high co-reference in the written text
and thus better flow and organization of ideas in the student produced essays.

22
5. Lexical diversity. Lexical Diversity refers to the variety of unique words that occur in a
text in relation to the total number of words in the text. The concepts of types and tokens are
central for understanding the foundations of lexical diversity. Consider, for example, this six-
word text “walk talk walking talk talking walk”. This text has four word types and six word tokens,
and the type-token ratio (TTR) is 0.67 (types/tokens). Lower values represent more words that
are repeated multiple times across the text and higher values reflect text which is lexically
diverse, but at the same time either low in cohesion or very short.
Foundations and computations. Coh-Metrix provides two TTR ratios; one by
considering types and tokens from the content-words, and other by considering types and tokens
from all-words in the text. While the TTR based measures of lexical diversity are sensitive to
variations in text length, the measures are positively correlated with the holistic quality of written
essays (Mellor, 2011; Yu, 2010). Coh-Metrix also provides two additional measures of lexical
diversity that stabilize the effect of text length (McCarthy & Jarvis, 2010). They are called
measure of textual lexical diversity (MTLD) and vocd-D. The MTLD is based on the stabilized TTR
values which are calculated as the mean length of text segment that accounts for saturation due
to text length (McCarthy & Jarvis, 2010). The vocd-D is calculated through a series of random
text samplings, each with 100 samples of text strings with 35 to 50 tokens. The mean TTR is
computed for each sample and empirical TTR curve is created from the means of each of these
samples. Then, a best fitting curve coefficient value (i.e., vocd-D) is computed (see also,
McCarthy & Jarvis, 2010; Malvern, Richards, Chipere, & Durán, 2004, p. 47). Compared to TTR,
both MTLD and vocd-D make use of more information for approximating the lexical indices.
However, for all four measures, higher values represent the greater lexical diversity in the text.

23
Applications of lexical diversity. The measures of lexical diversity approximate the
lexical complexity for word-based characteristics of essays. They can also be used to assess
essays as part of a sensibility check for flagging the forgery to the AES system (Attali & Burstein,
2006; Landauer, Laham, & Foltz, 2003). In sum, the four measures of lexical diversity captures the
unique lexical information of essays which can enhance the prediction power of the essay
scoring model.
6. Connectives. Connectives are linguistic cues that link elements of discourse. They help
the reader understand how the successive discourse elements are related and provide clues
about the text organization (McNamara, Graesser, McCarthy, & Cai, 2014). Coh-Metrix evaluates
text on nine different measures of connectives using their incidence score, i.e.,
relative frequencies. Coh-Metrix provides an overall incidence score as well as the scores for six
general classes of connectives. They are causal (e.g., therefore, because), adversative (e.g., still,
whereas), logical (e.g., and, or), temporal (e.g., before, later), expanded temporal (e.g., first, until),
and additive (e.g., additionally, furthermore) connectives. Coh-Metrix also provides two measures
of connective valence, which suggests whether the connective phrases are positive (e.g., also,
moreover) or negative (e.g., but, however).
Applications of connectives. The measures of connectives act as proxies for the
organization of idea and sentence fluency in the essays. Studies have found that the use of
appropriate connectives makes the text more convincing, logical, and authoritative (Tapper,
2005). Further, the use of connectives as a feature sub-set is also supported by the literature on
assessing and teaching writing, which encourages the use of connectives for sentence fluency,
24
rhythm, and flow of language (Education Northwest, 2013). In sum, the Coh-Metrix feature of
connectives brought valuable information to the score prediction models of this study.
7. Syntactic complexity and pattern density. Syntactic complexity and pattern density
refer to the degree to which working memory is used to process the syntactic structure of the
sentence. Text that carries shorter sentences, with few words before the main verb and few
words per noun-phrase, is syntactically easier to hold in memory. Conversely, longer sentences
with embedded clauses are structurally dense and could be syntactically ambiguous and, as a
result, are more difficult to process in working memory (Graesser et al., 2004; McNamara,
Graesser, McCarthy, & Cai, 2014). For example, shorter sentences that have less complex
syntactic structures (e.g., actor-action-object) are easier to process than the longer passive voice
sentences. Coh-Metrix provides fifteen indices of syntactic complexity and pattern density.
Specifically, two for syntactic description, three for syntactic uniformity, two for syntactic
similarity, and eight for syntactic pattern density of the sentences in the text.
Foundations and computations. The syntactic description is captured using
embeddedness and noun descriptive scores. The embeddedness score is computed using the
means number of words before the main verb (i.e., left embeddedness), and noun descriptive is
computed using the mean number of modifiers (i.e., adverbs, adjectives, and determiners) per
noun-phrase. The three measures of syntactic uniformity are based on the notion of minimal edit
distance (MED). As defined by McCarthy, Guess, and McNamara (2009), the MED assesses the
differences between any two sentences in terms of the position of the language-units (e.g.,
words, lemmas) in the sentences. For example, the sentences with the same words may not be
considered syntactically identical if the position of those words is different. Coh-Metrix provides
25
three variants of MED by computing the average-MED for words, lemmas, and part-of-speech in
the consecutive sentences.
Coh-Metrix also provides two syntactic similarity scores using the similarities of parse
trees between sentences. The parse tree is a graph which represents the rules of written
language that are used to generate the pattern of strings or sentences. Similarity of a parse tree
between sentences reflects the uniform and less complex syntactic structure that is easier to
process by the reader (Crossley, Greenfield, & McNamara, 2008). Coh-Metrix computes the
average parse tree similarity between adjacent sentences and between all sentence pairs across
text passage.
Finally, the syntactic pattern density is measured by assessing eight incidence scores for
the particular syntactic patterns, word types, and phrase types. There are four incidence scores
for phrase types: one each for noun-, verb-, adverb-, and preposition-phrases; two incidence
scores of verb conjunctions, that reflect the density of gerund and infinitive; and two measures
of sentence form that correspond to the incidence of negative sentences and the incidence of
sentences with passive voice.
Applications of syntactic complexity and density Scores. The features of syntactic
complexity and pattern density positively correlate with the human-based ratings of holistic
quality of written text (Chen & Zechner, 2011; Crowhurst, 1983). Therefore, they can be used for
approximating the text complexity and sentence structure (CTB/McGraw-Hill, 2013, p.152) in the
automated essay scoring system. These features can also be used in detecting, and providing
diagnostic feedback on, a wide variety of grammatical errors (Cotos, 2014, p. 42; Gamon,
Chodorow, Leacock, & Tetreault, 2013). In sum, the measures of syntactic complexity and

26
pattern density potentially enhance the score prediction because they capture the important
aspects of writing quality.
8. Word information. The construct of word information relates to the linguistic
characteristics of the words that affect word processing and learnability of text (Salsbury,
Crossley, & McNamara, 2011). These characteristics of words can be observed using the
methods in corpus linguistics.
Corpus approaches for information extraction. Corpus linguistics is a study of
language based on the corpus of language that contains examples from real-life language use.
For extracting the word information, the words are analyzed on the characteristics of reading
development, comprehension, and the construction of meaning in text (McEnery & Wilson,
2001; McNamara, Graesser, McCarthy, & Cai, 2014). Coh-Metrix provides measures of word
information on linguistic characteristics of Part-of-Speech, Word Frequency, and Psychological
Ratings.
Penn Treebank. The Part-of-Speech (POS) characterization represents the process of
morphological categorization of words such that the words in text are replaced by tag-category
based on their most likely representation in the large annotated corpus. For any given sentence,
the content words are tagged as nouns, verbs, adjectives, adverbs, and the function words are
tagged as pronouns, prepositions, determiners. When the words can be assigned to more than
one POS category, or when POS tag is unknown, the most likely category is assigned on the
basis of syntactic context of the word (Jurafsky & Martin, 2009, p.142). Coh-Metrix uses the Penn
Treebank corpus (Marcus, Marcinkiewicz, & Santorini, 1993) and Charniak parser (Charniak,
2000) for tagging the linguistic structure of the input text, and then computes the relative
27
frequency of ten morphological categories (i.e., noun, verb, adjectives, adverbs, pronouns, first-
person singular pronoun, first-person plural pronoun, second person pronoun, third-person
singular pronouns, third-person plural pronoun) of the given text.
CELEX corpus. The word frequency measures how often a particular word occurs in a large
corpus of language, because words that are used more often in the corpus are likely to be
processed more quickly than infrequent words (Beck, McKeown, & Kucan, 2013). Coh-Metrix
uses the frequency information from CELEX. CELEX is a corpus of 17.9 million words from a
variety of textual sources (Baayen, Piepenbrock, & Gulikers, 1995). Coh-Metrix provides three
CELEX-based measures of word information. They are mean raw frequency of content words,
mean log frequency of all words, and mean log minimum frequency of content words. While the
names of the first two measures are self-explanatory, the third measure is computed by
averaging the low-frequency content words per sentence.
Corpus of Psychological Ratings. The measures of Psychological Ratings are based on
human ratings of psychological properties of words. Coh-Metrix uses two databases of human
ratings, the Medical Research Council (MRC) Psycholinguistics database (Wilson, 1988) and the
WordNet database (Fellbaum, 2012), for computing nine psycholinguistic measures of the input
text. The MRC database is a collection of 150,837 words that are attributed on 26 psychological
dimensions. The human ratings on these psychological dimensions are ranged between 1 to 7,
with higher score means easier processing. In the Coh-Metrix framework, these ratings are
multiplied by 100 and rounded to the nearest integer. However, Coh-Metrix uses only 5 (out of
26) psychological dimensions, all based on content words in the given text. They are age of
acquisition, familiarity, concreteness, imagability, and meaningfulness. For each dimension, the

28
psychological rating is computed by averaging the human rating for each content word that
matches with the list of unique words in MRC database.
WordNet corpus. Coh-Metrix also uses the WordNet database to compute the measures
of polysemy and hypernymy. WordNet is a human annotated collection of 155,287 English
nouns, verbs, adjectives, and adverbs that are organized by a semantic network of interlinked
hierarchy of words (Fellbaum, 2012). Polysemy occurs when a word expresses several meaning,
thus increase a risk of being ambiguous and thereby increase the mental processing of words.
Coh-Metrix provides the mean polysemy scores using a group of related lexical items for all
content words in a text. The hypernymy reflects the number of links to the general concept (e.g.,
furniture) from specific concept (e.g., chair). The words in WordNet are organized in transitive
hierarchy which allows for the measurement of hypernym / hyponym relations. This hierarchical
organization provides the count of specific concepts (i.e., subordinate words) and general
concepts (i.e., superordinate words) around the target word, and can be used to compute the
mean hypernymy for nouns, verbs, and for combination of both nouns and verbs. A higher value
reflects the use of more specific words and lower value reflects the use of less-specific words
thereby revealing the novelty of vocabulary relative to the annotated corpus.
Applications of word information. Modern essay evaluation systems rely on the
corpus-based methods for generating diagnostic feedback (e.g., Criterion; Burstein & Chodorow,
2010), assessing syntactic variety (e.g., e-rater; Burstein, 2003), analyzing lexical accuracy (e.g.,
ALEKI; Leacock & Chodorow,2003), approximating grammaticality (e.g., LightSIDE; Mayfield &
Rose, 2013), and for summarizing sentence fluency, organization, and word-choices (e.g., IEA;

29
Foltz, Steeter, Lochbaum, & Landauer, 2013). The Coh-Metrix features of word information can
bring valuable information to the score prediction models.
9. Text descriptives. The descriptive features of text are meant to provide simple
summaries of basic patterns in text. The features such as number of words and average sentence
length can also be used to evaluate syntactic components of essays (CTB/McGraw-Hill, 2013,
p.150). Coh-Metrix computes eleven descriptive features of text: five at the words level, three at
the sentences level, and three at the paragraph level. The word-level descriptive features
include: total number of words, mean and SD of syllables in all words, and mean and SD of the
character-length of all words. The three sentence-level features include: total number of
sentences and mean and SD of the number of words per sentence. The three paragraph-level
features include: total number of paragraphs and mean and SD of the number of sentences per
paragraph.
The first essay grading program Project Essay Grade (PEG) used descriptive features of
essays for developing the score prediction model (Page, 1968, p.216). The accuracy of PEG
overcame the expectations because the correlation of PEG’s scores with four human judges was
high. The modern essay evaluation systems also make use of descriptive features as part of
prediction model (Larkey, 2003; Elliot & Klobucar, 2013). For example, the PEG in a re-written
form, is an AES program by Measurement Inc. makes use of word order and essay length as part
of its feature set (Dilki, 2006). Nevertheless, the winners of the Kaggle’s public essay scoring
competition used descriptive characteristics of essays such as counts of characters, word count,
sentence count, average sentence length, and paragraph count (CTB/McGraw-Hill, 2013, pp.151-

30
153; Kaggle, 2012; Kaggle, 2013). In sum, some of these features can enhance the score
prediction.
Section summary. The purpose of this section was to present the literature on deep
features of language and to explain the computational linguistic environment of Coh-Metrix.
This section described 110 unique text features that were organized in nine classes of features.
For each class, the fundamental concepts and procedures for extraction were presented. Next,
the relevant machine learning literature on AES is presented.
Section Two: Machine Learning Algorithms
The machine learning is an applied area of computing science that evolved from the
study of pattern recognition and artificial intelligence (Theodoridis & Koutroumbas, 2009). The
goal of machine learning is to program algorithms which may use past experiences or training-
examples for solving the given problem (Alpaydin, 2014). When the training examples are used
as prior knowledge, the learning is called supervised machine learning. When the prior examples
are not available, where the algorithm tries to unravel the underlying similarities by grouping the
similar examples, the learning is called unsupervised machine learning. In AES literature they
sometimes referred to as a prompt-specific model, and generic-model, respectively. In this
section, the supervised and unsupervised approaches for automated score prediction are
described, and two machine learning algorithms (MLAs) are reviewed and the rationale for their
selection are presented.
Types of score prediction algorithms. Automated score prediction algorithms fall into
two broad types: supervised and unsupervised algorithms. The supervised algorithm is a

31
machine learning algorithm that uses the pre-scored training essays to learn the approximated
behavior of the human scoring process by evaluating examples from pre-scored essays. This
step is called the model building and supervised learning process. The built model can then be
used for scoring of a separate or a new set of essays based on the likelihood suggested by the
regression steps of the model (Koedinger et al., 2015; Yannakoudakis, Briscoe, & Medlock, 2011).
The unsupervised algorithm is a machine learning algorithm that does not require any
pre-scored reference samples (essays) for building the learning model. This approach is called
unsupervised because there is no need for human intervention, or the requirement of supplying
pre-scored essays at any point in the process (Lee & Yang, 2009). For unsupervised algorithms,
learning is based on the content of the individual essays and their divergence from the
collection of essays, where the collection is considered as one large essay grouped according to
different score points (Burstein, Tetreault, & Madnani, 2013, p. 60; De & Kopparapu, 2011).
Empirically, the unsupervised learning algorithms are less accurate than the supervised learning
algorithms. That is, the trade-off is the accuracy of score prediction model for unsupervised
learning versus the expensive task of acquiring the pre-scored training dataset for supervised
learning (Gierl, Latifi, Lai, Boulais, & De Champlain, 2014; Xiong, Song, & deVersterre, 2012).
Empirically, most currently used automated scoring systems are based on supervised learning
algorithms (Koedinger et al., 2015). However, the machine learning methods used for automated
scoring process are not described in any detail in the published literature on AES systems
(Wilson & Andrada, 2016; Yannakoudakis, Briscoe, & Medlock, 2011).
Rationale for selecting learning algorithms. For this study, two supervised learning
algorithms were employed. They are Random Forest decision-tree induction and Sequential

32
Minimum Optimization. The Random Forest takes the simple-tree approach for solving the
classification problem. In addition to being simple, this algorithm was also the top performer in
the top 10 algorithms for text classification tasks (Lomax & Vadera, 2013; Witten, Frank, & Hall,
2011, p. 376; Wu et al., 2008). By comparison, the Sequential Minimum Optimization is selected
because of its ability to handle and transform linear and non-linear features using the multi-
dimensional kernel transformation functions (Platt, 1998; Witten, Frank, & Hall, 2011, p. 223).
Hence, both algorithms take a distinct approach for building the models that may yield different
predictive outcomes, as well as they are preferred for text classification tasks (Chen, Fife, Bejar, &
Rupp, 2016; Witten, Frank, & Hall, 2011, p. 376). A theoretical overview is presented next.
Overview of random forest decision-tree induction. As the name suggests, the
Random Forest consists of multiple decision trees and the algorithm that makes a classification
decision by combining the predictive outcome from randomly generated decision-trees. The
randomness of each tree can be described as a function of set of features and maximum-depth
of tree, meaning that each tree chooses a random set of features given the maximum depth of a
tree is reached. The decision-tree algorithm addresses the classification problem using a slightly
different approach compared to other probabilistic and linear algebraic approaches. It uses the
information gain approach (Costa et al., 2013; Quinlan, 1993).
The basic idea for this algorithm is to split the data into subsets based on a feature that
offers the most information gain, and then split the subsets based on another feature that offers
the most information gain at the subset level. This process is repeated until all the features are
used. Consider for example this fruit classification problem: Given a fruit is red, round, and about

33
eight centimeters in diameter, is this fruit more likely to be an apple or an orange? Here, the first
step is to determine which feature (i.e., shape, color, or size) offers the most information gain for
the classification of fruit. Conceptually, since an apple and an orange have similar diameter and
shape, splitting the dataset based on these features may not lead to much information gain. But
if the dataset is split based on color, we would expect most of the red colored fruits to be apples
and most of the orange colored fruits to be oranges. Therefore, in this case, color is the feature
that provides the most information gain for the classification. Mathematically, this information
gain can be calculated using equation 2.
∑ ( ) ( )
∑(| |
) ( ∑ ( ) ( )
)
( )
where is the class value, is the total number of classes, ( ) is the proportion of in the
whole sample, is the value of a feature, is the total number of values in a feature; | | is the
number of elements in a subset which have a feature value of , is the total sample size, ( )
is the proportion of in a subset that has a feature value of .
The equation 2 can be applied repeatedly to determine the next best feature that leads
to the most information gain. Once the next best feature is determined, such as shape in the
fruit example, the subsets can be further split based on this feature. Decision-tree algorithm also
includes some specific methods to deal with continuous features and missing data. For detailed
explanation see Quinlan (1993).
Overview of sequential minimal optimization. The Sequential Minimal Optimization
(SMO) by itself is not a classification method. However, SMO can be considered as a part of a

34
classification method called Support Vector Machine (SVM; Platt, 1998). While SVM and Random
Forest decision-tree induction addresses similar classification problem, SVM uses a different
approach. Instead of using information gain approach, SVM uses a geometric or linear algebraic
approach. SVM can be conceptually understood as representing subjects as points in space,
which is mapped so that the examples of the separate categories are divided by a clear gap that
is as wide as possible (Platt, 1998; Tong & Koller, 2002). This basic idea is illustrated in Figure 1,
which shows simple classification problem: Given the values of two features (i.e., F1 and F2) of a
subject, which class (C1, C2) does this subject belongs to?
Figure 1. Conceptual representation of sequential minimum optimization.
As shown in Figure 1, the solution to this problem is to find a line (or hyperplane when
there are more than two features) that best separates the two classes C1 and C2 by a maximum
margin. The criterion for the best separation is that the distances from the nearest point to the
separating line must be at their maximum. As shown in Figure 1, the line H1 cannot separate C1
H2 H3
H1
F1
F2
SEQUENTIAL MINIMUM OPTIMIZATION
Class
C1
C2

35
and C2; line H2 separates C1 and C2 but the distances from the nearest point to H2 is small; line
H3 separates C1 and C2 and the distances from the nearest point to H3 is at their maximum.
Mathematically, this geometric problem can be generalized and represented as the optimization
problem in equation 3.
∑
∑∑ ( )
∑
( )
where is the number of subjects, is a vector that contains all the feature values for subject ,
is the class for subject , is the Lagrange multiplier, is an SVM hyper parameter, ( )
is a symmetric Mercer kernel function (Souza, 2010; Tong & Koller, 2002).
The SMV-based algorithm, SMO, is an efficient algorithm to solve the optimization
problem presented in Figure 1. SMO splits the classification problem into a series of the smallest
possible sub-problems, and then solves these problems analytically. For detailed mathematical
explanation see Platt (1998).
Section summary. The purpose of this section was to describe machine learning
approaches in automated essay evaluation and to explain the basic difference between
supervised and unsupervised machine learning algorithms. Two supervised machine learning
algorithms were presented and the rationale for their selection was discussed. For each
algorithm, the fundamental concept and procedure of learning were presented. Next, the review
of validation methods in AES literature are presented and the basis of validating the study
outcomes are described.

36
Section Three: Validation of the Essay Scoring Model
Chung and Baker (2003) identified three stages of AES validation: i) validation of AES
software engineering, ii) validation of the AES system independent of the assessment context,
and iii) validation of the AES system using assessment context for the generalizability of findings.
However, most AES research tends to gather evidence only on the second stage, mainly because
human judges are the explicit criterion for validating the performance of automated scoring
system (Attali, 2013; Chung & Baker, 2003; Dilki, 2006; Williamson, Xi, & Breyer, 2012). Because
the automated essay evaluation systems are not doing the actual reading of essays for
interpretation, the validation of these systems essentially rests on how well the human raters are
modeled such that the score produced by the machine is indistinguishable from human scores.
In other words, human ratings are the current “gold standard” for evaluating AES scoring
performance. This indistinguishability of AES from human raters was first established by Page
(1966) when he presented the inter-correlation matrix of five “raters”, one of which was a
computer, and he asked which one is the computer?
Page (2003, p.53) then questioned the criterion for inviting, validating, and re-inviting the
best human judges for grading the essays. It appears that the performance of human raters is
judged by their correlations with other human judges. He contended that if the criterion is to
achieve the appropriate degree of concordance with human judges then the same framework
can be used for the validation of machine based scoring. In this case, the computer program will
be asked to come back year after year for assessing the essays. Moreover, Keith (2003) proposed
that the statistical evidence of concordance between human raters and the AES system not only
confirms that the computer assesses the writing construct but also provides evidence for the

37
reliability and criteria-related validity. This study follows the same foundations of validating the
AES framework, meaning that machine- and human-produced scores were compared as a way
of validating the scoring accuracy.
Validity coefficients. For the purpose of this research, human raters were considered
the “gold standard” and, hence, the validation process relies primarily on the evaluation of
scores produced by the AES system against the scores produced by the human raters. For this
study, six agreement measures and two distributional measures were computed. Exact-
agreement percentage, adjacent-agreement percentage, kappa ( ), quadratic weighted kappa
( ), score-correlation, and scale point discrepancy analysis served as the agreement measures.
Score deviation reported as standardized mean score difference ( ) and F score ( ) were
the distributional measures. Nevertheless, these measure could also be used for credibly
monitor the scoring consistency between two human raters (Shermis, 2014b).
Agreement measures and discrepancy analysis. Exact-agreement is the exact match
between human and computer scores and reported as a percentage. Adjacent-agreement is the
agreement between human and computer scores within the range of one-point discrepancy and
reported as a percentage. The is a summary estimate that measures agreement beyond
chance. The is the weighted version of in which the cost of departing beyond adjacent
score-category is not same. The score-correlation is the Pearson correlation coefficient among
human raters, and between each human rater and the machine-produced scores. The scale point
discrepancy analysis involves assessing the rates of discrepancies (beyond one-point difference)

38
at each scale-level between two human raters, and comparing it with the discrepancies between
human rater and the computer scores.
Distributional measures. The score variance represents the average squared difference
in scoring, which indicates the similarity in use of scale of measurement between human and
computer scoring. However, the variance can be summarized by single index1 ( ), which
can also be compared against the criterion of (Williamson, Xi, & Breyer, 2012). The is a
measure from information sciences that summarizes the model effectiveness to remain
indistinguishable from human scoring. Its value ranges between 0.0 and 1.0, where a higher
value reflects better performance of the system (Makhoul, Kubala, Schwartz, & Weischedel,
1999; Powers, 2011). The is computed using the harmonic mean of two classification
quantities, precision and recall2. Burstein and Marcu (2003) suggested that the essay scoring
model becomes indistinguishable from humans if , because F-score strikes the balance
between precision and recall and optimally avoids giving high scores to a trivial machine
learning system (Brew & Leacock, 2013; Makhoul, Kubala, Schwartz, & Weischedel, 1999). The
interpretation and inference of the validity coefficients of this study are discussed in Chapter 3.
Chapter Summary
In this chapter, it is noted that the automated framework for scoring student-produced
essays can be developed by integrating three stages, i.e., deep features extraction, supervised
1 ( ) √(
) 2 Precision(P) is the number of true positive (TP) over the number of predicted positives, where predicted
positives equals TP plus false positives(FP). Recall(R) is the number of TP over the number of positives,
where positives equals TP plus false negative(FN). Arithmetically, P = TP/(TP+FP), R = TP/(TP+FN), and the
mean of these ratios equals

39
machine learning, and validation of computer scores. It is also noted that the deep language
features from Coh-Metrix are based on theoretical and empirical foundations from
computational linguistics, corpus linguistics, discourse processing, and computing science.
Further, a review of relevant and recent studies in AES shows that the main focus of the AES
research is on improving the validation and predictive power of AES systems and, to date, the
AES literature lacks the description of internal mechanism for extracting and modeling the deep
features of student produced essays.
Further, it is also noted that psycholinguistics methods are available to assess the overall
quality of written text, which can be employed to evaluate the higher-order discourse features,
e.g., cohesion relations, easability, world knowledge, latent semantic analysis, situation models,
readability. These deep features represent the mathematical system of modeling the human
thinking and comprehension process and their accuracy has been tested in variety of
morphological applications. It is also noted that these features could not only describe the
broad construct of the writing quality, but also could act as proxies for other sub-constructs
such as development, easability, fluency, comprehension, flow, focus, grammar, lexical accuracy,
mechanics, organization, readability, rhythm, sentence complexity, sentence structure, stylistics,
syntactic variety, text complexity, uniformity of vocabulary, word choices, usage, and world
knowledge. However, previous studies did not provide specific information about how various
computational components are combined for developing the valid essay scoring system.
Finally, it is noted that some deep feature extraction methods employ dimensionality
reduction techniques for selecting the most informative representation of the input text. This

40
results in a new set of implicit features that are a transformation of the original feature-set
without a loss of prediction information. Hence, dimensionality reduction methods can identify
the most informative features and refine the feature-set for better prediction of an essay score.
In doing so, the computational complexity of feature-extraction and machine-learning is
reduced. Next, the methods of this study are presented in Chapter 3.
41
Chapter Three: Method
Participants
ASAP competition. This study makes use of real essay samples from students who
wrote their exams under standardized testing conditions. These essays were collected from
three PARCC (Partnership for Assessment of Readiness for College and Careers) states and three
SBAC (SMARTER Balanced Assessment Consortia) states of the United States of America. The
essay samples were previously used in the Automated Student Assessment Prize (ASAP)
competition for developing state-of-the-art automated scoring system. This competition was
sponsored by the William and Flora Hewlett Foundation (Hewlett Foundation, 2012) for
stimulating innovations in machine scoring of student produced essays. Specifically, the goal of
competition was to evaluate the extent to which AES systems are capable of producing scores
similar to those of trained human graders (Shermis, 2014a).
Using the common dataset, the ASAP had two separate streams of competitions, one for
public and the other for AES vendors. There were 159 entrants for public competition and 9
entrants for vendor competition, with the prize money for top 3 public competitors only. For the
vendor competition, lone non-commercial entrant was from a university laboratory (TELEDIA
Laboratory, Carnegie Mellon University; who does make their source code available to
researchers and is free to use3) and other eight entrants were the testing companies (AIR,
CTB/McGraw Hill, ETS, Measurement, Inc., MetaMetrics, Pacific Metrics, Pearson, Vantage
Learning) that are considered leaders in the field of automated scoring of essays (Shermis,
2014a). The objective of the competition was to encourage the public contribution to the field of
3 http://ankara.lti.cs.cmu.edu/side/download.html
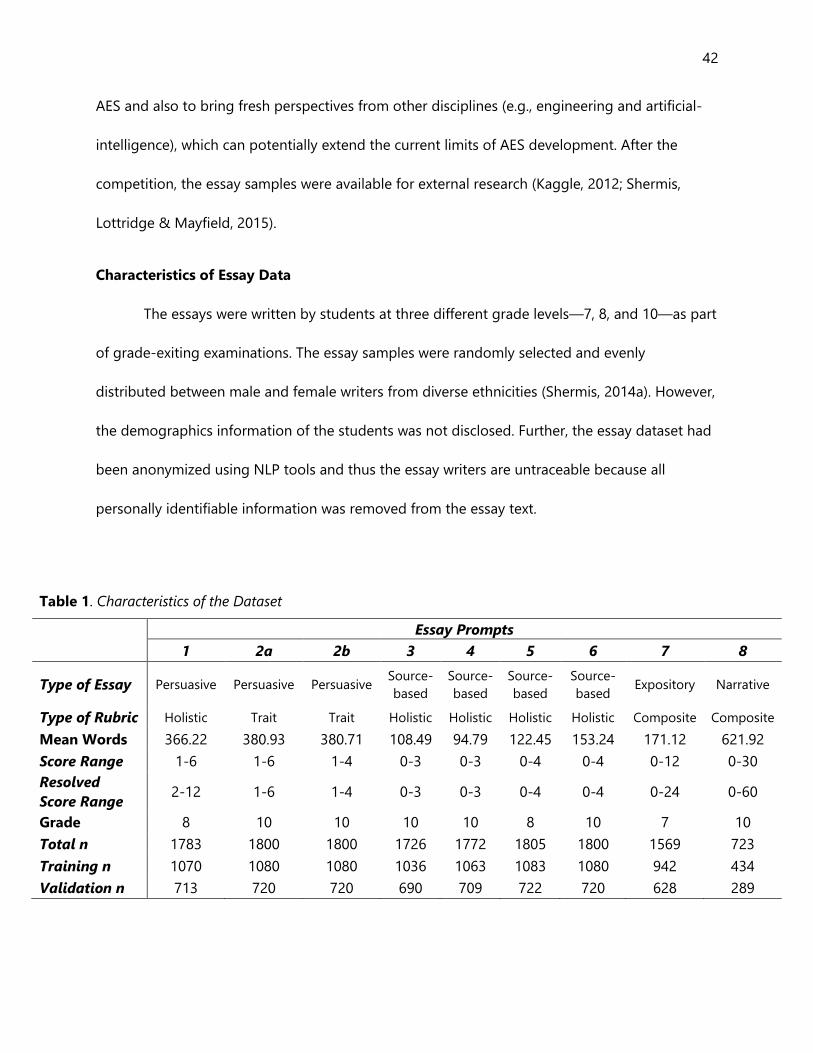
42
AES and also to bring fresh perspectives from other disciplines (e.g., engineering and artificial-
intelligence), which can potentially extend the current limits of AES development. After the
competition, the essay samples were available for external research (Kaggle, 2012; Shermis,
Lottridge & Mayfield, 2015).
Characteristics of Essay Data
The essays were written by students at three different grade levels—7, 8, and 10—as part
of grade-exiting examinations. The essay samples were randomly selected and evenly
distributed between male and female writers from diverse ethnicities (Shermis, 2014a). However,
the demographics information of the students was not disclosed. Further, the essay dataset had
been anonymized using NLP tools and thus the essay writers are untraceable because all
personally identifiable information was removed from the essay text.
Table 1. Characteristics of the Dataset
Essay Prompts
1 2a 2b 3 4 5 6 7 8
Type of Essay Persuasive Persuasive Persuasive Source-
based
Source-
based
Source-
based
Source-
based Expository Narrative
Type of Rubric Holistic Trait Trait Holistic Holistic Holistic Holistic Composite Composite
Mean Words 366.22 380.93 380.71 108.49 94.79 122.45 153.24 171.12 621.92
Score Range 1-6 1-6 1-4 0-3 0-3 0-4 0-4 0-12 0-30
Resolved
Score Range 2-12 1-6 1-4 0-3 0-3 0-4 0-4 0-24 0-60
Grade 8 10 10 10 10 8 10 7 10
Total n 1783 1800 1800 1726 1772 1805 1800 1569 723
Training n 1070 1080 1080 1036 1063 1083 1080 942 434
Validation n 713 720 720 690 709 722 720 628 289

43
This study makes use of essays that were scored by at least two experienced human
raters. As presented in Table 1, the essays ( ) were collected for eight different essay
prompts (see Appendix B) which represent a range of typical writing genres. That is, four essay
prompts represent source-based essays (i.e., the essay prompt referred to a source document
which an examinee read as part of the question) and the other four essay prompts represent the
traditional genre of persuasive, expository, and narrative essays. The essay 2 was scored on two
different traits (i.e., 2a and 2b) that resulted in nine essay scoring prompts. The length of source-
based essay samples is smaller (mean number of words, and the standard deviation,
) than the traditional essays ( ). For each essay prompt,
approximately 60% of the essay samples were used for model training and testing, and the
remaining 40% were used for validating the AES framework of this study. The approval to use
the essay dataset for secondary analyses, and to conduct this study, was acquired from the
Research Ethics Office at the University of Alberta (see Appendix C).
Framework for Automated Scoring
A three-stage process was employed for the automated scoring of essay responses. In
the first stage, the text features from the essays was extracted. In the second stage, the extracted
features were used to develop the scoring model. In the third stage, the developed scoring
model from Stage 2 was used for score classification and validation analysis using unseen essay
samples. To operationalize the three-stage automated essay evaluation workflow, six software
programs and packages were used. They are Python libraries, Visual Basic macros, and Microsoft
Excel for data-processing and for results summarization, Coh-Metrix for extracting linguistics
features from essay text, Python libraries and R (R Core Team, 2016) for computing the

44
evaluation measures, and Weka for model development, evaluation, and as scoring engine.
While the details about Coh-Metrix were presented in Chapter 2, Weka is, an acronym for
Waikato Environment for Knowledge Analysis, a machine learning software system developed
and maintained by the researchers at University of Waikato, New Zealand (Witten, Frank, & Hall,
2011). Weka is a comprehensive suite of machine learning libraries which provides an
environment for data pre-processing, classification, regression, clustering, feature selection,
association, and visualization (Frank et al., 2005; Frank, Hall, Trigg, Holmes, & Witten, 2004;
Witten et al., 1999). The software libraries of Weka are programmed using Java, and are freely
available for import and extension into other software environments. The methods that were
employed at each stage are presented next.
Stage 1: Data Preprocessing for Feature Extraction and Reduction
Feature extraction is a process of identifying and transforming the elements of text into
measurable units of information. Before the feature can be extracted from essays, the essay text
must be preprocessed so that the feature-extractor (i.e., Coh-Metrix) can transform the essays
into feature vector of numbers. The Coh-Metrix software system requires each essay to be
contained in a separate text file, with the file name representing the essay identification
information. A software module was written using Visual Basic macro, that transformed the
essay dataset into a separate text file with the essay identifier as part of the file name. Hence, all
essays ( ) were preprocessed and transformed such that there were 12,978 processed
text files. Next, the processed essay-text files were analyzed using Coh-Metrix for extracting the
fine-grained units of information, which represent linguistic characteristics of essays on 110
different measures (see Chapter 2 for details).

45
Feature selection and reduction. For the development of AES models in Stage 2, the
extracted feature vectors were used in two different modes. First, the full set of 110 features
were employed for the development of AES models. Second, the supervised machine learning
algorithms were employed to identify the most informative features (i.e., reduced features) for
the development of AES models. In doing so, the less-informative or distracting features were
removed and only the best set of features was retained. The Weka environment for machine
learning was used for identifying the most informative features to build the scoring model in
Stage 2. In sum, for each essay prompt, two distinct feature profile (FP) were produced, one that
had full set of 110 features (FPF) and the other FP had reduced features (FPR).
Stage 2: Development and Evaluation of Automated Scoring Models
The task in Stage 2 is to develop the mapping function for AES by using the feature
profiles from Stage 1. This is accomplished by training the computer model to emulate human
scoring by iteratively learning the characteristics of the extracted features. This iterative learning
process is often referred to as machine learning, and the algorithm used is called a machine
learning algorithm (MLA). MLA takes an evidence-based approach, where the input features are
mapped onto the output scores with the goal of developing a scoring model capable of
accurately grading the unseen essays. The scoring models of this study were developed using
two MLAs, namely the Random Forest Decision-Tree Induction (MLA1) and the Sequential
Minimum Optimization (MLA2; see Chapter 2 for description). For each MLA, the development
and evaluation of the automated scoring model involves two iterative sub-steps, model
development and model evaluation.

46
Model development. Model development is a process in which the extracted feature
profile is supplied to the MLA so that the patterns and associations among the linguistics
characteristics of texts can be analyzed and mapped to the human scores. Model development
starts by judging the features of text and building the knowledge base using the training
dataset, and while the model is learning from the text features, its expected performance is
measured in terms of score-prediction error on future unseen essay samples. However, in most
real-world situations the error cannot be calculated exactly and it must be estimated by
evaluating the expected true performance. Therefore, choosing an appropriate estimation
procedure for evaluating expected true performance requires some considerations.
Model evaluation. The expected true performance of the developing model can be
evaluated in two ways. First, by using a dataset which is separate from the training data. Second,
by splitting and re-using the existing training dataset, also known as cross-validation. Acquiring
separate datasets for the purpose of model evaluation is often difficult because large amounts
of unique data must be available. Alternatively, model evaluation by means of cross-validation is
practical, computationally feasible, and economical because it does not require additional data
(Arlot & Celisse, 2010; Witten, Frank, & Hall, 2011). Therefore, this study employed the cross-
validation method for evaluating the prediction error during the development of scoring model.
To split the data into training and testing samples, one can choose to make a single split
(i.e., half of the data used for training and other half of the data used for testing) or multiple
splits ( fold), which is commonly referred to as K fold cross-validation. For example, when
, then the data will be randomly split into three approximately equal partitions and each
partition will be used first for testing the model, while the remaining partitions will be used for

47
training. After the third iteration, the mean model accuracy is computed to describe the
expected future performance of the scoring model. For most machine learning situations,
has been commonly used due to its accuracy in estimating the error rate of MLA
(Refaeilzadeh, Tang, & Liu, 2009, p. 535; Witten, Frank, & Hall, 2011, p.153), and because the
model statistical performance often does not generally improve when the number of splits
exceeds by ten (Arlot & Celisse, 2010; Gierl, Latifi, Lai, Boulais, & De Champlain, 2014). Therefore,
in this study 10 fold cross-validation was used for evaluating the AES models.
Procedure and outcome. To begin, the text features from Stage 1 were employed for
developing the initial score prediction model using a randomly selected partition of training
dataset. At the end of each iteration, the model self-corrects itself by adjusting the weights
learned from the testing cycle. The developing model (i.e., partially trained MLA) was then
iteratively trained using the remaining training partitions. After the ( ) iteration, the
developed model was considered final. It was then employed in Stage 3 for scoring a new set of
student responses for a particular essay prompt. For each essay prompt, four distinct scoring
models were developed by pairing MLA1 and MLA2 with the full feature set (FPF) and with
reduced-feature set (FPR). Hence, the outcome of Stage 2 was 36 prompt-specific AES models,
four for each essay prompt. These scoring models were used in Stage 3 for scoring the
remaining 40% unseen essays and the validity of each prompt-specific AES model was
evaluated.
Stage 3: Score Classification and Validation
The developed AES models from Stage 2 were used to grade the new essay responses,
so that the actual scoring performance of the models can be validated. To begin, the 40 %
48
validation-essay samples were scored using the corresponding AES models from Stage 2. For
each essay prompt, four distinct scoring models was evaluated by grading the corresponding
essay responses and their validation coefficients were computed and compared with the human
ratings.
Validity coefficients. This study evaluated the performance of the scoring model on the
basis of eight measures that are standard in the field of automated essay evaluation and
machine learning. Specifically, six agreement measures and two distributional measures were
computed. Exact-agreement percentage, adjacent-agreement percentage, kappa ( ), quadratic
weighted kappa ( ), score-correlation, and scale point discrepancy analysis were used as
agreement measures. Standardized mean score difference ( ), and F score ( ) were used as
distributional measures.
Agreement measures and discrepancy analysis. While, the exact-agreement
represents the absolute agreement between two human raters, the adjacent-agreement
represents the generally accepted testing convention of considering two raters’ score
assignments within one score point of each other as being the acceptable score assignment
(Shermis, 2014a). Both, the exact- and adjacent-agreement were reported as percentage. The
was computed as a summary estimate that measures agreement beyond chance. A of 1.0
indicates perfect agreement and of 0.0 suggests that the agreement level is equivalent to
chance or a random outcome. However, is typically useful when the score scale is nominal.
The is a weighted version of that is generally used when the score scale have some
underlying trait which increases as the score on the scale increases. Hence, the statistics

49
associate weights to the pair of ratings based on how far apart they are from each other. For
example, two human ratings that are far apart (e.g., 2 from 6) would have more negative effect
on the statistic than the two ratings that are relatively closer (e.g., 4 from 6) on the ordinal
score scale. Williamson, Xi, and Breyer (2012) suggested two criteria for evaluating the
statistic. First, the value should be . Second, the difference between machine-human
and human-human scores should not exceed by 0.10. The first criteria flag whether at least half
of the variance in human scores is accounted for by the AES system. The second criteria flag
whether the scoring performance of AES system degraded considerably in relation to the
human–human scoring agreement.
Similarly, the Pearson correlation coefficients were computed between human-human
and machine-human scores and was evaluated using the aforementioned criteria. Further, for
each essay prompt, the scale point discrepancy analysis was conducted, in which case the score
discrepancy rates at each scale point were evaluated between two human raters and between
human and machine scores. This revealed the pattern of discrepancy between human-human
and machine-human along the score scale.
Distributional measures. The variance in human scores and machine produced scores
was also computed and a summary statistics of was reported between human scores and
machine scores, which indicates the similarity in the use of the scale of measurement between
human and computer scoring. The value was compared against the criteria value of
, which confirms the distributional similarity between human and machine produced
scores (Williamson, Xi, & Breyer, 2012). Further, the multiclass was computed using the

50
Python libraries. The values range between 0.0 and 1.0, where a higher value reflects better
performance of AES system. Burstein and Marcu (2003, p. 222) had suggested that the ideal
prediction system should have a value . However, the suggested value is considered
the most conservative (Brew & Leacock, 2013, p. 148) for evaluating the machine learning
system, and most AES studies chooses not to report the as part of their results.
Procedure of comparison. In sum, validity coefficients were computed for each
machine-human and human-human scores. The machine-human measures were used to make
comparison between the predicted machine scores and the resolved human scores (i.e., agreed
final scores by humans), and the human-human measures indicated the actual concordance
between two human scores. In addition, the degree of difference (i.e., delta) between
corresponding validity coefficients of machine-human and human-human measures was
computed and contrasted. However, if the human-human agreement is below the criteria
thresholds then the scoring model is disadvantaged in demonstrating the reasonable level of
performance due to the inherent unreliability of the two human ratings. Nevertheless, the essay
samples of this study were anonymized, using named entity recognizer, as a way of masking the
identity of essay writers, and the impact of anonymization may not be appreciable (Shermis,
Lottridge & Mayfield, 2015, p.434).

51
Chapter Four: Results
This chapter is organized in four sections. Section one presents the findings of this study
when the full-feature profile (FPF) was used for developing the AES models. Section two presents
the results when the reduced-feature profile (FPR) was used for developing the AES models. This
section also presents the usage analysis of nine feature categories which includes a summary of
their relative contribution in the development of the scoring models. Section three presents the
comparison between findings of the current study and two other “state-of-the-art” AES system
relative to the outcomes of two human raters. This section also presents the results of this study
using some graphical illustrations. Section four includes a summary of the results that
synthesizes the outcomes from the previous three sections.
Section One: Findings from the Full-Feature Profile (FPF)
The results in this section are based on the full-feature profile (FPF; all 110 features) of
Coh-Metrix when two distinct machine learning algorithms (MLAs) were used, Random Forest
and SMO. For each MLA, three types of scoring analyses are presented. They are agreement,
distributional, and score-point discrepancy analyses. The agreement analyses are based on
concordance measures between the human scores and the machine scores. The distributional
analyses involve comparing the distributional information between human score distributions
and the machine predicted score distributions. Finally, the score-point discrepancy analysis
involves comparing the absolute-, and directional-, discrepancy in the score assignment
between two human raters, and between the human and AES models.
Agreement analysis. Table 2 presents the outcome from the agreements analyses when
FPF was used for the development of the score prediction model. For each essay prompt, five

52
agreement measures were computed between the AES scoring models based on Random Forest
(MLA1), and for SMO (MLA2) given the resolved human scores (HumanR).
Table 2. Agreement Measures of the AES Framework Developed using Full-feature Profile (FPF)
Learning
Algorithm Measures
Essay Prompts
1 2a 2b 3 4 5 6 7 8
RF Grader
(MLA1)
Exact+Adj % 1.00 0.99 0.99 0.98 0.98 0.98 0.96 0.69 0.49
Exact-% 0.71 0.67 0.68 0.69 0.63 0.67 0.61 0.32 0.28
Kappa 0.53 0.45 0.45 0.53 0.48 0.54 0.40 0.21 0.12
QWK 0.76 0.64 0.64 0.69 0.73 0.79 0.66 0.72 0.59
Pearson r 0.77 0.66 0.64 0.70 0.73 0.79 0.69 0.73 0.64
SMO Grader
(MLA2)
Exact+Adj % 0.99 0.99 0.99 0.97 0.98 0.99 0.97 0.66 0.49
Exact-% 0.68 0.64 0.66 0.66 0.63 0.65 0.62 0.28 0.29
Kappa 0.47 0.39 0.42 0.48 0.47 0.51 0.42 0.17 0.13
QWK 0.71 0.59 0.60 0.67 0.72 0.78 0.70 0.71 0.42
Pearson r 0.73 0.60 0.62 0.67 0.73 0.78 0.73 0.72 0.46
The exact agreements between human and machine scoring ranged from 0.28 on essay
#8 to 0.71 on essay #1, and the adjacent agreement4 ranged from 0.49 on essay #8 to 1.00 on
essay #1. For both agreement measures, the MLA1 performed better than the MLA2. The kappa
statistics ranged from 0.12 on essay #8 to 0.54 on essay #5, the quadratic weighted kappa–QWK
( ) ranged from 0.42 on essay #8 to 0.79 on essay #5, and the Pearson correlation ( ) ranged
from 0.46 on essay #8 to 0.79 on essay #5. On average the MLA1 performed better than the
MLA2 on kappa, , and .
4 Adjacent agreement refers to the combined exact and adjacent score agreements. The adjacent
agreement is represented as Exact+Adj % in the result tables.

53
Williamson, Xi, and Breyer (2012) suggested two criteria-based guidelines for evaluating
the and values. The first criterion is to flag whether at least half of the variance in human
scores is accounted for by the AES system. This is tested using the criterion value of .
The second criterion is to flag whether the scoring performance of AES system degraded
considerably in relation to the human–human scoring agreement, in which case the absolute
difference in , between machine-human and human-human scores should not exceed 0.10.
For values, the assessment of the first criterion ( values ) suggested that the
values from MLA1 conforms to the criterion on four essays (i.e., on essay #1, 4, 5, and 7), and
MLA2 conforms to the criterion on five essays (i.e., on essay #1, 4, 5, 6, and 7). An inspection of
second criterion (absolute difference between ) indicates that the MLA1 meets the
criterion on five essays (i.e., on essay #1, 3, 5, 7, and 8) and MLA2 meets the criterion on four
essays (i.e., essays #1, 5, 6, and 7). For values, the assessment of first criterion suggested that
the values from MLA1 meet the outcome on four essays (i.e., on essay #1, 4, 5, and 7), and
MLA2 meet the outcome on five essays (i.e., on essay #1, 4, 5, 6, and 7). An inspection of the
second criterion indicates that MLA1 meet the criterion on six essays (i.e., on essay #1, 3, 5, 6, 7,
and 8) and MLA2 meet the criterion on four essays (i.e., on essay #1, 5, 6, and 7).
In sum, similar patterns of conformity were observed on the two criteria for , and for ,
across both MLAs. However, the scoring models that were based on MLA1 consistently
performed better on the agreement measures than the scoring models that were based on
MLA2. Taken together, the scoring models that were developed using MLA1 (Random forest)
performed better on the agreement measures.

54
Distributional analysis. Table 3 presents the outcome from the distributional analysis
when FPF was used for developing the AES model. Two measures are reported, the SMSD and F-
score. The SMSD (standardized mean score difference) is a summary statistic that assesses the
similarity in use of the scale of measurement between human and computer scoring. The F-
score is also a summary statistic which is computed using the harmonic mean of two
classification quantities (precision and recall) of a confusion matrix that tabulate the human-
score distribution against the predicted-score distribution.
Table 3. Distributional Measures of the AES Framework Developed using Full-feature Profile (FPF)
Learning
Algorithm Measures
Essay Prompts
1 2a 2b 3 4 5 6 7 8
RF Grader
(MLA1)
SMSD -0.06 -0.01 0.09 0.10 0.11 0.04 0.23 0.11 0.28
F-Score 0.65 0.37 0.58 0.52 0.61 0.54 0.46 0.22 0.09
SMO Grader
(MLA2)
SMSD -0.08 -0.01 0.16 0.02 0.03 0.04 0.21 0.10 0.23
F-Score 0.57 0.37 0.59 0.51 0.61 0.59 0.42 0.22 0.10
As shown in Table 3, for MLA1 the SMSD ranged from -0.06 on essay #1 to 0.28 on essay
#8, and for MLA2 it ranged from -0.08 on essay #1 to 0.23 on essay #8. Williamson, Xi, and
Breyer (2012) suggested to compare the SMSD value against the criterion value of ,
meaning that if the absolute value of SMSD is less than 0.15 then it is safe to assume the
distributional similarity between human- and machine-produced scores, and when the absolute
SMSD value exceeded by 0.15, it indicates the differential scaling between human and machine
scores. The sign of SMSD is also important. The SMSD value below -0.15 suggest the
distribution of machine scores is systematically shifted to the left of the human scoring

55
distribution ( ) and the SMSD value above +0.15 indicate the distribution of
machine scores is systematically shifted toward right of the human score distribution (
).
The scoring models that are based on MLA1 satisfied the SMSD criterion on seven essays
(i.e., on essay #1, 2a, 2b, 3, 4, 5, and 7), and the MLA2 satisfied the SMSD criterion on six essays
(i.e., on essay #1, 2a, 3, 4, 5, and 7). For non-conforming AES models (i.e.., essay #6 and 8 for
MLA1, and essay #2b, 6, and 8 for MLA2) , the SMSD values are positive and which
indicates that the machine-score distribution is shifted to the right of the human-score
distribution. However, for MLA2 the SMSD value for essay #2b is 0.16 which is only slightly above
the criterion threshold. Taken together, MLA1 performed better than the MLA2 on the SMSD
measure.
Next, for MLA1 the F-score ranged from 0.09 on essay #8 to 0.65 on essay #1, and for
MLA2 it ranged from 0.10 on essay #8 to 0.61 on essay #4. The F-score is a summary metric that
can be used for comparing the machine learning systems and to date, no specific criterion is
suggested for evaluating F-score values. This could be because the AES studies in the published
literature do not report F-score as part of their results, and thus there is no established criterion
for interpreting the F-score values. However, Burstein and Marcu (2003, p. 222) noticed that the
value beyond 0.69 can serve as the ideal standard which should be the target to achieve for
automatic classification systems. We have expanded on this point in section three of this chapter
when we have compared the results of this study with the gold-standard (two human raters). In
sum, the MLA1 performed better than the MLA2 on the F-score.

56
Score-point discrepancy analysis. Two types of discrepancy analysis were conducted.
The absolute score-point discrepancy and the directional score-point discrepancy. For the
absolute score-point discrepancy, the total scoring discrepancy was classified into the absolute
deviations of 1-point, 2-points, and 3-points-or-more between two human raters, and between
human and machine scores. For directional score-point discrepancy, the total scoring
discrepancy was classified into the directional deviations of ±1-point, ±2-points 3-points-or-
above, and −3-points-or-below between two human raters, and between human and machine
scores. Table 4 and Table 5 shows the outcome from absolute and directional score-point
discrepancy analysis, respectively.
Table 4. Absolute Score Scale Discrepancy percentages(%) between Human raters, and AES
models using Full-feature Profile (FPF)
Discrepancy
Between
Score-
Points
Essay Prompts
1 2a 2b 3 4 5 6 7 8
Gold Standards
(Human1 and
Human2 )
1 96.2 99.4 98.7 98.8 100.0 95.5 95.9 45.4 28.1
2 3.8 0.6 1.3 1.2 - 4.2 3.3 29.1 25.7
3 or beyond - - - - - 0.3 0.7 25.5 46.2
HumanR and
RF Grader
(MLA1)
1 99.0 97.9 97.4 92.1 94.6 95.4 89.7 54.2 29.7
2 1.0 1.7 2.1 7.9 4.6 4.6 9.3 25.6 29.7
3 or beyond - 0.4 0.4 - 0.8 - 1.1 20.2 40.7
HumanR and
SMO Grader
(MLA2)
1 98.3 96.6 96.4 92.0 93.9 96.8 92.6 52.8 28.6
2 1.7 3.1 3.2 8.0 5.7 3.2 7.0 29.4 33.0
3 or beyond - 0.4 0.4 - 0.4 - 0.4 17.9 38.3
As shown in Table 4, about 98% of the total discrepancy between two humans is within
one score-point, and about 95% of the total discrepancy between the resolved human scores

57
(HumanR) and machine scores is also within one score point. The only exception is the
expository essay #7 and the narrative essay #8. For essay #7 only about 50% of the discrepancy
is within one score-point and the remaining 50% is distributed among the other two deviation
categories. For essay #8, a higher proportion of the total discrepancy is observed in the third
deviation category (i.e., 3-points or beyond), and only about 30% of the total score deviation is
within one-score point. These findings on essay #7 and 8 are off from the generally acceptable
norms in essay scoring5. This outcome could be due to the wider scoring scales associated with
these essays, 0-12 for essay #7, and 0-30 for essay #8. Taken together, the pattern of
discrepancy between two-humans and between the HumanR and machine scores along the
score scale was found to be comparable.
The directional score-point discrepancy analyses provide a detailed evaluation of the
discrepancy in the score assignment. To compute the directional discrepancy, the score
difference between human1 and human2 (ScoreHuman1 – ScoreHuman2), and between HumanR and
AES models (ScoreHuman – ScoreMLA) was computed. As shown in Table 5, on average about 3% of
the total discrepancy between two-humans is within ±2 score-points from one another. By
comparison, on average about 4.5% of the total discrepancy between HumanR and AES model is
within ±2 score-points from one other, meaning that – at the discrepancy level of ±2-points –
the AES models tend to assign slightly higher scores than the human scores. The discrepancy of
±3-points-and-beyond is negligible (< 0.4%). It is important to note that the score ranges for
essays#7 & 8 were much larger than for the other essays.
5 That is, considering two raters’ score assignments within one score point of each other as being the
acceptable score assignment, as long as they do not differ beyond one score point (Shermis, 2014a)
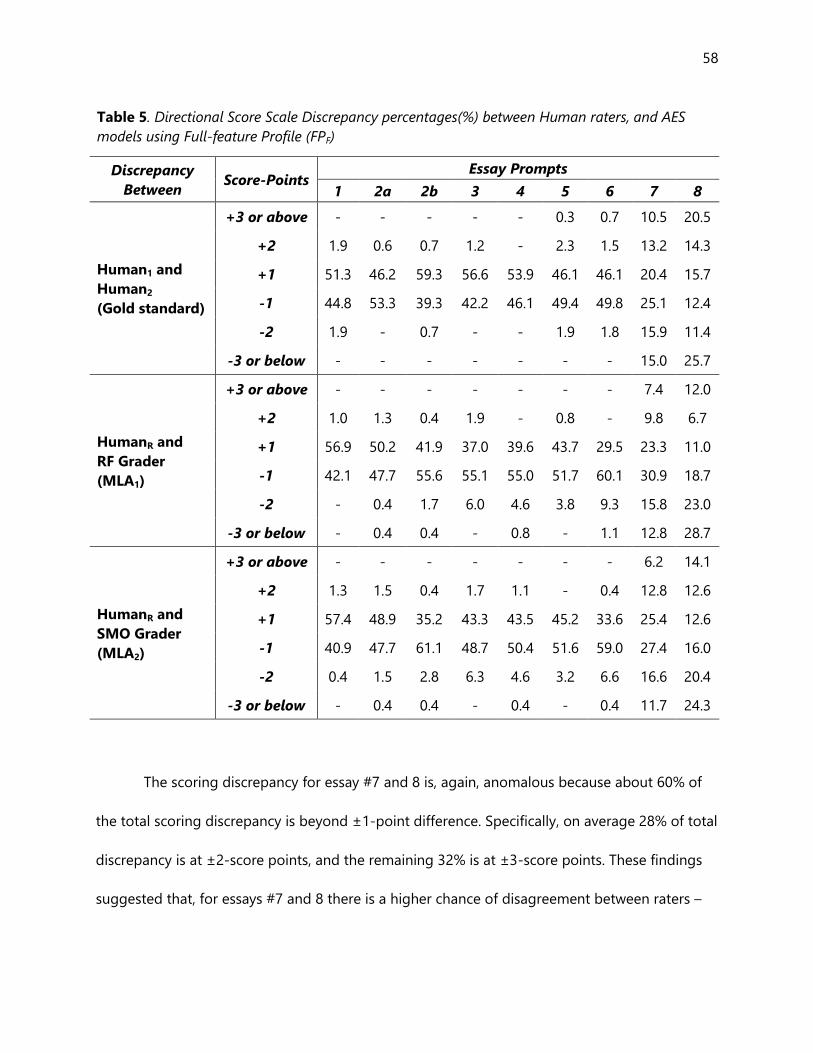
58
Table 5. Directional Score Scale Discrepancy percentages(%) between Human raters, and AES
models using Full-feature Profile (FPF)
Discrepancy
Between Score-Points
Essay Prompts
1 2a 2b 3 4 5 6 7 8
Human1 and
Human2
(Gold standard)
+3 or above - - - - - 0.3 0.7 10.5 20.5
+2 1.9 0.6 0.7 1.2 - 2.3 1.5 13.2 14.3
+1 51.3 46.2 59.3 56.6 53.9 46.1 46.1 20.4 15.7
-1 44.8 53.3 39.3 42.2 46.1 49.4 49.8 25.1 12.4
-2 1.9 - 0.7 - - 1.9 1.8 15.9 11.4
-3 or below - - - - - - - 15.0 25.7
HumanR and
RF Grader
(MLA1)
+3 or above - - - - - - - 7.4 12.0
+2 1.0 1.3 0.4 1.9 - 0.8 - 9.8 6.7
+1 56.9 50.2 41.9 37.0 39.6 43.7 29.5 23.3 11.0
-1 42.1 47.7 55.6 55.1 55.0 51.7 60.1 30.9 18.7
-2 - 0.4 1.7 6.0 4.6 3.8 9.3 15.8 23.0
-3 or below - 0.4 0.4 - 0.8 - 1.1 12.8 28.7
HumanR and
SMO Grader
(MLA2)
+3 or above - - - - - - - 6.2 14.1
+2 1.3 1.5 0.4 1.7 1.1 - 0.4 12.8 12.6
+1 57.4 48.9 35.2 43.3 43.5 45.2 33.6 25.4 12.6
-1 40.9 47.7 61.1 48.7 50.4 51.6 59.0 27.4 16.0
-2 0.4 1.5 2.8 6.3 4.6 3.2 6.6 16.6 20.4
-3 or below - 0.4 0.4 - 0.4 - 0.4 11.7 24.3
The scoring discrepancy for essay #7 and 8 is, again, anomalous because about 60% of
the total scoring discrepancy is beyond ±1-point difference. Specifically, on average 28% of total
discrepancy is at ±2-score points, and the remaining 32% is at ±3-score points. These findings
suggested that, for essays #7 and 8 there is a higher chance of disagreement between raters –

59
between two humans or between human and AES models – at ±3-score points than at ±2-score
points.
Section Two: Findings from the Reduced-Feature Profile (FPR)
The feature reduction is an iterative dimensionality reduction step which involves the
identification of the most informative set of features from the set of original features without the
loss of predictive information. The results in this section are based on the reduced-feature
profile (FPR) which were extracted by reducing the original/training feature profile, i.e. reducing
the FPF of 110 features. For this study, two tree-based features reduction techniques were tested
− information gain (IG) and gain ratio (GR)− and only the best set of reduced features were
employed for building the AES models using MLA1 and MLA2. The results from features analysis
are presented next.
Table 6. Details of Feature Profiles
Essay Prompts
1 2a 2b 3 4 5 6 7 8
Count of FPF 110 110 110 110 110 110 110 110 110
Reduction %-age 58.2 62.7 70.9 70.9 67.3 63.6 66.4 76.4 67.3
Count of FPR 64 69 78 78 74 70 73 84 74
Reduction Technique IG IG IG IG GR IG IG GR GR
IG = Information Gain, GR= Gain Ratio
Feature analysis. Table 6 summarizes the outcome from the feature-reduction step for
all essays prompts in the study. For example, for essay #7, about 76% of total features (84 out of

60
110 using GR) were found informative and hence were used as an implicit set of features that
could represent the original features, without the loss of prediction information.
Table 7. Analysis of Reduced-feature profile Contribution in percentage (%)
Feature Category Feature
count
Essay Prompts Overall
1 2a 2b 3 4 5 6 7 8
Text Easability 19 14.1 18.8 20.5 15.4 16.2 11.4 16.4 20.2 23.0 17.3
Referential
Cohesion 12 18.8 17.4 15.4 15.4 16.2 17.1 16.4 14.3 16.2 16.4
Word Information 24 12.5 14.5 12.8 14.1 14.9 15.7 16.4 15.5 20.3 15.2
Syntactic Comp. &
Pattern Dens. 15 12.5 10.1 12.8 15.4 16.2 14.3 11.0 14.3 4.1 12.3
Text Descriptives 11 14.1 11.6 11.5 9.0 6.8 12.9 9.6 9.5 13.5 10.9
Latent Semantic
Analysis 8 9.4 7.2 7.7 7.7 8.1 8.6 8.2 7.1 10.8 8.3
Connectives 9 6.3 8.7 6.4 9.0 9.5 7.1 6.8 7.1 4.1 7.2
Situation Model 8 6.3 5.8 7.7 9.0 8.1 7.1 9.6 8.3 2.7 7.2
Lexical Diversity 4 6.3 5.8 5.1 5.1 4.1 5.7 5.5 3.6 5.4 5.2
Total 110 64 69 78 78 74 70 73 84 74 73.8
Table 7 shows the relative contribution of each of the nine different categories of
features. For example, the FPR for essay #7 has total of 84 features, and the highest proportion
of its features (i.e., 20.2%, 17 features) belongs to the Text Easability and the second highest
contribution (i.e., 15.5%, 13 features) comes from the feature category of Word Information, and
so forth. The left most column of Table 7 presents the average contribution of each of the nine

61
feature category, which ranged from 17.3% for Text Easability to 5.2 % for Lexical Diversity.
Figure 2 illustrates the essay-wise contribution in stacked bar graph form.
Figure 2. The contribution of feature-categories used for the development of scoring models.
However, feature categories with large numbers of features could overshadow the actual
informativeness of the individual feature category. Thus, in order to assess the informativeness
(i.e., the proportion of features that were valuable for score prediction) of each feature category,
the feature retention percentage for each of the nine feature categories was computed. The
feature retention percentages indicates the proportion of features that were identified and
retained by the dimensionality reduction algorithm as being informative. Table 8 presents the
6 6 5 5 4 6 5 4 5 5
6 6 8 9 8 7 108 3
7
6 9 69
9 77
7
4
7
9 7 88 8 9
87
11
8
1412 12
97
13 1010 14
11
13
10 1315
1614
1114
4
12
13
14 13
1415
16
16 15
20
15
19
17 15
15 16
17
1614
16
16
1419 21
15 1611
1620 23
17
0%
10%
20%
30%
40%
50%
60%
70%
80%
90%
100%
1 2a 2b 3 4 5 6 7 8 Overall
Featu
re U
sag
e
Text Easability Referential Cohesion
Word Information Syntactic Complexity and Pattern Density
Text Descriptives Latent Semantic Analysis
Connectives Situation Model
Lexical Diversity

62
essay-wise features retention percentages across nine categories of features. The results in Table
8 are presented in the descending order of average retention percentages. For example, 100%
(all twelve) features of Referential Cohesion were informative for predicting the essays scores,
which suggests the higher informedness of this feature category. By comparison, only about
47% features in Word Information are informative for the prediction of essay scores.
Further investigation at the essay-prompt level suggested that the feature categories had
varying degrees of feature informativeness across essay types. For example, for the Situation
Model, 88% of the features were informative for essay #6, whereas only 25% of the features were
found to be informative for essay #8. Similarly, for feature category Syntactic Complexity and
Pattern Density, 80% of the features were found to be informative for essay #3, 4, and 7,
whereas only 20% of the features were useful for essay #8. These findings suggest that feature
retention is not only dependent on the essay text but also on the characteristics within the
essays such as essay-type, scoring rubric, and the grade-level of the essay. Explanations beyond
the essay text were not evaluated as part of this study. Nevertheless, for essay # 8, the feature
retention rate for Situation Model, Syntactic Complexity and Pattern Density, and Connectives
ranged between 20% to 33%, which suggests a lesser proportion of worthy features in these
feature categories for this narrative essay prompt.
Next, using the corresponding FPR, the results are presented when two distinct machine
learning algorithms (MLAs) were used, Random Forest and SMO. For each MLA, three types of
scoring analyses are presented. They are agreement, distributional, and score-point discrepancy
analyses.

63
Table 8. Analysis of Reduced-feature profile Usage in percentage (%)
Feature Category Feature
count
Essay Prompts Overall
1 2a 2b 3 4 5 6 7 8
Referential Cohesion 12 100.0 100.0 100.0 100.0 100.0 100.0 100.0 100.0 100.0 100.0
Lexical Diversity 4 100.0 100.0 100.0 100.0 75.0 100.0 100.0 75.0 100.0 94.4
Latent Semantic Analysis 8 75.0 62.5 75.0 75.0 75.0 75.0 75.0 75.0 100.0 76.4
Text Descriptives 11 81.8 72.7 81.8 63.6 45.5 81.8 63.6 72.7 90.9 72.7
Text Easability 19 47.4 68.4 84.2 63.2 63.2 42.1 63.2 89.5 89.5 67.8
Situation Model 8 50.0 50.0 75.0 87.5 75.0 62.5 87.5 87.5 25.0 66.7
Syntactic Comp. & Pattern Dens. 15 53.3 46.7 66.7 80.0 80.0 66.7 53.3 80.0 20.0 60.7
Connectives 9 44.4 66.7 55.6 77.8 77.8 55.6 55.6 66.7 33.3 59.3
Word Information 24 33.3 41.7 41.7 45.8 45.8 45.8 50.0 54.2 62.5 46.8

64
Agreement analysis. Table 9 presents the outcome from the agreements analyses when
FPR was used for the development of the score prediction model. For each essay prompt, five
agreement measures were computed between the AES scoring models based on Random Forest
(MLA1), and for SMO (MLA2) given the resolved human scores (HumanR).
Table 9. Agreement Measures of the AES Framework Developed using Reduced-feature Profile
(FPR)
Learning
Algorithm Measures
Essay Prompts
1 2a 2b 3 4 5 6 7 8
RF Grader
(MLA1)
Exact+Adj % 1.00 0.99 0.99 0.98 0.98 0.99 0.96 0.68 0.52
Exact-% 0.71 0.68 0.67 0.68 0.64 0.69 0.61 0.33 0.29
Kappa 0.54 0.46 0.43 0.52 0.49 0.56 0.41 0.23 0.14
QWK 0.77 0.65 0.61 0.69 0.73 0.80 0.68 0.74 0.63
Pearson r 0.78 0.67 0.63 0.70 0.74 0.80 0.71 0.75 0.66
SMO Grader
(MLA2)
Exact+Adj % 1.00 0.99 0.99 0.97 0.98 0.99 0.96 0.67 0.47
Exact-% 0.70 0.66 0.67 0.68 0.63 0.66 0.60 0.32 0.28
Kappa 0.50 0.42 0.44 0.51 0.48 0.52 0.38 0.22 0.10
QWK 0.73 0.61 0.63 0.68 0.73 0.78 0.65 0.70 0.44
Pearson r 0.75 0.63 0.64 0.68 0.73 0.79 0.69 0.71 0.50
The exact agreements between human and machine scoring ranged from 0.28 on essay
#8 to 0.71 on essay #1, and the adjacent agreement ranged from 0.47 on essay #8 to 1.00 on
essay #1. For both agreement measures, the MLA1 performed better than the MLA2. The kappa
statistics ranged from 0.10 on essay #8 to 0.56 on essay #5, the quadratic weighted kappa–QWK
( ) ranged from 0.44 on essay #8 to 0.80 on essay #5, and the Pearson correlation ( ) ranged
from 0.50 on essay #8 to 0.80 on essay #5. The pattern on agreement measures are identical to
what we have found when FPF were used for developing the scoring models. However, the

65
results from FPR are better than the results from FPF, meaning that the dimensionality reduction
have shown an increase in the agreement measures. Moreover, the MLA1 performed better than
the MLA2 on kappa, , and .
Using the guidelines from Williamson, Xi, and Breyer (2012) the and values were also
compared against two criteria. For values, the assessment of the first criterion ( values
) suggested that the values from MLA1 and MLA2 met to the criterion on four essays
(i.e., on essay #1, 4, 5, and 7). However, there are three instance where the values were very
close ( ) to the criterion threshold. An inspection of second criterion (absolute difference
between ) indicates that the MLA1 meets the criterion on six essays (i.e., on essay #1, 3,
5, 6, 7, and 8) and MLA2 meets the criterion on four essays (i.e., essays #1, 3, 5, and 7).
For values, the assessment of first criterion suggested that the values from MLA1
meet the outcome on five essays (i.e., on essay #1, 4, 5, 6, and 7), and MLA2 meet the outcome
on four essays (i.e., on essay #1, 4, 5, and 7). However, there are two scoring models whose
values were very close ( ) to the criterion threshold of . An inspection of the
second criterion indicates that MLA1 meet the criterion on six essays (i.e., on essay #1, 3, 5, 6, 7,
and 8) and MLA2 meet the criterion on five essays (i.e., on essay #1, 3, 5, 6, and 7).
In sum, similar patterns of conformity were observed on the two criteria for and
across both MLAs. However, the scoring models that were based on MLA1 had consistently
performed better on the agreement measures than the scoring models that were based on
MLA2. By comparison, the results from FPR are better than the results from FPF, meaning that the
dimensionality reduction shows an increase in the agreement measures.

66
Table 10. Distributional measures of the AES Framework Developed using Reduced-feature
Profile (FPR)
Learning
Algorithm Measures
Essay Prompts
1 2a 2b 3 4 5 6 7 8
RF Grader
(MLA1)
SMSD -0.07 0.01 0.15 0.11 0.11 0.04 0.20 0.11 0.22
F-Score 0.68 0.33 0.58 0.52 0.61 0.55 0.44 0.22 0.13
SMO Grader
(MLA2)
SMSD -0.08 -0.01 0.16 0.02 0.03 0.04 0.21 0.10 0.23
F-Score 0.57 0.37 0.59 0.51 0.61 0.59 0.42 0.22 0.10
Distributional analysis. Table 10 presents the two outcome measures from the
distributional analysis when FPR was used for developing the AES model. As shown in Table 10,
for MLA1 the SMSD ranged from -0.07 on essay #1 to 0.22 on essay #8, and for MLA2 it ranged
from -0.08 on essay #1 to 0.23 on essay #8. Using the guidelines (SMSD ) from
Williamson, Xi, and Breyer (2012), the scoring models that are based on MLA1 satisfied the SMSD
criterion on seven essays (i.e., on essay #1, 2a, 2b, 3, 4, 5, and 7), and the MLA2 satisfied the
SMSD criterion on six essays (i.e., on essay #1, 2a, 3, 4, 5, and 7). However, for MLA2, the SMSD
value for essay #2b is only slightly above the criterion (≈0.159). For non-conforming AES models
(i.e.., essay #6 and 8), the SMSD values are positive and which indicates that the machine-
score distribution is systematically shifted to the right of the human-score distribution. Next, for
MLA1 the F-score ranged from 0.13 on essay #8 to 0.68 on essay #1, and for MLA2 it ranged
from 0.10 on essay #8 to 0.61 on essay #4. In sum, the MLA1 performed better than the MLA2 on
the on SMSD and F-score measures.
Score-point discrepancy analysis. Two types of discrepancy analysis were conducted
when FPR were used for developing the AES models. The absolute score-point discrepancy and

67
the directional score-point discrepancy. For the absolute score-point discrepancy, the total
scoring discrepancy was classified into the absolute deviations of 1-point, 2-points, and 3-
points-or-more between two human raters, and between human and machine scores. For the
directional score-point discrepancy, the total score discrepancy was classified into the
directional deviations of ±1-point, ±2-points, 3-points-or-above, and −3-points-or-below
between two human raters, and between human and machine scores. Table 11 and Table 12
shows the outcome from absolute and directional score-point discrepancy analysis, respectively.
Table 11. Absolute Score Scale Discrepancy percentages(%) between Human raters, and AES
models using Reduced-feature Profile (FPR)
Discrepancy
Between Score-Points
Essay Prompts
1 2a 2b 3 4 5 6 7 8
Gold Standards
(Human1 and
Human2 )
1 96.2 99.4 98.7 98.8 100.0 95.5 95.9 45.4 28.1
2 3.8 0.6 1.3 1.2 - 4.2 3.3 29.1 25.7
3 or beyond - - - - - 0.3 0.7 25.5 46.2
HumanR and
RF Grader
(MLA1)
1 98.5 97.8 96.3 93.2 94.1 96.0 90.4 52.1 32.7
2 1.5 1.7 3.7 6.8 5.5 3.6 8.9 29.3 31.2
3 or beyond - 0.4 - - 0.4 0.4 0.7 18.6 36.1
HumanR and
SMO Grader
(MLA2)
1 98.6 97.2 97.5 91.5 94.6 97.1 90.9 50.9 27.3
2 1.4 2.4 2.1 8.5 5.0 2.9 8.4 29.8 33.0
3 or beyond - 0.4 0.4 - 0.4 - 0.7 19.2 39.7
As shown in Table 11, about 98% of the total discrepancy between two humans is within
one score-point, and about 95% of the total discrepancy between HumanR and machine scores
is also within one score point. The only exception is, again, the expository essay #7 and the
narrative essay #8. For essay#7 only about 50% of the discrepancy is within one score-point and

68
the remaining 50% is distributed among the other two deviation categories. For essay #8, higher
proportion of the total discrepancy (between 36.1% and 46.2%) is observed in the third
deviation category (i.e., 3-points or beyond), and only about 30% of the total scoring deviation is
within one score-point.
These findings on essay #7 and 8 differ from the generally acceptable norms in essay
scoring6. The AES model is as good as human scoring, and if the two human disagree beyond
the acceptable scoring norms then the scoring model is disadvantaged in demonstrating the
reasonable level of performance due to the inherent unreliability of two human raters. Taken
together, the pattern of discrepancy between two-humans and between the machine scores and
HumanR – along the score scale – was found to be comparable.
The directional score-point discrepancy analyses provide the signed assessment of the
discrepancy in the score assignment. Where the positive (negative) discrepancy represent the
proportion of total discrepancy which is less (greater) than the human rating. As shown in
Table 12, on average, about 3% of the total discrepancy between two humans is within ±2 score
points from one another. By comparison, on average, about 5% of the total discrepancy
between HumanR and AES model is within ±2 score-points from one another, meaning that – at
the discrepancy level of ±2-points – the AES models tend to assign slightly higher scores than
the human scores. The discrepancy of ±3-points-and-beyond is negligible (< 0.5%).
6 That is, considering two raters’ score assignments within one score point of each other as being the
acceptable score assignment, as long as they do not differ beyond one score point (Shermis, 2014a)

69
Table 12. Directional Score Scale Discrepancy percentages(%) between Human raters, and AES
models using Reduced-feature Profile (FPR)
Discrepancy
Between Score-Points
Essay Prompts
1 2a 2b 3 4 5 6 7 8
Gold standard
(Human1 and
Human2)
+3 or above - - - - - 0.3 0.7 10.5 20.5
+2 1.9 0.6 0.7 1.2 - 2.3 1.5 13.2 14.3
+1 51.3 46.2 59.3 56.6 53.9 46.1 46.1 20.4 15.7
-1 44.8 53.3 39.3 42.2 46.1 49.4 49.8 25.1 12.4
-2 1.9 - 0.7 - - 1.9 1.8 15.9 11.4
-3 or below - - - - - - - 15.0 25.7
HumanR and
RF Grader
(MLA1)
+3 or above - - - - - - - 6.9 12.2
+2 1.5 1.3 0.4 1.8 0.4 0.4 0.7 10.5 6.8
+1 59.2 47.6 36.9 36.4 38.2 43.6 30.5 22.6 13.7
-1 39.3 50.2 59.3 56.8 55.9 52.4 59.9 29.5 19.0
-2 - 0.4 3.3 5.0 5.1 3.1 8.2 18.8 24.4
-3 or below - 0.4 - - 0.4 0.4 0.7 11.7 23.9
HumanR and
SMO Grader
(MLA2)
+3 or above - - - - - - - 7.3 14.4
+2 0.9 1.2 0.4 1.8 1.2 0.4 0.3 12.0 9.6
+1 59.0 51.2 33.5 47.3 47.1 43.9 31.5 24.2 12.4
-1 39.6 46.0 64.0 44.2 47.5 53.3 59.4 26.8 14.8
-2 0.5 1.2 1.7 6.7 3.9 2.5 8.0 17.8 23.4
-3 or below - 0.4 0.4 - 0.4 - 0.7 12.0 25.4
The scoring discrepancy for essay #7 and 8 is anomalous because about 60% of the total
scoring discrepancy between two-human raters is beyond the ±1-point difference. Specifically,
on average, 31% of the total discrepancy is at ±2-score points, and the remaining 29% is at ±3-
score points. These findings suggested that, for essays #7 and 8, there is a higher chances of

70
disagreement between raters – between two humans or between human and AES models – at
±3-score points than at ±2-score points.
Section Three: Comparison of Study results
In this section, the findings of the current study are compared with the results of two
“state-of-the-art” AES systems relative to the outcomes of two human raters. The performance
deltas of the FPF and FPR scoring models were computed and compared. Three comparisons
were conducted. First, the results are compared with the agreement and distributional measures
of two human raters. Second, the results are compared with two state-of-the-art AES systems.
Third, the results from current study are graphically combined and then contrasted with the
performances of two-human raters and two state-of the-art AES systems.
Comparison with two human raters. Table 13 presents the agreement and
distributional measures between two human raters. The results in this table demonstrate how
well two human raters agree on essay scoring and thus could serve as the gold standard for the
development of scoring models. As shown, the exact agreements between two humans ranged
from 0.27 on essay #8 to 0.79 on essay #2b, and the adjacent agreement ranged from 0.48 on
essay #8 to 1.00 on essay #2a, 2b, 3, and 4. It should be noted that for essay #7 and 8 the
average exact agreement is less than (by about 42%) the exact agreement on the other essays
prompts. Similarly, the average adjacent agreement for essay #7 and 8 is less than (by about
45%) the adjacent agreement on other essays prompts. In other words, the average
disagreement between two human raters is about 72% for essay #7 and 8, and about 30% on
the other essay prompts.

71
The kappa statistics ranged from 0.14 on essay #8 to 0.68 on essay #4, the quadratic
weighted kappa–QWK ( ) ranged from 0.63 on essay #8 to 0.85 on essay #4, and the Pearson
correlation ( ) ranged from 0.63 on essay #8 to 0.85 on essay #4. The agreement pattern on
and is identical, and apart from essay #8, all and values satisfies the criterion (values
) suggested by Williamson, Xi, and Breyer (2012). Further, the SMSD values ranged from
−0.05 on essay #2b to 0.06 on essay #7 which suggests the absence of systematic differences
between score distributions of the two human raters.
Table 13. Agreement characteristics between Human raters on the Validation Samples
Measures Essay Prompts
1 2a 2b 3 4 5 6 7 8
Exact+Adj % 0.99 1.00 1.00 1.00 1.00 0.98 0.98 0.61 0.48
Exact-% 0.63 0.77 0.79 0.76 0.78 0.57 0.62 0.29 0.27
Kappa 0.42 0.62 0.66 0.63 0.68 0.41 0.46 0.17 0.14
QWK 0.71 0.80 0.81 0.79 0.85 0.75 0.77 0.73 0.63
Pearson r 0.71 0.80 0.81 0.79 0.85 0.75 0.77 0.73 0.63
SMSD -0.04 0.03 -0.05 -0.05 -0.02 0.01 0.01 0.06 0.05
F-Score 0.64 0.73 0.75 0.76 0.76 0.55 0.60 0.27 0.22
The F-score values ranged from 0.22 on essay #8 to 0.76 on essay #3 and 4. The F-score
indicates the inter-rater agreement between the gold standard and the automated classification
system and could also be used for comparing the agreement between two human raters. In
which case, rater-1 could be considered as the gold standard and rater-2 as the classifier, or vice
versa (Hripcsak & Rothschild, 2005). Burstein and Marcu (2003, p. 222) suggested that the F-
score value beyond 0.69 could serve as the ideal standard, which should be the target to achieve

72
for rater agreement. However, as shown in Table 13, five out of nine F-score values are less than
the suggested value of 0.70, which shows that the inter-rater agreement on the F-score is
inconsistent compared to the other evaluation measures (e.g., most and values are ).
Thus, the F-score is the most rigorous measure for comparing the performance between
raters. As noted earlier, however, researchers in the the AES literature do not report F-score as
part of their results, and thus there is no established criterion for interpreting the F-score values.
Table 14A. Performance Deltas of this study with Human Raters (StudyResults − H1H2Results) using
Full-feature Profile (FPF)
Machine
Learner Measures
Essay Prompts
1 2a 2b 3 4 5 6 7 8
RF
Grader
(MLA1)
Exact+Adj % 0.01 -0.01 -0.01 -0.02 -0.02 0.00 -0.03 0.07 0.01
Exact-% 0.07 -0.09 -0.12 -0.07 -0.15 0.10 -0.01 0.03 0.00
Kappa 0.11 -0.17 -0.21 -0.10 -0.21 0.13 -0.06 0.04 -0.02
QWK 0.05 -0.16 -0.17 -0.10 -0.13 0.04 -0.11 -0.01 -0.05
Pearson r 0.06 -0.14 -0.17 -0.09 -0.12 0.04 -0.08 0.00 0.01
SMSD -0.03 -0.04 0.14 0.15 0.13 0.03 0.22 0.05 0.23
F-Score 0.01 -0.36 -0.16 -0.23 -0.16 -0.02 -0.14 -0.04 -0.13
SMO
Grader
(MLA2)
Exact+Adj % 0.01 -0.01 -0.01 -0.02 -0.02 0.01 -0.01 0.05 0.01
Exact-% 0.04 -0.13 -0.13 -0.10 -0.15 0.08 0.00 -0.01 0.01
Kappa 0.05 -0.24 -0.25 -0.15 -0.21 0.09 -0.03 0.00 -0.01
QWK 0.00 -0.21 -0.21 -0.12 -0.13 0.03 -0.07 -0.02 -0.21
Pearson r 0.02 -0.20 -0.19 -0.12 -0.13 0.03 -0.04 -0.01 -0.17
SMSD -0.04 -0.03 0.21 0.11 0.09 0.03 0.16 0.03 0.15
F-Score -0.14 -0.38 -0.19 -0.26 -0.16 0.06 -0.12 -0.07 -0.10

73
Table 14A and 14B presents the comparison of performance deltas (StudyResults –
H1H2Results) between the results of current study and two human raters. Specifically, Table 14A
presents the performance deltas between two-humans and AES models that were developed
using the FPF. Table 14B presents the performance deltas between two-humans and AES models
that were developed using FPR. Each table presented deltas for MLA1 and MLA2,, where positive
values suggests the performance of the scoring model exceeded, relative to the performance of
two human raters.
As shown in Table 14A, the exact agreement for MLA1 exceeded the performance on four
essays (i.e., on essay #1, 5, 7, and 8) and MLA2 exceed on three essays (i.e., on essay #1, 5, and 8).
The adjacent agreement for both MLA1 and MLA2 was exceeded on four essays (i.e., on essay #1,
5, 7, and 8). The kappa for MLA1 models exceeded their performance on three essays (i.e., on
essay #1, 5, and 7) and MLA2 exceeded the performance on two essays (i.e., on essay #1 and 5).
Further, the delta for was shown to exceed performance on two essays (i.e., on essay #1and 5)
for both MLA1 and MLA2. The delta for was shown to exceed performance on four essays (i.e.,
on essay #1, 5, 7 and 8) for MLA1, and on two essays (i.e., on essay # 1 and 5) for MLA2.
The SMSD values ranged from −0.04 on essay #1 and 2a to 0.23 on essay #8. Since the
SMSD value could be negative, the delta for SMSD should be interpreted with reference to the
Human-Human SMSD value. For example, the SMSD delta on essay #2b was 0.14 because the
SMSDMLA1 ≈ 0.09 and SMSDhuman-human ≈ −0.05. In this case, the individual SMSDs and their
absolute difference are . The delta for F-scores ranged from -0.36 on essay #2a to 0.06 on

74
essay #5. Taken together, the performance deltas on essay #1, 5, 7, and 8 were found in favors
of the AES models that were developed using FPF.
Table 14B. Performance Deltas of this study with Human Raters (Study Results − H1H2 Results) using
Reduced-feature Profile (FPR)
Machine
Learner Measures
Essay Prompts
1 2a 2b 3 4 5 6 7 8
RF
Grader
(MLA1)
Exact+Adj % 0.01 -0.01 -0.01 -0.02 -0.02 0.01 -0.02 0.07 0.04
Exact-% 0.08 -0.09 -0.13 -0.08 -0.14 0.11 -0.02 0.04 0.02
Kappa 0.12 -0.16 -0.23 -0.11 -0.19 0.15 -0.05 0.06 0.01
QWK 0.06 -0.15 -0.20 -0.09 -0.12 0.05 -0.09 0.01 0.00
Pearson r 0.07 -0.14 -0.18 -0.09 -0.12 0.05 -0.06 0.02 0.03
SMSD -0.04 -0.01 0.20 0.17 0.14 0.03 0.19 0.05 0.17
F-Score 0.04 -0.40 -0.17 -0.24 -0.15 0.00 -0.17 -0.04 -0.09
SMO
Grader
(MLA2)
Exact+Adj % 0.01 -0.01 -0.01 -0.02 -0.02 0.01 -0.02 0.06 0.00
Exact-% 0.06 -0.11 -0.12 -0.08 -0.15 0.09 -0.02 0.03 0.00
Kappa 0.08 -0.21 -0.22 -0.12 -0.20 0.11 -0.08 0.04 -0.04
QWK 0.02 -0.19 -0.18 -0.10 -0.12 0.04 -0.12 -0.03 -0.19
Pearson r 0.04 -0.17 -0.17 -0.10 -0.12 0.04 -0.08 -0.02 -0.13
SMSD -0.04 -0.04 0.21 0.08 0.06 0.03 0.20 0.03 0.18
F-Score -0.07 -0.36 -0.16 -0.24 -0.15 0.03 -0.18 -0.05 -0.12
Table 14B presents the performance deltas between two-humans and AES models that
were developed using FPR. The exact agreement for MLA1 and MLA2, and the adjacent
agreement for MLA1 exceeded the performance on four essays (i.e., on essay #1, 5, 7, and 8)
whereas the adjacent agreement for MLA2 exceeded the performance on three essays (i.e., on
essay #1, 5, and 7). The kappa for MLA1 was shown to improve on four essays (i.e., on essay #1,

75
5, 7, and 8), and for MLA2 the performance was exceeded on three essays (i.e., on essay #1, 5,
and 7). The delta for has shown to improve on three essays (i.e., on essay #1, 5, and 7) for
MLA1, and on two essays (i.e., essay #1 and 5) for MLA2. The delta for was shown to improve
on four essays (i.e., on essay #1, 5, 7 and 8) for MLA1, and on two essays (i.e., on essay # 1 and
5) for MLA2. The SMSD values ranged from −0.04 on essay #1 and 2a to 0.21 on essay #2b.
The SMSD delta on essay #3 (≈ 0.17) could serve as an interesting example. Here, the
SMSDMLA1 ≈ 0.11 and SMSDhuman-human ≈ −0.05, in which the individual SMSDs are but
their relative difference is , meaning that the delta value of 0.17 is an amplification effect
of individual differences in the score distributions. The delta for F-scores ranged from -0.40 on
essay #2a to 0.04 on essay #1. As, discussed above, the F-score is the most conservative
measures and no specific guidelines exists for interpreting the F-score values.
In sum, the performance deltas on essay #1, 5, 7, and 8 were found to favor the AES
models that were developed using FPF and FPR. In general, the scoring models that were
developed using the Random Forest (MLA1) performed better that the SMO scoring models
(MLA2). Further, the scoring models that were developed using FPR had, on average, performed
better than their FPF counterpart. Next, the results of this study is compared with two state-of-
the-art AES system that had used the same dataset for the development of scoring models.
Comparison with state-of-art AES system. A recent comparative study by Shermis
(2014) presented the current state-of-the-art in AES technologies. Shermis (2014) studied eight
commercial- and one academic-AES system using the essays sample that we used for
developing the AES models of this study. From these nine state-of-the-art AES systems we

76
selected two AES systems based on their highest and lowest average exact agreement
percentages (see Table D1 in Appendix D). We used exact agreement for selection because the
objective function of this current study – during the development of FPF and FPR scoring
models– was to achieve the highest exact agreement. We named the selected vendors as
Vendor1 and Vendor2. The Vendor1 (MetaMetrics) had the lowest average exact agreement and
Vendor2 (Measurement Incorporated) had the highest average exact agreement, thus they
represent the full range of nine vendors that were presented in Shermis (2014). The purpose of
this comparison was to test the general effectiveness of the scoring models of this study and not
to single out any one vendor.
Table 15. Results of AES scoring evaluations of Commercial AES Vendor1 (MM)
Measures Essay Prompts
1 2a 2b 3 4 5 6 7 8
Exact+Adj % 0.95 0.99 0.97 0.97 0.96 0.93 0.95 0.38 0.41
Exact-% 0.31 0.55 0.55 0.63 0.47 0.47 0.51 0.07 0.08
Kappa 0.16 0.30 0.27 0.45 0.3 0.28 0.31 0.03 0.04
QWK 0.66 0.62 0.55 0.65 0.67 0.64 0.65 0.58 0.63
Pearson r 0.66 0.62 0.55 0.65 0.68 0.65 0.66 0.58 0.62
Comparison with commercial AES Vendor1. Table 15 presents the agreement
measures from Vendor1. In order to compare our results, the performance deltas (StudyResults –
Vendor1Results) between the current study and Vendor1 were computed, and presented in Table
16A and Table 16B. Table 16A presents the performance deltas between Vendor1 and AES
models that were developed using the FPF, and Table 16B presents the performance deltas
between Vendor1 and AES models that were developed using FPR. Each table presented the

77
deltas for MLA1 and MLA2,, where positive values suggests the improvement of results of the
current study relative to the results of Vendor1.
Table 16A. A Performance Deltas of this study with Commercial AES Vendor1 (StudyResults –
Vendor1Results) using Full-feature Profile (FPF)
Feature
Profiles Measures
Essay Prompts
1 2a 2b 3 4 5 6 7 8
RF
Grader
(MLA1)
Exact+Adj % 0.05 0.00 0.02 0.01 0.02 0.05 0.01 0.31 0.08
Exact-% 0.40 0.12 0.13 0.06 0.16 0.20 0.10 0.25 0.20
Kappa 0.37 0.15 0.18 0.08 0.18 0.26 0.09 0.18 0.08
QWK 0.10 0.02 0.09 0.04 0.06 0.15 0.01 0.14 -0.04
Pearson r 0.11 0.04 0.09 0.04 0.05 0.14 0.03 0.15 0.02
SMO
Grader
(MLA2)
Exact+Adj % 0.04 0.00 0.02 0.00 0.02 0.06 0.02 0.28 0.08
Exact-% 0.37 0.09 0.11 0.03 0.16 0.18 0.11 0.21 0.21
Kappa 0.31 0.09 0.15 0.03 0.17 0.23 0.11 0.14 0.09
QWK 0.05 -0.03 0.05 0.02 0.05 0.14 0.05 0.13 -0.21
Pearson r 0.07 -0.02 0.07 0.02 0.04 0.13 0.07 0.14 -0.16
Table 16A presented the performance deltas between Vendor1 and the AES models that
were developed using FPF. As shown, for both MLA1 and MLA2, the exact agreement, adjacent
agreement, and kappa has exceeded the performance on all essays. The improvement in exact
agreement ranged from 6% on essay #3 to 40% on essay #1. The delta for exceeded the
performance on all essays except on essay #8 for MLA1, and on essay #2a and 8 for MLA2. The
delta for has shown improvement on all essays for MLA1, and on seven essays (i.e., on essay #
1, 2b, 3, 4, 5, 6, and 7) for MLA2. Table 16B presents the performance deltas between Vendor1
and the AES models that were developed using FPR. As shown in Table 16B, the exact agreement

78
and adjacent agreement for MLA1 and MLA2 exceeded the performance on all essays. Similarly,
the kappa exceeded the performance on all essays for MLA1 and MLA2. The delta for
exceeded performance on all essays except for MLA1 on essay #8, and for essay #2a and 8 for
MLA2. The delta for showed an improvement on all essays for MLA1, and on all essays for MLA2
except for essay #8.
Table 16B. A Performance Deltas of this study with Commercial AES Vendor1 (StudyResults −
Vendor1Results) using Reduced-feature Profile (FPR)
Feature
Profiles Measures
Essay Prompts
1 2a 2b 3 4 5 6 7 8
RF
Grader
(MLA1)
Exact+Adj % 0.05 0.00 0.02 0.01 0.02 0.06 0.01 0.30 0.11
Exact-% 0.40 0.13 0.12 0.05 0.17 0.22 0.10 0.26 0.21
Kappa 0.38 0.16 0.16 0.07 0.19 0.28 0.10 0.20 0.10
QWK 0.11 0.03 0.06 0.04 0.06 0.16 0.03 0.16 0.00
Pearson r 0.12 0.05 0.08 0.05 0.06 0.15 0.05 0.17 0.04
SMO
Grader
(MLA2)
Exact+Adj % 0.05 0.00 0.02 0.00 0.02 0.06 0.01 0.29 0.06
Exact-% 0.39 0.11 0.12 0.05 0.16 0.19 0.09 0.25 0.20
Kappa 0.34 0.12 0.17 0.06 0.18 0.24 0.07 0.19 0.06
QWK 0.07 -0.01 0.08 0.03 0.06 0.14 0.00 0.12 -0.19
Pearson r 0.09 0.01 0.09 0.03 0.05 0.14 0.03 0.13 -0.12
In sum, the results from the current study are consistently better than the results of
Vendor1, because most (about 96%) delta values were found positive. An improvement in exact
agreement ranged from 6% on essay #3 to 40% on essay #1, adjacent agreement ranged from
1% on essay #3 and 6 to 31% on essay #7, and for it ranged from 0.02 on essay #2a to 0.15
on essay #5. This is a substantial improvement because most automated scoring system are

79
deployed in large-scale assessment situations and even small improvements could impact large
number of examinees. Next we compared the results of this study with the results of Vendor2.
Table 17. Results of AES scoring evaluations of Commercial AES Vendor2 (MI)
Measures Essay Prompts
1 2a 2b 3 4 5 6 7 8
Exact+Adj % 0.99 1.00 0.99 0.97 0.99 0.99 1.00 0.56 0.52
Exact-% 0.46 0.70 0.66 0.72 0.72 0.68 0.69 0.17 0.16
Kappa 0.33 0.51 0.46 0.59 0.6 0.56 0.55 0.12 0.10
QWK 0.82 0.72 0.70 0.75 0.82 0.83 0.81 0.84 0.73
Pearson r 0.82 0.72 0.71 0.75 0.82 0.84 0.81 0.84 0.73
Comparison with commercial AES Vendor2. Table 17 presents the agreement
measures from Vendor2, which were then compared by computing the performance deltas
between current study and Vendor2 (i.e., StudyResults – Vendor2Results). The deltas are presented in
Table 18A and Table 18B. Each table presented deltas for MLA1 and MLA2,, where positive values
suggests the performance of the scoring model exceeded from the performance of Vendor2.
Table 18A presents the performance deltas between Vendor2 and the AES models that
were developed using FPF. For MLA1, the improvement in exact agreement ranged from 2% on
essay #2b to 25% on essay#1, and for MLA2 the improvement is ranged from 11% on essay #7
to 22% on essay #1. The improvement in adjacent agreement ranged from 1% on essay #1 to
13% on essay#7 for MLA1, and 10% on essay #7 for MLA2. The improvement in kappa ranged
from .02 on essay #8 to 0.20 on essay#1 for MLA1, and for MLA2 it ranged from 0.03 on essay#8
to 0.14 on essay #1. All delta values for and did not indicate the same improvement.

80
Table 18A. A Performance Deltas of this study with Commercial AES system-2 (StudyResults −
Vendor2Results) using Full-feature Profile (FPF)
Feature
Profiles Measures
Essay Prompts
1 2a 2b 3 4 5 6 7 8
RF Grader
(MLA1)
Exact+Adj % 0.01 -0.01 0.00 0.01 -0.01 -0.01 -0.04 0.13 -0.03
Exact-% 0.25 -0.03 0.02 -0.03 -0.09 -0.01 -0.08 0.15 0.12
Kappa 0.20 -0.06 -0.01 -0.06 -0.12 -0.02 -0.15 0.09 0.02
QWK -0.06 -0.08 -0.06 -0.06 -0.09 -0.04 -0.15 -0.12 -0.14
Pearson r -0.05 -0.06 -0.07 -0.06 -0.09 -0.05 -0.12 -0.11 -0.09
SMO
Grader
(MLA2)
Exact+Adj % 0.00 -0.01 0.00 0.00 -0.01 0.00 -0.03 0.10 -0.03
Exact-% 0.22 -0.06 0.00 -0.06 -0.09 -0.03 -0.07 0.11 0.13
Kappa 0.14 -0.12 -0.04 -0.11 -0.13 -0.05 -0.13 0.05 0.03
QWK -0.11 -0.13 -0.10 -0.08 -0.10 -0.05 -0.11 -0.13 -0.31
Pearson r -0.09 -0.12 -0.09 -0.08 -0.10 -0.06 -0.08 -0.12 -0.27
Table 18B. A Performance Deltas of this study with Commercial AES system-2 (StudyResults −
Vendor2Results) using Reduced-feature Profile (FPR)
Feature
Profiles Measures
Essay Prompts
1 2a 2b 3 4 5 6 7 8
RF Grader
(MLA1)
Exact+Adj % 0.01 -0.01 0.00 0.01 -0.01 0.00 -0.04 0.12 0.00
Exact-% 0.25 -0.02 0.01 -0.04 -0.08 0.01 -0.08 0.16 0.13
Kappa 0.21 -0.05 -0.03 -0.07 -0.11 0.00 -0.14 0.11 0.04
QWK -0.05 -0.07 -0.09 -0.06 -0.09 -0.03 -0.13 -0.10 -0.10
Pearson r -0.04 -0.05 -0.09 -0.05 -0.08 -0.04 -0.10 -0.09 -0.07
SMO
Grader
(MLA2)
Exact+Adj % 0.01 -0.01 0.00 0.00 -0.01 0.00 -0.04 0.11 -0.05
Exact-% 0.24 -0.04 0.01 -0.04 -0.09 -0.02 -0.09 0.15 0.12
Kappa 0.17 -0.09 -0.02 -0.08 -0.12 -0.04 -0.17 0.10 0.00
QWK -0.09 -0.11 -0.07 -0.07 -0.09 -0.05 -0.16 -0.14 -0.29
Pearson r -0.07 -0.09 -0.07 -0.07 -0.09 -0.05 -0.12 -0.13 -0.23

81
Table 18B presents the performance deltas between Vendor2 and the AES models that
were developed using FPR. As shown in Table 18B, for MLA1 the improvement in exact
agreement ranged from 1% on essay #5 to 25% on essay#1, and for MLA2 the improvement is
ranged from 1% on essay #2b to 24% on essay #1. The improvement in adjacent agreement
ranged from 1% on essay #1 and 3 to 12% on essay#7 for MLA1, and 11% on essay #7 for MLA2.
The improvement in kappa ranged from .04 on essay #8 to 0.21 on essay#1 for MLA1, and for
MLA2 it is 0.17 on essay#1 and 0.10 on essay #7. All delta values for and were found to be
less than zero.
Figure 3. The plot of Exact+ Adjacent agreements for the scoring models.
0.00
0.10
0.20
0.30
0.40
0.50
0.60
0.70
0.80
0.90
1.00
12a
2b 34
56
78
Exa
ct +
Ad
jace
nt
Ag
reem
en
ts
H1&H2(Gold-standard)
RF-Grader using FPF
RF-Grader using FPR
SMO-Grader using FPF
SMO-Grader using FPR
AES Vendor1
AES Vendor2

82
Taken together, for Vendor2, the exact agreement deltas showed improvement on five
essays (i.e., essay #1, 2b, 5, 7, and 8) for MLA1 and on four essays (i.e., essay #1, 2b, 7, and 8) for
MLA2.. Specifically, the improvement in exact agreement ranged from 1% on essay #2b to 25%
on essay #1. Vendor2 represents the top performer in the group of commercial AES system7 and
obtaining the positive delta values on Vendor2 highlights at least two strengths pertaining to
the results of the current study. First, the feature profiles (FPF and FPR) that were used for
developing the AES models captured the most important characteristics of student-produced
essays. Second, the FPF and FPR were optimally modeled by the learning algorithms to emulate
human-scoring behavior.
Figure 4. A comparison of Exact agreements of the study.
7 See Appendix D1 for full list of AES vendors from Shermis (2014) with their exact agreement percentages.
0.00
0.10
0.20
0.30
0.40
0.50
0.60
0.70
0.80
0.90
1.00
1 2a 2b 3 4 5 6 7 8
Exa
ct A
gre
em
en
ts
RF-Grader using FPF RF-Grader using FPR
SMO-Grader using FPF SMO-Grader using FPR
H1&H2(Gold-standard) AES Vendor1
AES Vendor2
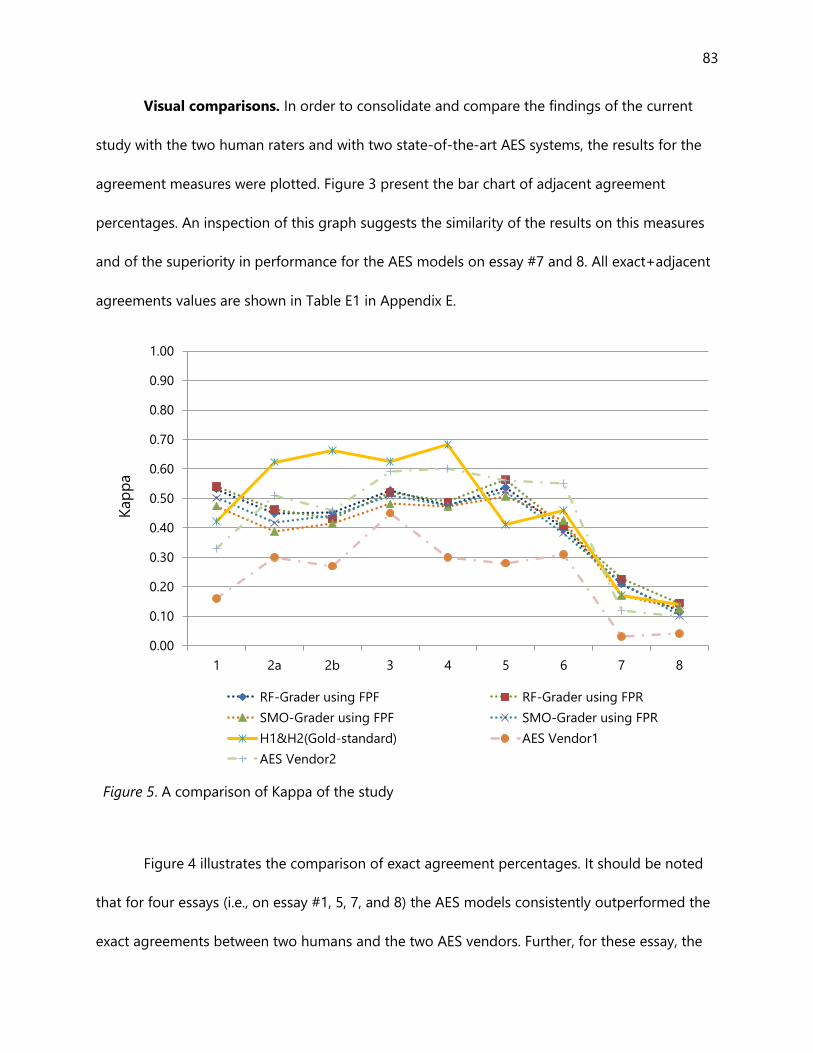
83
Visual comparisons. In order to consolidate and compare the findings of the current
study with the two human raters and with two state-of-the-art AES systems, the results for the
agreement measures were plotted. Figure 3 present the bar chart of adjacent agreement
percentages. An inspection of this graph suggests the similarity of the results on this measures
and of the superiority in performance for the AES models on essay #7 and 8. All exact+adjacent
agreements values are shown in Table E1 in Appendix E.
Figure 5. A comparison of Kappa of the study
Figure 4 illustrates the comparison of exact agreement percentages. It should be noted
that for four essays (i.e., on essay #1, 5, 7, and 8) the AES models consistently outperformed the
exact agreements between two humans and the two AES vendors. Further, for these essay, the
0.00
0.10
0.20
0.30
0.40
0.50
0.60
0.70
0.80
0.90
1.00
1 2a 2b 3 4 5 6 7 8
Kap
pa
RF-Grader using FPF RF-Grader using FPR
SMO-Grader using FPF SMO-Grader using FPR
H1&H2(Gold-standard) AES Vendor1
AES Vendor2

84
performance of the four AES models (MLA1+FPF, MLA1+FPR, MLA2+FPF, MLA2+FPR) are close to
one other. However, models that were developed using MLA2 and FPR consistently performed
better. All exact-agreements values are shown in Table E2 in Appendix E. Figure 5 shows the
comparison of kappa values. Higher performance is observed for essay #1, 5, 7 and 8. On these
essay the four scoring models as a group matched or exceeded the kappa performance of two
human raters and two AES vendors. All kappa values are shown in Table E3 in Appendix E.
Figure 6. A comparison of Quadratic weighted kappa values.
Figure 6 presented the performance on . In general, the performance on was
slightly less than two human raters, with the exception of essay #1, 5, and 7. On these essay
datasets the FPF and FPR scoring models performed better than the two human raters. It may be
0.00
0.10
0.20
0.30
0.40
0.50
0.60
0.70
0.80
0.90
1.00
1 2a 2b 3 4 5 6 7 8
Qu
ad
rati
c W
eig
hte
d K
ap
pa
RF-Grader using FPF RF-Grader using FPR
SMO-Grader using FPF SMO-Grader using FPR
H1&H2(Gold-standard) AES Vendor1
AES Vendor2

85
noted that Vendor2 performed better on essay # 1, 5, 6, 7, and 8. Similar patterns of
performance were observed using the Pearson correlation as presented in Figure 7. All and
correlation values are shown in Table E4 and E5 in Appendix E, respectively.
Figure 7. A comparison of Pearson correlation values.
Section Four: Chapter Summary
For each essay prompt, the scoring models were developed using two feature profiles
(FPF and FPR) and two machine learning approaches (MLA1 and MLA2), thereby producing four
scoring models (i.e., MLA1+FPF, MLA1+FPR, MLA2+FPF, MLA2+FPR) that were developed and
compared. We also compared our results with the agreement of two human raters, and with two
state-of-the-art AES systems which represent the full range of major AES vendors (Shermis,
0.00
0.10
0.20
0.30
0.40
0.50
0.60
0.70
0.80
0.90
1.00
1 2a 2b 3 4 5 6 7 8
Pears
on
r
RF-Grader using FPF RF-Grader using FPR
SMO-Grader using FPF SMO-Grader using FPR
H1&H2(Gold-standard) AES Vendor1
AES Vendor2

86
2014a). Exact agreement percentage is the most common measure for reporting and
understanding the strength of AES systems. In this study, the same measure was used as an
objective function during the development of the score prediction models. Hence, we have used
the same measure to summarize the findings from this study.
Table 19. Performance Summary of this study in relation to AES Vendors and two human raters
Reference
Point Scoring Model
Essay Prompts Superior
1 2a 2b 3 4 5 6 7 8
AES
Vendor1
MLA1 Grader using FPF 100%
MLA2 Grader using FPF 100%
MLA1 Grader using FPR 100%
MLA2 Grader using FPR 100%
AES
Vendor2
MLA1 Grader using FPF
44%
MLA2 Grader using FPF
44%
MLA1 Grader using FPR
56%
MLA2 Grader using FPR 44%
Human1
and
Human2
(Gold Standard)
AES Vendor-1
0%
AES Vendor-2 33%
MLA1 Grader using FPF
44%
MLA2 Grader using FPF
33%
MLA1 Grader using FPR
44%
MLA2 Grader using FPR 44%
Table 19 summarize the findings of this study as a function of improvement in
agreement in the scoring models, relative to the performance of two AES vendors and two
human raters. The tick-mark in each cell represents the performance of the scoring model when
it exceeded the Reference Point (i.e., Vendor1, Vendor2, and Human1 and Human2). The right
most column summarizes the percentage of exceeded performances shown by the scoring
model across the studied essay prompts. For example, the MLA1 (Random Forest) scoring

87
models that were based on FPR exceeded the performance on exact agreement on all essays
(Superior=100%) when compared to the scoring performance of Vendor1.
The scoring models that were based on reduced-feature profile had consistently
matched or exceeded the performance of full-feature profile meaning that the dimensionality
reduction improved the predictive power of scoring models. Further the scoring models that
were based on Random Forest (MLA1) performed better when combined with the reduced-
feature profiles. However, the nine feature categories had varying degree of features
informativeness across essay types meaning that feature retention is not only depend on the
essay text but also on the characteristics of the essays such as essay-type, scoring rubric, and the
grade-level of essay writes. Explanation beyond essay text were not evaluated as part of this
study.
By way of summary, as shown in Table 19, the scoring models of the current study
outperformed the scoring performance of the AES Vendor1 across all essay prompts. The
scoring models that were based on MLA1 and FPR outperformed the current top performing AES
system on 5 out of 9 essays (56%) and were found to be superior on 4 out of the 9 essays (44%)
on other three scoring models. The bottom portion of Table 19 represents the comparison of
the study results relative to the gold standard in automated scoring, where the agreements are
compared against the performances of two human raters. Here, the AES Vendor1 was unable to
beat the agreement between two humans on all essay prompts (Superior=0%), whereas
Vendor2 was to be found superior on 3 out of 9 essays (Superior=33%). For the results of
current study, three out of four scoring models exceeded the exact agreement rates between

88
two human raters on 4 out of 9 essays (Superior=44%). The only low performing AES
configuration of this study was MLA2 Grader (SMO) that were based on FPF, that exceeded the
performance on 3 out of 9 essays (Superior=33%). Thus, the overall poorest performing scoring
models of the current study is at least as good as the top performer of current state-of-the-art
in AES scoring. The next chapter presented a discussion and the conclusion of this research.

89
Chapter Five: Discussion and Conclusion
Advances in computational linguistics and machine learning techniques are now shaping
the ways in which the language can be assessed in the educational context. Many large-scale
educational assessments in the United States, and elsewhere, are now moving towards the
adoption of AES methods – due to its multitude of benefits – for evaluating the content on
essays and for generating diagnostic feedback. While the holistic score summarizes the quality
of essay content using a single numerical score, the diagnostic feedback provides a set of
numerical scores on specific aspects of writing quality such as organization, focus, mechanics,
development, and uniformity of vocabulary. As a result, the development and validation of AES
system has become a central topic in the educational assessment.
The development of an AES system depends on the transformation of text as numerical
proxies (i.e., feature scores) for essay quality. These scores can be computed using shallow- or
deep-feature extraction methods. Shallow-features extraction involves analyzing text by
counting simple surface-level characteristics of text, such as sentence length and word count,
thereby limiting their empirical foundations. Even though shallow-feature extraction methods
have some albeit limited empirical support, they are still widely used for the development of AES
systems because they often highly correlated with human scores. Alternatively, methods in
deep-feature extraction are based on theoretical and empirical foundations from the fields of
discourse processing, corpus linguistics, psycholinguistics, cognitive sciences, and computational
linguistics. Hence, the AES system, which is developed using deep-features of language, is
empirically driven and can systematically associate proxies to the number of higher-order

90
associations of essay quality (e.g., easability, narrativity, stylistic, text coherence) that can be
used for holistic scoring and for producing diagnostic feedback.
Using the deep-features for the development of AES system ensures that the proxies
have reliably captured the content of the essay and the construct of interest (i.e., the writing
quality). However, not all extracted features are informative and the matrix of feature profile can
be filtered for the noisy and less-informative features. The reduced-features profile can then be
ranked according to the feature category and studied for the proportion of features that are
valuable for score prediction. Hence, the most informative features are retained and used for the
development of AES framework. Taken together, extraction of the best features is desirable
because they are highly predictive of writing quality, and they ensure that the machine predicted
scores reflects at least the same degree of reliability when compared with the scoring conducted
by pair of human raters.
Currently, the functional details of operational AES systems – deployed in large-scale
testing situations – has been poorly described in order to maintain strategic edge in the market
of AES scoring software. Therefore, the AES literature lacks many details about how the features
are extracted, weighted, and combined in the state-of-the-art AES systems. As a result, the
credibility of machine scoring system is criticized and the stakeholders (e.g., essay writers, and
their teachers) are often uncertain of the text features that a computer is assessing and how
these features are combined while calculating their essays scores. As a result, it is become
difficult to identify the features of the written response which has the highest effect on the
machine predicted scores, and how those text features changes overtime in determining the

91
differential performance of the essays writers (Chung & Baker, 2003; Bennett & Zhang, 2016;
Reckase, 2016).
As the development of AES systems continues to progress, the need to transparently
present the underlying feature extraction and machine learning methods becomes even more
pressing. To date, most AES systems are studied under proprietary control and the functional
information about many AES systems is lacking from the literature, which obstructs the
acceptance and progress of AES research in many ways (Bennett & Zhang, 2016; Elliot &
Klobucar, 2013; Shermis & Morgan, 2016; Wilson & Andrada, 2016). Although, some commercial
vendors (e.g., ETS, Vintage Learning) has provided a general description of their AES systems,
the current AES literature contains an incomplete account of the rationale, computational basis,
and mechanism for extracting and modeling the features of written language.
Therefore, the purpose of this study was to develop and validate a three-stage AES
framework by extracting and integrating the deep features of English language. In the first
stage, nine different feature categories from the computational linguistics environment of Coh-
Metrix were evaluated under two configurations – full-feature profile (FPF) and reduced-feature
profile (FPR) – for the development of AES framework. The contribution of each of the nine
different feature-categories were assessed and the relative informedness (i.e., the proportion of
features that were valuable for score prediction) of FPR were evaluated. In the second stage, two
distinct machine learning algorithms, which differs in their class boundary determination, were
trained and tuned for optimally weighting and combining the features for score prediction. In

92
the third stage, the performance of score prediction models were evaluated using the validation
criteria from AES literature.
This chapter is organized into four section. In the first section, the purpose of the study,
research questions and an overview of the methods used to answer the research questions are
provided. In the second section, a summary of the results of the study organized by research
question is presented. In the third section, the limitations of this study are discussed. In the
fourth section, some future directions for research are outlined.
Restatement of Research Questions and Summary of Methods
The primary purpose of this study was to develop and validate a transparent essay
scoring framework using deep features of English language. Then, using this AES framework, to
evaluate its effectiveness using large datasets of real essays from evenly distributed male and
female writers across diverse ethnic groups. These essays were collected as part of standardized
tests at three different grade levels, 7, 8 and 10. This study was conducted using the methods
and processes in data science, however, the foundational methodology comes from the area of
machine learning and natural language processing.
Four research questions were addressed in this study:
1) To what extent are the deep language features effective for the development of
automated scoring framework? How does its performance concord with two human raters? Is
there a systematic pattern in scoring discrepancy?
93
2) What proportion of features can be reliably integrated without compromising the
validity of prediction? Which features are most informative? How does the dimensionality
reduction affect the score predictability?
3) To what extend do the two machine learning methods differ in their scoring
performance? Does the essay-type affect their performance? Which learning method is better?
4) Given the answers to questions 1, 2 and 3, how does the performance of the
scoring framework relate to the current gold-standard? How does it relate to the current state-
of-the-art?
To answer these research questions, an analytical approach was used to develop and
validate the essay scoring framework using statistical and machine learning techniques. Next, I
will summarize the methods used in the study.
Publically available anonymized dataset was used (Kaggle, 2012; Shermis & Morgan,
2016), which had essays samples for nine essays prompts across three grade-levels. This study
made use of training datasets, and partitioned the 60% essays samples for the development and
evaluation of scoring models, and remaining 40% essays samples as unseen essays for validating
the developed scoring models. In order to logically isolate the complexity of scoring software, a
three-stage method was adopted for the development and validation of the AES framework. In
the first stage, the text features from the essays samples were extracted. In the second stage, the
extracted features were used for the development of scoring model. In the third stage, the
developed scoring model from Stage 2 was used for score classification and validation analysis
using unseen essay samples.

94
Six software programs and packages were used for operationalizing the three-stage
scoring framework. In the first stage, Python libraries, Visual Basic macros, Coh-Metrix, and Weka
were used for data pre-processing, scripting, feature extraction, and feature reduction. In the
second stage, the Weka implementation of two supervised machine learning algorithms (MLAs),
namely random forest and sequential minimum optimization, were used for the development
and evaluation of scoring models. In the third stage, R packages, Python libraries, and Microsoft
Excel were used for computing the validity coefficients and generating the graphs.
To begin, the electronic essay-text was analyzed using Coh-Metrix and 110 different
features were extracted. For each essay, the extracted feature profile was used in two different
configurations. First, the full-feature profile (FPF) with 110 features was used for the
development of score prediction model. Second, two tree-based dimensionality reduction
methods (i.e., gain-ratio and information-gain using ranker-search algorithm) were employed
for reducing the FPF by selecting the most informative features, which resulted in a reduced
feature-profile (FPR). The less-informative features were removed such that the AES framework
does not lose the precision of score prediction. In sum, for each of the nine essay prompts, two
distinct feature profiles were developed, one that had the full set of 110 features and other set
which had the reduced features.
Next, the scoring models were developed and evaluated using two supervised MLAs,
namely random forest (MLA1) and sequential minimum optimization (MLA2). Both MLAs take a
distinct approach for learning and selecting the classification boundary. The MLA1 takes the

95
information gain approach and MLA2 takes geometric approach8. Both MLAs are preferred for
statistical learning and text classification tasks (Lomax & Vadera, 2013; Witten, Frank, & Hall,
2011, p. 376; Wu et al., 2008) and were also the top performers in a recent automated scoring
study (Chen, Fife, Bejar, & Rupp, 2016). For each essay prompt, four prompt-specific scoring
models were developed by pairing MLA1 with FPF and FPR, and MLA2 with FPF and FPR. Hence, for
nine essays prompts, 36 prompt-specific scoring models were developed, four for each essay
prompt. These prompt-specific models were then validated by scoring the corresponding
unseen essay samples.
Finally, the accuracy of scoring models was validated using agreement and distributional
measures that are standard in the field of machine learning and automated essay evaluation.
Specifically, the scoring performance was evaluated on eight measures, six agreement measures
and two distributional measures. The absolute and directional score-point discrepancy analysis
is what distinguishes this study from the other AES studies. In addition, the degree of difference
(i.e., delta) between corresponding validity coefficients of machine-human and human-human
measures was also computed and contrasted. Further, as part of this evaluation, the validity
coefficients were also compared against the criteria values suggested in the automated scoring
literature.
Summary of Results
The primary purpose of this study was to develop the automated scoring framework by
integrating the deep features of English language. A second purpose of this study was to
evaluate the effectiveness of the scoring framework by using real essay samples that were
8 For sequential minimum optimization, the polynomial kernel was used as kernel transformation function.

96
collected in standardized testing situation. Specifically, this study answered four research
questions:
Research question 1: To what extent are the deep language features effective for
the development of automated scoring framework? How does its performance concord
with two human raters? Is there a systematic pattern in scoring discrepancy? Feature
extraction, being the first stage in the machine scoring, is the most important aspect which
determine the overall effectiveness of automated scoring process. In this study, the effectiveness
of machine scoring framework is to determine by its concordance with the human raters. The
findings from this study clearly indicate that the scoring framework developed using Coh-Metrix
features performed well in producing comparable scores distributions. Most SMSD
(standardized mean score difference) were within the 0.15 of the resolved human scores, with
the exception of essay #6 where the SMSD value was off by 0.06 from the criterion. As expected,
large deviation was observed for essay #8 because the rubric score range was large.
The exact agreement between machine-human was also improved – in the range of 2%
to 12%, for essay #1, 5, 6, 7, and 8 – when compared with the pattern of exact agreement
between human-human. This outcome means that for these essays the machine agrees more
with a human than two humans agree with themselves. A similar pattern was observed for kappa
measure which was corrected for chance agreement between two human raters. On other
essays, overall, the pattern of exact agreement of machine-human was only slightly lower than
the human-human. On the measure of adjacent agreements, the performance of machine-
human was almost identical to the scoring of two human raters.

97
The performance on quadratic-weighted kappa ( ) had matched or exceeded the
performance on most essay prompts, when compared with two human raters. This measure
assesses the ordinal severity of departure on the score scale, the higher the scoring departure
the lesser the value of . The kappa for essay #2a, 2b, and 3 was only slightly off the criterion
( ), and the values for all other essays matched or exceeded the criterion. The lower
value for essay #8 ( ) was also comparable, because in this case the value of machine-
human is identical to the value of two human raters. In other words, the gold-standard
criterion for essay #8 was . The same pattern was observed for the calculation of the
Pearson correlation which represents the inter-class correlation.
The score-point discrepancy analysis was conducted to assess the pattern and direction
of discrepancy in the scoring models and how it relates to the discrepancy between two human
raters. Apart from essay #7 and 8, all essays had either no discrepancy beyond two score-points
or had less than 1% essays which differs beyond two score-points. That is, the pattern of
discrepancy is comparable between machine-human and human-human.
The directional score-point analysis ( ) suggested that the
comparability between machine-human and human-human for all essays, except for essay #7
and 8. The pattern of directional-discrepancy of machine scoring – relative to two human raters
– suggest the severe scoring for essay #7, and lenient scoring for essay #8. This finding is
consistent with the performance of commercial AES systems (see Table D2 in Appendix D). The
patterns of absolute-discrepancy in essay #7 and 8 are also interesting to note. For essay #7,
there were about 26% discrepancy between two humans and about 18% between machine-

98
humans at three score-points. Similarly, for essay #8, there were about 46% discrepant essays
between two humans and about 36% between machine-humans at three score-points meaning
that the machine scoring is at least 10% more consistent than two human-raters.
These finding clearly shows that the performance of scoring models concord with the
resolve human scores, which suggest the value and effectiveness of Coh-Metrix features for the
development of automated scoring framework. These evidence of concordance also confirms
that the scoring models were assessing the writing construct (Keith, 2003) meaning that the
features which were used for the development of scoring models had reliably captured the
quality of writing construct. In general, the performance deltas also matched or exceeded the
performance of two human raters, and no systematic pattern of discrepancy was found in the
machine scoring.
Research question 2: What proportion of features can be reliably integrated
without compromising the validity of prediction? Which features are most informative?
How does the dimensionality reduction affect the score predictability? Overall, 67% of Coh-
Metrix features were informative and reliably integrated into the automated scoring framework.
Specifically, the set of informative features (i.e., an implicit set of features that can represent the
original features, without losing the precision of prediction) ranged from 58% on essay #1 to
76% on essay #7. Of the two dimensionality reduction techniques, the Information Gain has
shown better results in identifying the optimal subset of Coh-Metrix features.
The utility of features was further analyzed by ranking their categories according to the
proportion of informative features (i.e., informedness). Among the nine feature-categories, the

99
features which belong to Referential Cohesion and Lexical Diversity were utilized fully in the
scoring models, followed by – in order of their informedness –, Latent Semantic Analysis, Text
Descriptives, Text Easability, Situation Model, Syntactic Complexity and Pattern Density,
Connectives, and Word Information. Being fourth in order, the Text Descriptives had about 70%
informative features, which highlight the importance of descriptive features. The Word
Information was the least informative with about 47% informative features.
The pattern of feature reduction at the essay prompt level suggested that the feature
categories had varying degree of features informedness across essay types. For example, for
essay # 8, the feature retention rate for Situation Model, Syntactic Complexity and Pattern
Density, and Connectives ranged between 20% to 33%, which suggests the lesser proportion of
worthy features, in these feature-categories, for this narrative essay prompt. Conversely, for
essay #7, for same feature-categories features informedness ranged between 67% to 87%, which
suggests the higher proportion of worthy features in these feature categories for this expository
essay prompt. Similarly, for Text Easability, 90% features were informative for essay #7, whereas
only 42% features were informative for essay #5. These findings suggest that identifying the
optimal subset of features is dependent on various characteristics within the essay, such as
essay-type, grade-level of essay writers, and scoring rubric. Explanations beyond the text were
not assessed as part of this study.
The use of reduced features consistently improved the score predictability. Two
measures are described here, the exact agreement and the . On average, the exact agreement
was improved by 2%, and the improvement was ranged from 1% on essay #2b and 4 to 5% on

100
essay #7. The improvement on ranged from one-unit (0.01) on essay #2b and 4 to twenty
one-units (0.21) on essay #8. This result indicates that the feature-profiles which were used for
the development of scoring models represents the optimal subset of features, and the score
predictability was improved when 33% (i.e., 67% informative-features) of the extraneous features
were removed.
Research question 3: To what extend do the two machine learning methods differ
in their scoring performance? Does the essay-type affect their performance? Which
learning method is better? On average, the scoring models developed using Random Forest
(MLA1) performed better than the Sequential Minimum Optimization (MLA2). Their performance
was assessed using two measures, exact-agreement and the . On average, the exact-
agreement of MLA1 exceeded, by about 2% from MLA2, when FPF was used as the features
profile, and by 1% when FPR was used as feature profile. In other words, after aggregation, the
MLA1 scoring models out performed MLA2 scoring models by about 1.5%. The performance
difference between MLA1 and MLA2 scoring models was magnified for persuasive essays (essay
#1 and 2a), and expository essay (essay #7). For these essays prompts, the exact-agreement of
MLA1 scoring models exceeded, by about 3.5% (2.5%), from MLA2 when FPF (FPR) were used as
the features profile. On the measure of , a similar pattern of improvement was observed on all
essays prompts. Except for essay #8, for which the for MLA1 scoring model had improvement
by about 0.16 (0.19) when FPF (FPR) was used as the features profile. These findings suggested
that the performance difference among learning algorithms are not merely linear, and factors
such as essay-type, proficiency and grade level of essay writers may affects the score prediction.

101
The results from this study indicate that Random Forests (RF) is promising machine
learning algorithm compared to the Sequential Minimum Optimization. Its superiority may be
attributed to the fact that the RF algorithm builds a large collection of uncorrelated (random)
decision trees and then ensemble the ranking of these random trees for meta-learning. That is,
the algorithm makes multiple score prediction (i.e., the output from multiple decision trees) and
combines them to produce one score prediction. These findings are consistent with outcomes
reported in the machine learning literature (Bunch, Vaughn, & Miel, 2016; Rokach, 2010), which
shows that building the prediction model using meta-learning has consistently outperformed
individual score prediction models.
Research question 4: Given the answers to questions 1, 2 and 3, how does the
performance of the scoring framework relate to the current gold-standard? How does it
relate to the current state-of-the-art? In general, the scoring models of this study have
matched or exceeded the exact-agreement between two human raters (i.e., gold-standard).
Specifically, the performance of scoring models on five out of nine essay prompts (56%)
matched or exceeded the gold-standard, and the improvement in exact agreement ranged from
2% on essay #8 to 12% on essay #5. By comparison, the performance of scoring models on four
out of nine essay prompts (44%) were less than the gold-standard of exact agreements, as the
deviation ranged from 7% on essay #3 to 14% on essay #4.
The scoring performance from this study was also compared against two AES vendors
(i.e., state-of-the-art), as reported in Shermis (2014). The exact-agreement was used as a
selection criterion because – during the development of scoring models– the objective function
102
of this study was to achieve the highest exact agreement. The Vendor1 (MetaMetrics) had the
lowest average exact agreement and Vendor2 (Measurement Incorporated) had the highest
average exact agreement, thus they represent the full range of studied AES vendors (Shermis,
2014a; Shermis & Hamner, 2013). The rationale for this comparison was to check the general
effectiveness of the scoring models and not to single out any one vendor.
The models used in the current study consistently outperformed the models used by
Vendor1 and Vendor2 using exact agreement as the outcome variable. Specifically, the exact
agreement performance on all nine essay prompts (100%) exceeded the performance of
Vendor1 , as the improvement in exact agreement ranged from 6% on essay #3 to 40% on essay
#1. By comparison, the performance of scoring models of this study exceeded the exact
agreement of Vendor2 on five out of nine essay prompts (56%), as the improvement in exact
agreement ranged from 2% on essay #2b to 25% on essay #1. Moreover, on four out of nine
essay prompts (44%), the study’s exact agreement performance was less than the Vendor2’s
exact agreements, and the deviation in exact agreement ranged from 2% on essay #2a to 8% on
essay #4.
In sum, the scoring models used in this study exceeded the gold-standard on four out of
nine essays (Superior=44%). By comparison, the scoring models of Vendor1 was unable to beat
the exact agreement in gold standard on any essays (Superior=0%), whereas Vendor2 were
found superior on three out of nine essays (Superior=33%). Hence, among the 36 prompt-
specific scoring models of this study, the overall least performing scoring model is as good as
the studied state-of-the-art in automated scoring. Although the differences were small, it is

103
important to remember that the automated scoring is used in large-scale settings, and even a
small improvement in the exact agreement between machine and human can save valuable
scoring time and resources.
Limitations
There are at least three limitations of this study. First, the publically available essay
samples differ from the samples that were used for the Vendor competition. The publically
available essays-samples were modified9 by an anonymization process which removed and
replaced the words and references to locations, persons, and other specifics information with
the symbolic-tokens. As a result, when the grammatical structures and semantic relationships of
text are modified and the content words were substituted with meaningless symbolic-tokens
then the originality of language is lost. This change may have potentially affected the
effectiveness of various feature extraction algorithms in Coh-Metrix that extracts the features
related to the deeper aspect of writing quality. Further, six out of nine essays dataset were
transcribed from scanned image into electronic format by human transcriber so that they can be
used for automated scoring process. This transformation may have resulted in transcription
errors (e.g., missing phrase-break, sentence-break, etc.) and as result limits the information
represented by feature scores.
Second, the feature extraction libraries of Coh-Metrix are not public and access to
computational environment of Coh-Metrix is through system coordinators. The text data must
first be forwarded to the system coordinator, in a prescribed format with meta-data, and then
the feature vector is returned after a few days of processing, depending upon the size and
9 To safeguard the identification of an individual essay writer.

104
complexity of the original data. In this regards, the software subsystems of Coh-Metrix are not
directly available to the research community meaning that the underlying feature extraction
libraries and methods are not available for investigation and the degree of errors associated
with various features is unknown. For example, since most deep features of Coh-Metrix are
based on corpus linguistics (i.e., a manifestation of real-life use of language) and limited
accessibility means that the opportunity to study the (good vs. bad) fit between corpus and
student essays is lost. In other words, from a data science perspective, one has to assume that
the corpus which have been used for the extraction of features is ideal to represent the
language of essays. This aspect of the current study is also problematic from the linguistic
perspective because the corpus are recorded and developed at a specific time and might have
become obsolete for some senses of words and phrases. Furthermore, the error rates of various
taggers (i.e., a software which identify and mark elements of language in a given text) that are
used for stylistics and grammatical analysis are not known.
Third, this study adapted a data science approach10 for the development and validation
of scoring models meaning that a pure data-driven approach was employed to raise the
statistical measures. Then, the scoring models were validated based on the criteria-related
validity evidence (i.e., concordance between predicted scores and human scores). However, the
other sense of validity, the construct validity, was not accessed as part of this study because the
scoring models do not exactly assess the construct as would a human rater. For example, the
human can quickly recognize whether or not the essay response corresponds to the intended
10
Meaning that several machine learning methods were ensemble to model the human scoring behavior,
where the overall emphasis was to achieve the higher degree of concordance with human judges.

105
competencies and construct of the assessment whereas the AES framework of this study cannot
differentiate between the essay responses that are written under bad faith from the responses
which are representative of construct being assessed. Thus, this study lacks the construct-related
evidence of validity. In sum, the evaluation of the scoring models of this study was restricted to
criteria-related validity (i.e., concordance with human scores) and the scoring framework was not
evaluated on a broader range of evaluation as proposed in the AES literature, which limits the
generalization of results from this study.
Directions of Future Research
There are at least three directions for future research. First, future studies should focus
on generating the diagnostic feedback on various aspects of writing quality, such as
organization, focus, mechanics, development, and uniformity of vocabulary. This task will involve
empirically combining and evaluating content and language-development features of Coh-
Metrix so that they can efficiently represent the strengths and areas of improvement of the
student-produced essay. For example, various principal component scores (e.g., Syntactic
Simplicity and Narrativity) can be used to examine the easability profile of essay response and
when, for example, the essay text is low on Syntactic Simplicity then student’s reading ability
should be closely monitored because text contains unfamiliar syntactic structures, and if the
essay text is low on Narrativity then student may need help with prior subject knowledge
associated with the assigned writing task because text lacks the evidence of world knowledge.
When the essay text is low on both (Syntactic Simplicity and Narrativity) then the instructor
should investigate whether the student’s world knowledge and reading ability are sufficient to
handle the essay task. Generating understandable feedback is not only useful for language

106
instruction and student autonomy but also challenging in terms of its integration in the
classroom environment.
Second, future studies should look at the potential to incorporate the advisory
mechanism for identifying the aberrant essays. These essays may either be written under bad-
faith to cheat the automated scoring system, or could be the artifact of exceptional writing
abilities which is off from the general essay writing norms. The bad-faith essays can get a good
score from the scoring models of this study because such essays usually contain repetition of
pre-memorized creative text (i.e., highly cohesive and metaphorically diverse text) which is often
off-topic. Essays that are exceptional pieces of writing and reflect the genuine prose can also be
disadvantage because their features are not sufficiently observed during supervised machine
training. Thus, an avenue of research can be to investigate how to utilize various features of
Coh-Metrix for developing the advisory mechanism that can pre-screen such essays, so that they
can be judged by human rater. For example, one line of inquiry can be to study various
proportion of vocabulary use in essays text, such as: proportion of rare discourse structure,
proportion of ill-defined part-of-speech tags, and proportion of grammatical errors given the
length of the essays. Addition of advisory mechanism will also enhance the content-related
validity of the automated scoring system.
Third, the RF and SMO were also found promising over regression based MLA in a recent
AES study of commercial system (Chen, Fife, Bejar, & Rupp, 2016). Given their performance,
robustness to classification and capability of handling linear and non-linear features, future
studies should ensemble these methods into a single model such that the holistic scores are

107
predicted based on the outcomes from the ensemble scoring model. More specifically, both RF
and SMO learning algorithms should be combined using three common ensemble schemes
(e.g., bagging, boosting, and stacking) and their predictive strengths and weaknesses may be
assessed. In so doing, more than one MLA will be involved in the predictive process which may
enhance the diversity of machine learning and, as a result, potentially increase the predictive
power over a single scoring model.
Conclusion
Most large-scale assessments require that written responses be included as a
fundamental component of the assessment task. As a result, AES has become an important topic
for the assessments of 21st century skills. Coh-Metrix provides deep features of language that
can be used to serve scoring and pedagogical objectives of language assessment. The central
objective of this study was to evaluate the merit of these features for machine scoring. The
results suggest that the potential benefits of using these features for the development of
scoring system are high. There also lies an implicit assumption that machine scores have limited
construct validity because the automated scoring system does not actually read the essays, and
the validation of AES systems essentially rests on how well the human raters are modeled.
However, efficiency of machine scoring depends on how well the essays text is transformed into
feature scores. Hence, more inter-disciplinary efforts are needed to define and extract the
features that can serve both scoring and pedagogical objectives.

108
References
Alpaydin, E. (2014). Introduction to machine learning. Cambridge, Massachusetts: The MIT Press.
Attali, Y. (2013). Validity and Reliability of Automated Essay Scoring. In M.D. Shermis & J.C.
Burstein (Eds.), Handbook of Automated Essay Evaluation: current application and new
directions (pp. 181-198). New York: Psychology Press.
Attali, Y., & Burstein, J. (2006). Automated essay scoring with e-rater® V. 2. The Journal of
Technology, Learning and Assessment, 4(3).
Baayen, R. H., Piepenbrock, R., & Gulikers, L. (1995). The CELEX lexical database Philadelphia:
University of Pennsylvania. Linguistic Data Consortium.
Baker, E. L., & O‘Neil, H. F., Jr. (1996). Performance assessment and equity. In M. B. Kane & R.
Mitchell (Eds.), Implementing performance assessment. Promises, problems, and challenges
(pp.183-199). Mahwah, NJ:Erlbaum.
Beck, I. L., McKeown, M. G., & Kucan, L. (2013). Bringing words to life: Robust vocabulary
instruction. Guilford Press
Bennett, R. E., & Zhang, M. (2016). Validity and Automated Scoring. In F. Drasgow (Ed.),
Technology and Testing: Improving Educational and Psychological Measurement (pp. 142-
173). New York: Routledge.
Berry, M., & Browne, M. (2005). Understanding search engines: Mathematical modeling and text
retrieval (2nd ed.). Philadelphia, PA: SIAM, Society for Industrial and Applied Mathematics.
Berry, M. W., Dumais, S. T., & O'Brien, G. W. (1995). Using linear algebra for intelligent
information retrieval. SIAM review, 37(4), 573-595.
Berry, M. W., & Fierro, R. D. (1996). Low-rank orthogonal decompositions for information
retrieval applications. Numerical linear algebra with applications,3(4), 301-327.
Brew, C., & Leacock, C. (2013). Automated Short Answer Scoring. In M.D. Shermis& J.C. Burstein
(Eds.), Handbook of Automated Essay Evaluation: current application and new directions
(pp. 136-152). New York: Psychology Press.
Bunch, M. B., Vaughn, D., & Miel, S. (2016). Automated Scoring in Assessment Systems. In Y.
Rosen, S. Ferrara, & M. Mosharraf (Eds.), Handbook of Research on Technology Tools for
Real-World Skill Development (pp. 611-626). Hershey, PA: Information Science Reference,
an imprint of IGI Global.

109
Burstein, J. (2003). The E-rater Scoring Engine: Automated Essay Scoring with natural language
processing. In M.D. Shermis & J.C. Burstein (Eds.), Automated essay scoring: a cross-
disciplinary perspective (pp. 113-121). Mahwah, New Jersey: Lawrence Erlbaum associates,
Inc..
Burstein, J. (2009). Opportunities for natural language processing research in education.
In Computational Linguistics and Intelligent Text Processing (pp. 6-27). Springer Berlin
Heidelberg.
Burstein, J., & Chodorow, M. (2010). Progress and New Directions in Technology for Automated
Essay Evaluation. In R. B. Kapalan (Ed.), The Oxford Handbooks of Applied Linguistics (pp.
529-538). http://dx.doi.org/10.1093/oxfordhb/9780195384253.013.0036
Burstein, J., Kukich, K., Wolff, S., Lu, C., & Chodorow, M. (2001). Enriching Automated Essay
Scoring Using Discourse Marking.
Burstein, J., & Marcu, D. (2003). Automated Evaluation of Discourse Structure in Student Essays.
In M.D. Shermis & J.C. Burstein (Eds.), Automated Essay Scoring: A Cross Disciplinary
Perspective (pp. 209-229). Mahwah, NJ: Lawrence Erlbaum Associates.
Burstein, J., Tetreault, J., Chodorow, M., Blanchard, D., & Andreyeu, S. (2013). Automated
Evaluation of Discourse Coherence Quality in Essay Writing. In M.D. Shermis & J.C.
Burstein (Eds.), Handbook of Automated Essay Evaluation: current application and new
directions (pp. 267-280). New York: Psychology Press.
Burstein, J., Tetreault, J., & Madnani, N. (2013). The E-Rater Automated Essay Scoring System. In
M.D. Shermis & J.C. Burstein (Eds.), Handbook of Automated Essay Evaluation: current
application and new directions (pp. 55-67). New York: Psychology Press.
Campbell, R. S., & Pennebaker, J. W. (2003). The secret life of pronouns flexibility in writing style
and physical health. Psychological science, 14(1), 60-65.
Charniak, E. (2000, April). A maximum-entropy-inspired parser. In Proceedings of the 1st North
American chapter of the Association for Computational Linguistics conference (pp. 132-139).
Association for Computational Linguistics.
Chen, J., Fife, J. H., Bejar, I. I., & Rupp, A. A. (2016). Building e‐rater® Scoring Models Using
Machine Learning Methods. ETS Research Report Series.
Chen, M., & Zechner, K. (2011). Computing and evaluating syntactic complexity features for
automated scoring of spontaneous non-native speech. In Proceedings of the 49th Annual

110
Meeting of the Association for Computational Linguistics: Human Language Technologies-
Volume 1 (pp. 722-731). Association for Computational Linguistics.
Chung, G. K., & Baker, E. L. (2003). Issues in the Reliability and Validity of automated Scoring of
Constructed Responses. In M.D. Shermis & J.C. Burstein (Eds.), Automated essay scoring: a
cross-disciplinary perspective (pp. 23-40). Mahwah, New Jersey: Lawrence Erlbaum
associates, Inc..
Chung, G. K., & O'Neil Jr, H. F. (1997). Methodological Approaches to Online Scoring of Essays.
Costa, K., Ribeiro, P., Camargo, A., Rossi, V., Martins, H., Neves, M., ... & Papa, J. P. (2013,
August). Comparison of the techniques decision tree and MLP for data mining in SPAMs
detection to computer networks. In Innovative Computing Technology (INTECH), 2013 Third
International Conference on (pp. 344-348). IEEE.
Cotos, E. (2014). Genre-based Automated Writing Evaluation for L2 Research Writing: From Design
to Evaluation and Enhancement. Palgrave Macmillan.
Crossley, S. A., Greenfield, J., & McNamara, D. S. (2008). Assessing text readability using
cognitively based indices. Tesol Quarterly, 42(3), 475-493.
Crowhurst, M. (1983). Syntactic complexity and writing quality: A review. Canadian Journal of
Education/Revue canadienne de l'education, 1-16.
CTB/McGraw-Hill. (2013). Smarter Balanced Assessment Consortium: Field Test Item and Task
Writing/Pilot and Field Test Scoring technical report [SBAC RFP No. 16/17]. Retrieved from
website of The State of Washington – OSPI: http://www.k12.wa.us/RFP/pubdocs/SBAC16-
17/CTBSBAC16-17Proposal.pdf
De, A., & Kopparapu, S. K. (2011, September). An unsupervised approach to automated selection
of good essays. In Recent Advances in Intelligent Computational Systems (RAICS), 2011
IEEE (pp. 662-666). IEEE.
Deerwester, S. C., Dumais, S. T., Landauer, T. K., Furnas, G. W., & Harshman, R. A. (1990). Indexing
by latent semantic analysis. JAsIs, 41(6), 391-407.
Dikli, S. (2006). An overview of automated scoring of essays. The Journal of Technology, Learning
and Assessment, 5(1).
Dumais, S. T. (2004). Latent semantic analysis. Annual review of information science and
technology, 38(1), 189-230.

111
Dumais, S. T., Furnas, G. W., Landauer, T. K., Deerwester, S., & Harshman, R. (1988, May). Using
latent semantic analysis to improve access to textual information. In Proceedings of the
SIGCHI conference on Human factors in computing systems (pp. 281-285). ACM.
Eckart, C., & Young, G. (1936). The approximation of one matrix by another of lower rank.
Psychometrika, 1(3), 211-218.
Education Northwest. (2013). Traits Rubric for Grades 3–12. Retrieved from
http://educationnorthwest.org/sites/default/files/grades3-12-6pt-rubric.pdf
Elliot, N., & Klobucar, A. (2013). Automated Essay Evaluation and the Teaching of Writing. In
M.D. Shermis & J.C. Burstein (Eds.), Handbook of Automated Essay Evaluation: current
application and new directions (pp. 16-35). New York: Psychology Press.
Elliot, S. (2003). IntelliMetric: From Here to Validity. In M.D. Shermis & J.C. Burstein (Eds.),
Automated essay scoring: a cross-disciplinary perspective (pp. 71-86). Mahwah, New
Jersey: Lawrence Erlbaum associates, Inc..
Fellbaum, C. (2012). WordNet. The Encyclopedia of Applied Linguistics. Blackwell Publishing Ltd.
Flesch, R. (1948). A new readability yardstick. Journal of applied psychology, 32(3), 221.
Foltz, P. W. (1996). Latent semantic analysis for text-based research. Behavior Research Methods,
Instruments, & Computers, 28(2), 197-202.
Foltz, P. W. (2016). Advances in Automated Scoring of Writing for Performance Assessment. In Y.
Rosen, S. Ferrara, & M. Mosharraf (Eds.), Handbook of Research on Technology Tools for
Real-World Skill Development (pp. 658-677). Hershey, PA: Information Science Reference,
an imprint of IGI Global.
Foltz, P. W., Steeter, L. A., Lochbaum, K. E., & Landauer, T. K. (2013). Implementation and
Applications of the intelligent essay assessor. In M.D. Shermis & J.C. Burstein (Eds.),
Handbook of Automated Essay Evaluation: current application and new directions (pp. 68-
88). New York: Psychology Press.
Gamon, M., Chodorow, M., Leacock, C., & Tetreault, J. (2013). Grammatical Error Detection in
Automated Essay Scoring and Feedback. In M.D. Shermis & J.C. Burstein (Eds.), Handbook
of Automated Essay Evaluation: current application and new directions (pp. 251-266). New
York: Psychology Press.
Gierl, M. J., Latifi, S., Lai, H., Boulais, A. P., & De Champlain, A. (2014). Automated essay scoring
and the future of educational assessment in medical education. Medical Education, 48,
950–962.

112
Golub, G. H., & Reinsch, C. (1970). Singular value decomposition and least squares
solutions. Numerische mathematik, 14(5), 403-420.
Graesser, A. C., & McNamara, D. S. (2011). Computational analyses of multilevel discourse
comprehension. Topics in Cognitive Science, 3(2), 371-398.
Graesser, A. C., McNamara, D. S., & Kulikowich, J. M. (2011). Coh-Metrix providing multilevel
analyses of text characteristics. Educational Researcher, 40(5), 223-234.
Graesser, A. C., McNamara, D. S., Louwerse, M. M., & Cai, Z. (2004). Coh-Metrix: Analysis of text
on cohesion and language. Behavior research methods, instruments, & computers, 36(2),
193-202.
Harmes, J. C., Welsh, J. L., & Winkelman, R. J. (2016). A Framework for Defining and Evaluating
Technology Integration in the Instruction of Real-World Skills. In Y. Rosen, S. Ferrara, & M.
Mosharraf (Eds.), Handbook of Research on Technology Tools for Real-World Skill
Development (pp. 137-162). Hershey, PA: Information Science Reference, an imprint of IGI
Global.
Hempelmann, C. F., Dufty, D., McCarthy, P. M., Graesser, A. C., Cai, Z., & McNamara, D. S. (2005).
Using LSA to automatically identify givenness and newness of noun phrases in written
discourse. In Proceedings of the 27th annual conference of the Cognitive Science Society (pp.
941-946).
Hewlett Foundation (2012, January 9). Hewlett Foundation Sponsors Prize to Improve Automated
Scoring of Student Essays. Retrieved February 11, 2016, from
http://www.hewlett.org/newsroom/press-release/hewlett-foundation-sponsors-prize-
improve-automated-scoring-student-essays
Higgins, D., Burstein, J., Marcu, D., & Gentile, C. (2004). Evaluating Multiple Aspects of Coherence
in Student Essays. In HLT-NAACL (pp. 185-192).
Hripcsak, G., & Rothschild, A. S. (2005). Agreement, the f-measure, and reliability in information
retrieval. Journal of the American Medical Informatics Association, 12(3), 296-298.
Jurafsky, D. & Martin, J. (2009). Speech and language processing : an introduction to natural
language processing, computational linguistics, and speech recognition. Upper Saddle River,
N.J: Pearson Prentice Hall.
Kaggle. (2012). Develop an automated scoring algorithm for student-written essays. The Hewlett
Foundation: Automated Essay Scoring. Retrieved February 01, 2016, from
https://www.kaggle.com/c/asap-aes/data

113
Kaggle. (2013). Automated Student Assessment Prize Phase Two: Short Answer Scoring: The
Hewlett Foundation: Short Answer Scoring Winners. Retrieved from:
https://www.kaggle.com/c/asap-sas/details/winners
Kaplan, R. (2010). The Oxford handbook of applied linguistics. Oxford New York: Oxford
University Press.
Kincaid, J. P., Fishburne Jr, R. P., Rogers, R. L., & Chissom, B. S. (1975).Derivation of new
readability formulas (automated readability index, fog count and flesch reading ease
formula) for navy enlisted personnel (No. RBR-8-75). Naval Technical Training Command
Millington TN Research Branch.
Koedinger, K. R., D'Mello, S., McLaughlin, E. A., Pardos, Z. A., & Rosé, C. P. (2015). Data mining
and education. Wiley Interdisciplinary Reviews: Cognitive Science, 6(1), 333-353. doi:
10.1002/wcs.1350
Kolda, T. G., & O'leary, D. P. (1998). A semidiscrete matrix decomposition for latent semantic
indexing information retrieval. ACM Transactions on Information Systems (TOIS), 16(4), 322-
346.
Landauer, T. K. (2011). LSA as a Theory of Meaning. In T.K. Landauer, D. S. McNamara, S. Dennis,
& W. Kintsch (Eds.), Handbook of latent semantic analysis, (pp. 3-34). New York: Routledge.
Landauer, T. K., Laham, D., & Foltz, P. W. (2003). Automatic essay assessment. Assessment in
education: Principles, policy & practice, 10(3), 295-308.
Landauer, T. K., Laham, D., & Foltz, P. W. (2003). Automated Scoring and Annotation of Essays
with the Intelligent Essay Assessor. In M.D. Shermis & J.C. Burstein (Eds.), Automated
essay scoring: a cross-disciplinary perspective (pp. 87-112). Mahwah, New Jersey:
Lawrence Erlbaum associates, Inc..
Larkey, L. S. (2003). A Text Categorization Approach to Automated Essay Grading. In M.D.
Shermis & J.C. Burstein (Eds.), Automated essay scoring: a cross-disciplinary perspective
(pp. 55-70). Mahwah, New Jersey: Lawrence Erlbaum associates, Inc..
Latifi, S., Gierl, M. J., Boulais, A. P., & De Champlain, A. F. (2015). Using Automated Scoring to
Evaluate Written Responses in English and French on a High-Stakes Clinical Competency
Examination. Evaluation & the health professions, DOI: 10.1177/0163278715605358.
Leacock, C., & Chodorow, M. (2003). Automated Grammatical Error Detection. In M.D. Shermis &
J.C. Burstein (Eds.), Automated essay scoring: a cross-disciplinary perspective (pp. 195-
207). Mahwah, New Jersey: Lawrence Erlbaum associates, Inc..
114
Lee, C. H., & Yang, H. C. (2009). Construction of supervised and unsupervised learning systems
for multilingual text categorization. Expert Systems with Applications, 36(2), 2400-2410.
Lomax, S., & Vadera, S. (2013). A survey of cost-sensitive decision tree induction algorithms.
ACM Computing Surveys, 45, 16. doi:10.1145/2431211.2431215
Makhoul, J., Kubala, F., Schwartz, R., & Weischedel, R. (1999, February). Performance measures
for information extraction. In Proceedings of DARPA Broadcast News Workshop (pp. 249-
252). San Francisco, CA: Morgan Kaufmann Publishers.
Malvern, D. D., Richards, B. J., Chipere, N., & Durán, P. (2004). Lexical diversity and language
development: Quantification and assessment. Houndmills, NH: Palgrave Macmillan.
Marcus, M. P., Marcinkiewicz, M. A., & Santorini, B. (1993). Building a large annotated corpus of
English: The Penn Treebank. Computational linguistics,19(2), 313-330.
Martin, D. I., Berry, M. W. (2007). Mathematical Foundations Behind Latent Semantic Analysis. In
T. K. Landauer, D. S. McNamara, S. Denis, W. Kintsch (Eds.), Handbook of Latent Semantic
Analysis, (pp. 35-56). Mahwah, N.J: Lawrence Erlbaum Associates.
Martin, D. I., & Berry, M. W. (2011). Mathematical Foundations Behind Latent Semantic Analysis.
In T.K. Landauer, D. S. McNamara, S. Dennis, & W. Kintsch (Eds.), Handbook of latent
semantic analysis, (pp. 35-56). New York: Routledge.
Masip, D., Minguillo´n, J., & Mor, E. (2011). Capturing and analyzing student behavior in a virtual
learning environment: A case study on usage of library resources. In C. Romero, S.
Ventura, M. Pechenizkiy, & R. S. J. D. Baker (Eds.), Handbook of educational data mining
(pp. 339–351). Boca Raton, FL: CRC Press
Mayfield, E., & Rose, C. P. (2013). LightSIDE: Open Source Machine Learning for Text. In M.D.
Shermis & J.C. Burstein (Eds.), Handbook of Automated Essay Evaluation: current
application and new directions (pp. 124-135). New York: Psychology Press.
McCarthy, P. M., Dufty, D., Hempelmann, C. F., Cai, Z., Graesser, A.C., & McNamara, D.S. (2012).
Newness and Givenness of Information: Automated Identification in written discourse. In
P.M. McCarthy & C. Boonthum (Eds.), Applied natural language processing: Identification,
investigation, and resolution (pp. 457-478). Hershey, PA: IGI Global.
McCarthy, P. M., Guess, R. H., & McNamara, D. S. (2009). The components of paraphrase
evaluations. Behavior Research Methods, 41(3), 682-690.
McCarthy, P. M., & Jarvis, S. (2010). MTLD, vocd-D, and HD-D: A validation study of sophisticated
approaches to lexical diversity assessment. Behavior research methods, 42(2), 381-392.

115
McEnery, T., & Wilson, A. (2001). Corpus linguistics: An introduction. Edinburgh University Press.
McNamara, D. S., Graesser, A. C., & Louwerse, M. M. (2012). Sources of text difficulty: Across
genres and grades. In J. P. Sabatini, E. R. Albro, & T. O’Reilly (Eds.), Measuring up: Advances
in how we assess reading ability (pp. 89-116). Lanham, MD: Rowman & Littlefield Education.
McNamara, D. S., Graesser, A. C., McCarthy, P. M. & Cai, Z. (2014). Automated evaluation of text
and discourse with Coh-Metrix. New York, NY: Cambridge University Press.
Mellor, A. (2011). Essay length, lexical diversity and automatic essay scoring. Memoirs of the
Osaka Institute of Technology, 55(2), 1-14.
Miller, G. A., Beckwith, R., Fellbaum, C., Gross, D., & Miller, K. J. (1990). Introduction to WordNET:
An On-line Lexical Database. International journal of lexicography, 3(4), 235-244.
Mitchell, T., Russell, T., Broomhead, P., & Aldridge, N. (2002). Towards robust computerised
marking of free-text responses. Retrieved December 21, 2015 from
https://courses.cs.washington.edu/courses/cse590d/04sp/papers/Mitchell-automark.pdf
Murray, J. D. (1997). Connectives and narrative text: The role of continuity. Memory &
Cognition, 25(2), 227-236.
Myers, M. (2003). What Can Computers and AES Contribute to a K-12 Writings Program?. In
M.D. Shermis & J.C. Burstein (Eds.), Automated essay scoring: a cross-disciplinary
perspective (pp. 3-20). Mahwah, New Jersey: Lawrence Erlbaum associates, Inc..
Nelson, J., Perfetti, C., Liben, D., & Liben, M. (2012). Measures of Text Difficulty: Testing Their
Predictive Value for Grade Levels and Student Performance. New York, NY: Student
Achievement Partners. Retrieved from www.ccsso.org
Page, E. B. (1968). The use of the computer in analyzing student essays. International review of
education, 14(2), 210-225.
Perelman, L. (2014). When “the state of the art” is counting words. Assessing Writing, 21, 104-
111.
Platt, J. (1998). Sequential Minimal Optimization: A Fast Algorithm for Training Support Vector
Machines, Retrieved from: http://research.microsoft.com/pubs/69644/tr-98-14.pdf
Powers, D. M. (2011). Evaluation: from precision, recall and F-measure to ROC, Informedness,
Markedness & Correlation. Journal of Machine Learning Technologies, 2(1), 37-63.
Quinlan, J. R. (1993). C4.5: Programs for Machine Learning (Vol. 1). San Mateo, CA: Morgan
Kaufmann Publishers.

116
R Core Team. (2016). R: A language and environment for statistical computing. Vienna, Austria: R
Foundation for Statistical Computing.
Ramineni, C., Trapani, C. S., Williamson, D. M., Davey, T., & Bridgeman, B. (2012). Evaluation of
the e‐rater® Scoring Engine for the GRE® Issue and Argument Prompts. ETS Research
Report Series, 2012(1), i-106.
Reckase, M. D. (2016). Commentary on Chapters 5-7: Moving From Art to Science. In F. Drasgow
(Ed.), Technology and Testing: Improving Educational and Psychological Measurement (pp.
174-178). New York: Routledge.
Refaeilzadeh, P., Tang, L., & Liu, H. (2009). Cross-validation. In L. Liu & M. T. Özsu (Eds.),
Encyclopedia of Database Systems (pp. 532-538). New York: Springer.
Rich, C. S., Schneider, M. C., & D’Brot, J. M. (2013). Application of Automated Essay Evaluation in
West Virginia. In M.D. Shermis & J.C. Burstein (Eds.), Handbook of Automated Essay
Evaluation: current application and new directions (pp. 99-123). New York: Psychology
Press.
Rokach, L. (2010). Ensemble-based classifiers. Artificial Intelligence Review,33(1-2), 1-39.
Rosario, B. (2000). Latent semantic indexing: An overview. Final paper INFOSYS, 240 Spring
Paper, University of California, Berkeley. Retrieved from:
http://www.cse.msu.edu/~cse960/Papers/LSI/LSI.pdf.
Roscoe, R. D., Allen, L. K., Weston, J. L., Crossley, S. A., & McNamara, D. S. (2014). The Writing Pal
intelligent tutoring system: Usability testing and development. Computers and
Composition, 34, 39-59.
Rudner, L.M. & Liang, T. (2002). Automated essay scoring using Bayes’ theorem. Journal of
Technology, Learning, and Assessment, ı(2). Available from http://www.jtla.org.
Salsbury, T., Crossley, S. A., & McNamara, D. S. (2011). Psycholinguistic word information in
second language oral discourse. Second Language Research, 27(3), 343-360.
Samuel, A. L. (1959). Some studies in machine learning using the game of checkers. IBM Journal
of research and development, 3(3), 210-229.
Schultz, M. T. (2013). The IntelliMetric Automated Essay Scoring Engine – A Review and an
Application to Chinese Essay Scoring. In M.D. Shermis & J.C. Burstein (Eds.), Handbook of
Automated Essay Evaluation: current application and new directions (pp. 89-98). New
York: Psychology Press.

117
Shapiro, A. M., & McNamara, D. S. (2000). The use of latent semantic analysis as a tool for the
quantitative assessment of understanding and knowledge. Journal of Educational
Computing Research, 22(1), 1-36.
Shermis, M. D. (2014a). State-of-the-art automated essay scoring: Competition, results, and
future directions from a United States demonstration. Assessing Writing, 20, 53–76.
Shermis, M. D. (2014b). The challenges of emulating human behavior in writing assessment.
Assessing Writing, 22, 91-99. http://doi.org/10.1016/j.asw.2014.07.002
Shermis, M. D., & Burstein, J. (2013). Handbook of automated essay evaluation: Current
applications and new directions. New York: Psychology Press.
Shermis, M. D., Lottridge, S., & Mayfield, E. (2015). The Impact of Anonymization for Automated
Essay Scoring. Journal of Educational Measurement, 52(4), 419-436.
Shermis, M. D., & Morgan, J. (2016). Using Prizes to Facilitate Change in Educational Assessment.
In F. Drasgow (Ed.), Technology and Testing: Improving Educational and Psychological
Measurement (pp. 323-338). New York: Routledge.
Shermis, M. D., Raymat, M. V., & Barrera, F. (2003). Assessing Writing through the Curriculum
with Automated Essay Scoring.
Souza, C. R. (2010, March 17). Kernel Functions for Machine Learning Applications. Science,
computing and machine learning. http://crsouza.com/2010/03/kernel-functions-for-
machine-learning-applications
Streeter, L., Bernstein, J., Foltz, P., & DeLand, D. (2011). Pearson’s automated scoring of writing,
speaking, and mathematics.
Tapper, M. (2005). Connectives in advanced Swedish EFL learners’ written English–preliminary
results. The Department of English: Working Papers in English Linguistics, 5, 116-144.
Theodoridis, S. & Koutroumbas, K. (2009). Pattern recognition. Burlington, MA London: Academic
Press.
Tong, S., & Koller, D. (2002). Support vector machine active learning with applications to text
classification. The Journal of Machine Learning Research,2, 45-66.
Van Dijk, T. A., & Kintsch, W. (1983). Strategies of discourse comprehension. New York: Academic
Press.

118
Wiemer-Hastings, P. (1999). How Latent is Latent Semantic Analysis? . In Proceedings of the
Sixteenth International Joint Congress on Artificial Intelligence (pp. 932-937). San
Francisco. Morgan Kaufmann.
Wiemer-Hastings, P. (2006). Latent Semantic Analysis . In K. Brown & A. Anderson (Eds.),
Encyclopedia of language & linguistics (2nd ed.), (pp. 706-709). Boston: Elsevier.
Williamson, D. M., Xi, X., & Breyer, F. J. (2012). A framework for evaluation and use of automated
scoring. Educational Measurement: Issues and Practice, 31(1), 2-13.
Wilson, J., & Andrada, G. N. (2016). Using Automated Feedback to Improve Writing Quality:
Opportunities and Challenges. In Y. Rosen, S. Ferrara, & M. Mosharraf (Eds.), Handbook of
Research on Technology Tools for Real-World Skill Development (pp. 678-703). Hershey, PA:
Information Science Reference, an imprint of IGI Global.
Wilson, M. (1988). MRC Psycholinguistic Database: Machine-usable dictionary, version
2.00. Behavior Research Methods, Instruments, & Computers, 20(1), 6-10.
Witten, I., Frank, E., & Hall, M. (2011). Data mining: Practical machine learning tools and
techniques (3rd ed.). Burlington, MA: Morgan Kaufmann.
Wu, X., Kumar, V., Quinlan, J. R., Ghosh, J., Yang, Q., Motoda, H., ... & Zhou, Z. H. (2008). Top 10
algorithms in data mining. Knowledge and Information Systems, 14(1), 1-37.
Xiong, W., Song, M., & deVersterre, L. (2012). A Comparative Study of an Unsupervised Word
Sense Disambiguation Approach. In P. McCarthy, & C. Boonthum-Denecke (Eds.) Applied
Natural Language Processing: Identification, Investigation and Resolution (pp. 412-422).
Hershey, PA: Information Science Reference. doi:10.4018/978-1-60960-741-8.ch024
Yannakoudakis, H., Briscoe, T., & Medlock, B. (2011, June). A New Dataset and Method for
Automatically Grading ESOL Texts. In ACL (pp. 180-189).
Yu, G. (2010). Lexical diversity in writing and speaking task performances. Applied
linguistics, 31(2), 236-259.
Zhang, M. (2012). Sampling Issues and Error Control in Calibrating Automated Scoring Models
for Essays (Doctoral dissertation). Retrieved from ProQuest. (UMI Number: 3541256)
Zhang, M., Breyer, F. J., & Lorenz, F. (2013). Investigating The Suitability Of Implementing The E‐
Rater® Scoring Engine In A Large‐Scale English Language Testing Program. ETS Research
Report Series, 2013(2), i-60.
Zwaan, R. A., & Radvansky, G. A. (1998). Situation models in language comprehension and
memory. Psychological bulletin, 123(2), 162.

119
Appendix A: Example of Referential Cohesion
Table A1
A comparison of the five co-reference indices on a science text about cell.
Sentence Noun Argument Stem Content
Word LSA
S1 The cell is the basic unit of life.
S2 Cells were discovered by Robert Hooke. 0 1 1 0 0.37
S3 A cell is the smallest unit of life that is classified
as a living thing.
0 1 1 0 0.4
S4 Some organism, such as most bacteria, are
unicellular (consist of a single cell).
1 1 1 0.13 0.44
S5 Other organisms, such as humans, are
multicellular.
1 1 1 0.33 0.79
S6 There are two types of cells: eukaryotic and
prokaryotic.
0 0 0 0 0.34
S7 Prokaryotic cells are usually independent. 1 1 1 0.5 0.85
S8 Eukaryotic cells are often found in multicellular
organisms.
1 1 1 0.2 0.7
Local average (between adjacent sentences) 0.57 0.86 0.86 0.17 0.56
Global average (between all sentences) 0.43 0.82 0.82 0.13 0.41
Source: McNamara, Graesser, McCarthy, and Cai (2014, p. 64).
The Coh-Metrix adjacent co-reference calculations for each of the five types of indices are provided for
each sentence in the text. The Coh-Metrix output is the average across sentences. Each of the five types
of indices are also calculated in terms of global co-reference, which is the average overlap between all
pairs of sentences in the text.

120
Appendix B: Essay Prompts
B1: Essay Prompt # 1
Type of Essay: Persuasive
Grade level: 8
Rubric: Holistic
Score Range: 1-6
Prompt
More and more people use computers, but not everyone agrees that this benefits society. Those
who support advances in technology believe that computers have a positive effect on people.
They teach hand-eye coordination, give people the ability to learn about faraway places and
people, and even allow people to talk online with other people. Others have different ideas.
Some experts are concerned that people are spending too much time on their computers and
less time exercising, enjoying nature, and interacting with family and friends.
Write a letter to your local newspaper in which you state your opinion on the effects computers
have on people. Persuade the readers to agree with you.

121
B2: Essay Prompt # 2
Type of Essay: Persuasive
Grade level: 10
Rubric: Trait
Score Range Trait 1: 1-6
Score Range Trait 2: 1-4
Prompt
Censorship in the Libraries
"All of us can think of a book that we hope none of our children or any other children have
taken off the shelf. But if I have the right to remove that book from the shelf -- that work I abhor
-- then you also have exactly the same right and so does everyone else. And then we have no
books left on the shelf for any of us." --Katherine Paterson, Author
Write a persuasive essay to a newspaper reflecting your vies on censorship in libraries. Do you
believe that certain materials, such as books, music, movies, magazines, etc., should be removed
from the shelves if they are found offensive? Support your position with convincing arguments
from your own experience, observations, and/or reading.
NOTE: This data set is the only one that is scored using a trait rubric. You will be asked to make two
separate predictions for this essay prompt corresponding to the resolved scores for the two domains that
were assessed.
Trait 1 (2a): Writing Applications
Trait 2 (2b): Language Conventions

122
B3: Essay Prompt # 3
Type of Essay: Source-based
Grade level: 10
Rubric: Holistic
Score Range: 0-3
Source Essay
ROUGH ROAD AHEAD: Do Not Exceed Posted Speed Limit
by Joe Kurmaskie
FORGET THAT OLD SAYING ABOUT NEVER taking candy from strangers. No, a better piece of
advice for the solo cyclist would be, “Never accept travel advice from a collection of old-timers
who haven’t left the confines of their porches since Carter was in office.” It’s not that a group of
old guys doesn’t know the terrain. With age comes wisdom and all that, but the world is a fluid
place. Things change.
At a reservoir campground outside of Lodi, California, I enjoyed the serenity of an early-summer
evening and some lively conversation with these old codgers. What I shouldn’t have done was
let them have a peek at my map. Like a foolish youth, the next morning I followed their advice
and launched out at first light along a “shortcut” that was to slice away hours from my ride to
Yosemite National Park.
They’d sounded so sure of themselves when pointing out landmarks and spouting off towns I
would come to along this breezy jaunt. Things began well enough. I rode into the morning with
strong legs and a smile on my face. About forty miles into the pedal, I arrived at the first “town.”
This place might have been a thriving little spot at one time—say, before the last world war—
but on that morning it fit the traditional definition of a ghost town. I chuckled, checked my
water supply, and moved on. The sun was beginning to beat down, but I barely noticed it. The
cool pines and rushing rivers of Yosemite had my name written all over them.
Twenty miles up the road, I came to a fork of sorts. One ramshackle shed, several rusty pumps,
and a corral that couldn’t hold in the lamest mule greeted me. This sight was troubling. I had
been hitting my water bottles pretty regularly, and I was traveling through the high deserts of
California in June.
I got down on my hands and knees, working the handle of the rusted water pump with all my
strength. A tarlike substance oozed out, followed by brackish water feeling somewhere in the
neighborhood of two hundred degrees. I pumped that handle for several minutes, but the water
wouldn’t cool down. It didn’t matter. When I tried a drop or two, it had the flavor of battery acid.
The old guys had sworn the next town was only eighteen miles down the road. I could make
that! I would conserve my water and go inward for an hour or so—a test of my inner spirit.
Not two miles into this next section of the ride, I noticed the terrain changing. Flat road was
replaced by short, rolling hills. After I had crested the first few of these, a large highway sign
jumped out at me. It read: ROUGH ROAD AHEAD: DO NOT EXCEED POSTED SPEED LIMIT.
The speed limit was 55 mph. I was doing a water-depleting 12 mph. Sometimes life can feel so
cruel.

123
I toiled on. At some point, tumbleweeds crossed my path and a ridiculously large snake—it
really did look like a diamondback—blocked the majority of the pavement in front of me. I
eased past, trying to keep my balance in my dehydrated state.
The water bottles contained only a few tantalizing sips. Wide rings of dried sweat circled my
shirt, and the growing realization that I could drop from heatstroke on a gorgeous day in June
simply because I listened to some gentlemen who hadn’t been off their porch in decades,
caused me to laugh.
It was a sad, hopeless laugh, mind you, but at least I still had the energy to feel sorry for myself.
There was no one in sight, not a building, car, or structure of any kind. I began breaking the ride
down into distances I could see on the horizon, telling myself that if I could make it that far, I’d
be fi ne.
Over one long, crippling hill, a building came into view. I wiped the sweat from my eyes to make
sure it wasn’t a mirage, and tried not to get too excited. With what I believed was my last burst
of energy, I maneuvered down the hill.
In an ironic twist that should please all sadists reading this, the building—abandoned years
earlier, by the looks of it—had been a Welch’s Grape Juice factory and bottling plant. A
sandblasted picture of a young boy pouring a refreshing glass of juice into his mouth could still
be seen.
I hung my head.
That smoky blues tune “Summertime” rattled around in the dry honeycombs of my deteriorating
brain.
I got back on the bike, but not before I gathered up a few pebbles and stuck them in my mouth.
I’d read once that sucking on stones helps take your mind off thirst by allowing what spit you
have left to circulate. With any luck I’d hit a bump and lodge one in my throat.
It didn’t really matter. I was going to die and the birds would pick me clean, leaving only some
expensive outdoor gear and a diary with the last entry in praise of old men, their wisdom, and
their keen sense of direction. I made a mental note to change that paragraph if it looked like I
was going to lose consciousness for the last time.
Somehow, I climbed away from the abandoned factory of juices and dreams, slowly gaining
elevation while losing hope. Then, as easily as rounding a bend, my troubles, thirst, and fear
were all behind me.
GARY AND WILBER’S FISH CAMP—IF YOU WANT BAIT FOR THE BIG ONES, WE’RE YOUR BEST
BET!
“And the only bet,” I remember thinking.
As I stumbled into a rather modern bathroom and drank deeply from the sink, I had an
overwhelming urge to seek out Gary and Wilber, kiss them, and buy some bait—any bait, even
though I didn’t own a rod or reel.
An old guy sitting in a chair under some shade nodded in my direction. Cool water dripped from
my head as I slumped against the wall beside him.
“Where you headed in such a hurry?”
“Yosemite,” I whispered.
“Know the best way to get there?”
I watched him from the corner of my eye for a long moment. He was even older than the group
I’d listened to in Lodi.

124
“Yes, sir! I own a very good map.”
And I promised myself right then that I’d always stick to it in the future.
“Rough Road Ahead” by Joe Kurmaskie, from Metal Cowboy, copyright © 1999 Joe Kurmaskie.
Prompt
Write a response that explains how the features of the setting affect the cyclist. In your response,
include examples from the essay that support your conclusion.

125
B4: Essay Prompt # 4
Type of Essay: Source-based
Grade level: 10
Rubric: Holistic
Score Range: 0-3
Source Essay
Winter Hibiscus by Minfong Ho
Saeng, a teenage girl, and her family have moved to the United States from Vietnam. As Saeng
walks home after failing her driver’s test, she sees a familiar plant. Later, she goes to a florist
shop to see if the plant can be purchased.
It was like walking into another world. A hot, moist world exploding with greenery. Huge flat
leaves, delicate wisps of tendrils, ferns and fronds and vines of all shades and shapes grew in
seemingly random profusion.
“Over there, in the corner, the hibiscus. Is that what you mean?” The florist pointed at a leafy
potted plant by the corner.
There, in a shaft of the wan afternoon sunlight, was a single blood-red blossom, its five petals
splayed back to reveal a long stamen tipped with yellow pollen. Saeng felt a shock of
recognition so intense, it was almost visceral.1
“Saebba,” Saeng whispered.
A saebba hedge, tall and lush, had surrounded their garden, its lush green leaves dotted with
vermilion flowers. And sometimes after a monsoon rain, a blossom or two would have blown
into the well, so that when she drew the well water, she would find a red blossom floating in the
bucket.
Slowly, Saeng walked down the narrow aisle toward the hibiscus. Orchids, lanna bushes,
oleanders, elephant ear begonias, and bougainvillea vines surrounded her. Plants that she had
not even realized she had known but had forgotten drew her back into her childhood world.
When she got to the hibiscus, she reached out and touched a petal gently. It felt smooth and
cool, with a hint of velvet toward the center—just as she had known it would feel.
And beside it was yet another old friend, a small shrub with waxy leaves and dainty flowers with
purplish petals and white centers. “Madagascar periwinkle,” its tag announced. How strange to
see it in a pot, Saeng thought. Back home it just grew wild, jutting out from the cracks in brick
walls or between tiled roofs.
And that rich, sweet scent—that was familiar, too. Saeng scanned the greenery around her and
found a tall, gangly plant with exquisite little white blossoms on it. “Dok Malik,” she said,
savoring the feel of the word on her tongue, even as she silently noted the English name on its
tag, “jasmine.”
One of the blossoms had fallen off, and carefully Saeng picked it up and smelled it. She closed
her eyes and breathed in, deeply. The familiar fragrance filled her lungs, and Saeng could almost
feel the light strands of her grandmother’s long gray hair, freshly washed, as she combed it out
with the fine-toothed buffalo-horn comb. And when the sun had dried it, Saeng would help the
gnarled old fingers knot the hair into a bun, then slip a dok Malik bud into it.
126
Saeng looked at the white bud in her hand now, small and fragile. Gently, she closed her palm
around it and held it tight. That, at least, she could hold on to. But where was the fine-toothed
comb? The hibiscus hedge? The well? Her gentle grandmother?
A wave of loss so deep and strong that it stung Saeng’s eyes now swept over her. A blink, a
channel switch, a boat ride into the night, and it was all gone. Irretrievably, irrevocably gone.
And in the warm moist shelter of the greenhouse, Saeng broke down and wept.
It was already dusk when Saeng reached home. The wind was blowing harder, tearing off the
last remnants of green in the chicory weeds that were growing out of the cracks in the sidewalk.
As if oblivious to the cold, her mother was still out in the vegetable garden, digging up the last
of the onions with a rusty trowel. She did not see Saeng until the girl had quietly knelt down
next to her.
Her smile of welcome warmed Saeng. “Ghup ma laio le? You’re back?” she said cheerfully.
“Goodness, it’s past five. What took you so long? How did it go? Did you—?” Then she noticed
the potted plant that Saeng was holding, its leaves quivering in the wind.
Mrs. Panouvong uttered a small cry of surprise and delight. “Dok faeng-noi!” she said. “Where
did you get it?”
“I bought it,” Saeng answered, dreading her mother’s next question.
“How much?”
For answer Saeng handed her mother some coins.
“That’s all?” Mrs. Panouvong said, appalled, “Oh, but I forgot! You and the
Lambert boy ate Bee-Maags . . . .”
“No, we didn’t, Mother,” Saeng said.
“Then what else—?”
“Nothing else. I paid over nineteen dollars for it.”
“You what?” Her mother stared at her incredulously. “But how could you? All the seeds for this
vegetable garden didn’t cost that much! You know how much we—” She paused, as she noticed
the tearstains on her daughter’s cheeks and her puffy eyes.
“What happened?” she asked, more gently.
“I—I failed the test,” Saeng said.
For a long moment Mrs. Panouvong said nothing. Saeng did not dare look her mother in the
eye. Instead, she stared at the hibiscus plant and nervously tore off a leaf, shredding it to bits.
Her mother reached out and brushed the fragments of green off Saeng’s hands. “It’s a beautiful
plant, this dok faeng-noi,” she finally said. “I’m glad you got it.”
“It’s—it’s not a real one,” Saeng mumbled.
“I mean, not like the kind we had at—at—” She found that she was still too shaky to say the
words at home, lest she burst into tears again. “Not like the kind we had before,” she said.
“I know,” her mother said quietly. “I’ve seen this kind blooming along the lake. Its flowers aren’t
as pretty, but it’s strong enough to make it through the cold months here, this winter hibiscus.
That’s what matters.”
She tipped the pot and deftly eased the ball of soil out, balancing the rest of the plant in her
other hand. “Look how root-bound it is, poor thing,” she said. “Let’s plant it, right now.”
She went over to the corner of the vegetable patch and started to dig a hole in the ground. The
soil was cold and hard, and she had trouble thrusting the shovel into it. Wisps of her gray hair
trailed out in the breeze, and her slight frown deepened the wrinkles around her eyes. There was
127
a frail, wiry beauty to her that touched Saeng deeply.
“Here, let me help, Mother,” she offered, getting up and taking the shovel away from her.
Mrs. Panouvong made no resistance. “I’ll bring in the hot peppers and bitter melons, then, and
start dinner. How would you like an omelet with slices of the bitter melon?”
“I’d love it,” Saeng said.
Left alone in the garden, Saeng dug out a hole and carefully lowered the “winter hibiscus” into it.
She could hear the sounds of cooking from the kitchen now, the beating of eggs against a bowl,
the sizzle of hot oil in the pan. The pungent smell of bitter melon wafted out, and Saeng’s
mouth watered. It was a cultivated taste, she had discovered—none of her classmates or friends,
not even Mrs. Lambert, liked it—this sharp, bitter melon that left a golden aftertaste on the
tongue. But she had grown up eating it and, she admitted to herself, much preferred it to a Big
Mac.
The “winter hibiscus” was in the ground now, and Saeng tamped down the soil around it.
Overhead, a flock of Canada geese flew by, their faint honks clear and—yes—familiar to Saeng
now. Almost reluctantly, she realized that many of the things that she had thought of as strange
before had become, through the quiet repetition of season upon season, almost familiar to her
now. Like the geese. She lifted her head and watched as their distinctive V was etched against
the evening sky, slowly fading into the distance.
When they come back, Saeng vowed silently to herself, in the spring, when the snows melt and
the geese return and this hibiscus is budding, then I will take that test again.
“Winter Hibiscus” by Minfong Ho, copyright © 1993 by Minfong Ho, from Join In, Multiethnic Short
Stories, by Donald R. Gallo, ed.
Prompt
Read the last paragraph of the story.
"When they come back, Saeng vowed silently to herself, in the spring, when the snows melt and
the geese return and this hibiscus is budding, then I will take that test again."
Write a response that explains why the author concludes the story with this paragraph. In your
response, include details and examples from the story that support your ideas.

128
B5: Essay Prompt # 5
Type of Essay: Source-based
Grade level: 8
Rubric: Holistic
Score Range: 0-4
Source Essay
Narciso Rodriguez
from Home: The Blueprints of Our Lives
My parents, originally from Cuba, arrived in the United States in 1956. After living for a year in a
furnished one-room apartment, twenty-one-year-old Rawedia Maria and twenty-seven-year-old
Narciso Rodriguez, Sr., could afford to move into a modest, three-room apartment I would soon
call home.
In 1961, I was born into this simple house, situated in a two-family, blond-brick building in the
Ironbound section of Newark, New Jersey. Within its walls, my young parents created our
traditional Cuban home, the very heart of which was the kitchen. My parents both shared
cooking duties and unwittingly passed on to me their rich culinary skills and a love of cooking
that is still with me today (and for which I am eternally grateful). Passionate Cuban music (which
I adore to this day) filled the air, mixing with the aromas of the kitchen. Here, the innocence of
childhood, the congregation of family and friends, and endless celebrations that encompassed
both, formed the backdrop to life in our warm home.
Growing up in this environment instilled in me a great sense that “family” had nothing to do
with being a blood relative. Quite the contrary, our neighborhood was made up of mostly
Spanish, Cuban, and Italian immigrants at a time when overt racism was the norm and
segregation prevailed in the United States. In our neighborhood, despite customs elsewhere, all
of these cultures came together in great solidarity and friendship. It was a close-knit community
of honest, hardworking immigrants who extended a hand to people who, while not necessarily
their own kind, were clearly in need.
Our landlord and his daughter, Alegria (my babysitter and first friend), lived above us, and
Alegria graced our kitchen table for meals more often than not. Also at the table were Sergio
and Edelmira, my surrogate grandparents who lived in the basement apartment. (I would not
know my “real” grandparents, Narciso the Elder and Consuelo, until 1970 when they were
allowed to leave Cuba.) My aunts Bertha and Juanita and my cousins Arnold, Maria, and
Rosemary also all lived nearby and regularly joined us at our table. Countless extended family
members came and went — and there was often someone staying with us temporarily until they
were able to get back on their feet. My parents always kept their arms and their door open to
the many people we considered family, knowing that they would do the same for us.
My mother and father had come to this country with such courage, without any knowledge of
the language or the culture. They came selflessly, as many immigrants do, to give their children
a better life, even though it meant leaving behind their families, friends, and careers in the
country they loved. They struggled both personally and financially, braving the harsh northern
winters while yearning for their native tropics and facing cultural hardships. The barriers to work

129
were strong and high, and my parents both had to accept that they might not be able to find
the kind of jobs they deserved. In Cuba, Narciso, Sr., had worked in a laboratory and Rawedia
Maria had studied chemical engineering. In the United States, they had to start their lives over
entirely, taking whatever work they could find. The faith that this struggle would lead them and
their children to better times drove them to endure these hard times.
I will always be grateful to my parents for their love and sacrifice. I’ve often told them that what
they did was a much more courageous thing than I could have ever done. I’ve often told them
of my admiration for their strength and perseverance, and I’ve thanked them repeatedly. But, in
reality, there is no way to express my gratitude for the spirit of generosity impressed upon me at
such an early age and the demonstration of how important family and friends are. These are two
lessons that my parents did not just tell me. They showed me with their lives, and these
teachings have been the basis of my life.
It was in this simple house that my parents welcomed other refugees to celebrate their arrival to
this country and where I celebrated my first birthdays. It was in the warmth of the kitchen in this
humble house where a Cuban feast (albeit a frugal Cuban feast) always filled the air with not just
scent and music but life and love. It was here where I learned the real definition of “family.” And
for this, I will never forget that house or its gracious neighborhood or the many things I learned
there about how to love. I will never forget how my parents turned this simple house into a
home.
— Narciso Rodriguez, Fashion designer
Hometown: Newark, New Jersey
“Narciso Rodriguez” by Narciso Rodriguez, from Home: The Blueprints of Our Lives. Copyright ©
2006 by John Edwards.
Prompt
Describe the mood created by the author in the memoir. Support your answer with relevant and
specific information from the memoir.

130
B6: Essay Prompt # 6
Type of Essay: Source-based
Grade level: 10
Rubric: Holistic
Score Range: 0-4
Source Essay
The Mooring Mast
by Marcia Amidon Lüsted
When the Empire State Building was conceived, it was planned as the world’s tallest building,
taller even than the new Chrysler Building that was being constructed at Forty-second Street and
Lexington Avenue in New York. At seventy-seven stories, it was the tallest building before the
Empire State began construction, and Al Smith was determined to outstrip it in height.
The architect building the Chrysler Building, however, had a trick up his sleeve. He secretly
constructed a 185-foot spire inside the building, and then shocked the public and the media by
hoisting it up to the top of the Chrysler Building, bringing it to a height of 1,046 feet, 46 feet
taller than the originally announced height of the Empire State Building.
Al Smith realized that he was close to losing the title of world’s tallest building, and on
December 11, 1929, he announced that the Empire State would now reach the height of 1,250
feet. He would add a top or a hat to the building that would be even more distinctive than any
other building in the city. John Tauranac describes the plan:
[The top of the Empire State Building] would be more than ornamental, more than a
spire or dome or a pyramid put there to add a desired few feet to the height of the
building or to mask something as mundane as a water tank. Their top, they said, would
serve a higher calling. The Empire State Building would be equipped for an age of
transportation that was then only the dream of aviation pioneers.
This dream of the aviation pioneers was travel by dirigible, or zeppelin, and the Empire State
Building was going to have a mooring mast at its top for docking these new airships, which
would accommodate passengers on already existing transatlantic routes and new routes that
were yet to come.
The Age of Dirigibles
By the 1920s, dirigibles were being hailed as the transportation of the future. Also known today
as blimps, dirigibles were actually enormous steel-framed balloons, with envelopes of cotton
fabric filled with hydrogen and helium to make them lighter than air. Unlike a balloon, a dirigible
could be maneuvered by the use of propellers and rudders, and passengers could ride in the
gondola, or enclosed compartment, under the balloon.
Dirigibles had a top speed of eighty miles per hour, and they could cruise at seventy miles per
hour for thousands of miles without needing refueling. Some were as long as one thousand feet,
the same length as four blocks in New York City. The one obstacle to their expanded use in New
York City was the lack of a suitable landing area. Al Smith saw an opportunity for his Empire
State Building: A mooring mast added to the top of the building would allow dirigibles to

131
anchor there for several hours for refueling or service, and to let passengers off and on.
Dirigibles were docked by means of an electric winch, which hauled in a line from the front of
the ship and then tied it to a mast. The body of the dirigible could swing in the breeze, and yet
passengers could safely get on and off the dirigible by walking down a gangplank to an open
observation platform.
The architects and engineers of the Empire State Building consulted with experts, taking tours of
the equipment and mooring operations at the U.S. Naval Air Station in Lakehurst, New Jersey.
The navy was the leader in the research and development of dirigibles in the United States. The
navy even offered its dirigible, the Los Angeles, to be used in testing the mast. The architects
also met with the president of a recently formed airship transport company that planned to offer
dirigible service across the Pacific Ocean.
When asked about the mooring mast, Al Smith commented:
[It’s] on the level, all right. No kidding. We’re working on the thing now. One set of
engineers here in New York is trying to dope out a practical, workable arrangement and
the Government people in Washington are figuring on some safe way of mooring
airships to this mast.
Designing the Mast
The architects could not simply drop a mooring mast on top of the Empire State Building’s flat
roof. A thousand-foot dirigible moored at the top of the building, held by a single cable tether,
would add stress to the building’s frame. The stress of the dirigible’s load and the wind pressure
would have to be transmitted all the way to the building’s foundation, which was nearly eleven
hundred feet below. The steel frame of the Empire State Building would have to be modified
and strengthened to accommodate this new situation. Over sixty thousand dollars’ worth of
modifications had to be made to the building’s framework.
Rather than building a utilitarian mast without any ornamentation, the architects designed a
shiny glass and chrome-nickel stainless steel tower that would be illuminated from inside, with a
stepped-back design that imitated the overall shape of the building itself. The rocket-shaped
mast would have four wings at its corners, of shiny aluminum, and would rise to a conical roof
that would house the mooring arm. The winches and control machinery for the dirigible
mooring would be housed in the base of the shaft itself, which also housed elevators and stairs
to bring passengers down to the eighty-sixth floor, where baggage and ticket areas would be
located.
The building would now be 102 floors, with a glassed-in observation area on the 101st floor and
an open observation platform on the 102nd floor. This observation area was to double as the
boarding area for dirigible passengers.
Once the architects had designed the mooring mast and made changes to the existing plans for
the building’s skeleton, construction proceeded as planned. When the building had been framed
to the 85th floor, the roof had to be completed before the framing for the mooring mast could
take place. The mast also had a skeleton of steel and was clad in stainless steel with glass
windows. Two months after the workers celebrated framing the entire building, they were back
to raise an American flag again—this time at the top of the frame for the mooring mast.
The Fate of the Mast
The mooring mast of the Empire State Building was destined to never fulfill its purpose, for
reasons that should have been apparent before it was ever constructed. The greatest reason was

132
one of safety: Most dirigibles from outside of the United States used hydrogen rather than
helium, and hydrogen is highly flammable. When the German dirigible Hindenburg was
destroyed by fire in Lakehurst, New Jersey, on May 6, 1937, the owners of the Empire State
Building realized how much worse that accident could have been if it had taken place above a
densely populated area such as downtown New York.
The greatest obstacle to the successful use of the mooring mast was nature itself. The winds on
top of the building were constantly shifting due to violent air currents. Even if the dirigible were
tethered to the mooring mast, the back of the ship would swivel around and around the
mooring mast. Dirigibles moored in open landing fields could be weighted down in the back
with lead weights, but using these at the Empire State Building, where they would be dangling
high above pedestrians on the street, was neither practical nor safe.
The other practical reason why dirigibles could not moor at the Empire State Building was an
existing law against airships flying too low over urban areas. This law would make it illegal for a
ship to ever tie up to the building or even approach the area, although two dirigibles did
attempt to reach the building before the entire idea was dropped. In December 1930, the U.S.
Navy dirigible Los Angeles approached the mooring mast but could not get close enough to tie
up because of forceful winds. Fearing that the wind would blow the dirigible onto the sharp
spires of other buildings in the area, which would puncture the dirigible’s shell, the captain could
not even take his hands off the control levers.
Two weeks later, another dirigible, the Goodyear blimp Columbia, attempted a publicity stunt
where it would tie up and deliver a bundle of newspapers to the Empire State Building. Because
the complete dirigible mooring equipment had never been installed, a worker atop the mooring
mast would have to catch the bundle of papers on a rope dangling from the blimp. The papers
were delivered in this fashion, but after this stunt the idea of using the mooring mast was
shelved. In February 1931, Irving Clavan of the building’s architectural office said, “The as yet
unsolved problems of mooring air ships to a fixed mast at such a height made it desirable to
postpone to a later date the final installation of the landing gear.”
By the late 1930s, the idea of using the mooring mast for dirigibles and their passengers had
quietly disappeared. Dirigibles, instead of becoming the transportation of the future, had given
way to airplanes. The rooms in the Empire State Building that had been set aside for the
ticketing and baggage of dirigible passengers were made over into the world’s highest soda
fountain and tea garden for use by the sightseers who flocked to the observation decks. The
highest open observation deck, intended for disembarking passengers, has never been open to
the public.
“The Mooring Mast” by Marcia Amidon Lüsted, from The Empire State Building. Copyright © 2004
by Gale, a part of Cengage Learning, Inc.
Prompt
Based on the excerpt, describe the obstacles the builders of the Empire State Building faced in
attempting to allow dirigibles to dock there. Support your answer with relevant and specific
information from the excerpt.
133
B7: Essay Prompt # 7
Type of Essay: Expository
Grade level: 7
Rubric: Composite
Score Range: 0-12
Prompt
Write about patience. Being patient means that you are understanding and tolerant. A patient
person experience difficulties without complaining.
Do only one of the following: write a story about a time when you were patient OR write a story
about a time when someone you know was patient OR write a story in your own way about
patience.

134
B8: Essay Prompt # 8
Type of Essay: Narrative
Grade level: 10
Rubric: Composite
Score Range: 0-30
Prompt
We all understand the benefits of laughter. For example, someone once said, “Laughter is the
shortest distance between two people.” Many other people believe that laughter is an important
part of any relationship. Tell a true story in which laughter was one element or part.

135
Appendix C: Letter from Research Ethics Board

136
Appendix D: Agreement and Distributional Measures for the State-of-the-art AES systems
Table D1
Exact Agreement Percentages from State of the art AES systems, based on Shermis (2014)
Essay
prompt
Training
samples
Test
samples
Mean
words H1H2 MM PKT ETS AIR CMU CTB PM VL MI
1 1785 589 366.40 0.64 0.31 0.43 0.42 0.44 0.44 0.44 0.43 0.47 0.46
2a 1800 600 381.19 0.76 0.55 0.64 0.69 0.68 0.64 0.70 0.68 0.70 0.70
2b 1800 600 381.19 0.73 0.55 0.66 0.69 0.68 0.59 0.66 0.67 0.69 0.66
3 1726 568 108.69 0.72 0.63 0.61 0.69 0.68 0.70 0.66 0.69 0.69 0.72
4 1772 586 94.39 0.76 0.47 0.60 0.66 0.65 0.68 0.64 0.64 0.70 0.72
5 1805 601 122.29 0.59 0.47 0.68 0.65 0.71 0.67 0.68 0.65 0.71 0.68
6 1800 600 153.64 0.63 0.51 0.64 0.62 0.67 0.61 0.63 0.68 0.69 0.69
7 1730 495 171.28 0.28 0.07 0.09 0.12 0.10 0.15 0.12 0.12 0.12 0.17
8 918 304 622.13 0.29 0.08 0.14 0.17 0.12 0.26 0.23 0.20 0.10 0.16
Average Exact agreement % 0.40 0.50 0.52 0.53 0.53 0.53 0.53 0.54 0.55
AIR—American Institutes for Research
MM—MetaMetrics
CMU—TELEDIA, Carnegie Mellon University
PKT—Pearson Knowledge Technologies
CTB—CTB McGraw-Hill
PM—Pacific Metrics
ETS—Educational Testing Service
VL—Vantage Learning
MI—Measurement, Inc.

137
Table D2
Distributional details from Shermis (2014)
Essay
prompt
Training
samples
Test
samples
Mean
words MeanRS-Human SDRS-Human MeanMM SDMM SMSDMM MeanMI SDMI SMSDMI
1 1785 589 366.40 8.62 1.54 8.56 1.57 -0.04 8.53 1.51 -0.06
2a 1800 600 381.19 3.41 0.77 3.33 0.83 -0.10 3.37 0.69 -0.05
2b 1800 600 381.19 3.32 0.75 3.26 0.80 -0.08 3.21 0.84 -0.14
3 1726 568 108.69 1.90 0.85 1.91 0.81 0.01 1.95 0.89 0.06
4 1772 586 94.39 1.51 0.95 1.46 1.12 -0.05 1.48 0.86 -0.03
5 1805 601 122.29 2.51 0.95 2.44 1.08 -0.07 2.51 1.08 0.00
6 1800 600 153.64 2.75 0.87 2.74 1.06 -0.01 2.76 0.95 0.01
7 1730 495 171.28 20.13 5.89 19.63 6.51 -0.08 19.80 6.43 -0.05
8 918 304 622.13 36.67 5.19 37.54 5.91 0.16 37.23 5.38 0.11
( ) √( ) where, is the mean of machine scores, is the mean of human scores, is
variance of machine scores, and is variance of human scores. The −ve SMSD
means severe AESscore , and ve SMSD represents lenient AESscore.
RS-Human— Resolved Human Score
MM—MetaMetrics
MI—Measurement, Inc.
SMSD—Standardized Mean Score Difference
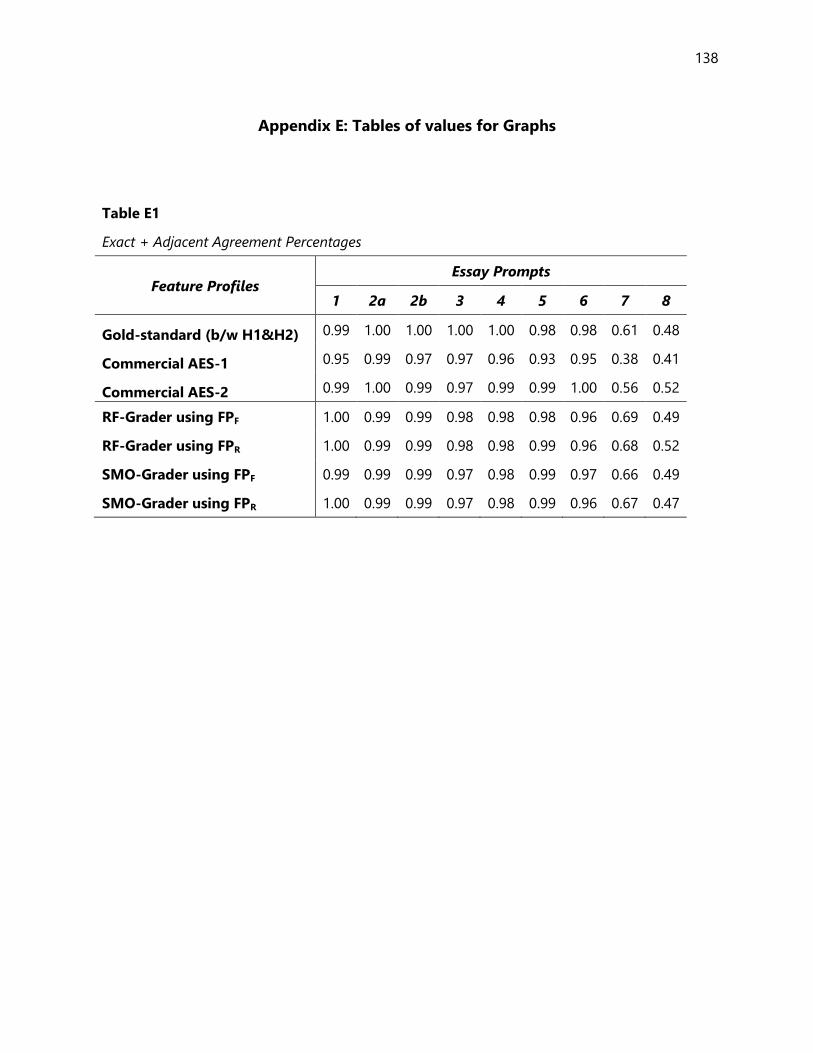
138
Appendix E: Tables of values for Graphs
Table E1
Exact + Adjacent Agreement Percentages
Feature Profiles Essay Prompts
1 2a 2b 3 4 5 6 7 8
Gold-standard (b/w H1&H2) 0.99 1.00 1.00 1.00 1.00 0.98 0.98 0.61 0.48
Commercial AES-1 0.95 0.99 0.97 0.97 0.96 0.93 0.95 0.38 0.41
Commercial AES-2 0.99 1.00 0.99 0.97 0.99 0.99 1.00 0.56 0.52
RF-Grader using FPF 1.00 0.99 0.99 0.98 0.98 0.98 0.96 0.69 0.49
RF-Grader using FPR 1.00 0.99 0.99 0.98 0.98 0.99 0.96 0.68 0.52
SMO-Grader using FPF 0.99 0.99 0.99 0.97 0.98 0.99 0.97 0.66 0.49
SMO-Grader using FPR 1.00 0.99 0.99 0.97 0.98 0.99 0.96 0.67 0.47

139
Table E2
Exact Agreement Percentages
Feature Profiles Essay Prompts
1 2a 2b 3 4 5 6 7 8
Gold-standard (b/w H1&H2) 0.63 0.77 0.79 0.76 0.78 0.57 0.62 0.29 0.27
Commercial AES-1 0.31 0.55 0.55 0.63 0.47 0.47 0.51 0.07 0.08
Commercial AES-2 0.46 0.70 0.66 0.72 0.72 0.68 0.69 0.17 0.16
RF-Grader using FPF 0.71 0.67 0.68 0.69 0.63 0.67 0.61 0.32 0.28
RF-Grader using FPR 0.71 0.68 0.67 0.68 0.64 0.69 0.61 0.33 0.29
SMO-Grader using FPF 0.68 0.64 0.66 0.66 0.63 0.65 0.62 0.28 0.29
SMO-Grader using FPR 0.70 0.66 0.67 0.68 0.63 0.66 0.60 0.32 0.28

140
Table E3
Kappa values
Feature Profiles Essay Prompts
1 2a 2b 3 4 5 6 7 8
Gold-standard (b/w H1&H2) 0.42 0.62 0.66 0.63 0.68 0.41 0.46 0.17 0.14
Commercial AES-1 0.16 0.30 0.27 0.45 0.30 0.28 0.31 0.03 0.04
Commercial AES-2 0.33 0.51 0.46 0.59 0.60 0.56 0.55 0.12 0.10
RF-Grader using FPF 0.53 0.45 0.45 0.53 0.48 0.54 0.40 0.21 0.12
RF-Grader using FPR 0.54 0.46 0.43 0.52 0.49 0.56 0.41 0.23 0.14
SMO-Grader using FPF 0.47 0.39 0.42 0.48 0.47 0.51 0.42 0.17 0.13
SMO-Grader using FPR 0.50 0.42 0.44 0.51 0.48 0.52 0.38 0.22 0.10

141
Table E4
Quadratic Weighted Kappa
Feature Profiles Essay Prompts
1 2a 2b 3 4 5 6 7 8
Gold-standard (b/w H1&H2) 0.71 0.80 0.81 0.79 0.85 0.75 0.77 0.73 0.63
Commercial AES-1 0.66 0.62 0.55 0.65 0.67 0.64 0.65 0.58 0.63
Commercial AES-2 0.82 0.72 0.70 0.75 0.82 0.83 0.81 0.84 0.73
RF-Grader using FPF 0.76 0.64 0.64 0.69 0.73 0.79 0.66 0.72 0.59
RF-Grader using FPR 0.77 0.65 0.61 0.69 0.73 0.80 0.68 0.74 0.63
SMO-Grader using FPF 0.71 0.59 0.60 0.67 0.72 0.78 0.70 0.71 0.42
SMO-Grader using FPR 0.73 0.61 0.63 0.68 0.73 0.78 0.65 0.70 0.44

142
Table E5
Pearson Correlation Values
Feature Profiles Essay Prompts
1 2a 2b 3 4 5 6 7 8
Gold-standard (b/w H1&H2) 0.71 0.80 0.81 0.79 0.85 0.75 0.77 0.73 0.63
Commercial AES-1 0.66 0.62 0.55 0.65 0.68 0.65 0.66 0.58 0.62
Commercial AES-2 0.82 0.72 0.71 0.75 0.82 0.84 0.81 0.84 0.73
RF-Grader using FPF 0.77 0.66 0.64 0.70 0.73 0.79 0.69 0.73 0.64
RF-Grader using FPR 0.78 0.67 0.63 0.70 0.74 0.80 0.71 0.75 0.66
SMO-Grader using FPF 0.73 0.60 0.62 0.67 0.73 0.78 0.73 0.72 0.46
SMO-Grader using FPR 0.75 0.63 0.64 0.68 0.73 0.79 0.69 0.71 0.50