Embed Size (px)
Citation preview
RESEARCH PAPER
Development and validation of single particle ICP-MSfor sizing and quantitative determination of nano-silverin chicken meat
Ruud J. B. Peters & Zahira Herrera Rivera & Greet van Bemmel &Hans J. P. Marvin & Stefan Weigel & Hans Bouwmeester
Received: 30 September 2013 /Revised: 7 December 2013 /Accepted: 10 December 2013# Springer-Verlag Berlin Heidelberg 2014
Abstract The application of nanomaterials is leading toinnovative developments in industry, agriculture, consumerproducts, and food and related sectors. However, due to thespecial properties of these materials there are concernsabout their safety, especially because of our limited knowl-edge of human health effects and the fact that constantlynew nanomaterials and applications thereof are being pro-duced. The development of analytical techniques is a keyelement to understand the benefits as well as the risks of theapplication of such materials. In this study, a method isdeveloped and validated for sizing and quantifying nano-silver in chicken meat using single particle inductivecoupled plasma mass spectrometry (ICP-MS). Samplesare processed using an enzymatic digestion followed bydilution of the digest and instrumental analysis of the dilut-ed digest using single particle ICP-MS. Validation of themethod in the concentration of 5–25 mg/kg 60-nm silvernanoparticles showed good performance with respect totrueness (98–99 % for size, 91–101 % for concentration),repeatability (<2 % for size, <11 % for concentration), andreproducibility (<6 % for size, <16 % for concentration).The response of the method is linear, and a detection limitas low as 0.1 mg/kg can be obtained. Additional experi-ments showed that the method is robust and that digests arestable for 3 weeks at 4 °C. Once diluted for single particleICP-MS analysis, the stability is limited. Finally, it wasshown that nano-silver in chicken meat is not stable. Silver
nanoparticles dissolved and were transformed into silversulfide. While this has implications for the form in whichnano-silver will be present in real-life meat samples, thedeveloped method will be able to determine the presenceand quantity of nanoparticle silver in such samples.
Keywords Single particle ICP-MS . Nanoparticles .
Nano-silver . Method validation
Introduction
The application of nanotechnology offers substantialprospects for the development of innovative productsand applications, and it is expected that the number ofproducts and production volumes involving nanotechnol-ogy will increase in the future. Because of the uniquefunctional properties of nanoparticles (NPs), these mate-rials are being used by many industries, including thefood and agricultural sectors [1–6]. While most of thesematerials are used in the industry, an increasing numberof consumer products that contain NPs can already befound on the market. These include electronics, house-hold and cleaning products, paints and coatings, sportproducts and textiles, cosmetics and personal care prod-ucts, food products, and food packaging materials. Inorder to understand how many products containing NPsare already available to consumers, a comprehensivedatabase on types and uses of such NPs would beuseful. Since 2006, there is a voluntary database, theWoodrow Wilson Inventory, that is accessible for con-sumers [7]. More than half of the products in theWoodrow Wilson Inventory contain nano-silver, andalthough this is by volume not the most used material,it is the fastest growing application of NPs. Nano-silver
Published in the topical collection Characterisation of Nanomaterials inBiological Sampleswith guest editors Heidi Goenaga-Infante and Erik H.Larsen.
R. J. B. Peters (*) : Z. H. Rivera :G. van Bemmel :H. J. P. Marvin : S. Weigel :H. BouwmeesterRIKILT, Wageningen University Research, P.O. Box 230,6700 AE Wageningen, The Netherlandse-mail: [email protected]
Anal Bioanal ChemDOI 10.1007/s00216-013-7571-0
is used in food supplements, in food packaging as anantimicrobial, in non-food products as toothpaste, and intextiles as an anti-odorant. The silver NPs are added tofood packaging materials in several ways, for instance,as finely dispersed nano-silver particles embedded inshrink films, storage boxes, cutting boards containers,and coatings [8–11] (http: / / factory.dhgate.com/metallized-film/nano-silver-antimicrobial-cling-film-bag-p47593893.html, http://www.gaswatch.com/products/13%22-x-11%22-Antimicrobial-Round-Cutting-Board.html,http:/ /hznano.en.alibaba.com/product/605559706-213764856/Nano_silver_antimicrobial_Storage_Box_manufacturer.html), as a silver-based zeolite inpolylactic acid bio-composites [12, 13], and as gelatin-silver nano-composites [14]. Patents also mention theuse of silver to prepare antibacterial wheat flour and asan animal feed product [15]. More recently, silver hasbeen studied as an alternative for the antibiotics used inthe poultry production [16, 17] and as a nano-agent tocontrol the microbial load in cow milk [18].
Due to the special properties of NPs, there are concernsabout their safety, especially because of our limited knowl-edge of human health effects of these materials and the factthat constantly new NPs and applications thereof are beingproduced. The development of analytical techniques is a keyelement to understand the benefits as well as the risks of theapplication of NPs [19–21]. Currently, separation techniquesas hydrodynamic chromatography (HDC) and field flow frac-tionation (FFF) are used to determine NPs in combinationwith detectors such as multiple angle light scattering(MALS) and inductive coupled plasma mass spectrometry(ICP-MS) [22–25]. Since detection limits of these combinedtechniques are in the low milligram per liter range, samplepreparation and analyte concentration steps are often requiredprior to instrumental analysis. However, even fewer methodsare available for sample preparation, and those which areavailable are often difficult and time consuming. We studieda relatively new approach, single particle ICP-MS (sp-ICP-MS), as an innovative method for detection and characteriza-tion of silver NPs in chicken meat with limited sample prep-aration [26, 27]. In addition, sp-ICP-MS is compatible withthe recently adopted European Commission recommendationfor the definition of nanomaterials, Commission Recommen-dation 2011/696/EU [28], which states that a particle number-based instead of a mass-based analytical technique should beused. The potential application of silver NPs in the agri-cultural sector, especially as an antibiotic in poultry pro-duction, and in many food-related materials might result inthe presence of silver NPs in food. Therefore, silver NPsin chicken meat was selected as target analyte and matrixfor the development and validation of an analytical meth-od using sp-ICP-MS as the instrumental technique. Al-though very recently the extraction and analysis in
biological tissues has been described [29], we believe thisstudy to be the first full method validation study using sp-ICP-MS for the sizing and quantification of silver NPs ina food matrix.
Materials and methods
Standards, chemicals, and reagents
Gold NPs, RM8013, is a reference material obtained fromNIST (Boulder, CO, USA) and consists of a suspension ofgold NPs with a mass concentration of 50 mg/L stabilized in acitrate buffer. These particles have a spherical shape and adiameter of 60 nm. A 50-μg/L stock standard of the 60-nmgold NPs is prepared by diluting 50 μL of RM8013 to 50 mLwith Milli-Q water in a glass measuring flask. Stored at roomtemperature in amber glass screw necked vials, this standard isstable for at least 1 month. Prior to use, the standard issonicated for 10min. For the determination of the nebulizationefficiency, a 50-ng/L working standard is prepared by diluting50 μL of the stock standard to 50 mL with Milli-Q water in a50-mL glass measuring flask. Although this standard is stableat room temperature for several days, it is prepared daily. Anionic silver standard, Ag 100 mg/L, was obtained fromMerck(Darmstadt, Germany). Stock standards of 100 μg/L wereprepared by diluting 50 μL of the standard to 50 mL withMilli-Q water. Protected from light, this standard is stable atroom temperature for at least 2 weeks. Calibration standards inthe concentration range of 0.2–5 μg/L were prepared bydiluting the ionic stock standard further in Milli-Q water.Protected from light, these standards are stable at room tem-perature for at least 1 week. Silver NPs, BioPure EAW 1093,were obtained from nanoComposix (San Diego, CA, USA)and consisted of a suspension of silver NPs with a massconcentration of 1,000 mg/L stabilized in a citrate buffer.These particles have a spherical shape and a diameter of60 nm. A fortification standard of 50 mg/L was prepared bydiluting 250 μL of the EAW 1093 to 5 mLwithMilli-Q water.Stored at room temperature in amber glass screw necked vialsand in the dark, this standard is stable for at least 2 weeks.Prior to use, the standard was placed in an ultrasonic bath for10 min. Proteinase K, 822 μ/mL, was obtained fromFermentas (Fisher Scientific, Landsmeer, The Netherlands).The digestion buffer consists of 10 mMTris buffer, 1 % TritonX-100, and 1 mM calcium acetate at pH 9.5. Triton X-100 andcalcium acetate monohydrate (Ca(CH3CO2)2 · H2O) wereobtained from Sigma-Aldrich (St. Louis, MO, USA), and Trisbuffer (hydroxymethyl aminomethane, H2NC(CH2OH)3) wasobtained from Merck (Darmstadt, Germany). The digestionbuffer is prepared by dissolving 600 mg of Tris buffer and90 mg of calcium acetate monohydrate in 200 mL of Milli-Qwater. Of Triton X-100, 5 mL is added to the solution and
R.J.B. Peters et al.
mixed with a magnetic stirrer until completely dissolved. Thissolution is further diluted with Milli-Q water until a finalvolume of 500 mL. A Milli-Q-Plus ultrapure water systemfrom Millipore (Amsterdam, The Netherlands) was used toobtain high purity water used during sample preparation anddilution of standards and sample suspensions.
Samples and sample processing
The chicken meat for the validation study was purchased froma local supermarket. A 200-mg subsample was collected, cutinto small pieces with a surgical knife, and brought into a10-mL PE tube. The subsample in the tube was fortified with a50-mg/L aqueous suspension of the 60-nm Ag NPs at 5, 10,and 25 mg/kg. Enzymatic digestion of the sample was carriedout in two steps. First, 4 mL of the digestion buffer is added,and the sample is vigorously vortexed for 1 min and sonicated(tip sonication) at 4-W power for 5 min. During sonication,the sample tube is placed in an ice bath to avoid an increase ofthe sample temperature. Second, 25 μL of proteinase K isadded, and the tube is incubated for 3 h at 35 °C. After coolingto room temperature, the digest is diluted 100,000 times andmeasured using sp-ICP-MS.
Instrumental analysis
The ICP-MS used in this study is a Thermo Scientific Xseries 2 equipped with a conical glass concentric nebu-lizer and a quartz impact bead spray chamber. The ICP-MS is operated at a forward power of 1,400 W, and thegas flows were at the following settings: plasma, 13 L/min; nebulizer, 1.1 L/min; and auxiliary, 0.7 L/min. Thesample flow rate to the nebulizer was set at 1.0 mL/minusing the integrated peristaltic pump. Data acquisitionwas done using the Thermo PlasmaLab software in thetime resolved analysis (TRA) mode. The dwell time wasset at 3 ms with total acquisition time of 60 s permeasurement. Because of the short dwell time, it is notpossible to switch between different m/z values(switching itself takes ~50 ms for the instrument used),and therefore, only one isotope is monitored during themeasurement. Isotopes measured for gold (for the deter-mination of the nebulization efficiency) and silver werem/z 197 and 107, respectively. Note that polyatomicinterferences are possible, e.g., 91Zr16O for 107Ag; how-ever, considering that the interference is not an NP, itwill result in a continuous background signal and canthus be distinguished from the discontinuous NP signals.A typical sample series consists of system blanks (Milli-Q water), a 50-ng/L gold-NP standard to determine thenebulization efficiency, ionic silver standards in the con-centration range of 0.2–5 μg/L for calibration, the dilutedsample suspensions including method blanks and matrix-
matched recovery standards (MMRS, a processed blanksample to which the analyte is added just before theinstrumental analyses). The procedure for particle num-ber and particle size calibration is comparable to methodsdescribed earlier by Pace et al. [30] and Tuoriniemi et al.[31].
Data processing and calculations
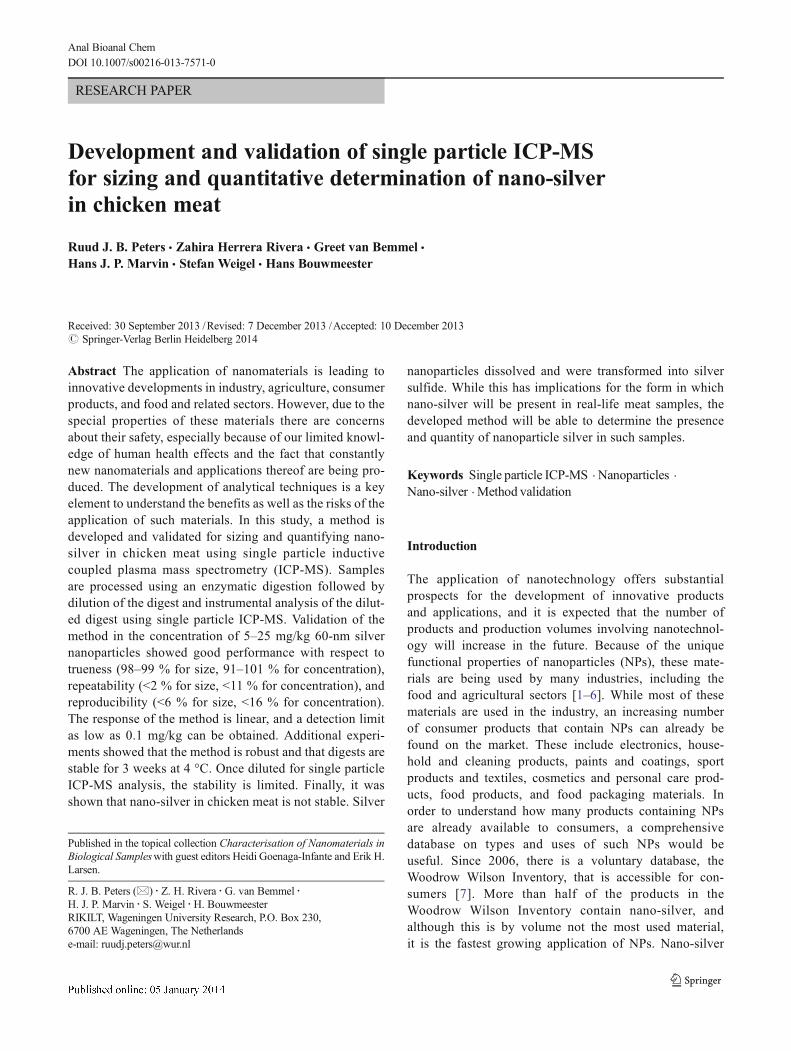
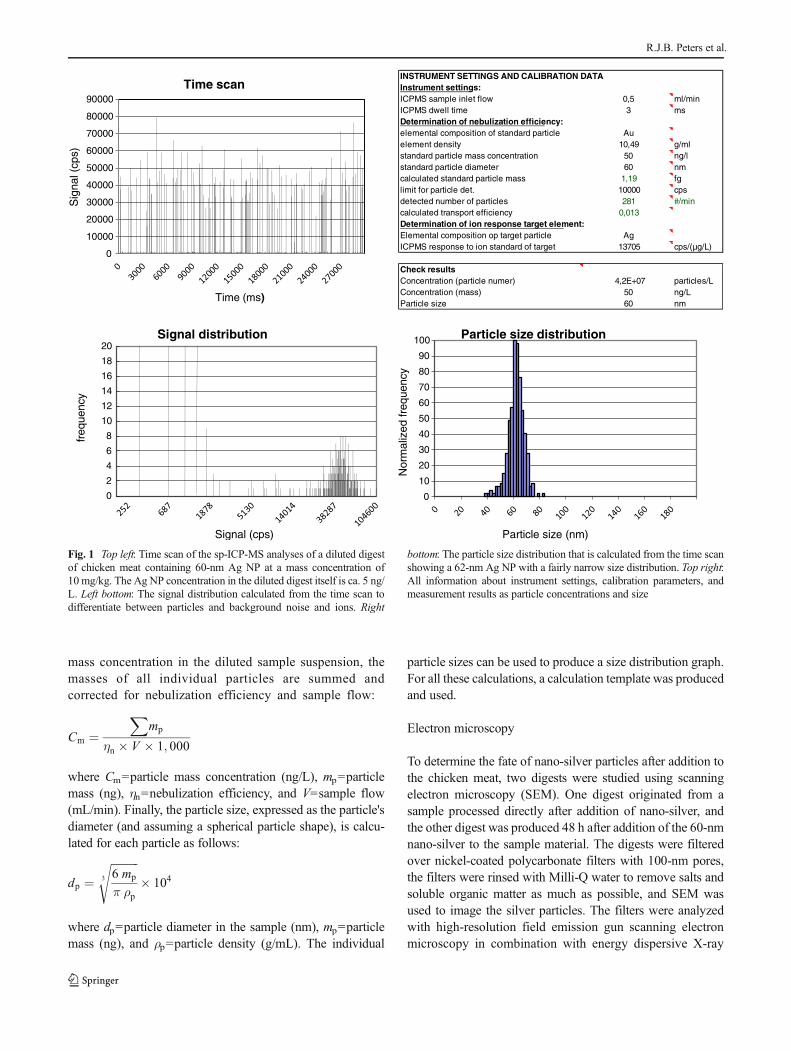
Data are transferred to and processed in Microsoft Excel forthe calculation of particle concentrations, particle sizes, andparticle size distributions. Acquiring data for 60 s at adwell time of 3 ms results in 20,000 data pointsconsisting of background signals (ions of the sameelement, isobaric ions, polyatomic interferences, andinstrument noise) and signals with a much higher inten-sity originating from particles. These particle signals areisolated from the background by plotting a signal dis-tribution, i.e., the frequency with which a signal heightoccurs as a function of that signal height. This allows adetermination of a cutoff point to separate backgroundsignals from particle signals (see Fig. 1 for an example).From the number of the particle signals in the time scanand the nebulization efficiency, the particle number con-centration in the diluted sample suspension is calculatedas follows:
Cp ¼ Np
ηn� 1; 000
V
where Cp=particle number concentration (L−1), Np=number of particles detected in the time scan (min−1),ηn=nebulization efficiency, and V=sample input flow(mL/min). The same formula is used to calculate thenebulization efficiency after measuring the 50-ng/L 60-nm gold nanoparticle suspension. In that case, the par-ticle number concentration Cp is known (50 ng/L of a60-nm gold particle results in 2×10⁷ particles per liter),and the nebulization efficiency is calculated from theobserved number of particles Np in the time scan. Fromthe intensity of the particle signals and the responsefactor calculated from the ionic silver calibration stan-dards, the mass of the individual particles is calculatedas follows:
mp ¼ Ip tdRF ion
� V ηn60
where mp=particle mass (ng), Ip=particle signal intensityin the sample (cps), RFion=ICP-MS response factor fromthe calibration curve of the ionic silver standards (cps/μg/L), td=dwell time (s), V=sample flow (mL/min), andηn=nebulization efficiency. To calculate the particle
Development and validation of single particle ICP-MS
mass concentration in the diluted sample suspension, themasses of all individual particles are summed andcorrected for nebulization efficiency and sample flow:
Cm ¼X
mp
ηn � V � 1; 000
where Cm=particle mass concentration (ng/L), mp=particlemass (ng), ηn=nebulization efficiency, and V=sample flow(mL/min). Finally, the particle size, expressed as the particle'sdiameter (and assuming a spherical particle shape), is calcu-lated for each particle as follows:
dp ¼ffiffiffiffiffiffiffiffiffiffi6 mp
π ρp
3
s� 104
where dp=particle diameter in the sample (nm), mp=particlemass (ng), and ρp=particle density (g/mL). The individual
particle sizes can be used to produce a size distribution graph.For all these calculations, a calculation template was producedand used.
Electron microscopy
To determine the fate of nano-silver particles after addition tothe chicken meat, two digests were studied using scanningelectron microscopy (SEM). One digest originated from asample processed directly after addition of nano-silver, andthe other digest was produced 48 h after addition of the 60-nmnano-silver to the sample material. The digests were filteredover nickel-coated polycarbonate filters with 100-nm pores,the filters were rinsed with Milli-Q water to remove salts andsoluble organic matter as much as possible, and SEM wasused to image the silver particles. The filters were analyzedwith high-resolution field emission gun scanning electronmicroscopy in combination with energy dispersive X-ray
0
10000
20000
30000
40000
50000
60000
70000
80000
90000
Sig
nal (
cps)
Time (ms)
Time scanINSTRUMENT SETTINGS AND CALIBRATION DATAInstrument settings:ICPMS sample inlet flow 0,5 ml/minICPMS dwell time 3 msDetermination of nebulization efficiency:elemental composition of standard particle Auelement density 10,49 g/mlstandard particle mass concentration 50 ng/lstandard particle diameter 60 nmcalculated standard particle mass 1,19 fglimit for particle det. 10000 cps detected number of particles 281 #/mincalculated transport efficiency 0,013Determination of ion response target element:Elemental composition op target particle AgICPMS response to ion standard of target 13705 cps/(µg/L)
Check resultsConcentration (particle numer) 4,2E+07 particles/LConcentration (mass) 50 ng/LParticle size 60 nm
0
2
4
6
8
10
12
14
16
18
20
freq
uenc
y
Signal (cps)
Signal distribution
0
10
20
30
40
50
60
70
80
90
100
Nor
mal
ized
freq
uenc
y
Particle size (nm)
Particle size distribution
Fig. 1 Top left: Time scan of the sp-ICP-MS analyses of a diluted digestof chicken meat containing 60-nm Ag NP at a mass concentration of10 mg/kg. The Ag NP concentration in the diluted digest itself is ca. 5 ng/L. Left bottom: The signal distribution calculated from the time scan todifferentiate between particles and background noise and ions. Right
bottom: The particle size distribution that is calculated from the time scanshowing a 62-nm Ag NP with a fairly narrow size distribution. Top right:All information about instrument settings, calibration parameters, andmeasurement results as particle concentrations and size
R.J.B. Peters et al.
analysis (FEG-SEM/EDX). The microscope is a TescanMIRA-LMH FEG-SEM (Cranberry Twp, PA, USA) operatedat an accelerating voltage of 15 kV, working distance 10 mm,spot size 5 nm, and magnification 5.000 to 50.000 times. TheEDX spectrometer is a Bruker AXS spectrometer with aQuantax 800 workstation and an XFlash 4010 detector.
Result and discussion
General considerations
Sample pretreatment Sample preparation techniques are re-quired to isolate NPs from complex media and to prepare aparticle suspension suitable for instrumental analysis. Fewsample preparation techniques are described in the literature,and what is described is strongly related to the type of NP thatis being determined. Helsper et al. describe the isolation oforganic NPs in beverages using only aqueous media andphysical techniques because organic NPs are essentially mi-celles that are easily disrupted [32]. On the other hand, Weiret al. used strong acids and elevated temperatures to destroythe sample matrix and isolate relatively inert titanium dioxideparticles from food matrices [33]. Ag NPs, however, canundergo many reactions such as dissolution by molecularoxygen and protons [34], reactions with reduced sulfur speciesand chloride [35, 36], and binding with proteins [37]. To avoidsuch reactions, care has to be taken during sample preparation,and a relatively soft digestion technique, enzymatic digestionusing proteinase K, has been selected for this study. To facil-itate the digestion process, the sample is sonicated before theaddition of the proteinase K, and the use of chlorine in theenzyme buffer is avoided. Following digestion, the digest isdiluted with Milli-Q water for analysis with single particleICP-MS.
A general problem in method development and validation isthe availability of representative materials that actually containthe analyte of interest, i.e., a reference material. Because noreferencematerial or well-defined samplematerial exists for AgNPs determination in chicken meat or any other food item,spiked samples are used throughout this validation study. Thespikes consist of suspensions of a well-known characterized AgNPs and are added at the start of the analytical procedure to thesample matrix, generally minced chicken meat. Another pointof consideration here is the minimum size of the analyticalsample. In a recent article, Linsinger et al. compare the numberof NPs per gram of sample to the number of mycotoxinmolecules in a sample at the EU maximum residue limit [38].They concluded that the situation for NPs is comparable withthat for molecules and that usual sample sizes are large enough.In addition, they mention that the minimum number of NPs inthe sample should be 500 to limit the sampling error of theparticle size distribution. Another approach suggested by Peters
et al. is to use of Gy's equation to determine the minimumsample size to reach a certain analytical accuracy [39]. Al-though Gy's sampling theory is hard to digest, theoreticalcalculations show that a sample size of only 0.01 g of a samplecontaining 100-nm Ag NPs with a particle mass concentrationof 1 mg/kg is sufficient to achieve an analytical accuracy betterthan 10%. In addition, a 0.01-g sample of this material contains10 ng of 100-nm Ag NPs, each having an individual mass ofabout 5 fg. The number of particles in the sample is thus 2×10⁶,far more than the minimum required number of 500 mentionedby Linsinger et al.
Instrumental analyses The determination of NPs presentsanalytical challenges different from usual analytical methods,because not only the presence and amount of a substance hasto be determined, but also the size of the particles to determinewhether it is nano or not. The recent EU definition ofnanomaterials complicates things further because it defines amaterial as a nanomaterial if 50 % or more of the particles inthe number size distribution have one or more external dimen-sions in the size range of 1–100 nm [28]. This means thatmeasuring only size is not enough, but a number-based sizedistribution has to be determined. Dynamic light scattering(DLS) and electron microscopy (EM) are two methods thatcan be used to determine number-based size distributionsdirectly. However, DLS produces poor results if other particlesor even proteins are present in the sample. Moreover, DLS isnot able to determine the identity of the particles and can thusnot differentiate between the particles of interest and otherparticles that may be present in the sample. EM suffers thesame problem although identity may be determined if addi-tional techniques as energy dispersive X-ray spectroscopy areused. Nevertheless, a huge number of particles have to bemeasured, and the preparation of an EM sample may also leadto distortion of the true particle size due to the formation ofaggregates. Single particle ICP-MS (sp-ICP-MS) is an alter-native that is gaining much interest as a promising new mea-surement method for the detection and quantification of NPs[40]. In sp-ICP-MS, the sample, an aqueous suspension con-taining the particles to be analyzed, is introduced continuouslyinto an ICP-MS system that acquires data with a high timeresolution. Following nebulization, a fraction of the NPs enterthe plasma where they are vaporized and the individual atomsionized resulting in a cloud of ions. This cloud of ions issampled by the mass spectrometer and detected as a signalpulse in the detector. A typical run time is 60 s and produces atime scan. The number of pulses detected per second isdirectly proportional to the particle number concentration inthe sample while the intensity of the signal pulse is directlyproportional to the mass of the detected nanoparticle. Assum-ing a certain particle shape (e.g., spheres) and composition(i.e., Ag), one can calculate the diameter of the particle. Themethod has the advantage of being fast, particle number based
Development and validation of single particle ICP-MS
and, by virtue of the mass spectrometric detection, very selec-tive. Additionally, it is very sensitive with detection limits inthe order of 1 ng/L. Naturally, its applicability is limited toparticles of well-defined composition, as otherwise no relationbetween size and signal exists. The method also shares withbasically all methods the feature that it cannot distinguishbetween single and constituent particles. Nevertheless, sincesp-ICP-MS produces a number-based size distribution, it is auseful screening method for the implementation of the EUdefinition for nanomaterials.
The advantage that most current ICP-MS instruments canbe used for sp-ICP-MS is limited by the lack of data process-ing software. For this purpose, we developed a macro andstandard spreadsheet in Microsoft Excel to calculate particlesize, particle size distributions, and mass- and number-basedparticle concentrations. Figure 1 shows a screenshot of theExcel spreadsheet that is used throughout this study.
Method validation Newly developed methods have to bevalidated before they can be used in official control studiesof foodstuffs. The validation procedure for the determinationof residues in foodstuffs from animal origin is described in EUCommission Decision 2002/657/EC. Although the guidelinewas originally devised for molecular analytes, there is noreason why it should not be used for validation of methodsfor NP. Following the guideline means that typically over 100analyses have to be performed for the determination of line-arity, CCα, CCβ, trueness, repeatability, and reproducibility.The strategy in this study is to perform seven replicate anal-yses at three concentration levels on three different days. Todetermine linearity, a seven-point concentration curve ofmatrix-matched Ag NP standards is included on each of thesedays. A scheme of the used validation setup is given inTable 1.
An additional number of samples is analyzed for the deter-mination of selectivity, robustness, and stability. Selectivity isthe extent to which other substances interfere with the deter-mination of the analyte, i.e., the Ag NP. To determine selec-tivity against matrix constituents, a total of 21 blank samplesare analyzed by inclusion of seven blank matrices on eachvalidation day. There is no need to determine the selectivitytowards other non-silver NPs since the ICP-MS detectionitself is highly selective because in sp-ICP-MS the instrumentis tuned to only 1m/z value. Actually, because of the high timeresolution, only 1 m/z value can be measured with the cur-rently available ICP-MS instruments. The method is also
selective towards the presence of non-nano forms of the sameelement, e.g., Ag ions, because of the high dilution that has tobe applied to observe the single particles. If Ag ions arepresent in high concentrations, particles can still be observedin the time scan as spikes superimposed on a continuousbackground signal of ions. The robustness of the method isdetermined by changing a number of parameters that arebelieved to affect the measurement results. The variablestested in this study were the sonication time, the digestiontime and temperature, and the dilution factor before instru-mental analysis. The stability refers to the shelf life of pre-pared sample materials, digests and diluted digests, and isdetermined by applying different equilibration times afterspiking and re-analyzing materials prepared on the first vali-dation day on the second validation day.
Validation results
Repeatability, reproducibility, and trueness The repeatability,reproducibility, and trueness are determined by spiking blanksamples at three concentration levels, 0.5, 1.0, and 2.5 timesthe validation level (VL), and analyzing these in sevenfold onthree different days that were eachmore than 1 week apart. VLwas set at 10 mg/kg. The measurement data are evaluated forparticle diameter and for particle number- and particle mass-based concentration using ANOVA analysis. The results forrepeatability, reproducibility, and trueness are given inTable 2.
The results for trueness indicate that the average values thatare obtained for the parameters are close to expected values atall three validation levels. The repeatability and reproducibility,both expressed as relative standard deviations, are within 10 %with the exception of the particle number and particle massconcentrations at the 0.5VL level. This is not surprising since inall cases the same dilution factor is used before sp-ICP-MSanalyses resulting in lower particle numbers at the 0.5VL leveland hence a lower repeatability. Because the NP materials inthis study have a relatively narrow size distribution, the averageparticle diameter does not depend on the number of particlesobserved; hence, the repeatability and reproducibility are com-parable at all validation levels. The relatively large differencebetween RSDr and RSDRL follows from the fact that the resultson different days show larger differences. Apparently, the re-peatability of the size measurement is much better than thereproducibility of the preparation of the ionic calibrationstandards.
Table 1 Experimental design forthe validation study
Additional measurements areperformed to determine robust-ness and stability
Day Linearity Trueness/RSDr/RSDRL CCα/CCβ Recovery Selectivity/specificity Total analysis
1 7 0.5VL, 1.0VL, 2.5VL times 7 1 7 blanks 36
2 7 0.5VL, 1.0VL, 2.5VL times 7 1 7 blanks 36
3 7 0.5VL, 1.0VL, 2.5VL times 7 1 7 blanks 36
R.J.B. Peters et al.
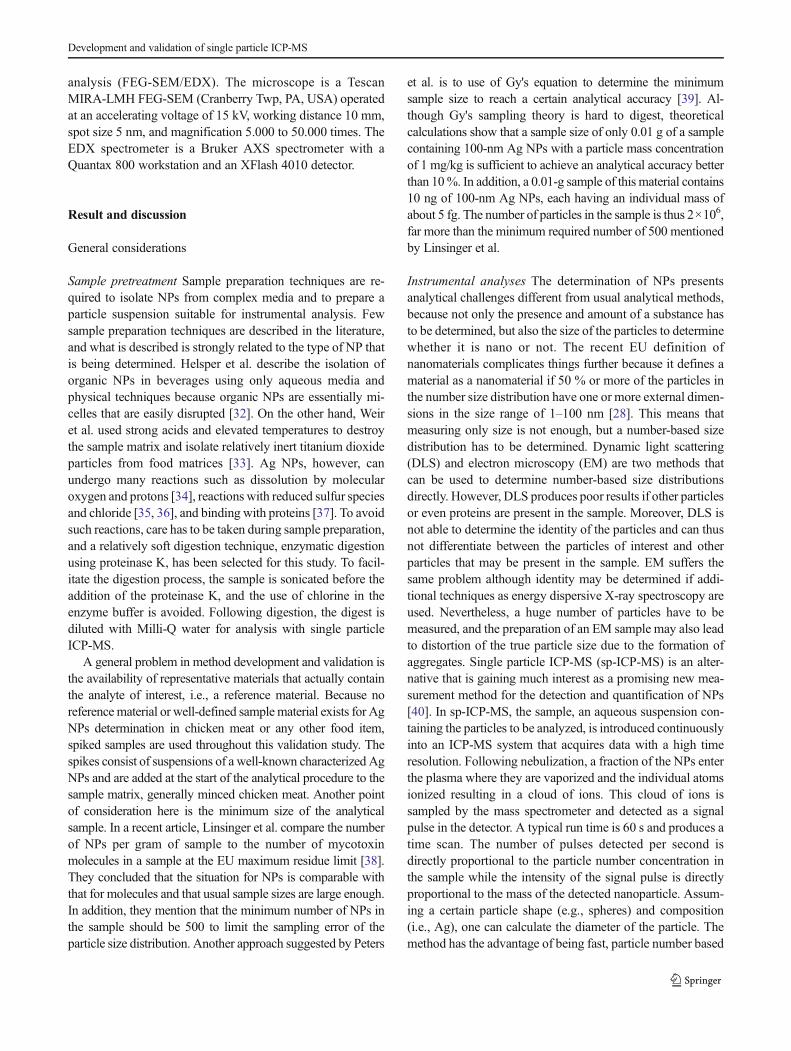
Linearity, CCα/CCβ, and LOD/LOQ The linearity is deter-mined by the analysis of matrix-matched NP standards in therange of 0.05VL–5VL. Although there is some difference inresponse on the three validation days, all three lines shown inFig. 2 are linear and show correlation coefficients >0.99. Thedetermination of the repeatability allows for the calculation ofthe CCα and the CCβ values. CCα, the decision limit, is theconcentration above which it can be decided that a maximumresidue limit (MRL) has been exceeded with 95 % certainty.CCβ, the detection capability, is the concentration at whichMRL concentrations can be detected with 95 % certainty.However, CCα and CCβ are not applicable here since theyare calculated based MRL values (MRL=VL) for analyteswhile for NPs there are no MRLs. Therefore, limits of detec-tion (LOD) and quantification (LOQ) are more appropriate.The LOD and LOQ can be expressed as 3, respectively, tentimes the standard deviation of a meaningful blank, i.e., ablank that gives a clearly discernible signal, deviating from ablank showing only noise. The LOD determined in this way
corresponds roughly with the “detection capability” CCβ inDecision 2002/657/EC and was estimates from the digests ofthe 0.05VL matrix-matched NP standard. The average num-ber of peaks in the time scan at this concentration was 52±5peaks, clearly above the blanks that produced less than tenpeaks in any time scan. With a relative standard deviation of10 %, this means that the LOD is 0.65 mg/kg, and the LOQ is1.0 mg/kg. With this, it should be kept in mind that a constantdilution factor of 105 was used before sp-ICP-MS analyses ofthe digest and that the dynamic range of the method can beincreased by using dilution factors in the range of 104–106.When a dilution factor of 104 was applied, an LOD and LOQof 0.07 and 0.1 mg/kg could be reached.
Robustness, specificity/selectivity The robustness of the meth-od was tested by varying a number of parameters. Theseincluded the sonication time, the time and temperature of theenzymatic digestion, and the dilution factor that was appliedbefore sp-ICP-MS analysis. In all cases, samples spiked at aconcentration of 1.0VL were processed in triplicate on one ofthe validation days. Results were evaluated for particle diam-eter as well as for particle number and mass concentration.Sonication times of 5, 10, and 15 min were tested, all at apower input of 4 W. Based on the reproducibility in Table 2,the different sonication times did not lead to different resultsfor particle size, number of observed particles in the time scan,and the particle mass concentration. The results are presentedin Table 3, and based on these results, a sonication time of5 min was selected for the final method. The robustness of themethod was further tested by changing the digestion timefrom 1 to 3, 7, and 24 h using a digestion temperature of
R² = 0.9959
R² = 0.9932
R² = 0.9916
0
1000
2000
3000
4000
5000
6000
0 10 20 30 40 50 60
Par
ticle
num
ber i
n tim
e sc
an
Matrix matched standard in mg/kg
Day 1
Day 2
Day 3
Fig. 2 Linearity demonstrated by the analyses of matrix-matched stan-dards of 60-nm Ag NPs in the range of 0.05Vl–5VL on each of thevalidation days
Table 3 Robustness testing: effect of sonication time, digestion time andtemperature on particle size, number of particles in the time scan, and theparticle mass concentration
Parameter Average particlediameter (nm)
Number of particlesin time scan
Particle massconcentration(mg/kg)
Sonication time (min)
5 62±1 1,160±70 11.2±0.7
10 60±1 1,200±100 10.1±0.8
15 59±1 1,270±50 10.0±0.4
Digestion time (h)
1 64±1 1,100±60 10.3±0.6
3 65±1 1,040±80 10.0±0.8
7 64±1 1,150±40 10.8±0.3
24 65±1 860±30 9.7±0.3
Digestion temperature (°C)
27 62±1 1,150±90 11.5±0.9
37 61±1 1,090±60 10.9±0.6
47 61±1 900±20 9.0±0.2
Table 2 Validation results for repeatability, reproducibility, and truenessfor a 60-nm Ag NP in chicken meat at three concentration levels
Parameter Concentrationlevel
Trueness(%)
RSDr
(%)RSDRL
(%)
Particle diameter (n=21) 0.5VL 98 0.8 5.2
1.0VL 98 1.2 5.6
2.5VL 99 1.8 5.0
Particle numberconcentration (n=21)
0.5VL 92 14 18
1.0VL 95 9.6 12
2.5VL 91 6.4 7.5
Particle mass concentration(n=21)
0.5VL 101 11 16
1.0VL 98 7.2 9.9
2.5VL 100 6.7 8.9
Repeatability and reproducibility are expressed as relative standarddeviations
Development and validation of single particle ICP-MS
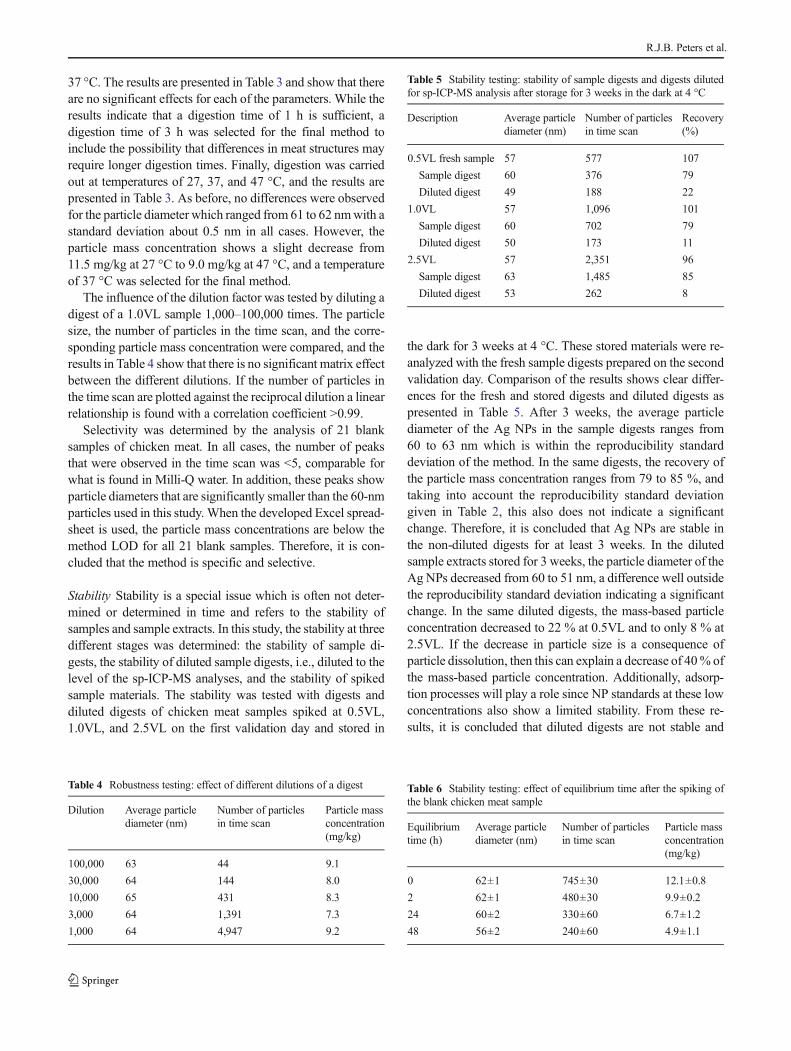
37 °C. The results are presented in Table 3 and show that thereare no significant effects for each of the parameters. While theresults indicate that a digestion time of 1 h is sufficient, adigestion time of 3 h was selected for the final method toinclude the possibility that differences in meat structures mayrequire longer digestion times. Finally, digestion was carriedout at temperatures of 27, 37, and 47 °C, and the results arepresented in Table 3. As before, no differences were observedfor the particle diameter which ranged from 61 to 62 nmwith astandard deviation about 0.5 nm in all cases. However, theparticle mass concentration shows a slight decrease from11.5 mg/kg at 27 °C to 9.0 mg/kg at 47 °C, and a temperatureof 37 °C was selected for the final method.
The influence of the dilution factor was tested by diluting adigest of a 1.0VL sample 1,000–100,000 times. The particlesize, the number of particles in the time scan, and the corre-sponding particle mass concentration were compared, and theresults in Table 4 show that there is no significant matrix effectbetween the different dilutions. If the number of particles inthe time scan are plotted against the reciprocal dilution a linearrelationship is found with a correlation coefficient >0.99.
Selectivity was determined by the analysis of 21 blanksamples of chicken meat. In all cases, the number of peaksthat were observed in the time scan was <5, comparable forwhat is found in Milli-Q water. In addition, these peaks showparticle diameters that are significantly smaller than the 60-nmparticles used in this study. When the developed Excel spread-sheet is used, the particle mass concentrations are below themethod LOD for all 21 blank samples. Therefore, it is con-cluded that the method is specific and selective.
Stability Stability is a special issue which is often not deter-mined or determined in time and refers to the stability ofsamples and sample extracts. In this study, the stability at threedifferent stages was determined: the stability of sample di-gests, the stability of diluted sample digests, i.e., diluted to thelevel of the sp-ICP-MS analyses, and the stability of spikedsample materials. The stability was tested with digests anddiluted digests of chicken meat samples spiked at 0.5VL,1.0VL, and 2.5VL on the first validation day and stored in
the dark for 3 weeks at 4 °C. These stored materials were re-analyzed with the fresh sample digests prepared on the secondvalidation day. Comparison of the results shows clear differ-ences for the fresh and stored digests and diluted digests aspresented in Table 5. After 3 weeks, the average particlediameter of the Ag NPs in the sample digests ranges from60 to 63 nm which is within the reproducibility standarddeviation of the method. In the same digests, the recovery ofthe particle mass concentration ranges from 79 to 85 %, andtaking into account the reproducibility standard deviationgiven in Table 2, this also does not indicate a significantchange. Therefore, it is concluded that Ag NPs are stable inthe non-diluted digests for at least 3 weeks. In the dilutedsample extracts stored for 3 weeks, the particle diameter of theAg NPs decreased from 60 to 51 nm, a difference well outsidethe reproducibility standard deviation indicating a significantchange. In the same diluted digests, the mass-based particleconcentration decreased to 22 % at 0.5VL and to only 8 % at2.5VL. If the decrease in particle size is a consequence ofparticle dissolution, then this can explain a decrease of 40% ofthe mass-based particle concentration. Additionally, adsorp-tion processes will play a role since NP standards at these lowconcentrations also show a limited stability. From these re-sults, it is concluded that diluted digests are not stable and
Table 4 Robustness testing: effect of different dilutions of a digest
Dilution Average particlediameter (nm)
Number of particlesin time scan
Particle massconcentration(mg/kg)
100,000 63 44 9.1
30,000 64 144 8.0
10,000 65 431 8.3
3,000 64 1,391 7.3
1,000 64 4,947 9.2
Table 5 Stability testing: stability of sample digests and digests dilutedfor sp-ICP-MS analysis after storage for 3 weeks in the dark at 4 °C
Description Average particlediameter (nm)
Number of particlesin time scan
Recovery(%)
0.5VL fresh sample 57 577 107
Sample digest 60 376 79
Diluted digest 49 188 22
1.0VL 57 1,096 101
Sample digest 60 702 79
Diluted digest 50 173 11
2.5VL 57 2,351 96
Sample digest 63 1,485 85
Diluted digest 53 262 8
Table 6 Stability testing: effect of equilibrium time after the spiking ofthe blank chicken meat sample
Equilibriumtime (h)
Average particlediameter (nm)
Number of particlesin time scan
Particle massconcentration(mg/kg)
0 62±1 745±30 12.1±0.8
2 62±1 480±30 9.9±0.2
24 60±2 330±60 6.7±1.2
48 56±2 240±60 4.9±1.1
R.J.B. Peters et al.
should be analyzed as quickly as possible, preferably on thesame day they were prepared.
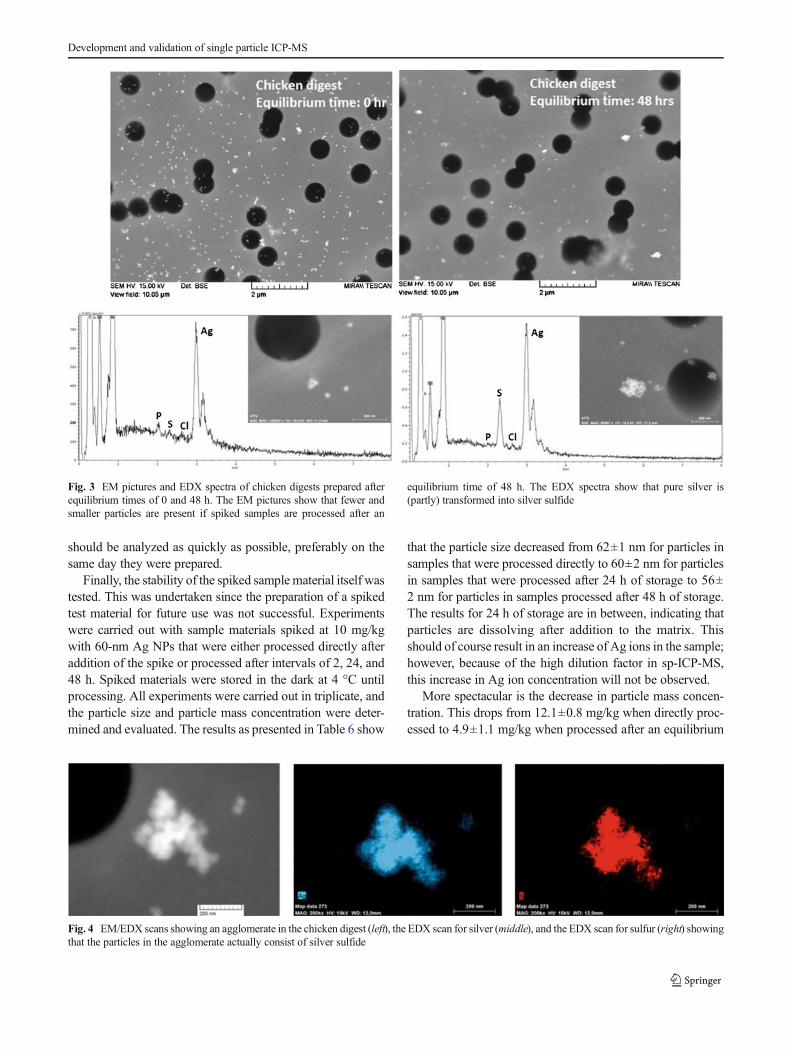
Finally, the stability of the spiked sample material itself wastested. This was undertaken since the preparation of a spikedtest material for future use was not successful. Experimentswere carried out with sample materials spiked at 10 mg/kgwith 60-nm Ag NPs that were either processed directly afteraddition of the spike or processed after intervals of 2, 24, and48 h. Spiked materials were stored in the dark at 4 °C untilprocessing. All experiments were carried out in triplicate, andthe particle size and particle mass concentration were deter-mined and evaluated. The results as presented in Table 6 show
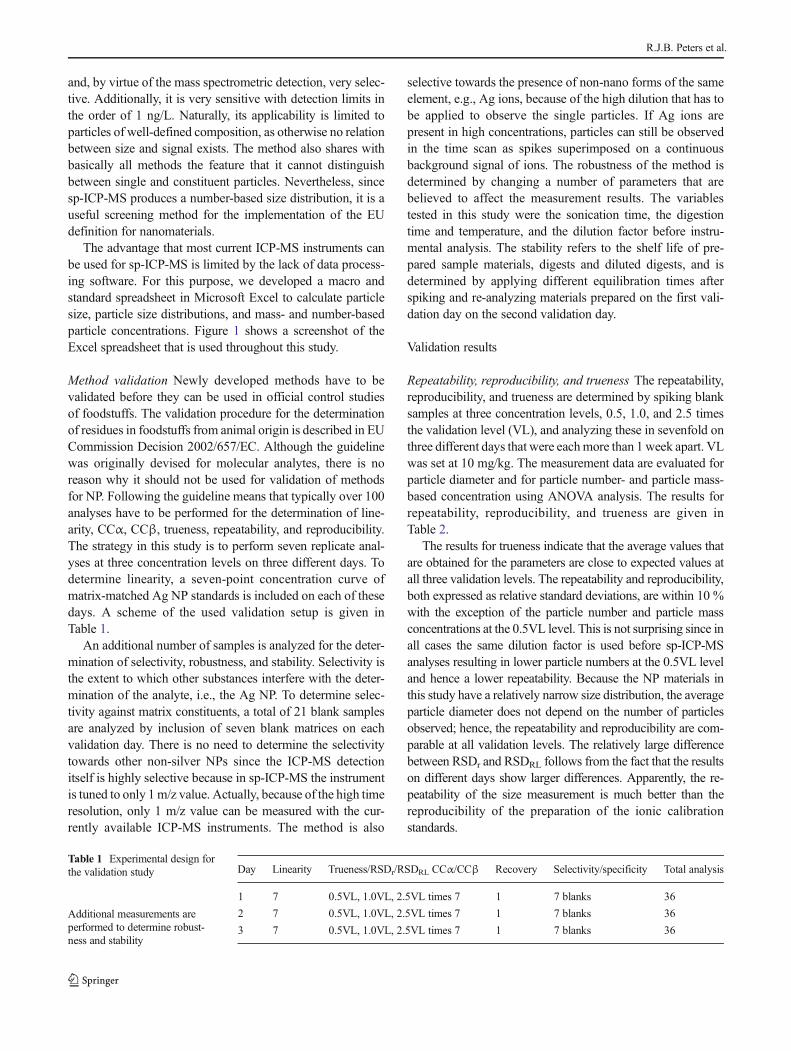
that the particle size decreased from 62±1 nm for particles insamples that were processed directly to 60±2 nm for particlesin samples that were processed after 24 h of storage to 56±2 nm for particles in samples processed after 48 h of storage.The results for 24 h of storage are in between, indicating thatparticles are dissolving after addition to the matrix. Thisshould of course result in an increase of Ag ions in the sample;however, because of the high dilution factor in sp-ICP-MS,this increase in Ag ion concentration will not be observed.
More spectacular is the decrease in particle mass concen-tration. This drops from 12.1±0.8 mg/kg when directly proc-essed to 4.9±1.1 mg/kg when processed after an equilibrium
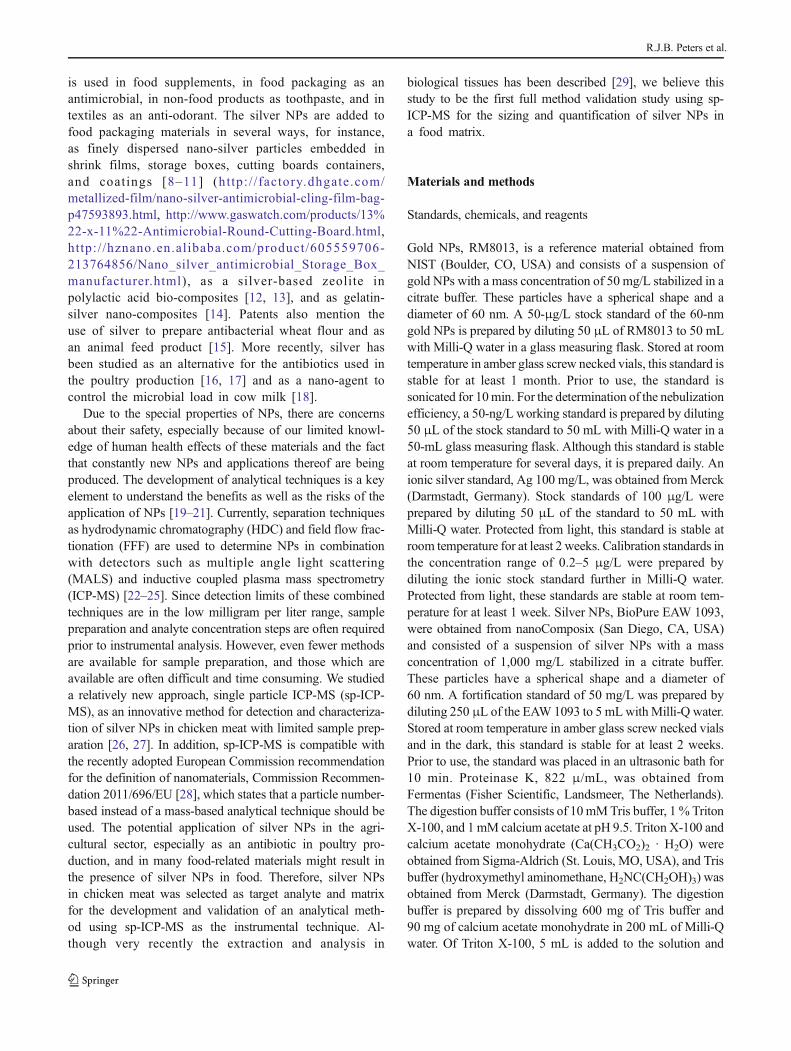
Fig. 3 EM pictures and EDX spectra of chicken digests prepared afterequilibrium times of 0 and 48 h. The EM pictures show that fewer andsmaller particles are present if spiked samples are processed after an
equilibrium time of 48 h. The EDX spectra show that pure silver is(partly) transformed into silver sulfide
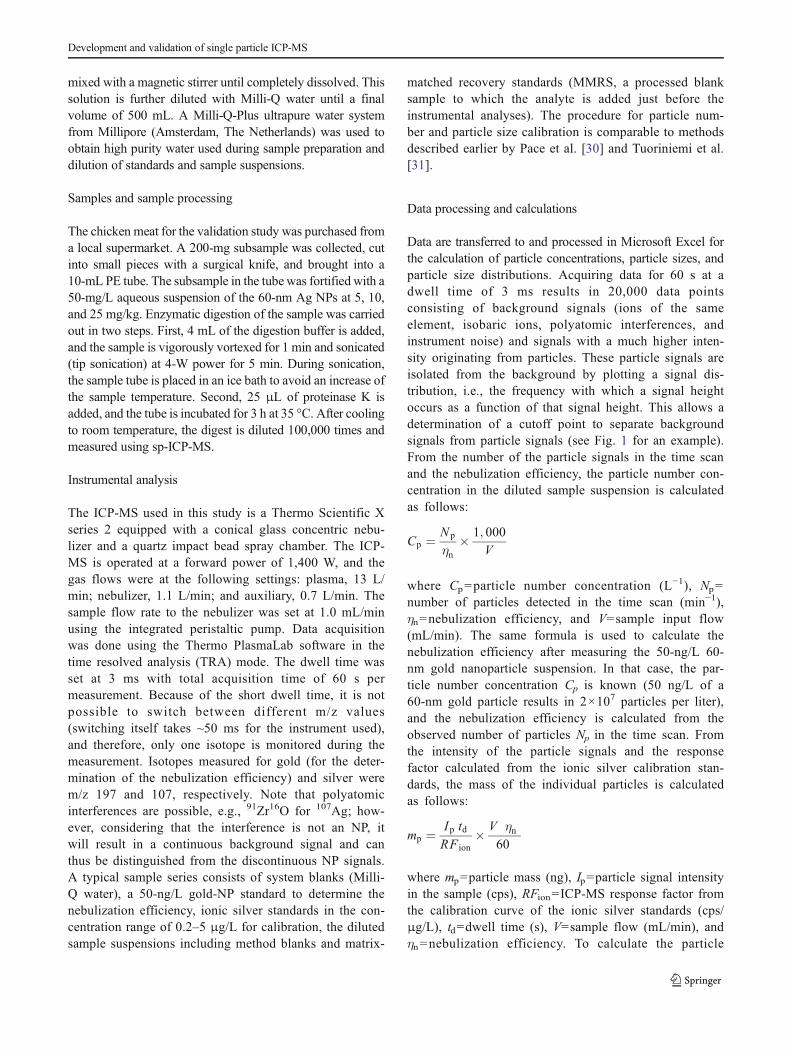
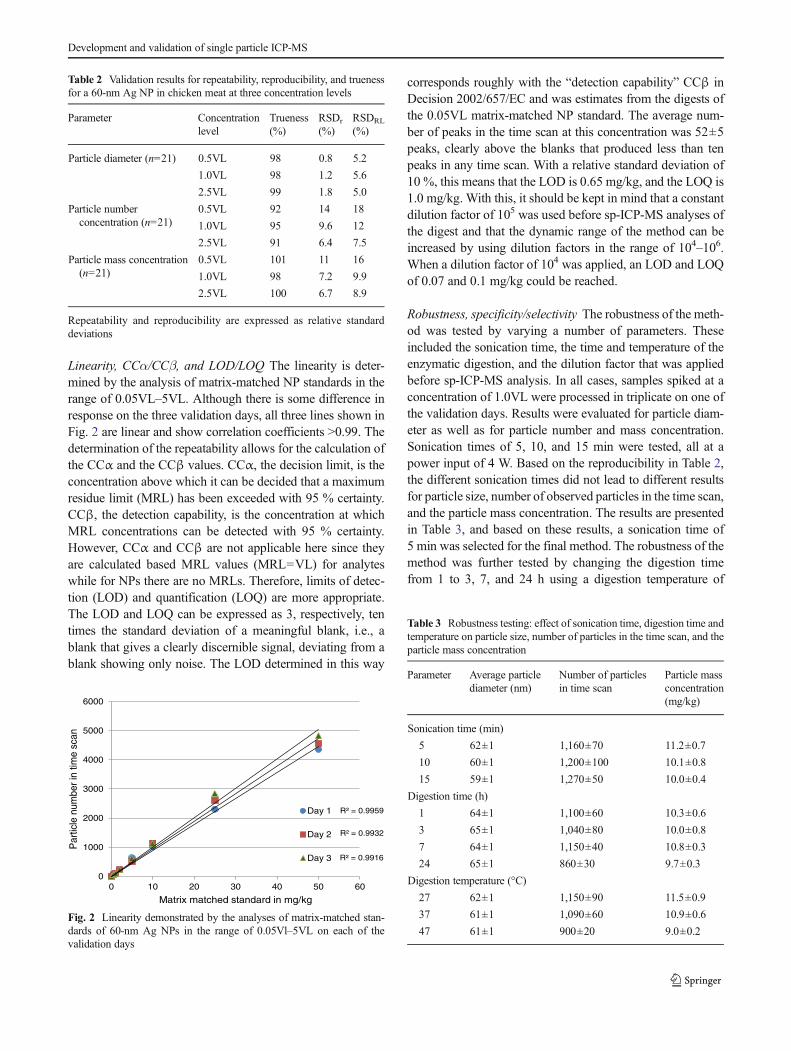
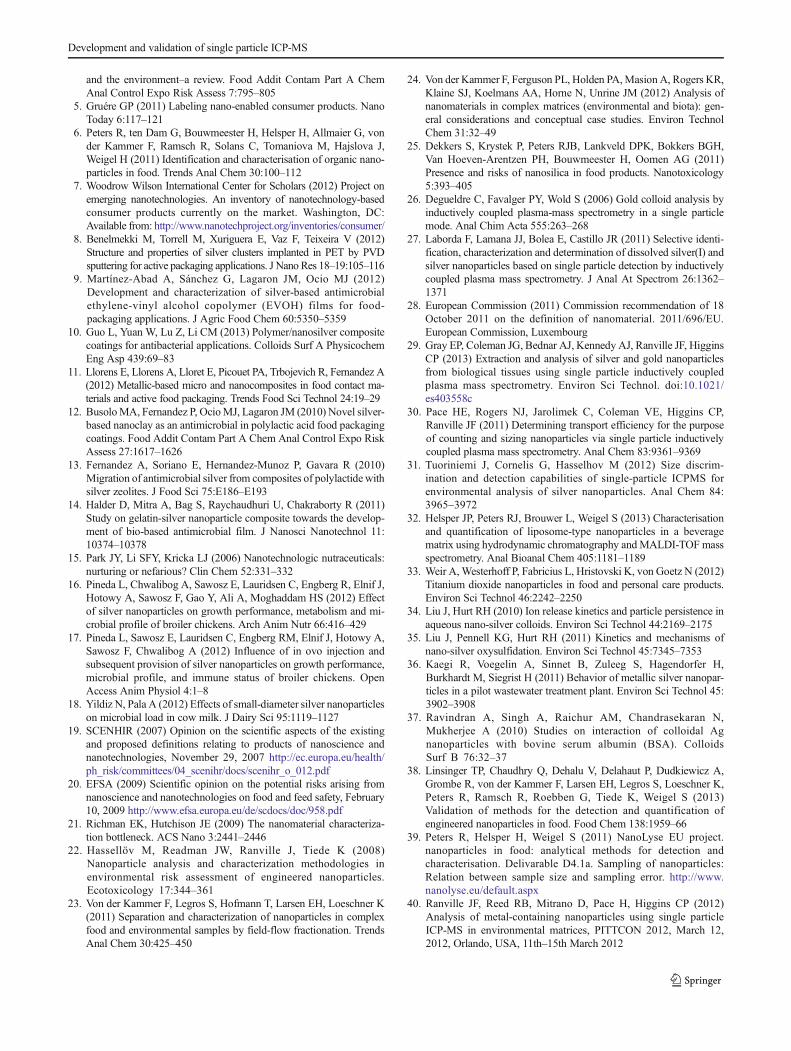
Fig. 4 EM/EDX scans showing an agglomerate in the chicken digest (left), the EDX scan for silver (middle), and the EDX scan for sulfur (right) showingthat the particles in the agglomerate actually consist of silver sulfide
Development and validation of single particle ICP-MS

time of 48 h. This decrease cannot be explained completely bydissolving particles because the change in particle diameterfrom 62 to 56 nm can explain a maximum mass loss of about30%.Another explanation could be the formation of insolublesilver salts like AgCl or Ag2S since chlorine as well as sulfurare expected to be abundantly available in chicken meat.These insoluble materials can possibly agglomerate or depositand will not be detected in the chemical analysis. To determinewhat happens to the particles, digests of samples that wereprocessed directly and after 48 h were studied using scanningelectron microscopy (SEM) with energy dispersive X-rayspectrometry (EDX) to determine size as well as identity ofparticles present in the material. Digests were filtered onnickel-coated polycarbonate filters to isolate the particles,and SEM was used to image the silver particles. Figure 3shows SEM pictures and EDX spectra of particles in bothdigests. From the SEM pictures in Fig. 3, it is clear that thedigest of the sample processed after 48 h contains many lessAg NPs than the digest that was directly processed. Furtheranalysis showed that particles after 48 h were indeed smallerthan the spiked AgNPs, on the average particle size decreasedfrom 60±10 to 50±10 nm. In addition, the EDX spectra ofparticles in Fig. 3 show that some particles have undergone achemical transformation from pure silver in the directly proc-essed sample digests to silver sulfide in the digest of samplesthat were processed after 48 h. It is not clear whether thesesilver sulfide particles are newly formed via dissolved Ag orthese silver particles are in situ transformed into silver sulfideparticles. The observation of agglomerates of silver sulfideparticles, see Fig. 4, and silver particles that are partly trans-formed into silver sulfide suggests the latter.
It is clear that these observations will have consequencesfor the form of nano-silver in real-life samples. If silver NPsmigrate into meat or if animals are exposed to these particlesand uptake takes place, part of this nano-silver may dissolve orbe transformed into silver sulfide. The remaining silver NPs,however, will still be detected by the sp-ICP-MS method.Even if silver sulfide is present in the form of NPs, these willalso be detected by the sp-ICP-MS method. Because the sp-ICP-MS method quantifies only silver, this may result in anunderestimation of the true size of the silver sulfide particleunless it is known that the particles consist of silver sulfide inwhich case size estimation can be correct.
Conclusions
A method is developed and validated for sizing and quantifi-cation of nano-silver in chicken meat using single particleICP-MS. The choices for sample preparation, instrumentalanalysis, and validation have been discussed and led to thedevelopment of a method using an enzymatic digestion of200-mg sample material, subsequent dilution of the digest,
and instrumental analysis of the diluted digest using singleparticle ICP-MS. The method was validated following the EUCommission Decision 2002/657/EC for the validation of res-idues in foodstuffs from animal origin, performing multipleanalysis at three concentration levels on three different days.Additional experiments were carried out to determine robust-ness and stability of the method. The trueness of the methodranged from 98 to 99 % for particle size and from 91 to 101 %for concentration at levels from 5 to 25 mg/kg of 60-nm nano-silver particles in chicken meat. The repeatability ranged from0.8 to 1.8 % for particle size and 6.7 to 11 % for particle massconcentration. The within-lab reproducibility ranged from 5.0to 5.6 % for particle size and 8.9 to 16 % for particle massconcentration. The linearity was determined using matrix-matched nanoparticle standards, and the method was found tobe linear in the range of 0.5–50 mg/kg of 60-nm nano-silverparticles in chicken meat. The LOD of the method can be aslow as 0.05 mg/kg. The method is selective, and analysis ofblank samples showed that generally <5 particles are identifiedin blank chicken meat samples. The robustness was testedchanging sonication and digestion time, digestion temperature,and dilution factor. The method was robust for these changeswith the exception of the digestion temperature for which thehighest temperature leads to a lower recovery. Stability experi-ments showed that sample digests are stable for 3 weeks ifstored at 4 °C but that diluted digests are not stable. Finally, itwas shown that the 60-nm nano-silver particles spiked to chick-en meat are not stable. The particle size as well as the particlemass concentration decreased within 24 h after spiking of thesample material. A study using electron microscopy showedthat silver particles dissolved and were chemically transformedinto silver sulfide. While this clearly has implications for theform in which nano-silver will be present in real-life meatsamples, the developed method will be able to determine thepresence and quantity of nanoparticle silver in such samples.
Acknowledgments This research was commissioned and financed byThe Netherlands Food and Consumer Product Safety Authority (NVWA)and The Netherlands Ministry of Economic Affairs (EZ) through itspolicy support programme (BO).
References
1. Chen H,Weiss J, Shahidi F (2006) Nanotechnology in nutraceuticalsand functional foods. Food Technol 3:30–39
2. Weiss J, Takhistov P, McClements DJ (2006) Functional materials infood nanotechnology. J Food Sci 71:R107–R116
3. Klaine SJ, Alvarez PJJ, Batley GE, Fernandes TF, Handy RD, LyonDY, Mahendra S, McLaughlin MJ, Lead JR (2008) Nanomaterials inthe environment: behaviour, fate, bioavailability and effects. EnvironToxicol Chem 27:1825–1851
4. Tiede K, Boxall AB, Tear SP, Lewis J, David H, HasselhovM (2009)Detection and characterization of engineered nanoparticles in food
R.J.B. Peters et al.
and the environment–a review. Food Addit Contam Part A ChemAnal Control Expo Risk Assess 7:795–805
5. Gruére GP (2011) Labeling nano-enabled consumer products. NanoToday 6:117–121
6. Peters R, ten Dam G, Bouwmeester H, Helsper H, Allmaier G, vonder Kammer F, Ramsch R, Solans C, Tomaniova M, Hajslova J,Weigel H (2011) Identification and characterisation of organic nano-particles in food. Trends Anal Chem 30:100–112
7. Woodrow Wilson International Center for Scholars (2012) Project onemerging nanotechnologies. An inventory of nanotechnology-basedconsumer products currently on the market. Washington, DC:Available from: http://www.nanotechproject.org/inventories/consumer/
8. Benelmekki M, Torrell M, Xuriguera E, Vaz F, Teixeira V (2012)Structure and properties of silver clusters implanted in PET by PVDsputtering for active packaging applications. J Nano Res 18–19:105–116
9. Martínez-Abad A, Sánchez G, Lagaron JM, Ocio MJ (2012)Development and characterization of silver-based antimicrobialethylene-vinyl alcohol copolymer (EVOH) films for food-packaging applications. J Agric Food Chem 60:5350–5359
10. Guo L, Yuan W, Lu Z, Li CM (2013) Polymer/nanosilver compositecoatings for antibacterial applications. Colloids Surf A PhysicochemEng Asp 439:69–83
11. Llorens E, Llorens A, Lloret E, Picouet PA, Trbojevich R, Fernandez A(2012) Metallic-based micro and nanocomposites in food contact ma-terials and active food packaging. Trends Food Sci Technol 24:19–29
12. BusoloMA, Fernandez P, OcioMJ, Lagaron JM (2010) Novel silver-based nanoclay as an antimicrobial in polylactic acid food packagingcoatings. Food Addit Contam Part A Chem Anal Control Expo RiskAssess 27:1617–1626
13. Fernandez A, Soriano E, Hernandez-Munoz P, Gavara R (2010)Migration of antimicrobial silver from composites of polylactide withsilver zeolites. J Food Sci 75:E186–E193
14. Halder D, Mitra A, Bag S, Raychaudhuri U, Chakraborty R (2011)Study on gelatin-silver nanoparticle composite towards the develop-ment of bio-based antimicrobial film. J Nanosci Nanotechnol 11:10374–10378
15. Park JY, Li SFY, Kricka LJ (2006) Nanotechnologic nutraceuticals:nurturing or nefarious? Clin Chem 52:331–332
16. Pineda L, Chwalibog A, Sawosz E, Lauridsen C, Engberg R, Elnif J,Hotowy A, Sawosz F, Gao Y, Ali A, Moghaddam HS (2012) Effectof silver nanoparticles on growth performance, metabolism and mi-crobial profile of broiler chickens. Arch Anim Nutr 66:416–429
17. Pineda L, Sawosz E, Lauridsen C, Engberg RM, Elnif J, Hotowy A,Sawosz F, Chwalibog A (2012) Influence of in ovo injection andsubsequent provision of silver nanoparticles on growth performance,microbial profile, and immune status of broiler chickens. OpenAccess Anim Physiol 4:1–8
18. Yildiz N, Pala A (2012) Effects of small-diameter silver nanoparticleson microbial load in cow milk. J Dairy Sci 95:1119–1127
19. SCENHIR (2007) Opinion on the scientific aspects of the existingand proposed definitions relating to products of nanoscience andnanotechnologies, November 29, 2007 http://ec.europa.eu/health/ph_risk/committees/04_scenihr/docs/scenihr_o_012.pdf
20. EFSA (2009) Scientific opinion on the potential risks arising fromnanoscience and nanotechnologies on food and feed safety, February10, 2009 http://www.efsa.europa.eu/de/scdocs/doc/958.pdf
21. Richman EK, Hutchison JE (2009) The nanomaterial characteriza-tion bottleneck. ACS Nano 3:2441–2446
22. Hassellöv M, Readman JW, Ranville J, Tiede K (2008)Nanoparticle analysis and characterization methodologies inenvironmental risk assessment of engineered nanoparticles.Ecotoxicology 17:344–361
23. Von der Kammer F, Legros S, Hofmann T, Larsen EH, Loeschner K(2011) Separation and characterization of nanoparticles in complexfood and environmental samples by field-flow fractionation. TrendsAnal Chem 30:425–450
24. Von der Kammer F, Ferguson PL, Holden PA,Masion A, Rogers KR,Klaine SJ, Koelmans AA, Horne N, Unrine JM (2012) Analysis ofnanomaterials in complex matrices (environmental and biota): gen-eral considerations and conceptual case studies. Environ TechnolChem 31:32–49
25. Dekkers S, Krystek P, Peters RJB, Lankveld DPK, Bokkers BGH,Van Hoeven-Arentzen PH, Bouwmeester H, Oomen AG (2011)Presence and risks of nanosilica in food products. Nanotoxicology5:393–405
26. Degueldre C, Favalger PY, Wold S (2006) Gold colloid analysis byinductively coupled plasma-mass spectrometry in a single particlemode. Anal Chim Acta 555:263–268
27. Laborda F, Lamana JJ, Bolea E, Castillo JR (2011) Selective identi-fication, characterization and determination of dissolved silver(I) andsilver nanoparticles based on single particle detection by inductivelycoupled plasma mass spectrometry. J Anal At Spectrom 26:1362–1371
28. European Commission (2011) Commission recommendation of 18October 2011 on the definition of nanomaterial. 2011/696/EU.European Commission, Luxembourg
29. Gray EP, Coleman JG, Bednar AJ, Kennedy AJ, Ranville JF, HigginsCP (2013) Extraction and analysis of silver and gold nanoparticlesfrom biological tissues using single particle inductively coupledplasma mass spectrometry. Environ Sci Technol. doi:10.1021/es403558c
30. Pace HE, Rogers NJ, Jarolimek C, Coleman VE, Higgins CP,Ranville JF (2011) Determining transport efficiency for the purposeof counting and sizing nanoparticles via single particle inductivelycoupled plasma mass spectrometry. Anal Chem 83:9361–9369
31. Tuoriniemi J, Cornelis G, Hasselhov M (2012) Size discrim-ination and detection capabilities of single-particle ICPMS forenvironmental analysis of silver nanoparticles. Anal Chem 84:3965–3972
32. Helsper JP, Peters RJ, Brouwer L, Weigel S (2013) Characterisationand quantification of liposome-type nanoparticles in a beveragematrix using hydrodynamic chromatography andMALDI-TOFmassspectrometry. Anal Bioanal Chem 405:1181–1189
33. Weir A,Westerhoff P, Fabricius L, Hristovski K, von Goetz N (2012)Titanium dioxide nanoparticles in food and personal care products.Environ Sci Technol 46:2242–2250
34. Liu J, Hurt RH (2010) Ion release kinetics and particle persistence inaqueous nano-silver colloids. Environ Sci Technol 44:2169–2175
35. Liu J, Pennell KG, Hurt RH (2011) Kinetics and mechanisms ofnano-silver oxysulfidation. Environ Sci Technol 45:7345–7353
36. Kaegi R, Voegelin A, Sinnet B, Zuleeg S, Hagendorfer H,Burkhardt M, Siegrist H (2011) Behavior of metallic silver nanopar-ticles in a pilot wastewater treatment plant. Environ Sci Technol 45:3902–3908
37. Ravindran A, Singh A, Raichur AM, Chandrasekaran N,Mukherjee A (2010) Studies on interaction of colloidal Agnanoparticles with bovine serum albumin (BSA). ColloidsSurf B 76:32–37
38. Linsinger TP, Chaudhry Q, Dehalu V, Delahaut P, Dudkiewicz A,Grombe R, von der Kammer F, Larsen EH, Legros S, Loeschner K,Peters R, Ramsch R, Roebben G, Tiede K, Weigel S (2013)Validation of methods for the detection and quantification ofengineered nanoparticles in food. Food Chem 138:1959–66
39. Peters R, Helsper H, Weigel S (2011) NanoLyse EU project.nanoparticles in food: analytical methods for detection andcharacterisation. Delivarable D4.1a. Sampling of nanoparticles:Relation between sample size and sampling error. http://www.nanolyse.eu/default.aspx
40. Ranville JF, Reed RB, Mitrano D, Pace H, Higgins CP (2012)Analysis of metal-containing nanoparticles using single particleICP-MS in environmental matrices, PITTCON 2012, March 12,2012, Orlando, USA, 11th–15th March 2012
Development and validation of single particle ICP-MS